 Ivan Duvnjak
 Domagoj Damjanović
 Marko Bartolac
 Marina Frančić Smrkić
 Ana Skender
- Structural Testing Laboratory, Department of Engineering Mechanics, Faculty of Civil Engineering, University of Zagreb, Zagreb, Croatia
This study presents a complex experimental research of a damaged steel railway bridge. Before the reconstruction, the elastic behavior of the material was evaluated using the hole-drilling strain gauge method of determining residual stresses at the relevant cross-sections. During the reconstruction project (lifting of the structure), a short-term monitoring system was installed at the critical cross-sections for continuous recording of strain. The aim was to evaluate the quality of the reconstruction intervention and prevent further damages. Following a successful reconstruction, a diagnostic load testing was performed according to Croatian standards. The purpose of the load testing (static and dynamic) was to evaluate the ability of the bridge to carry the design loads and calibrate the finite element models. During static load testing vertical displacement was measured as well as strain. Dynamic load testing of the bridge was performed in order to determine the main dynamic parameters of the structure and to calculate the dynamic factor. In order to select the appropriate measurement parameters and methods used during this experimental research it was necessary to consider the bridge type, materials and reconstruction or strengthening interventions. Especially, since this bridge was an example of insufficient inspection and maintenance during service. A well-designed monitoring and diagnostic load testing needed to be performed in order to obtain useful results for the decision makers involved.
Introduction
The main purpose of load testing of bridges is to evaluate the performance of existing bridges. This category includes new bridges which are still not open for public, bridges that are already in service and bridges after reconstruction or strengthening. There are two main types of load testing of bridges used in practice, proof and diagnostic load testing. Proof load testing is very useful for the evaluation of bridges when information related to the capacity of the bridge is insufficient. For example, when plans or the results of a structural analysis are not available or when it is difficult to estimate the level of deterioration and material degradation in old bridges (Lantsoght et al., 2017b). The main objective is to check if the bridge can carry a certain load level without damage and fulfill the requirements of the code. The load levels used for the proof load testing are higher than the levels of diagnostic load testing (Lantsoght et al., 2017a). The determination of the target proof load includes multiplying nominal values of the traffic load with proof load factors. Significant efforts are made toward standardization of this type of load testing (Lantsoght et al., 2018).
Diagnostic load testing, on the other hand, is used to verify the assumptions made in analytical models related to the stiffness of the bridge. These models are usually simple linear elastic, three-dimensional finite element (FE) models (Lantsoght et al., 2017a). The differences between calculated and measured values are often due to an inaccurate representation of the geometry, boundary conditions and materials in FE models (Bagge et al., 2018). This type of load testing can also be used to evaluate if the bridge structure is in the elastic range, especially after a reconstruction or strengthening (Olaszek et al., 2014). Diagnostic load testing is usually performed prior to opening to the public as well as after a reconstruction or strengthening of the bridge. It is still a common practice in Croatia and has been so for decades. Existing bridges are tested according to the requirements of the Croatian standard HRN U.M1.046:1984 which is referred to in the Technical regulation for building structures (Official Gazette 17/17). The standard requires static load testing of all road bridges with the length L ≥ 15 m and for all railway bridges with the length L ≥ 10 m. The standard also requires dynamic load testing for all bridges. Prior to the actual load testing of the bridge it is necessary to draw up a load testing program which defines the methodology of testing. For that purpose, it is necessary to assess the project documentation and consider the bridge type, materials and reconstruction or strengthening interventions.
In order to meet future demands on the European railway network, i.e., increased loads and higher speeds it is important to collect information and upgrade the existing railway bridges. Developing new monitoring systems and field testing methods of railway bridges is of great importance (Olofsson et al., 2005). In recent years, several steel railway bridges underwent diagnostic load testing after strengthening in Croatia (Damjanović et al., 2016a,b; Marendić et al., 2017).
This paper presents useful methods of assessing the condition of a damaged steel railway bridge before, during and after reconstruction. In order to evaluate the elastic behavior of the material, a method of determining residual stresses by the hole-drilling strain gauge method was implemented (ASTM E837, 2013). Further, a short-term monitoring system was installed at critical cross-sections during the reconstruction of the bridge in order to measure strain. After the reconstruction of the bridge, a diagnostic load testing was performed together with the static and dynamic numerical analysis.
The article is structured as follows. The description of the railway bridge is given in Section Description of the Railway Bridge. The outline of the method of determining the residual stresses is given in Section Method of Determining the Residual Stresses with the results in Section Strain Measurement Results and the Calculation of Stresses. Measurement parameters and the assessment criteria for the diagnostic load testing according to the relevant standard are given in Section Measurement Parameters and Assessment Criteria According to the Standard. The measurement setup and the results are presented in Section Static Load Testing and Results for the static load testing and in Section Dynamic Measurements and Results for the dynamic load testing. Section Conclusions presents the conclusions.
Description of the Railway Bridge
The double track railway bridge (Sesvete—Velika Gorica) over the river Sava in Zagreb was built in 1968. The length of the three spans over the river is L = 34.6 m + 65.9 m + 34.6 m = 135.1 m. The riveted steel superstructure of the bridge consists of two main I-section continuous girders spaced 9.1 m apart. The girder web depth is 3.8 m while the width and the thickness of the flanges are 690 and 80 mm, respectively. The cross girders are perpendicular to the axis, spaced 3.95 m apart with the web depth of 1.4 m. There are four 0.62 m high secondary longitudinal girders. The grade of steel is S235. The substructure of the bridge consists of reinforced concrete piers supported by reinforced concrete piles.
In March 2009, one of the piers lost its stability due to scour development during years of exploitation causing a permanent deformation of the bridge and the railway tracks (Figure 1A). At the distance of 8 m from the upstream bearing (S6) and 11 m from the downstream bearing (S6), a plasticity zone was developed in the middle span (Figure 1B). The upstream main girder deflected 1.6 m and the downstream main girder deflected 0.95 m. Furthermore, under the weight of the structure and the development of a new static system (continuous girder with a plastic hinge), one of the two main girders at the side span was lifted and no longer supported by the pier S4 (Duvnjak et al., 2018). This further increased the bending moment on the support S5 (Figure 1D). In addition to the vertical movement, the bridge suffered a horizontal shift and serious damage of the bottom secondary members. Following a detailed analysis and a provisional strengthening of the damaged pier, the reconstruction project of the bridge was developed. The reconstruction project was based on the fact that the plasticity zone was developed near the location where the initial bending moment was close to zero (Mujkanović et al., 2012) (Figure 1C). The stages of the reconstruction included the elevation of the bridge superstructure over the provisional piers to the original grade level, reconstruction of the hinge and finally, releasing the superstructure on permanent bearings. Numerical analysis was performed for all stages of the reconstruction and the results can be found in Mujkanović et al. (2012). During the lifting of the superstructure, an experimental research was performed based on strains and stresses at critical cross-sections.
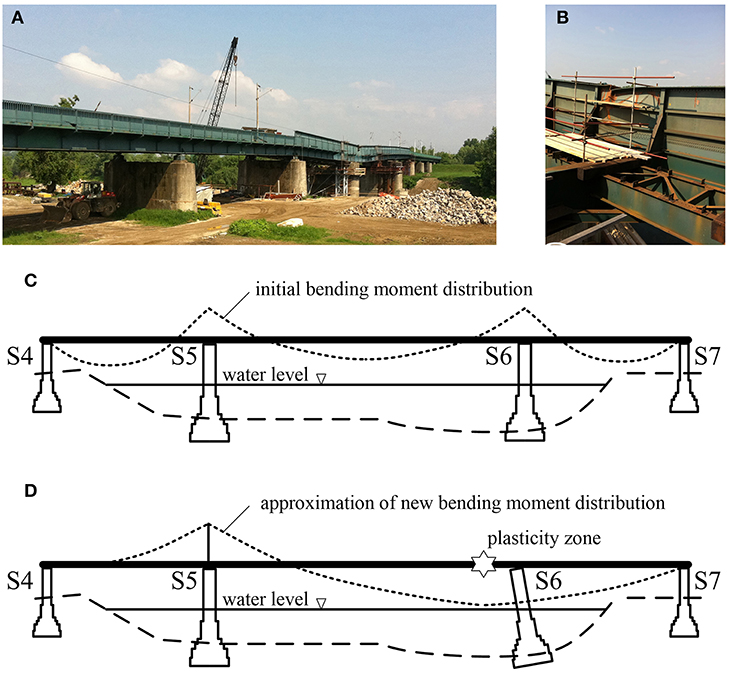
Figure 1. (A) Damaged steel railway bridge; (B) plastic hinge on the upstream girder; (C) bending moment before damage; (D) approximation of bending moment after damage.
Monitoring of The Railway Bridge During Reconstruction
Method of Determining the Residual Stresses
The hole-drilling method is used to measure the magnitudes and distributions of principal residual stresses. This method involves attaching strain gauge rosettes to the surface, drilling a hole at the center of the gauges, and measuring residual strains caused by the relaxation of the material surrounding the drill-hole. Figure 2 shows the stress state near the drilling hole. The hole radius is 2a, and the stresses are σx and σy, while σ1 and σ2 are the radial and tangential stress caused by the hole drilling. The value α represents an angle between the stress σx and the radial stress σ1. The stresses are determined according to the following equations (Hoffman, 1989):
where E is the modulus of elasticity of steel (E = 2.1·105 MPa) and Δεa, Δεb, and Δεc are measured residual strains in three different directions related to the initial values of the strain before the drilling.
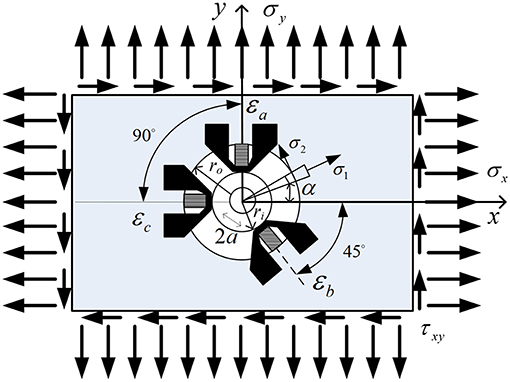
Figure 2. Stress state near the drilling hole (Duvnjak et al., 2012).
The constants A and B are as given
where ν is the Poisson's ratio (ν = 0.3), ro is the outer and ri is the internal radius of the measurement grid.
The angle α is determined according to the following equation (Ajovalasit et al., 2010):
Strain Measurement Results and the Calculation of Stresses
The measurement of residual strains was performed using the hole-drilling method in order to calculate the residual stresses and evaluate the elastic behavior of the material in two cross-sections. The critical (relevant) cross-sections were selected at the location of extreme values of the bending moment after damage (Figure 1D), i.e., at the location of the fixed bearing at pier S5 and adjacent to the plasticity zone and pier S6 (Figures 3A,B). The measurement was performed in order to exclude plastic deformation in relevant cross-sections. Residual strains were measured at the flanges of the upstream main I-section girder (R1 and R2) considering the more significant plastic deformation of that girder. Residual strain measurements recorded during the drilling of the hole and calculated stresses according to Equation (1) are presented in Figure 4A. Under the assumption that the neutral axis will occur at the mid-depth of the girder, the estimated stress distribution in the critical cross-section 1-1 derived from the measured values of residual strain is shown in Figure 4B.
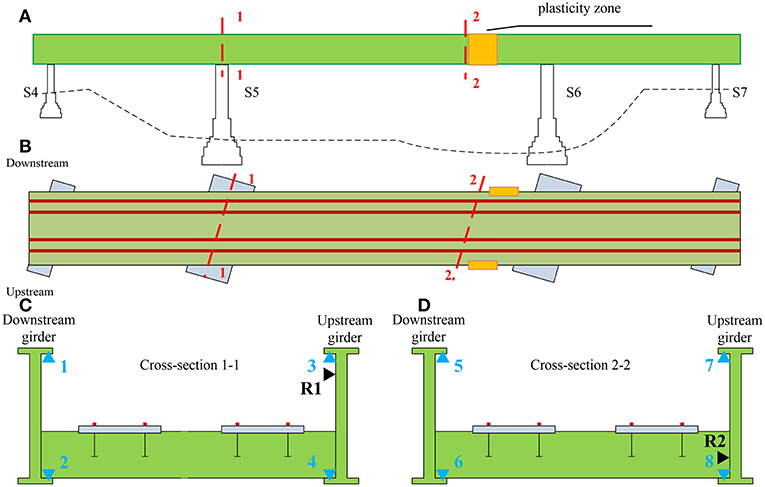
Figure 3. Strain measuring points: (A) longitudinal section of the bridge over the river; (B) plan view of the bridge; (C) cross-section 1-1; (D) cross-section 2-2.
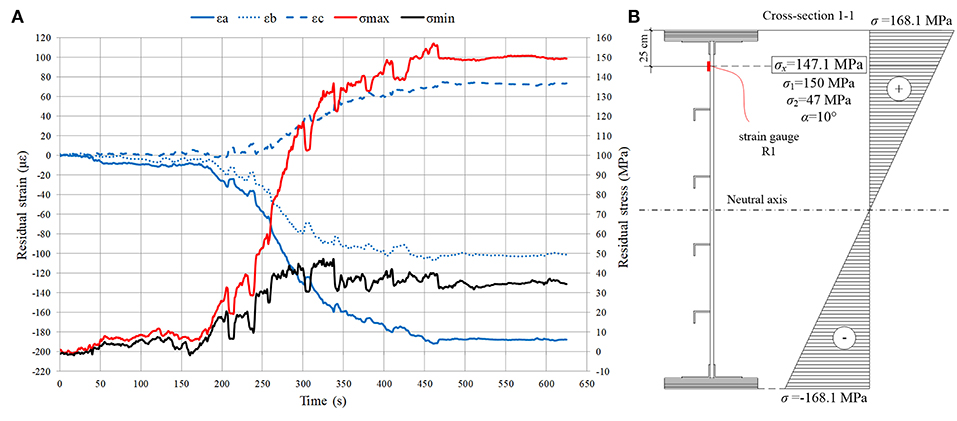
Figure 4. Cross-section 1-1: (A) Measured residual strains and calculated stresses; (B) Estimated residual stress distribution.
During the reconstruction, the main girders were gradually lifted with hydraulic jacks over a period of 3 days in steps of 5–10 cm. During that time, strain was measured. The measurement setup (4 measuring points on each girder) for the relevant cross-sections is shown in Figure 3C (cross-section 1-1) and Figure 3D (cross-section 2-2). Every lift of a main girder caused a “jump” in values of strains and consequently calculated stresses (Figure 5). The maximum stresses at all measuring points were below the yield strength of steel.

Figure 5. Calculated stresses at all measuring points (reconstruction).
Diagnostic Load Testing of The Railway Bridge after Reconstruction
Following a successful reconstruction of the pier S6 and the bridge superstructure, a diagnostic load testing was performed according to the requirements of the Croatian standard HRN U.M1.046. The standard requires static and dynamic load testing of the bridge in order to calibrate FE models and evaluate the ability of the bridge to carry the design loads without damage. One of the main objectives of this type of load testing is to correctly estimate the traffic load distribution in order to achieve service conditions. Before the actual load testing of the bridge it was necessary to draw up a load testing program which defines the methodology of testing with detailed description of the loading phases and measurement parameters as well as the corresponding measuring points (Rak et al., 2011).
An essential part of the load testing program are the results of the numerical analysis performed with the FE software package SOFiSTiK. The superstructure of the bridge was modeled using beam elements with linear elastic behavior. All connections between the main and cross members were modeled as rigid. The boundary conditions (supports) were modeled as pinned for pier S6 and as a roller in the longitudinal direction of the bridge for the piers S4, S6, and S7. The initial FE model of the bridge was modeled to select the required load of the test locomotive and positions of the locomotives in order to produce the maximum effect on the bridge (displacements and internal forces). The Load Model LM 71 was selected as relevant for normal rail traffic on mainline railways. The selected model comprises of a uniformly distributed load and concentrated load as defined in design codes (HRN EN 1991-2, 2012). The results of the static numerical analysis are shown as internal forces and displacements under test loads Vstat and the design traffic loads Vn. These results are used to evaluate the load testing efficiency U given by the following equation (HRN U.M1.046, 1984)
where φ is the design dynamic factor (φ = 1.0). In this study, the value of the load testing efficiency was in the range 0.5 ≤ U ≤ 1.0 which is considered as acceptable. The results of the dynamic numerical analysis are the main dynamic parameters, i.e., natural frequencies and mode shapes.
The numerical model of a bridge is usually calibrated by changing the material and geometrical properties of the bridge (area, inertia, modulus of elasticity, etc.). The acceptable criterion is to reach the difference between measured (site) deflections and analytical values within ±10% for steel bridges. After site tests, the model is slightly updated by changing an initial modulus of elasticity (from E = 200 GPa to E = 210 GPa). Afterwards, the diagnostic assessment was carried out by using the updated model.
Measurement Parameters and Assessment Criteria According to the Standard
According to the Croatian standard HRN U.M1.046., the following measurements are performed during the static load testing of railway bridges:
- measurement of the vertical displacement in the middle of each span,
- measurement of the displacement of the supports,
- strain measurement at critical cross-sections,
- measurement of residual displacements and strains after unloading.
The requirement for the measured values of displacements is that they are less or equal to theoretical/numerical values. Measured residual displacements should be <15% of the maximum measured value at the same measuring point for railway bridges.
The following measurements are performed during the dynamic load testing of railway bridges:
- Measurement of the vertical displacement in the middle of selected spans during the crossing of vehicles
- Measurement of dynamic parameters of the structure.
The dynamic behavior of the bridge is considered acceptable if the measured natural frequencies are in accordance with the theoretical/numerical values and if the dynamic factor is in accordance with the design value.
Static Load Testing and Results
Static load testing of the bridge was performed by using 6 electric locomotives in 10 loading and 6 unloading phases. The average mass of the locomotives was 80 t (±1.6 t). The locomotives were positioned symmetrically and asymmetrically in different spans in order to obtain maximum internal forces and displacements of the main carrying structural elements (Figure 6). During the static load testing, vertical displacements of the bridge were measured using a method of geometric and trigonometric leveling. Overall, there were 13 measuring points in the middle and at the quarter of each span as well as above the supports along two parallel lines coinciding with the main girders (Figure 7A). The maximum measured vertical displacements in the middle of the span during different loading phases are compared to the results of the numerical analysis with actual test loads in Table 1. The residual displacements measured during the unloading phases are also shown in Table 1. Calculated bending moments and displacements obtained from the loading phase 11, i.e., maximum test load in the central span are shown in Figure 8.
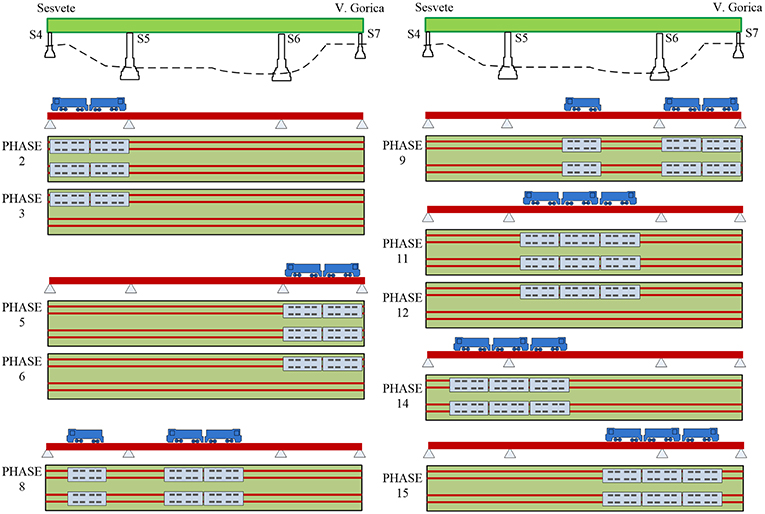
Figure 6. Static load testing phases.
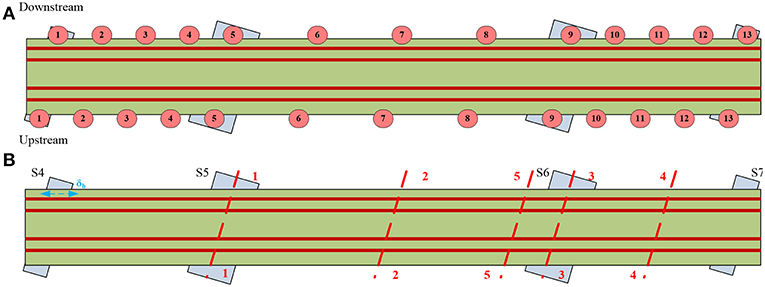
Figure 7. Measuring points: (A) vertical displacement; (B) strain.
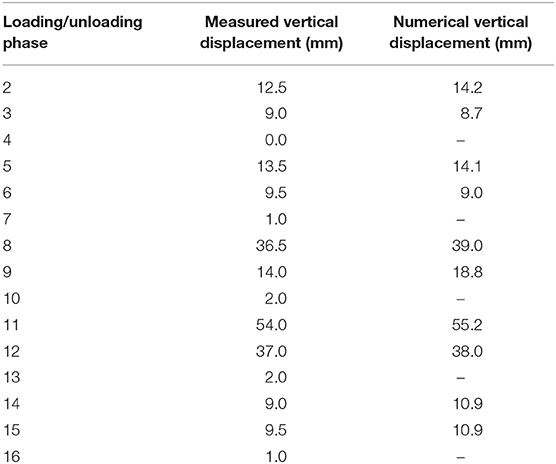
Table 1. The comparison between maximum measured and numerical vertical displacement.
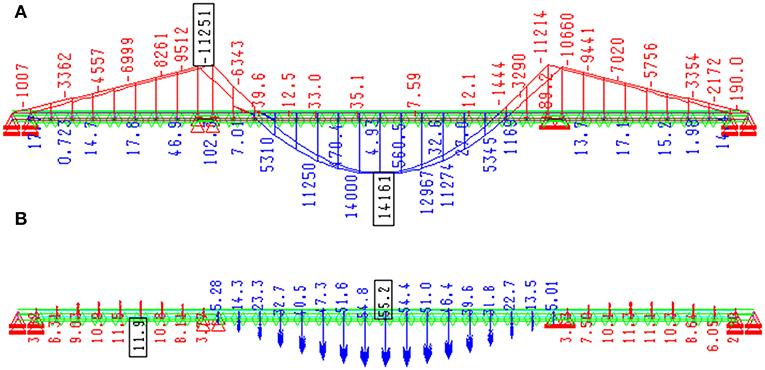
Figure 8. Calculated values—phase 11; (A) bending moment; (B) vertical displacement.
Strains were measured with a total of 22 LVDT sensors in five cross-sections and the longitudinal displacement of the main girder was measured with an additional LVDT sensor on pier S4 (Figure 7B). The gauge length of the LVDT sensors was 200 mm and a data acquisition system (HBM MGCplus) was used to continually record the data. Four LVDT sensors were located at the flanges of the main girders in the middle of the spans (cross-sections 2-2 and 4-4) and above the piers S5 and S6 (cross-sections 1-1 and 3-3). There were two LVDT sensors on the secondary longitudinal girder near pier S6 and on the cross girder in the middle of the span S5-S6. Strains were also measured on the main girders with the replaced web plates (damaged area) in cross-section 5-5. Strain measurements in the middle of the central span (cross-section 2-2) are shown in Figure 9. During the loading phase 11, at the measuring points 6 and 8 the values of measured strains were 211 με and 228 με, respectively. Calculated stresses at the same measuring points were 44.35 MPa and 47.94 MPa and in accordance with the numerical value of 47 MPa.
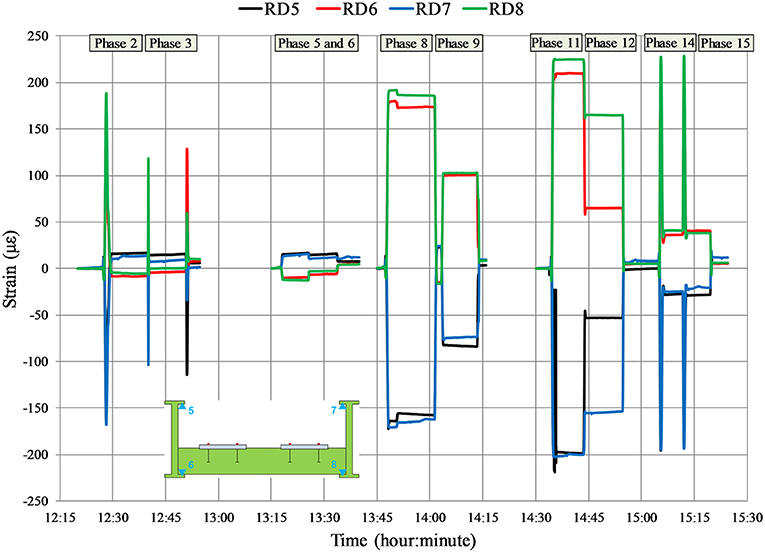
Figure 9. Strain measurements in cross-section 2-2.
Dynamic Measurements and Results
Dynamic measurements during diagnostic load testing of the bridge was performed in two phases. In the first phase, main dynamic parameters of the structure (i.e., natural frequencies, mode shapes, damping ratios) were determined by means of the Operational Mode Analysis (OMA) (Zhang and Brincker, 2005). The measurement was performed during ambient excitation of the bridge which has the characteristics of Gaussian white noise process. Accelerations were measured in 6 measuring points in the vertical direction on both main girders, in the middle and at the quarters of the central span. The measuring points were determined in a way to ensure a quick execution of the measurement and on the other hand to provide enough DOF's for identification of main vertical and torsional mode shapes of the bridge which were used for the calibration of the FE model. High sensitivity accelerometers, 10 000 mV/g, were used during the measurements (B&K 8340 and PCB 393B31) together with data acquisition system B&K 3560-C and appropriate software. The data acquisition was performed using sampling frequency of 400 Hz, over 64 s which resulted in 25,600 captured samples for each accelerometer. Processing of the measured data consists of the Fast Fourier Transform (FFT) of time domain recordings, determination of Power Spectral Density (PSD) and Singular Value Decomposition of PSD matrices. Natural frequencies were determined as resonance peaks from the diagram of singular values of the PSD matrices (Figure 10A). Mode shapes were estimated as first singular vectors at the resonance peak and damping ratios were determined using the Inverse Discrete Fourier Transform (IDFT) of the estimated SDOF functions (Figure 10B). Measured and numerical values of natural frequencies as well as the measured damping ratios are given in Table 2, six modes were determined experimentally. First two mode shapes obtained experimentally are compared to the corresponding numerical mode shapes in Figure 11.
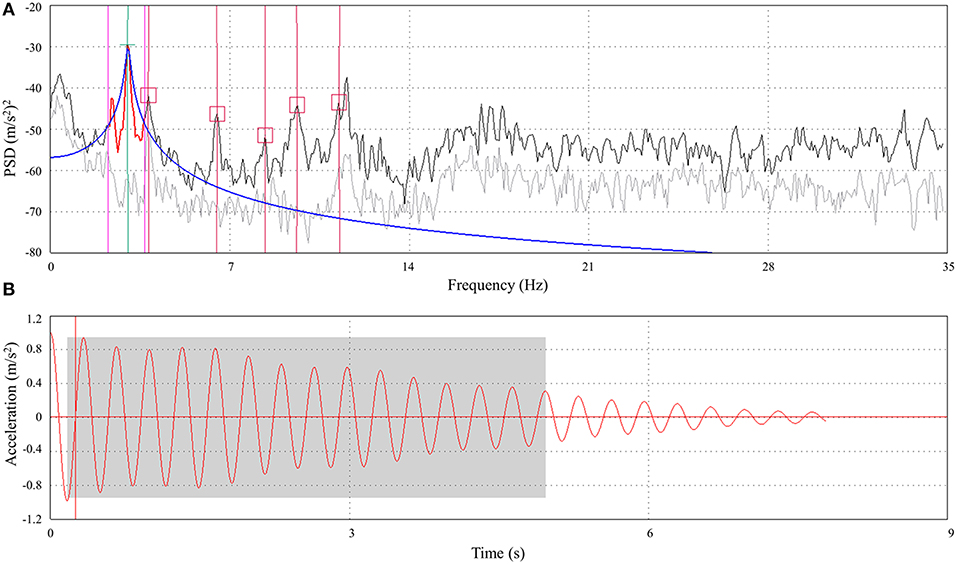
Figure 10. Determination of dynamic parameters: (A) singular values of PSD matrices–1st natural frequency; (B) damping function–1st mode shape (Frančić et al., 2012).
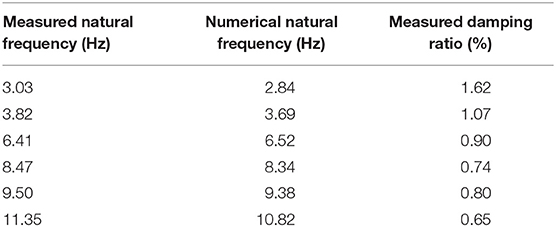
Table 2. Values of measured and numerical natural frequencies and damping ratios (Damjanović et al., 2011).
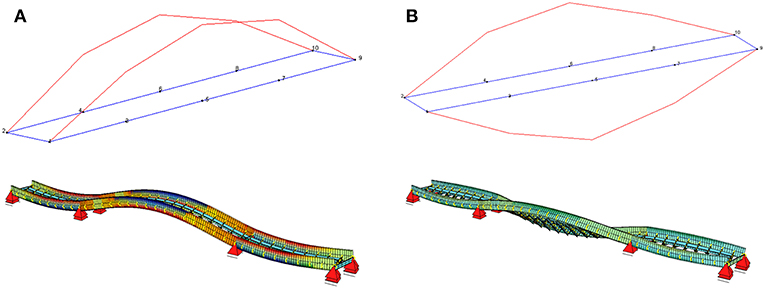
Figure 11. Experimental and numerical mode shapes: (A) 1st mode shape; (B) 2nd mode shape.
During the second phase of the dynamic load testing, the increments of the vertical dynamic displacement caused by locomotives crossing the bridge at different speeds were measured. Based on the dynamic displacement ydyn, the dynamic factor φ is determined as given
where ystat is the numerical vertical displacement under static loads.
The dynamic displacement was measured during the crossing of one or two locomotives over the bridge at different speeds (20, 40 and 60 km/h), but also during braking of the locomotives (one or two) within the central span (~20–40 km/h). The vibrometer HBM SMU and the digital oscilloscope connected to a personal computer were used to measure the dynamic displacement on both main girders in the middle of the central span (Figure 12A). The measured values of the dynamic displacement and the calculated values of the dynamic factor are given in Table 3. During the dynamic load testing, strains were measured at the flanges of the main girders in cross-sections 1-1 and 2-2 according to Figure 7. Strain measurements during the crossing of two locomotives over the bridge at 60 km/h are shown in Figure 12B. The values of strain measured during the dynamic load testing are lower than the values measured during the static load testing.
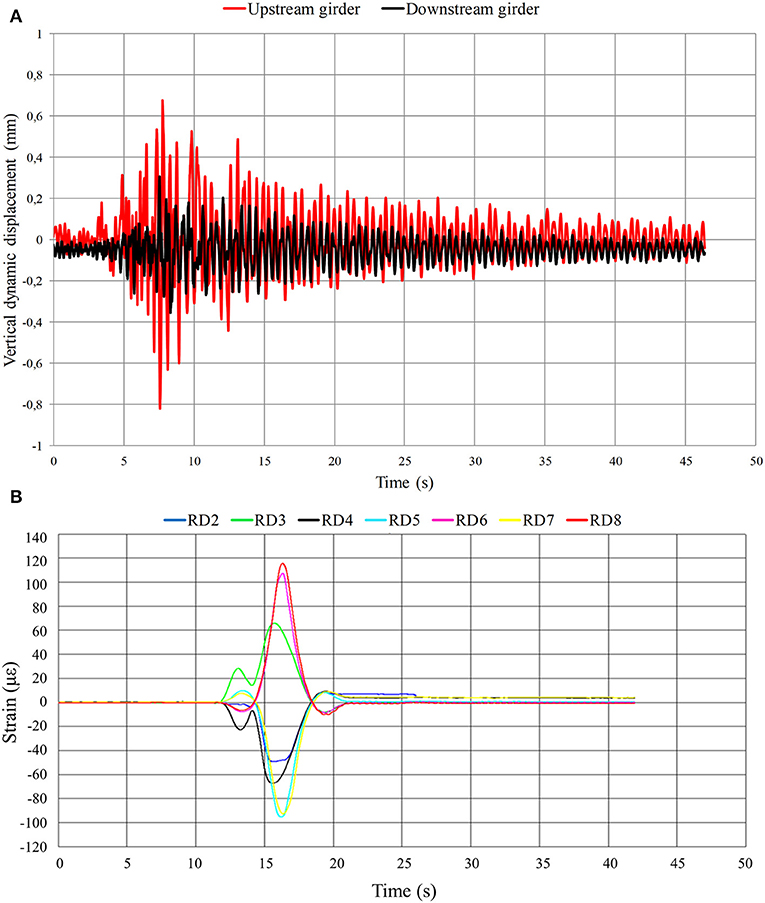
Figure 12. Dynamic load testing (2 locomotives at 60 km/h): (A) vertical dynamic displacement in the middle of the central span; (B) strain in cross-sections 1-1 and 2-2.
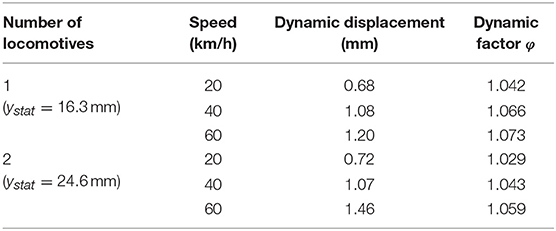
Table 3. Measured dynamic displacements and calculated dynamic factors (Damjanović et al., 2011).
Conclusions
This article presents a complex experimental research of a damaged steel railway bridge before, during and after reconstruction. Both main girders underwent plastic deformation near the damaged pier which represented a challenge. It was necessary to evaluate the state of the material before the reconstruction as well as the quality of the reconstruction intervention. In order to evaluate the elastic behavior of the material, the hole-drilling strain gauge method of determining residual stresses was implemented. Two critical cross-sections were selected at the location of extreme values of the bending moment after damage. Residual strains measured on the more damaged upstream main girder, were used for the calculation of residual stresses. Calculated stresses were below the yield strength of steel. A monitoring system was also installed at the critical cross-sections during the lifting of the bridge over a period of 3 days. Stresses were calculated based on strain measurements and the bridge behaved elastically at the critical cross-sections under reconstruction loading conditions.
After reconstruction, diagnostic load testing was used to verify the assumptions made in FE models by comparing measured and numerical values. Static load testing was performed in 10 loading phases. Values of maximum measured vertical displacements (Table 1) were in the expected range and in accordance with numerical values. Normal stresses were calculated at all measuring points based on measured values of strains and the values were in accordance with calculated values. After the unloading of the bridge, the residual vertical displacements and strains were negligible which means that the structure was in the elastic range during static loading. Based on the experimental results of deflections and strains during the load testing it can be evaluated that the load carrying capacity of the bridge after reconstruction is satisfactory. The measured deflections during the significant loading phases are lower than those determined in numerical simulations and the values of stresses in the critical cross sections of the bridge measured during the load testing are not exceeding 50 MPa. Dynamic load testing of the bridge was performed in order to determine the main dynamic parameters of the structure and to calculate the dynamic factor. The measurement was carried out during ambient excitation in order to determine the dynamic parameters and during the crossing of one or two locomotives over the bridge at different speeds in order to determine the dynamic factors. The dynamic response of the superstructure was realistic and as expected. Measured natural frequencies were in accordance with the calculated values (Table 2). Experimental and numerical mode shapes were also in accordance (Figure 11). Calculated values of the dynamic factors were in accordance with the design value. After the completion of the diagnostic load testing no damages were detected on the bridge. Based on the load testing results it was concluded that the railway bridge (Sesvete—Velika Gorica) is in accordance with the requirements of the project and the provisions of the Croatian standard HRN U.M1.046.
Monitoring and diagnostic load testing can serve as a method of evaluating the accordance of the structure with the project requirements, the quality of the reconstruction and the ability of the renewed bridge to carry the design loads. It is necessary to consider the bridge type, materials and reconstruction or strengthening interventions. The selection of appropriate measurement parameters and methods for a specific bridge is of great importance, in order to obtain useful results for the decision makers involved.
Data Availability
All datasets generated for this study are included in the manuscript and/or the supplementary files.
Author Contributions
All authors have contributed to the contents within this paper. ID prepared the monitoring system and the numerical model as well as analyzed the measurement results. MB prepared the first draft of the paper and analyzed the residual strain results. DD prepared the static load testing and analyzed the measurement results. MF analyzed the dynamic measurement results. The literature review and the final version of the paper was mostly performed by AS. All authors contributed to the manuscript revision as well as read and approved the submitted version.
Funding
The research was supported by the University of Zagreb.
Conflict of Interest Statement
The authors declare that the research was conducted in the absence of any commercial or financial relationships that could be construed as a potential conflict of interest.
References
Ajovalasit, A., Scafidi, M., Zuccarello, B., Beghini, M., Bertini, L., Santus, C., et al. (2010). “The Hole-drilling strain gauge method for the measurement of uniform or non-uniform residual stresses,” in AIAS Working Group on Residual Stresses. Florence.
ASTM E837 (2013). Standard Test Method for Determining Residual Stresses by the Hole-Drilling Strain-Gage Method. West Conshohocken, PA: ASTM Standards.
Bagge, N., Popescu, C., and Elfgren, L. (2018). Failure tests on concrete bridges: have we learnt the lessons? Struc. Infrastruc. Eng. 14, 292–319. doi: 10.1080/15732479.2017.1350985
Damjanović, D., Košćak, J., Bartolac, M., Duvnjak, I., Marendić, A., and Paar, R. (2016a). “Measurements during the testing of steel railway bridges,” in Proceedings of the International Symposiun on Engineering Geodesy - SIG 2016, 113–26. Varaždin: Croatian Geodetic Society.
Damjanović, D., Košćak, J., Duvnjak, I., and Bartolac, M. (2016b). “Static and Dynamic Testing of Steel Railway Bridge ‘Sava.”' in Road and Rail Infrastructure IV, Proceedings of the Conference CETRA 2016, ed S. Lakušić, Department of Transportation, Faculty of Civil Engineering, University of Zagreb, (Zagreb).
Damjanović, D., Rak, M., Duvnjak, I., Bartolac, M., and Frančić, M. (2011). Load Testing Report On Railway Bridge. Sava Jakuševac: Structural Testing Laboratory, Faculty of Civil Engineering, University of Zagreb.
Duvnjak, I., Bartolac, M., Nilimaa, J., Sas, G., Blanksvard, T., Taljste, B., et al. (2018). “Lessons learnt from full-scale tests of bridges in Croatia and Sweden,” in 40th IABSE Symposium: Tomorrow's Megastructures/Cremona, Christian. Zürich : IABSE. Nantes, France.
Duvnjak, I., Rak, M., Krolo, J., Bartolac, M., and Frančić, M. (2012). “Experimental investigation of the collapsed steel bridge deformation,” in Proceedings of the 29th Danubia-Adria-Symposium on Advances in Experimental Mechanics, ed Miloslav Ognjanović, Belgrade, Serbia: Serbian Society of Mechanics, Faculty of Mechanical Engineering, University of Belgrade, 26–27.
Frančić, M., Damjanović, D., and Rak, M. (2012). “Testing of the railway bridge ‘Sava Jakuševac' after reparation,” in Proceedings of the 29th Danubia-Adria-Symposium on Advances in Experimental Mechanics, edited by Miloslav Ognjanović, Serbian Society of Mechanics, Faculty of Mechanical Engineering, University of Belgrade (Belgrade), 24–25.
Hoffman, K. (1989). An Introduction to Measurements Using Strain Gages. Darmstadt: Hottinger Baldwin Messtechnik GmbH.
HRN EN 1991-2 (2012). Eurocode 1: Actions on Structures - Part 2: Traffic Loads on Bridges. Zagreb: Croatian Standards Institute.
Lantsoght, E. O. L., Koekkoek, R. T., Hordijk, D., and de Boer, A. (2018). Towards standardisation of proof load testing: pilot test on viaduct Zijlweg. Struc. Infrastruc. Eng. 14, 365–380. doi: 10.1080/15732479.2017.1354032
Lantsoght, E. O. L., Koekkoek, R. T., van der Veen, C., Hordijk, D. A., and de Boer, A. (2017a). Pilot proof-load test on viaduct de beek: case study. J. Bridge Eng. 22:05017014. doi: 10.1061/(ASCE)BE.1943-5592.0001131
Lantsoght, E. O. L., van der Veen, C., de Boer, A., and Hordijk, D. A. (2017b). State-of-the-art on load testing of concrete bridges. Eng. Struc. 150, 231–41. doi: 10.1016/j.engstruct.2017.07.050
Marendić, A., Paar, R., and Damjanović, D. (2017). Measurement of bridge dynamic displacements and natural frequencies by RTS. J. Croatian Assoc. Civil Eng. 69, 281–294. doi: 10.14256/JCE.1804.2016
Mujkanović, N., Vlašić, A., and Šavor, Z. (2012). “Rehabilitation of Railroad Bridge ‘Sava Jakuševac.”' in Construction of Transport Infrastructure, ed S. Lakušić (Zagreb: Faculty of Civil Engineering, University of Zagreb).
Olaszek, P., Łagoda, M., and Casas, J. R. (2014). Diagnostic load testing and assessment of existing bridges: examples of application. Structure and Infrastructure Engineering Maintenance, Management, Life-Cycle Design and Performance 10, 834–842. doi: 10.1080/15732479.2013.772212
Olofsson, I., Elfgren, L., Bell, B., Paulsson, B., Niederleithinger, E., Jensen, J. S., et al. (2005). Assessment of european railway bridges for future traffic demands and longer lives – EC project ‘Sustainable Bridges.' Struc. Infrastruc. Eng. 1, 93–100. doi: 10.1080/15732470412331289396
Rak, M., Damjanović, D., Duvnjak, I., Bartolac, M., and Frančić, M. (2011). Load Testing Program On Railway Bridge. Sava Jakuševac: Structural Testing Laboratory, Faculty of Civil Engineering, University of Zagreb.
Keywords: monitoring, reconstruction, diagnostic load testing, damaged railway bridge, residual strain, residual stress, static load testing, dynamic load testing
Citation: Duvnjak I, Damjanović D, Bartolac M, Frančić Smrkić M and Skender A (2019) Monitoring and Diagnostic Load Testing of a Damaged Railway Bridge. Front. Built Environ. 5:108. doi: 10.3389/fbuil.2019.00108
Received: 30 April 2019; Accepted: 29 August 2019;
Published: 18 September 2019.
Edited by:
Youliang Ding, Southeast University, ChinaReviewed by:
Josef Vičan, University of Žilina, SlovakiaKadir Ozakgul, Istanbul Technical University, Turkey
Peter Koteš, Faculty of Civil Engineering, University of Žilina, Slovakia
Copyright © 2019 Duvnjak, Damjanović, Bartolac, Frančić Smrkić and Skender. This is an open-access article distributed under the terms of the Creative Commons Attribution License (CC BY). The use, distribution or reproduction in other forums is permitted, provided the original author(s) and the copyright owner(s) are credited and that the original publication in this journal is cited, in accordance with accepted academic practice. No use, distribution or reproduction is permitted which does not comply with these terms.
*Correspondence: Ivan Duvnjak, aWR1dm5qYWtAZ3JhZC5ocg==