 Jojo France-Mensah1
 Chirag Kothari
 William J. O'Brien
- 1Department of Civil, Architectural, and Environmental Engineering, The University of Texas at Austin, Austin, TX, United States
- 2Center for Transportation Research, The University of Texas at Austin, Austin, TX, United States
- 3Texas Department of Transportation, Fort Worth, TX, United States
State highway agencies (SHAs) are tasked to provide short- to long-term plans for developing and maintaining transportation infrastructure. In line with this task, often multiple functional groups in SHAs are responsible for allocating funds from multiple categories to a range of infrastructure assets on the same network—a situation that demands highly effective platforms for collaboration. However, the use of heterogeneous information systems challenges efforts to perform a spatial-temporal analysis of candidate projects proposed by these functional groups. To address this challenge, this paper proposes an integrated framework to improve the collaborative planning of highway projects by SHAs. The major steps in the framework include budgeting, identifying and integrating candidate projects, performing a spatial conflict analysis, classifying conflicts, and developing a response action. These steps are repeated iteratively until there are no unplanned spatial conflicts in the final program or scenario. The proposed framework was implemented by developing a tool in a spreadsheet environment via Visual Basic programming. The developed tool was first validated via a Charrette test involving ten participants with a total of close to 40 years of project management experience in cross-functional organizations. The second phase of validation involved feedback from six agency experts after a case demonstration involving 340 highway projects. This study contributes to the body of knowledge by providing an integrated platform for different functional groups in SHAs to collaborate more effectively.
Introduction
Every year, state highway agencies (SHAs) in the United States oversee the allocation of billions of dollars toward developing, expanding, and maintaining highway infrastructure (Arif et al., 2015; Torres-Machi et al., 2017). Accordingly, SHAs are held accountable for making cost-effective decisions on highway projects to improve the overall level of safety and ease of travel throughout their respective networks (Yuan et al., 2017). There are three levels of decision-making: strategic, network, and the project level (De La Garza et al., 2011; Chi et al., 2013). The strategic level of decision-making, which is concerned with setting overarching goals and objectives for the infrastructure network, often takes place at the federal or state level. A key component of decisions taken at this stage is cross-asset resource allocation. This involves prioritizing funds to be allocated to different highway asset classes like pavements, bridges, and road signs (Gharaibeh et al., 2006; Porras-Alvarado et al., 2016). The network-level involves condition assessment, performance modeling, program development, and the allocation of a pre-defined budget amount (Gao et al., 2012; Wu et al., 2012). This level of decision-making is often undertaken by districts, city authorities, or metropolitan planning organizations (MPOs). Project-level decision-making often involves the analysis of different possible treatment methods to evaluate and assess potential treatment alternatives for the selected asset (Li and Madanu, 2009). This also means selecting the best route location and design to meet regional mobility needs. This study focuses on the network-level of decision-making.
At the network-level, often multiple functional groups are working in the same agency. These groups plan projects for the same infrastructure network but focus on different functions (Porras-Alvarado et al., 2016; France-Mensah and O'Brien, 2019), such as maintenance, operations, safety, capital planning, and many others. The functional nature of SHAs is further reinforced by functional-specific funds, planning practices, and information systems. Thus, although these groups often use shared information about the assets they plan for, the proposed projects that are scheduled for these assets usually reside in different databases or information systems (Le and Jeong, 2016; Le et al., 2018). Moreover, these information systems are often incompatible because they were designed for group-specific needs without accounting for interoperability. For functional groups working on the same network, this siloed setup can create challenges to effective information sharing and proactive decision-making.
In addition to incompatible information systems, a defining characteristic of infrastructure planning is that the information generated is dynamic. For example, infrastructure assets can begin deteriorating at a much faster rate than anticipated based on a change in economic activity, environmental factors, or other technical reasons (Ng et al., 2011; Menendez and Gharaibeh, 2017). Premature deterioration would necessitate the inclusion of projects that were not initially present in the initial infrastructure plan, causing a ripple effect on the priority list of planned projects for a specified planning horizon. Thus, projects planned earlier by other functional groups can be affected by changes in the projects proposed by another group in response to new developments on an asset. Another example of the dynamic nature of infrastructure planning involves the funding aspect. If funding for a capital project (such as widening a roadway from one lane to two lanes) should become available, a previously planned maintenance project (such as applying a seal coat) on the same section would no longer be required. In general, changes in asset information, highway funding, road user interests, and other socio-economic factors can also affect the projects that are executed during a plan period. Similarly if a previously planned capacity addition project to meet the increased traffic needs is delayed due to delays in the procurement of required right-of-way (ROW), a preventive maintenance project or spot treatment may be needed to keep the existing pavement in fair condition while the ROW for the capacity addition project gets acquired. This may cause diversion of funds from other maintenance projects which may have a domino effect on the overall maintenance plan for the year.
In such scenarios, inter-related projects and unintended spatial conflicts can arise in the pool of projects proposed by the various planning groups (Qiao et al., 2018). Inter-related projects refer to those projects that are intentionally scheduled to occur on a particular highway asset. For example, a spot base repair project may need to be performed by the county maintenance section before a preventive maintenance or light rehabilitation of the surface course can be executed on the same asset. Similarly, some maintenance projects might be scheduled to precede a capital planning project planned for the same location (France-Mensah et al., 2018b). Such inter-related projects highlight the complex relationships between highway projects proposed by multiple functional groups. On the other hand, spatial conflicts can arise as well. For example, a capacity addition/reconstruction project might be accelerated from a future date, in response to rapid commercial developments in an area, and get scheduled just after the completion of a preventive maintenance project that was previously scheduled and executed within the same spatial limits. If the spatial overlap had been identified, the preventive maintenance funds could have been diverted to other needed roadway sections. Such spatial and functional conflicts can lead to ineffective use of limited highway funds.
In order to identify and manage these conflicts, it is important to capture, process, and effectively manage project information from multiple functional planning groups. With incompatible and heterogeneous information systems (as shown in Figure 1), capturing and managing such changes in highway project information can be challenging. To counter these challenges there has been a continuous increase in demand to develop effective tools and procedures to integrate, manage and analyze highway data (Parida et al., 2005).
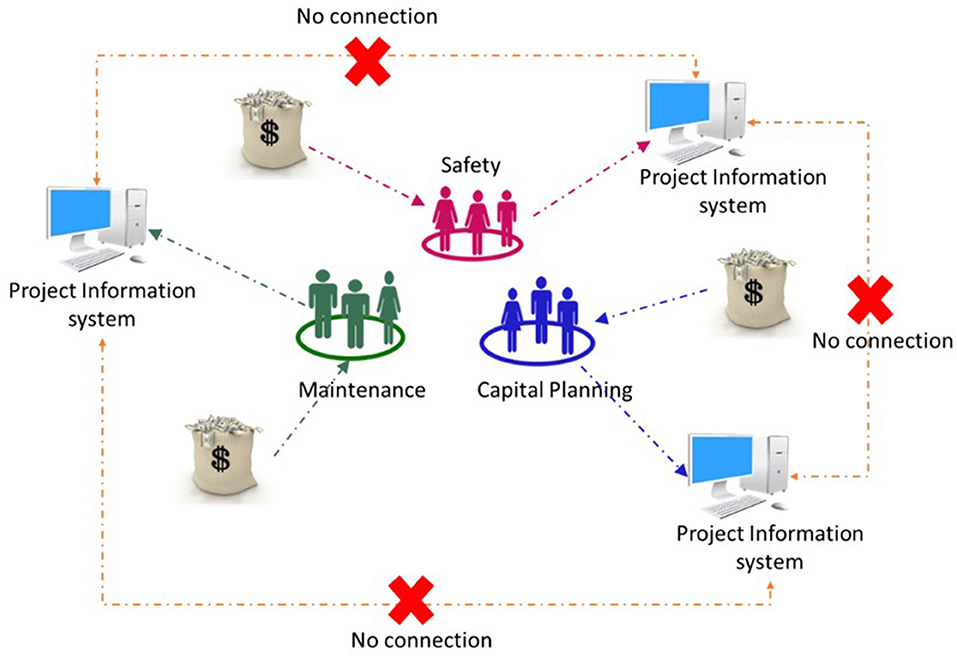
Figure 1. Conceptual diagram of funding and disjoint information systems of functional groups in SHAs.
In the past, efforts have been made to tackle some of these infrastructure problems by visualizing the highway data using a consistent spatial referencing system such as GIS (Medina et al., 1999). Several DOTs like Washington State Department of Transportation (WSDOT), Colorado State DOT (CDOT), North Dakota DOT (NDDOT), Michigan DOT, Ohio DOT have used GIS to visualize construction and maintenance projects that are scheduled to take place in their respective states (Hector-Hsu et al., 2012; Rydholm and David, 2015; Colorado Department of Transportation., 2016; North Dakota Department of Transportation., 2016). However, most of these DOTs focused on using GIS to support either capital planning or highway maintenance operation- rarely integrating information systems from different functional groups.
In an earlier study, authors (France-Mensah et al., 2018b) highlighted this shortcoming and developed ad-hoc connections between agency project databases to fuse project information from multiple information systems. A GIS-based visualization was then developed to display projects proposed by the maintenance and capital planning functional groups. However, that study had several limitations. First, the solution proposed was reactive, focusing on identifying potential conflicts among projects after such projects were already approved and funding was allocated for them. Secondly, there was no consideration of the dynamic nature of planning, allowing for the impact of changes in project information that could arise from changes in asset condition, funding, or political interests. Thirdly, there was no consideration of decision-making constraints like funding caps and project eligibility factors, which can influence decisions about an infrastructure management program. Thus, the need to develop an integrated process to handle the dynamic and iterative nature of the planning process has been identified. The need for an efficient integrated management practice in transportation planning is explicitly exhibited in key federal laws passed over the last few decades: Surface Transportation and Uniform Relocation Assistance Act of 1987, the “Intermodal Surface Transportation Efficiency Act of 1991 (ISTEA),” and the “Moving Ahead for Progress in the 21st Century Act” (France-Mensah et al., 2018b).
In this paper, an integrated planning framework is developed to facilitate proactive and cross-functional planning of candidate highway projects proposed by different functional groups working in the same highway agency. The framework developed is flexible enough to account for project information from multiple groups and also allows dynamic analysis of the ripple effects arising from changes in projects information. Additionally, funding constraints and updated asset information are accounted for as part of the spatial-temporal impact analysis of candidate projects in the program.
Methodology
The primary objective of this paper is to develop and implement a framework for the cross-functional planning of highway projects by SHAs. In order to understand the prevailing practice and the necessary information requirements, two methods were employed (as shown in Figure 2). First, interviews were conducted with seven subject-matter experts (SMEs) who had been involved in maintenance, rehabilitation, and mobility planning of highway projects. Six of the seven experts were functional leads in operations, maintenance, and capital planning groups at their respective departments. These functional leads had each worked in the transportation infrastructure domain for at least 15 years. The other SME had about 8 years' experience in infrastructure management and a research-based advanced degree in the domain of interest. The interview questions focused on understanding the current cross-functional planning process, specific tasks and scenarios, decision-making constraints, and the information needed for projects coordination. After documenting the planning process, the information requirements for cross-functional coordination of projects was also extracted from open source projects data from 39 highway agencies in the United States. Project data was reviewed until data saturation occurred. According to Fusch and Ness (2015), data saturation occurs when there is no additional information gained with additional efforts of data collection. Accordingly, the authors ceased the review of online projects information from agencies after observing that a data saturation point had been reached. The information extracted from the online projects of multiple highway agencies were fused with the cross-functional planning process to create a collaborative planning framework.
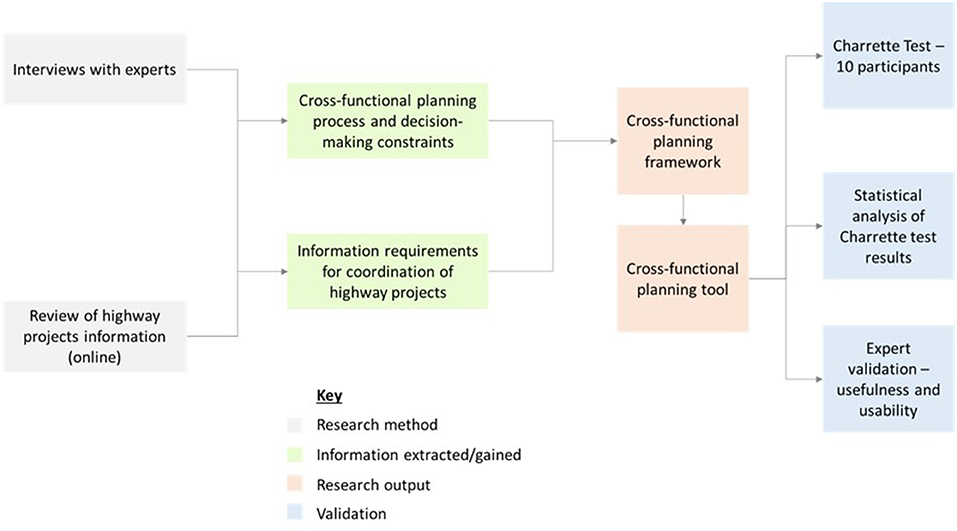
Figure 2. Research approach to study.
The proposed framework was then implemented in a planning tool that was used in an implementation case study. To evaluate the usefulness, efficiency, and usability of the developed tool, a number of validation methods were implemented. First, a Charrette test (Clayton et al., 1998) was conducted to assess the efficiency of the tool in comparison with the extant process of cross-functional projects planning. The use of a Charrette test is consistent with other infrastructure management studies that implemented decision-making frameworks or informatics (Gibson and Whittington, 2009; Kim et al., 2018). Building on the raw test results, a statistical analysis of the test outcomes was conducted to investigate whether the developed tool improved the accuracy and speed of conducting tasks (i.e., to a statistically significant extent). Accordingly, the paired t-test (parametric) and the Wilcoxon signed-rank test (non-parametric counterpart) were conducted to ascertain if there was a difference in the accuracy and speed performances of participants while using the tool for cross-functional planning tasks vs. otherwise. The Wilcoxon signed-rank test was used in cases where the input datasets violated the assumptions of the parametric test (Oyeka and Ebuh, 2012; Larsen et al., 2015). Finally, six SMEs were involved in expert validation, using the tool for cross-functional planning tasks and providing feedback on the usefulness, usability, and completeness of information needed.
Integrated Framework
An integrated framework for cross-functional planning of highway projects is discussed in this section. The framework focuses on the development of a cross-functional infrastructure management program utilizing limited agency funds (budget). In practice, the agency budget is often divided among several functional groups and these functional groups are responsible for developing their respective budget allocation programs (Lee and Madanat, 2015; Zhang et al., 2017). These functional groups have a siloed process of planning, and their information systems are largely reserved for and specific to the respective group's needs. Nonetheless, these functional groups often plan projects for the same assets on the network. Thus, it is important to ensure that programs developed by different functional groups are managed collaboratively, in order to detect planning misalignments in the developed program due to conflicting projects across functional silos. Accordingly, in this study, an integrated framework (presented in Figure 3) is proposed to facilitate cross-functional planning of highway projects. The developed framework assists in identifying spatial-temporal conflicts and provides a structured documentation for the resolution of spatial conflicts. The framework consists of the following steps.
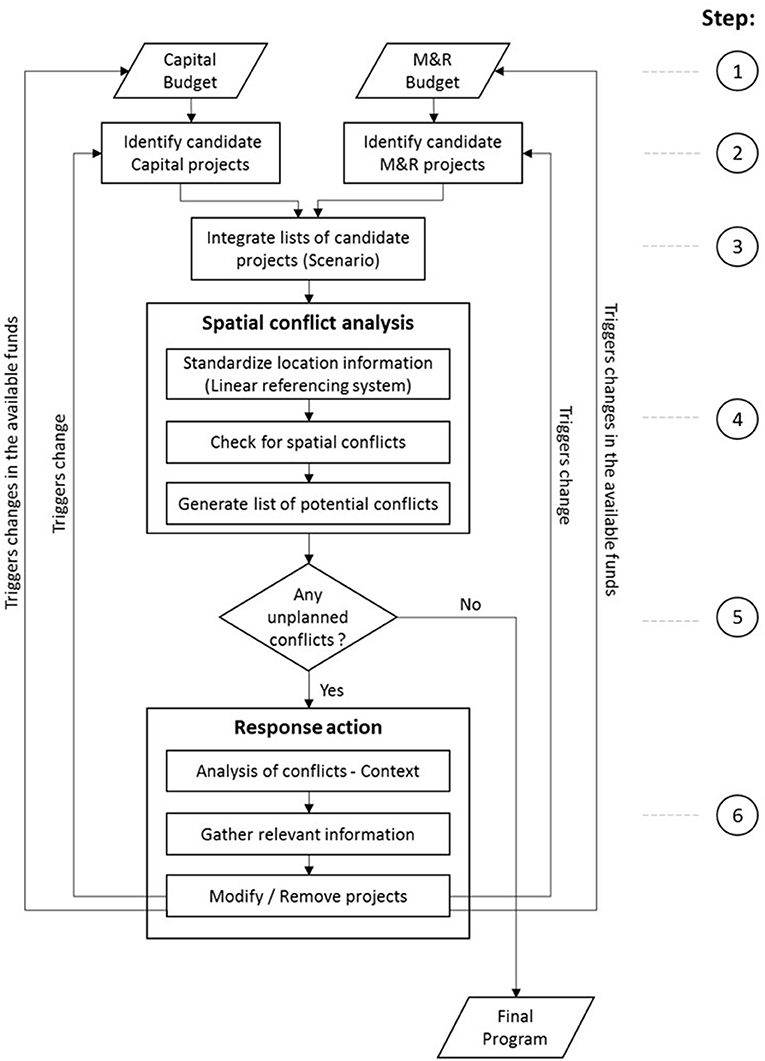
Figure 3. Integrated framework for cross-functional planning of highway projects.
Step 1: Identify Funding Sources and Distribution of Available Budget
First, the various components of funding available to the highway agency are identified and shown in the framework. These components can be based on the sources of the funds or the functional groups that are responsible for disbursing these funds. The proposed framework focuses on the latter. The sources of funds can include federal, state, and other local funding sources. Details about these funding sources and their potential constraints can be found in France-Mensah et al. (2018a). The components based on functional groups can include maintenance, safety, bridge and capital planning funds. More often than not, safety and bridge funds are integrated into the other components of funding and thus are not represented separately in the proposed framework. The available highway funds are distributed among different functional groups like maintenance, operations, mobility, etc. The distribution of these funds is carried out based on the assessment of current network performance, determination of future demands and funding requirements, and the critical examination of the current level of funding. This distribution of funds among different functional groups is further guided by the overall vision, mission, and the goals of the highway agency. Thus, the funds available for allocation with each functional group in the highway agency is determined at this step. In the framework, the funds available with the capital planning group is represented as the capital budget and the funds available with the maintenance group is presented as the Maintenance and Rehabilitation (M&R) budget. This first step is presented to serve as a contextual background to the framework and not necessarily as a core component of the framework. Indeed, every agency is different, and the funding dynamics of each agency may not necessarily follow the same context as described.
Step 2: Identify Candidate Projects (Performed by Functional Groups)
At this step, the functional groups carry out a network-level analysis of the assets under their purview. A fiscally constrained priority program consisting of candidate projects and their planned schedule of work is then prepared. The prioritization strategy used (for example, optimization, cost-benefit analysis, worst first approach, etc.) varies across different functional groups and SHAs (France-Mensah and O'Brien, 2018). Using these strategies, the functional groups identify a list of projects that needs to be prioritized while considering budgetary constraints. Thus, at the end of this step, a list of candidate projects from each functional group is made available.
Step 3: Integrate Lists of Candidate Projects (Referred to as Scenario)
As pointed out earlier, it is essential to do a cross-functional analysis of the projects from different functional groups. Accordingly, this step involves the integration of candidate projects proposed by different functional groups to prepare a consolidated list of candidate projects (referred to as a scenario). The lists of candidate projects prepared by functional groups are often documented and stored in different databases or information systems. Thus, there can be heterogeneity in the semantics and structure of projects' information received (Woldesenbet et al., 2016). Hence, it is important to prepare an integrated list of candidate projects that uses uniform semantics for all the projects in the proposed infrastructure management program. Multiple scenarios are often created in response to changes in the plans of the different functional groups.
Step 4: Conduct a Spatial Conflict Analysis
A spatial conflict occurs when two projects are planned on the same highway route and have overlapping project limits. Figure 4 represents four possible cases of spatial conflicts that might occur between two projects. Case 1 and Case 2 represent the partial spatial conflicts that may occur between two projects. On the other hand, Case 3 and Case 4 represent complete or full spatial conflicts when the entire project length of a project coincides with the project limits of another project. Since the projects are obtained from different information sources, it is important to standardize location information using a common linear referencing system to represent the project limits of the candidate projects, before spatial analysis is carried out.
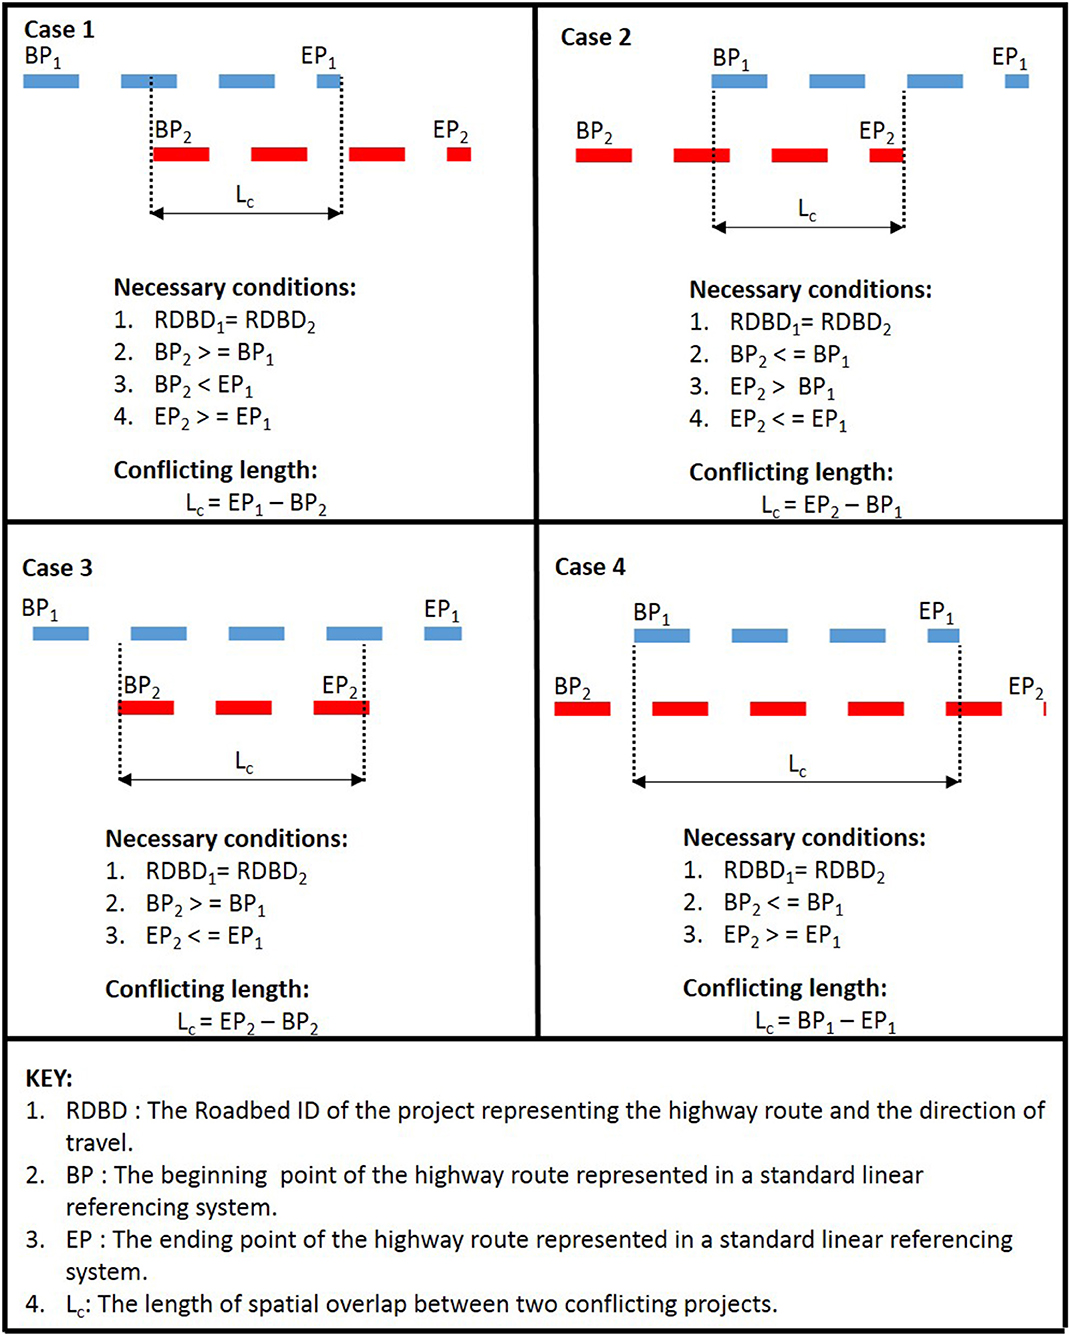
Figure 4. Configurations of spatial conflicts among highway projects.
Irrespective of the linear referencing system used, the location of a project can be represented by using three parameters: the roadbed ID (RDBD), the beginning point (BP), and the ending point (EP). The RDBD represents the highway route on which the project is planned and the corresponding direction of travel. As the name suggests, the BP and EP are used to denote the starting and ending spatial limits of the candidate projects under consideration. The BP, EP, and RDBD of different projects can be used to determine whether a pair of projects are spatially conflicting with each other. The necessary conditions for the respective cases are highlighted in Figure 4. The list of potential conflicts is generated by checking the spatial limits of all pairs of projects for these necessary conditions. Accordingly, if there are n projects in the consolidated list of projects, an n × n matrix is constructed to identify pairs of conflicting projects in the program.
Step 5: Classify Conflicts
The observed spatial conflicts in Step 4 can be divided into two categories: planned conflicts and unplanned conflicts. The planned conflicts involve projects that were intentionally planned to occur on the same section of the highway within the time period specified in the program. Planned conflicts often involve sequential and complementary highway projects. On the other hand, unplanned conflicts are those that involve spatial conflicts between two projects that were not planned to occur on the same section of the highway. It is important to note that what counts as planned vs. unplanned conflicts will vary from agency to agency. To provide a practical explanation of how this works, examples of these two types of conflicts are presented in detail in the case study. Thus, in a nutshell, this step involves a preliminary classification of conflicts into planned and unplanned conflicts based on agency practices and experts' judgments.
Step 6: Prepare Response Action
If there are unplanned conflicts in the list of candidate projects, appropriate response actions need to be taken to avoid such conflicts. The response action may involve modifying project information or deleting the project completely from the program. Modifying project information can include changing the spatial limits of the projects, changing the temporal (fiscal year) information, and/or changing the type of work to be executed. This will ensure that unplanned conflicts are avoided and planned conflicts are proactively scheduled to take place sequentially.
The decision to modify or remove a project is governed by several factors, and thus, decision-makers often need to collect and analyze several relevant information items in order to make an informed decision. The information referenced can include the maintenance history; the accident data; the current asset condition; the annual average daily traffic; and political and socio-economic factors. Moreover, since the projects are planned by different functional groups, it is crucial to identify a responsible actor (for example, a manager or a functional group lead) who will address these spatial conflicts and propose resolution actions for the unplanned conflicts in the program.
Any modification or removal of projects affects the available funds; additional funds, if any, need to be re-allocated by the respective functional groups. Thus, it is important to regularly update the remaining available funds. Consequently, new projects may be added to an existing scenario of projects to generate new scenarios. However, the addition of a new project can spatially conflict with other pre-existing projects on the list. Thus, it is important to carry out Step 2 through Step 6 iteratively until the budget is fully allotted and there is no unplanned conflict in the latest scenario of projects. Once the iterative process is complete, the final agency program is generated, which can be used by the agency for further approvals and project letting.
Implementation Tool
To implement the framework, a planning tool was built to support a proactive and cross-functional approach to planning for highway projects. The tool was developed by using the Visual Basic Application (VBA) programming language in the Microsoft (MS) Excel environment. This commonplace spreadsheet environment was chosen to ensure that decision-makers were familiar with the implementation environment. Additionally, the visualization component was implemented in the ArcGIS® environment using the ArcMap application. The custom functions were developed using a combination of Python codes (arcpy package) and the ModelBuilder application in ArcMap. ModelBuilder is a user-friendly development environment for automating geoprocessing tasks in ArcMap. A link was created between the ArcMap environment and the spreadsheet environment to support visualization capability. Accordingly, the implementation tool has three main modules: the main, conflicts coordination, and the GIS module. The main and the conflict coordination modules were developed in an spreadsheet environment while the GIS module, as the name suggests, was implemented in the ArcMap environment. The different modules and their contents are shown in Figure 5.
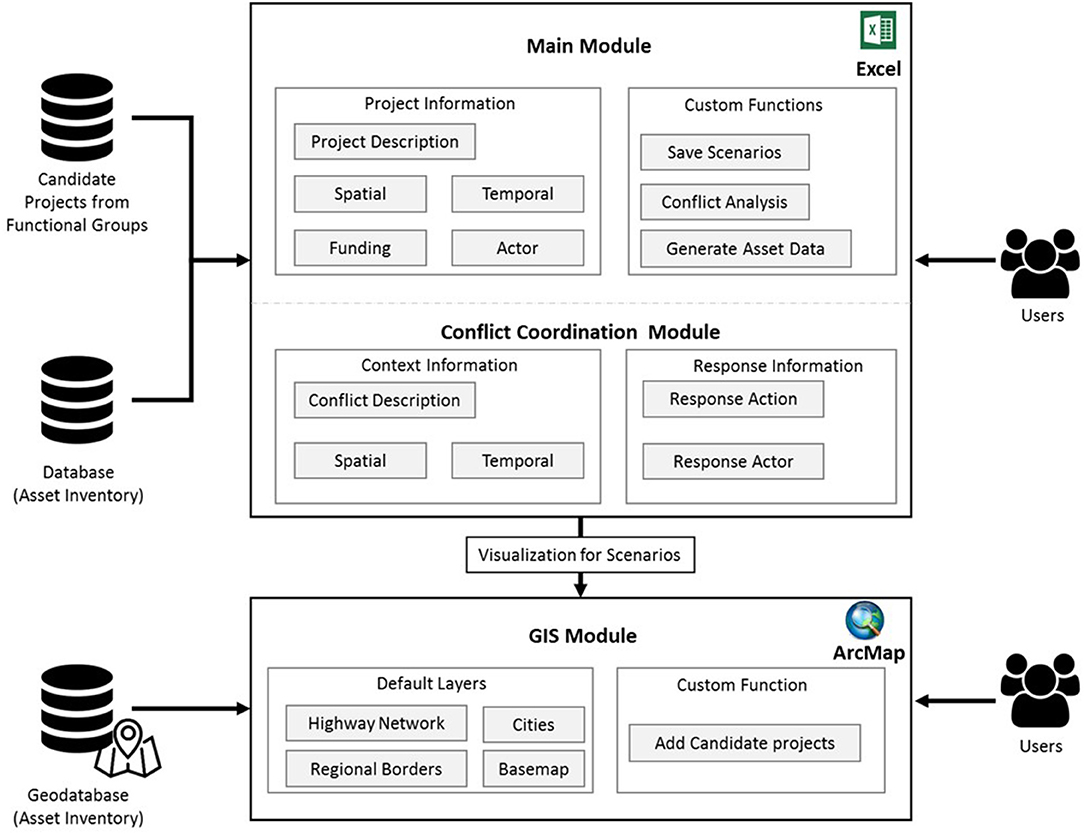
Figure 5. Primary modules of planning tool.
Main Module
The main module of the tool is the primary collaborative platform. It contains a combined list of the candidate projects from all relevant functional groups involved in project selection within the agency. In addition to the project information, it also supports custom functions for saving scenarios, performing conflict analysis, and generating asset data. The project information includes description, spatial, temporal, funding, and actors' information. Description attributes include the project ID and a generic project description. Spatial attributes include the highway name, the roadbed (main lane or access road), reference points, and the direction of travel. Temporal attributes also cover the fiscal year, proposed project letting dates, and other key temporal milestones. Funding information covers the project cost and the information about the projects' respective funding categories. Accordingly, the budgetary limits for each funding category and the remaining funds based on the planned projects in the list are also presented in this module.
In addition to the aforementioned attributes, the main module also has several custom functions, including the “Save Scenarios,” “Conflict Analysis,” and “Generate Asset Data” buttons. The first button allows users to save a specific scenario of candidate projects as part of the iteration process. The conflict analysis function allows users to conduct inter-project conflict analysis of all the projects that have been aggregated in the list. The results of the conflict analysis are published in the “Conflicts Coordination” module. As part of the conflict analysis, users may want to generate asset data for contextual information that is relevant to the decision to remove or reschedule a project. Thus, the “Generate Asset Data” function allows users to query for condition score data from the Pavement Management Information System (PMIS). The condition score information retrieved is also essential to confirm that some of the planned projects are scheduled to cover “critical” pavement sections with low condition performance. The information in the conflicts coordination module is presented next.
Conflicts Coordination Module
After the conflict analysis is executed in the main module, the results of the inter-project conflicts identified are presented in this module. This module contains contextual information about inter-project conflicts identified and documents a format for the resolution actions to be taken. The context information includes a unique conflict identifier (Conflict ID), highway name, the project IDs, and the description of the conflicting projects. Spatial information also includes computation of the conflicting length on the pavement section. As shown in Figure 6, the conflicting length represents the overlapping section on which the two projects are scheduled to occur. Similarly, additional temporal information involves the computation of the “Time Gap,” which is the absolute difference in the fiscal years of the pair of spatially conflicting projects.
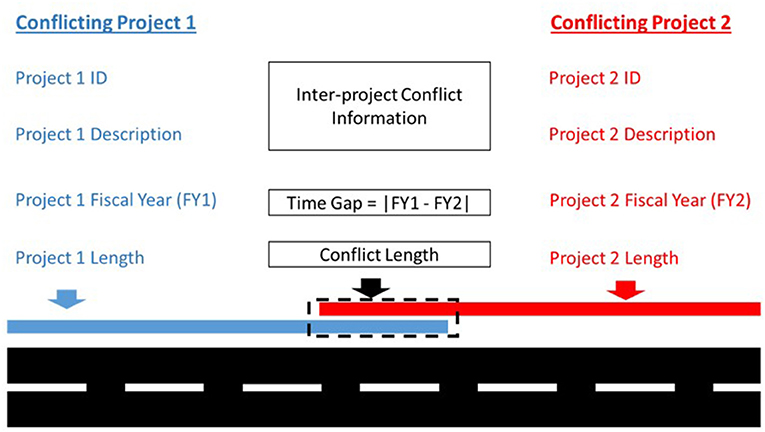
Figure 6. Description of conflicting highway projects and contextual information computed.
Users can also input information for what the response action should be, who should take that action (Responsible Division/Manager), and what the current status of the conflict is. Thus, based on the description of the conflicting projects and other information, such as the time gap and conflict length, the agency staff can input information on the responsible action, response status, and the responsible division. Based on the conflict analysis results generated by this module, users can make changes in the main module, like deleting a conflicting project or modifying its information. Modifying a project's information can include changing the spatial limits of the project, the planned fiscal year(s), the project description, and/or estimated costs. However, such changes may also lead to other spatial-temporal conflicts in the plan and should prompt a re-run of the conflict analysis function to ensure that no new conflicts were introduced. Thus, this spatial-temporal conflict analysis process is a continuous, dynamic, and iterative process.
GIS Module
The primary purpose of the GIS module is to visualize a scenario of candidate projects within a spatial context of the highway infrastructure network. Users can visualize scenarios of planned projects in the ArcMap component of ArcGIS. The visualization functionality serves three major purposes. First, it allows users to confirm the spatial extents of the planned projects in the main module. For example, if the limits of a planned highway project indicated that it fell in a county other than where it was supposed to be, the user can quickly ratify this error in spatial information. Accordingly, this module allows users to confirm spatial conflicts in the list of candidate projects in a scenario that is being visualized. This helps meet the need for visual context to the decision-making process. Finally, the overlay of candidate projects with other information, such as the condition score ratings of the network, can aid decision-makers in assessing whether critical (low condition score) sections have been accounted for throughout the network.
Case Study
This section describes the application of the planning tool to a select case study involving the Fort Worth District of the Texas Department of Transportation (TxDOT). The network for this district includes nine counties, covering a total area of about 7,000 square miles and a total network size of ~9,000 lane-miles. The scenario includes a spatial-temporal conflict analysis of projects proposed by the maintenance functional group and the capital planning functional group. To focus on the depth of the discussion, a subset of the list of candidate projects is presented.
Context and Scope
In this case study, about 181 projects were proposed by the capital functional group and over 159 projects were proposed by the maintenance functional group. Project information included fields such as fiscal year, unique ID, highway number, project description, estimated cost, spatial limits and roadbed information. The projects proposed by the latter group included planning activities like the application of seal coats, pavement leveling, milling, base repair, crack sealing, edge maintenance, and pothole repairs. The capital planning group proposed projects involving widening pavement sections, placing thick (over two-inch) asphalt overlays, constructing interchanges, replacing bridges, constructing ramps, and new construction in general. Some joint projects in the preventive maintenance category can be funded by both functional groups under Category 1 of the 12 standard functional categories approved for TxDOT's Unified Transportation Plan (France-Mensah et al., 2018a). Examples of such projects include seal coats, thin overlays, and micro-surfacing treatments. The current practice of cross-functional planning involves members of both functional groups having meetings to go over the projects for finalization and potential conflicts. However, given the scale of the projects described above (340 projects), it is statistically possible that some spatial-temporal conflicts are either not identified or addressed inappropriately. More importantly, changes in asset data and planning information often lead to unanticipated changes in the highway project information. This means that projects that were hitherto conflict-free can become conflicting projects when their spatial or temporal information is modified. To address this, the developed tool allows agency personnel to accurately identify such inter-project conflicts within their individual plans and in the combined plan as well. The conflict analysis results from the planning tool are further discussed below.
Conflict Analysis Results and Potential Response Actions
After the conflict analysis was run in the planning tool, a total of 73 inter-project conflicts were identified in the plan. This list of conflicts excludes short-length (under 1 mile) conflicts and user-defined complementary projects concerning preventive maintenance projects. The conflicts analysis module includes information on the pairs of projects that were assessed as having a spatial overlap in the plan. Relevant information provided includes the project description, project IDs, and the highway name of each pair of conflicting projects. To provide additional information for the response to the conflicts, the conflict length, and the time gap information is also presented. As explained earlier, the time gap information is an algebraic computation of the absolute difference in the fiscal years of the conflicting pair of projects. Thus, as Figure 7 illustrates, Conflicts 2 and 10 have conflicting projects that are scheduled to occur in the same fiscal year. Similarly, Conflicts 3 and 10 have conflicting projects that span over 9 miles of roadway, as indicated in the conflict length column.
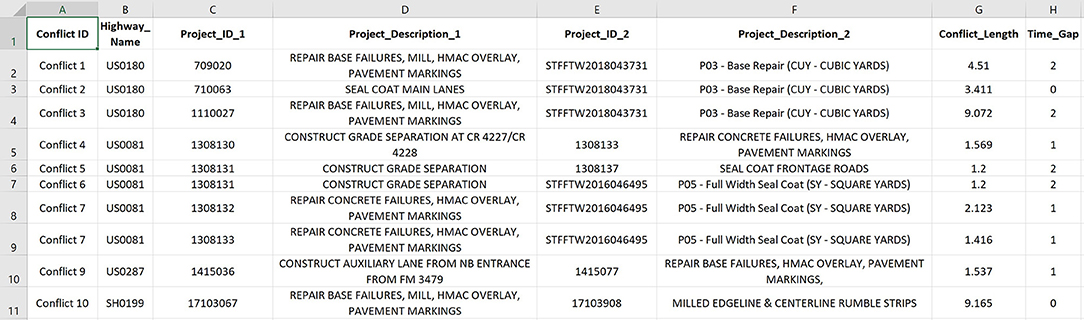
Figure 7. Detailed information on conflicts in Conflicts Coordination module.
To explore how this contextual information can be used to support the decision-making process, a select number of conflicts will be discussed further. To begin with, Conflict 1 occurs on the highway (US0180) between projects with IDs 709020 and STFFTW2018043731. The difference in the format of the project IDs is because the former was proposed by the capital planning group while the latter was proposed by the maintenance functional group. Thus, this is a cross-functional spatial conflict. Note that the projects are scheduled to take place 2 years apart and spatially overlap over 4.51 miles of roadway. Interestingly, the descriptions of the conflicting projects also make clear that they both include base repairs. Accordingly, without considering other salient elements, performing these two projects in their current sequence would be inefficient. However, if there are safety concerns about the pavement sections in question, a preliminary base repair project may still be allowed to take place before a more intensive capital project involving hot-mix asphalt concrete (HMAC) overlays are conducted. To assess such safety concerns, generating the asset data on condition scores can be relevant to the decision-making process. Thus, before a decision is made to remove any one of these projects, a decision-maker would want to generate this asset data. This explains this functionality in the main module of the planning tool. Upon further investigation, it is observed that project with project ID STFFTW2018043731 is planned in the fiscal year 2018 and the project is planned for a length of 18 miles. On the other hand, the project with project ID 709020 is planned in the fiscal year 2020 and the length of the project is 4.51 miles. Analysis of spatial limits of these projects highlights that the spatial limits of the project 709020 are encompassed within the spatial limits of the project STFFTW2018043731. This is further corroborated by the fact that spatial overlap (4.51 miles) between these two projects is equal to the length of the smaller project. Since a project is planned by the maintenance functional group on the same pavement section in the year 2018, the capital planning group might decide to delete the project it had planned in the year 2020. Thus, the response action here will be to remove the project. The removal of the project would free up the appropriate budget available with the capital planning group. This, in turn, will give them an opportunity to plan another project which could not be planned originally due to funding constraints. This explains the importance of having an element of budgeting in the integrated planning framework. It is noteworthy that the addition of a new project might lead to additional conflicts and it is important to carry out the entire process iteratively unless all unplanned conflicts are removed.
In contrast, Conflict 2 appears to be a planned conflict between a seal coat project and a base repair project—base repairs are occasionally planned as preparatory work for the application of seal coats on roadways. They are both scheduled to occur on the same pavement section with a conflict length of 3.41 miles. Accordingly, the response action for this conflict would be “No Action.” It will be treated as a planned conflict. While the seal coat project is funded by the capital planning group's budget, the base repair project is funded by the maintenance group's budget. Thus, ensuring that the letting dates of these projects are selected to create an optimal sequence of activities is essential. However, if this conflict was not planned, the decision-making process described for Conflict 1 will have to be followed again to ensure that no safety issues arise when making modifications to the projects' information.
Conflict 10 is another conflict worth discussing. The project IDs of the conflicting projects suggest that this is an intra-functional group conflict because both projects are proposed by the capital planning functional group. The two projects are scheduled to occur in the same year and over 9.165 miles. The first conflicting project involves an HMAC overlay and pavement markings while the other project involves a milled edge line and center-line rumble strips. Rumble strips are a road safety installation that is used to alert inattentive drivers that are drifting away from the designated lanes. Thus, here again, these conflicting projects can either complement each other or represent a genuine unplanned conflict. If these projects are complementary projects, it will be important to ensure that the time gap between these two projects is appropriate to carry out these projects in an optimal sequence. If that is not true, the response action would be to change the temporal information (fiscal years) of these projects. The change in temporal information would affect the annual budget utilized for these fiscal years and that might trigger changes in the planned projects. Thus, it is important to consider budget information while taking these important conflict resolution decisions.
In summary, being able to document conflicting projects and their corresponding contextual information allows decision-makers the opportunity to identify, assess, and develop a response action to these spatial conflicts. It is expected that sometimes the response action can be doing nothing. However, in cases where a genuine inter-project conflict exists, the planning tool provides a structured way for the responsible actor to remediate the conflict. The results and subsequent discussion of this case study confirm the competency of the planning tool in its ability to support cross-functional planning tasks in a real-world setting.
Visualization in GIS Module
The GIS Module was used to visualize the scenario of candidate projects planned by the capital planning group and the maintenance functional group. GIS Module can assist the decision-makers to visually confirm the spatial extents of the planned projects in the ArcMap component of ArcGIS. The projects planned by the capital group (cyan color) and the maintenance group (magenta color) in the case study are represented on the district map using GIS (Figure 8). The overlaps of the cyan color and the magenta color represents highway locations where different functional groups have planned projects on the same highway segment. Thus, spatial overlaps (conflicts) existing in the current scenario of projects can be visualized at a glance with the help of the GIS module. Moreover, the decision-maker can click on any of these projects and view the contextual information linked to these projects. This will assist the decision-maker in making an informed decision when resolving these conflicts.

Figure 8. GIS Map representing the projects planned by maintenance and capital groups.
Validation
This section details the validation processes that were employed to assess the efficiency, usefulness, information completeness, and usability of the developed framework and tool. The validation processes included a Charrette test, performing statistical analysis on the Charrette test results, and eliciting feedback from SMEs after using the tool.
Charrette Test
The goal of a Charrette test is to determine whether a process is performed better by using a proposed tool or by using a status quo set of tools or processes. It is a “comparative empirical method” that has been applied for the evaluation of processes or tools as part of the design validation process (Clayton et al., 1998). The proposed set of tools can be either computer-aided or manual, and the overarching hypothesis is that the new tool outperforms the existing practices or set of tools in performing a particular set of tasks. More often than not, the speed and quality of completing tasks or making decisions are used as proxies for measuring the effectiveness of the proposed set of tools. In this study, the speed and accuracy of generating contextual information to guide cross-functional planning decisions were the focus of the exercise.
The implementation context of the Charrette test involved planning between two functional groups (maintenance and capital planning) of a district of an SHA (TxDOT). Fifty candidate projects were selected from each functional group, resulting in a total of 100 candidate projects. For this cross-functional exercise, 10 participants were chosen from a pool of graduate students in the Civil, Architectural, and Environmental Engineering Department at the University of Texas at Austin who had industry experience (in all, these participants had a total of 38 years of project and/or infrastructure management experience). This sample size is in accordance with prior studies that have conducted Charrette tests on the use of tools for supporting decision-making in the infrastructure management domain (Koo et al., 2007; Kim et al., 2018). The participants were required to correctly identify the 10 spatial-temporal conflicts that existed among the candidate projects. Additionally, the participants were required to extract two types of contextual information for each identified conflict. The tasks assigned as part of the Charrette test were as follows.
1. Identify spatial conflicts between pairs of candidate highway projects in a four-year plan. The specific attributes to be extracted included the conflicting project IDs, the project description, and the highway name on which the conflict was going to occur on.
2. Compute the conflicting pavement section length (i.e., the overlapping section over which both projects are scheduled to occur) as shown in Figure 6.
3. Compute the time gap (i.e., the absolute difference in the fiscal years of the pair of projects that are spatially conflicting).
In the first experiment, the participants were required to complete these tasks in a general MS Excel environment using any commands or functions that they were familiar with—a process representing the way practitioners currently perform the task. In the second round, the participants completed the exercise by using the developed tool for performance comparison. The computer used in the study had a Windows 10 operating system with an Intel Core i7-4710MQ CPU @ 2.50 GHz, and 16 GB of RAM. As mentioned earlier, the evaluation measures for this test are usually speed and accuracy. Adapting these measures to metrics in this study, speed was calculated as the amount of time participants spent completing the tasks by using a general Excel environment (status quo) vs. using the planning tool. Similarly, accuracy was measured as the number of conflicts correctly identified and the percentage of contextual information (conflict length and time gap) that participants correctly computed. The raw results of the Charrette test are presented in Table 1. A preliminary look at the results in Table 1 suggests that performing cross-functional planning tasks with the developed tool is faster (on an average it takes 37 min less) and more accurate (an average of 26.58% more) than the status quo approach. The average improvement in accuracy is calculated as a fraction of additional accurate information obtained with the help of the tool divided by the number of contextual information that was accurately extracted without using the tool. It can also be observed that participants correctly identified 13.6% more spatial conflicts than when using the status quo process. Furthermore, participants' performance is more consistent when using the planned tool vs. otherwise. Thus, the use of this tool for cross-functional planning will mitigate the impact of errors made by planners who are not as knowledgeable about the tasks to be performed. However, without a robust statistical analysis of these results, it is not possible to determine if these differences in performance are statistically significant. Thus, a statistical analysis of the results of the test is presented next.
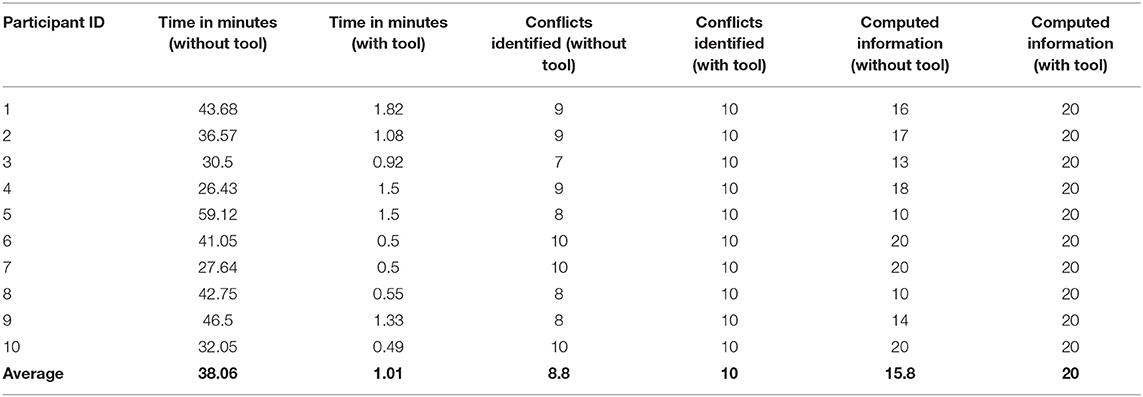
Table 1. Raw results of the Charrette test.
Statistical Analysis of Charrette Test Results
This section presents the hypotheses and statistical tests performed on the raw results from the Charrette test performed earlier. Based on the tasks completed in the test, the three hypotheses investigated are presented as follows:
Hypothesis 1:
H0: there is no significant difference between the time it takes for participants to perform the tasks with or without the planning tool.
H1: there is a significant difference in time.
Hypothesis 2:
H0: there is no significant difference between the number of conflicts identified by participants with or without the planning tool.
H1: there is a significant difference in the conflicts identified.
Hypothesis 3:
H0: there is no significant difference between the accuracy of contextual information computed by participants with or without the planning tool.
H1: there is a significant difference in the accuracy of contextual information.
Since the hypotheses described above refer to repeated measures of the same tasks using two different sets of tools, the paired samples t-test was used for evaluating the statistical significance of the differences observed in the study (Stoppel and Leite, 2013). To use this test, three assumptions must hold true. First, the repeated observations in the dependent variable must be independent of one another. Secondly, the dependent variable has to be ordinal or ratio-scale data with no outliers. Finally, the dependent variable has to be normally distributed. The first two assumptions hold true based on the design of the test and the random selection of test participants. A violation of the normality assumption (using the Shapiro-Wilk Test) led to a change in the test to be conducted in hypotheses 2 and 3. The non-parametric equivalent of the paired t-test was used for these hypotheses. The Wilcoxon signed-rank test is a non-parametric test that can be used to test the median difference in related samples and does not require a normal distribution in the dependent sample (Fox, 2018).
As observed in Table 2, the p-values for hypotheses 1, 2, and 3 are 0.001, 0.016, and 0.018, respectively. Accordingly, all the null hypotheses were rejected (at a p-value of 5%) indicating that there is a statistically significant difference between the participants' speed and accuracy of performing cross-functional planning tasks when they used the tool vs. otherwise. More specifically, the results for hypothesis 1 suggest that the test participants were significantly faster at completing the exercise with the tool than otherwise. In fact, most participants commented that the exercise without the tool was laborious and time-consuming. This makes it error-prone. For highway agencies that have limited human resources and, consequently, limited staff time, this finding suggests that this tool can be used to make cross-functional planning more efficient.
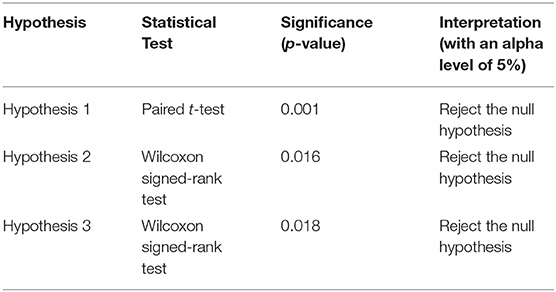
Table 2. Summary of statistical analysis of Charrette test results.
Furthermore, the statistical result of hypothesis 2 suggests that participants were significantly identifying more conflicts with the tool than without the tool. This finding has direct implications on the economic value of the tool in terms of decision-making. The identification of spatial conflicts before a project is executed means that more projects that are redundant can be identified and eliminated, resulting in greater savings of public funds. Finally, the statistical result of hypothesis 3 suggests that the contextual information that can be used to guide decision-making about the conflicts identified was more accurately computed while using the tool than otherwise. This is further supported by comments by participants about how the fatigue of the status quo process could lead to errors in computation or visual judgment errors. Computing accurate contextual information means that decision-makers can choose optimal responses to address spatial conflicts identified in the list of candidate projects.
Expert Validation
For this validation phase, a face-to-face meeting with a panel of six SMEs was arranged to demonstrate the tool on an original set of highway projects. The goal of this activity was to evaluate the degree of consensus among these experts on the content, usefulness, and usability of the planning tool. The candidate projects were proposed by different functional groups in the same agency (a TxDOT district). A smaller set of 20 projects equally split between the maintenance and capital planning functional groups was used for this evaluation. The SMEs present at the meeting had an average of 16 years of industry experience in transportation planning and development (TP&D), maintenance, safety, and highway asset operations. The titles of the experts included Director of Maintenance, Director of TP&D, Advanced Planning Director, Planning Coordinator, and Pavement Engineer. The perspectives of the SMEs were elicited before, in between, and at the end of the case demonstration described above. The validation process included three main components: (1) the perceived benefits of the tool, (2) the completeness of the information content and (3) a rating on the degree of the usefulness of the tool. Following is a summary of the evaluation questionnaire and responses.
What Are the Potential Benefits of This Tool?
All the SMEs agreed that the tool was useful for identifying spatial conflicts in the proposed projects by respective functional groups. They also pointed out that the tool can be used for confirming intentional conflicts for complementary projects (for example, a “level-up” preceding a “seal coat” project) and a visual confirmation of the spatial limits of proposed projects. More importantly, the tool allowed a more comprehensive response to the conflicts identified by integrating information from the relevant asset and other planning information. Next, five SMEs pointed out that this tool could be useful in bundling conflicting projects, where possible, to save on mobilization costs. This would mean that if a pair of projects were planned to occur on the same section around the same time period, decision-makers could consider the possibility of letting those projects together as one contract. Furthermore, it was also pointed out that the tool can be used to ensure that proposed projects from different area (local) offices were combined more efficiently. Explicitly, the SMEs explained that local offices could check for conflicts in their list of projects before submitting it to a higher-level (District) office for inclusion in the projects plan.
What Additional Information Has to Be Added to Make the Tool Effective? Any Relevant Information Missing?
The goal of this question was to evaluate the completeness of the information provided in the tool. In general, all of the SMEs agreed that this tool had most of the information items needed to perform cross-functional planning tasks. One SME suggested the inclusion of the project's funding agency (e.g., at the state level, the SHA's Safety Division might be funding projects that qualify as safety improvement). This concern was addressed in the updated version of the planning tool to represent the different funding categories, which are usually tied to several sources or sub-functional groups.
On a Scale of 1 (Least Useful) to 5 (Very Useful), How Useful Is the Tool for Supporting Integrated Planning? Any Comments on the Degree of Usefulness or Otherwise?
Three SMEs assigned a score of 5.0/5.0 for the usefulness rating and the other three assigned a score of 4.0/5.0 for the usefulness rating. These ratings yielded an average rating of 4.5/5.0, indicating that the tool is generally considered useful for the performance of cross-functional planning of highway projects. One SME commented that “it is a handy tool to be utilized by different users managing different portfolios or programs.”
Overall, the SMEs found the tool to be useful, easy-to-use, intuitive, and complete (in terms of the information content required). SMEs were able to identify inter-project conflicts, generate contextual information, and develop cost-effective responses to address the spatial conflicts identified in different scenarios. Efficiently performing these tasks can ultimately lead to more efficient and effective use of the always limited resources: public funds and human resource hours.
Conclusion
Often multiple functional groups are working in the same highway agency proposing projects on the same infrastructure network. Accordingly, spatial conflicts can arise between projects proposed by these separate groups. The ability to identify and address these spatial conflicts is challenged by the heterogeneity of project information systems used by individual functional groups and the dynamic nature of highway projects information. This notwithstanding, the extant literature has been silent on integrated frameworks that can be used to detect and contextualize inter-project conflicts in a program of highway projects. To address this gap, this study proposed a framework to aid in a proactive and cross-functional approach to the planning of highway projects. The developed framework was implemented by developing a user-friendly tool for decision-makers. A case study demonstration was used to show the practical use of the tool in cross-functional planning tasks. Furthermore, robust validation checks, including Charrette tests, corresponding statistical tests, and expert validation, were conducted.
The proposed framework and the resulting planning tool contribute to the body of knowledge and practice in three ways. First, the tool provides a standardized form for information on highway projects proposed by multiple functional groups working in the same agency. Secondly, it documents the relevant asset and project information that should be generated and curated to support cross-functional planning. For highway agencies transitioning to the use of integrated information systems to enhance their collaborative planning, this framework usefully details relevant information requirements to improve the process. Thirdly, the developed planning tool can help more accurately identify inter-project conflicts and compute contextual information needed to make more cost-effective decisions. Furthermore, the tool provides a standard format for documenting potential responses to identified conflicts in a list of priority projects. Overall, as demonstrated in the case study, the developed tool significantly improves the complex iterative planning processes.
Future extensions of this framework can include the development of explicit rules to differentiate between planned and unplanned conflicts. This can be achieved by interviewing experts for different conflict scenarios and documenting the information references that are used as part of the decision-making process. For example, seal coat (preventive maintenance) projects are often preceded by seal coat preparatory works, like milling, base repair, and edge leveling projects (as in the case study). Including these rules in the tool can significantly reduce the number of inter-project conflicts that need to be reviewed by decision-makers. It can also improve an agency's scheduling process to ensure that projects that have dependent relationships are scheduled to occur in the correct sequence. This notwithstanding, the current implementation of the framework already provides sufficient information to support cross-functional planning of highway projects proposed by multiple functional groups working on the same asset network.
Data Availability Statement
The datasets generated for this study are available on request to the corresponding author.
Author Contributions
JF-M and CK: principal authors, framework creators, and writing of the manuscript. WO'B and NK: research design, manuscript writing, and overall guidance. RG: defining problem statement, data, validation, and writing of manuscript.
Funding
Open access fees will be paid from University funds. The research is sponsored by TxDOT under IAC 2644089712 (Ft Worth District).
Conflict of Interest
The authors declare that the research was conducted in the absence of any commercial or financial relationships that could be construed as a potential conflict of interest.
References
Arif, F., Bayraktar, M. E., and Chowdhury, A. G. (2015). Decision support framework for infrastructure maintenance investment decision making. J. Manag. Eng. 32:04015030. doi: 10.1061/(ASCE)ME.1943-5479.0000372
Chi, S., Hwang, J., Arellano, M., Zhang, Z., and Murphy, M. (2013). Development of network-level project screening methods supporting the 4-year pavement management plan in Texas. J. Manag. Eng. 29, 482–494. doi: 10.1061/(ASCE)ME.1943-5479.0000158
Colorado Department of Transportation. (2016). Where Colorado DOT Spends Transportation Dollars - GIS Map. Available online at: http://dtdapps.coloradodot.info/otis/YCD/Where (accessed August 6, 2019).
De La Garza, J. M., Akyildiz, S., Bish, D. R., and Krueger, D. A. (2011). Network-level optimization of pavement maintenance renewal strategies. Adv. Eng. Inform. 25, 699–712. doi: 10.1016/j.aei.2011.08.002
Fox, C. R. (2018). A Case for Statistical Thinking, Not Just Statistical Technique: Using Non-Parametric Techniques Appropriately. London: SAGE Publications Ltd.
France-Mensah, J., and O'Brien, W. J. (2018). Budget allocation models for pavement maintenance and rehabilitation: comparative case study. J. Manag. Eng. 34:05018002. doi: 10.1061/(ASCE)ME.1943-5479.0000599
France-Mensah, J., and O'Brien, W. J. (2019). Formalized knowledge representation to support integrated planning of highway projects. Adv. Inform. Comput. Civil Constr. Eng. 29, 59–66. doi: 10.1007/978-3-030-00220-6_8
France-Mensah, J., O'Brien, W. J., and Khwaja, N. (2018a). Impact of multiple highway categories and project eligibility restrictions on pavement performance. J. Infrastructure Syst. 25:04018037. doi: 10.1061/(ASCE)IS.1943-555X.0000458
France-Mensah, J., O'Brien, W. J., Khwaja, N., and Bussell, L. C. (2018b). GIS-based visualization of integrated highway maintenance and construction planning: a case study of Fort Worth, Texas. Vis. Eng. 5:7. doi: 10.1186/s40327-017-0046-1
Fusch, P. I., and Ness, L. R. (2015). Are we there yet? Data saturation in qualitative research. Qual. Rep. 20, 1408–1416. Retrieved from: http://nsuworks.nova.edu/tqr/vol20/iss9/3
Gao, L., Xie, C., Zhang, Z., and Waller, S. T. (2012). Network-level road pavement maintenance and rehabilitation scheduling for optimal performance improvement and budget utilization. Computer-Aided Civil Infrastructure Eng. 27, 278–287. doi: 10.1111/j.1467-8667.2011.00733.x
Gharaibeh, N. G., Chiu, Y.-C., and Gurian, P. L. (2006). Decision methodology for allocating funds across transportation infrastructure assets. J. Infrastructure syst. 12, 1–9. doi: 10.1061/(ASCE)1076-0342(2006)12:1(1)
Gibson, E. G., and Whittington, D. A. (2009). Charrettes as a method for engaging industry in best practices research. J. Constr. Eng. Manag. 136, 66–75. doi: 10.1061/(ASCE)CO.1943-7862.0000079
Hector-Hsu, J., Kniss, V., Cotton, B., Sarmiento, M., and Chang, C. (2012). Best Practices in Geographic Information Systems-Based Transportation Asset Management. Federal Highway Administration; US Department of Transportation. Available online at: https://rosap.ntl.bts.gov/view/dot/9877
Kim, J. I., Fischer, M., and Kam, C. (2018). Generation and evaluation of excavation schedules for hard rock tunnels in preconstruction and construction. Autom. Constr. 96, 378–397. doi: 10.1016/j.autcon.2018.09.022
Koo, B., Fischer, M., and Kunz, J. (2007). A formal identification and re-sequencing process for developing sequencing alternatives in CPM schedules. Automa. Constr. 17, 75–89. doi: 10.1016/j.autcon.2007.03.005
Larsen, J. K., Shen, G. Q., Lindhard, S. M., and Brunoe, T. D. (2015). Factors affecting schedule delay, cost overrun, and quality level in public construction projects. J. Manag. Eng. 32:04015032. doi: 10.1061/(ASCE)ME.1943-5479.0000391
Le, T., and Jeong, H. D. (2016). Interlinking life-cycle data spaces to support decision making in highway asset management. Automation in Construction, 64, 54–64. doi: 10.1016/j.autcon.2015.12.016
Le, T., Le, C., and David Jeong, H. (2018). Lifecycle Data Modeling to Support Transferring Project-Oriented Data to Asset-Oriented Systems in Transportation Projects. J. Manag. Eng. 34:04018024. doi: 10.1061/(ASCE)ME.1943-5479.0000620
Lee, J., and Madanat, S. (2015). A joint bottom-up solution methodology for system-level pavement rehabilitation and reconstruction. Transport. Res. Part B Methodol. 78, 106–122. doi: 10.1016/j.trb.2015.05.001
Li, Z., and Madanu, S. (2009). Highway project level life-cycle benefit/cost analysis under certainty, risk, and uncertainty: methodology with case study. J. Transport. Eng. 135, 516–526. doi: 10.1061/(ASCE)TE.1943-5436.0000012
Medina, A., Flintsch, G., and Zaniewski, J. (1999). Geographic information systems-based pavement management system: a case study. Transport. Res. Rec. 1652, 151–157.
Menendez, J. R., and Gharaibeh, N. G. (2017). Incorporating risk and uncertainty into infrastructure asset management plans for pavement networks. J. Infrastr. Syst. 23:04017019. doi: 10.1061/(ASCE)IS.1943-555X.0000379
Ng, M., Zhang, Z., and Waller, S. T. (2011). The price of uncertainty in pavement infrastructure management planning: an integer programming approach. Transport. Res. Part C Emerg Technol. 19, 1326–1338. doi: 10.1016/j.trc.2011.03.003
North Dakota Department of Transportation. (2016). NDDOT-GIS. Available online at: https://www.dot.nd.gov/business/gis-mapping.htm (accessed August 06, 2019).
Oyeka, I. C. A., and Ebuh, G. U. (2012). Modified Wilcoxon signed-rank test. Open J. Stat. 2:172–176. doi: 10.4236/ojs.2012.22019
Parida, M., Sanjiv, A., and Sukhvir Singh, J. (2005). “Enhancing pavement management systems using GIS,” in Proceedings of the Institution of Civil Engineers-Transport (London), vol. 158, 107–113. doi: 10.1680/tran.2005.158.2.107
Porras-Alvarado, J. D., Han, Z., Al-Amin, M., and Zhang, Z. (2016). Fairness and efficiency considerations in performance-based, cross-asset resource allocation. Transport. Res. Rec. 2596, 19–27. doi: 10.3141/2596-03
Qiao, Y. J., Fricker, J. D., Labi, S., and Mills, T. (2018). Bundling bridge and other highway projects: patterns and policies. Transport. Res. Rec. 2672, 167–178. doi: 10.1177/0361198118797804
Rydholm, T. C., and David, R. L. (2015). “Visualizing pavement management data at the project level,” in 9th International Conference on Managing Pavement Assets (Alexandria, VA).
Stoppel, C. M., and Leite, F. (2013). Evaluating building energy model performance of LEED buildings: identifying potential sources of error through aggregate analysis. Energy Build. 65, 185–196. doi: 10.1016/j.enbuild.2013.04.016
Torres-Machi, C., Pellicer, E., Yepes, V., and Chamorro, A. (2017). Towards a sustainable optimization of pavement maintenance programs under budgetary restrictions. J. Cleaner Prod. 148, 90–102. doi: 10.1016/j.jclepro.2017.01.100
Woldesenbet, A., Jeong, H. D., and Park, H. (2016). Framework for integrating and assessing highway infrastructure data. J. Manag. Eng. 32:04015028. doi: 10.1061/(ASCE)ME.1943-5479.0000389
Wu, Z., Flintsch, G., Ferreira, A., and Picado-Santos, L. de. (2012). Framework for multiobjective optimization of physical highway assets investments. J. Transport. Eng. 138, 1411–1421. doi: 10.1061/(ASCE)TE.1943-5436.0000458
Yuan, C., McClure, T., Cai, H., and Dunston, P. S. (2017). Life-cycle approach to collecting, managing, and sharing transportation infrastructure asset data. J. Constr. Eng. Manag. 143:04017001. doi: 10.1061/(ASCE)CO.1943-7862.0001288
Keywords: highway project, highway agency, cross-functional planning, conflict analysis, Charrette test
Citation: France-Mensah J, Kothari C, O'Brien WJ, Khwaja N and Gonzalez R (2019) Framework for Spatial-Temporal Cross-Functional Planning of Projects by Highway Agencies. Front. Built Environ. 5:120. doi: 10.3389/fbuil.2019.00120
Received: 27 June 2019; Accepted: 26 September 2019;
Published: 11 October 2019.
Edited by:
Adel Francis, École de technologie supérieure (ÉTS), CanadaReviewed by:
Yulong Li, Central University of Finance and Economics, ChinaShuichi Ishida, Tohoku University, Japan
Copyright © 2019 France-Mensah, Kothari, O'Brien, Khwaja and Gonzalez. This is an open-access article distributed under the terms of the Creative Commons Attribution License (CC BY). The use, distribution or reproduction in other forums is permitted, provided the original author(s) and the copyright owner(s) are credited and that the original publication in this journal is cited, in accordance with accepted academic practice. No use, distribution or reproduction is permitted which does not comply with these terms.
*Correspondence: William J. O'Brien, d2pvYkBtYWlsLnV0ZXhhcy5lZHU=