 Lucy Kavi*
 Jair Sinisterra
 Coline Bodenreider
 Meslech Bellay
 Kamran Ayub
 Vivek Ravichandran
 Jan-Michael Archer
 Sacoby Wilson
- Maryland Institute of Applied Environmental Health, University of Maryland School of Public Health, College Park, MD, United States
Lack of access to a health-promoting food environment can lead to poor health outcomes including obesity which is a problem for African-Americans in Prince George's County, Maryland. Previous research examined the quality of the food environment at the regional level but did not consider local level indicators. In this study, we utilized an environmental justice framework to examine the local food environment in the County. We collected data from 127 food outlets (convenience stores, grocery stores, and supermarkets), in three racially and socioeconomically diverse communities—Bladensburg (predominantly African American/ Black, with the lowest median household income); Greenbelt (similar percentage of non-white persons as Hyattsville, with the highest median household income); and Hyattsville (dominated by a Hispanic population). We examined the availability, quality, and accessibility of food within each community, using a modified version of the Johns Hopkins Center for a Livable Future (CLF) healthy food availability index (HFAI).We also used ArcMap 10.6 to examine the spatial distribution of stores in relation to sociodemographic factors and generate descriptive statistics to examine HFAI score differences across the communities, sociodemographic composition, and store types at the block group level. Mean HFAI scores were 7.76, 10.75, and 9.60 for Bladensburg, Greenbelt, and Hyattsville, respectively, suggesting a relative disparity in access to diverse healthy and good quality food sources for these communities although these differences were not statistically significant (p = 0.79). Statistically significant differences between the communities were found with respect to ethnic stores, stores that sold fresh vegetables (p = 0.047), and stores that sold fresh fruits (p = 0.012). Getis-Ord Gi Hot Spot Analysis revealed one statistically significant cold spot at 95% confidence, and two others at 90% confidence in Hyattsville, indicating a cluster of low-scoring stores. The results indicate a potential need for expanded food infrastructure in these communities to improve public health. We also identified the need for culturally appropriate foods and proposed ethnic stores as potential salutogens to improve the food environment in culturally diverse neighborhoods.
Introduction
Limited availability and access to supermarkets, farmers' markets, and other food outlets that provide healthy, affordable food options is an environmental justice challenge for many Americans (Walker et al., 2010; Hilmers et al., 2012). Lack of access to affordable, healthy food can contribute to community stress and deprivation, and can lead to diet-related chronic diseases such as obesity and cardiovascular disease (Walker et al., 2010). There are an increasing number of communities, defined as food deserts, where residents find it difficult to buy affordable, quality, and fresh food, often due to the lack of nearby supermarkets (Luan et al., 2015). Similarly, some communities, defined as food swamps, have an abundance of unhealthy food options, such as convenience stores and fast food restaurants, that are more readily available and accessible than healthy food outlets such as supermarkets (Luan et al., 2015). More often than not, communities that are food deserts and food swamps tend to be low-income and/or have a high percentage of people of color (Zenk et al., 2005; Powell et al., 2007b).
The local food environment plays a critical role in determining individual and community health. It can play a salutogenic (health-promoting) or pathogenic (health-restricting) role in community ecosystems (Wilson, 2009). There is a need for salutogenic features of the built environment that promote and maintain health or prevent disease (Wilson, 2009). A model food environment should provide available, accessible, inexpensive, and suitable food (Wrigley, 2002). Research has shown that the choice of food is influenced by price and physical access to food outlets in the immediate neighborhood of the consumer (Furey et al., 2001).
Disparities in the built environment put low-income people of color at an increased risk for an unhealthy diet. In these neighborhoods the distance between homes and convenience stores, the concentration of convenience stores, and the availability of supermarkets are important factors to consider when assessing why residents suffer from food insecurity (Kaufman, 1998; Chung and Myers, 2005; Hendrickson et al., 2006; Walker et al., 2010). One study found that the availability of supermarkets in African-American neighborhoods was approximately half that of White neighborhoods, with even fewer chain supermarkets available in urban African-American neighborhoods (Powell et al., 2007b).
Several studies found neighborhoods with a large population of people of color had fewer supermarkets compared to predominantly White neighborhoods (Alwitt and Donley, 1997; Moore and Diez Roux, 2006; Powell et al., 2007b; Franco et al., 2008; Galvez et al., 2008). Seventy-six percent of Detroit's most impoverished neighborhoods had a high proportion of African-American residents. Besides, impoverished African-Americans neighborhoods were located 1.1 miles farther from the closest supermarket and had 2.7 fewer supermarkets within a three-mile radius compared to impoverished White neighborhoods (Zenk et al., 2017). Block determined that Black neighborhoods had 2.4 fast-food restaurants per square mile compared to 1.5 fast-food restaurants in White neighborhoods in Louisiana (Block et al., 2004). Spatial analysis of supermarkets and fast food outlet availability in South Carolina, a large rural state with a high proportion of people of color, determined that block groups without supermarkets tended to have lower incomes and home values and more people of color (Lamichhane et al., 2013).
Low-income residents often have difficulty affording transportation, further restricting access to supermarkets located outside their immediate locality (Kaufman, 1998; Guy et al., 2004; Hendrickson et al., 2006) For example, in Prince George's County, Maryland, 16% of residents reported that grocery stores were too far and posed a food access challenge, and ~44% of residents live in USDA designated food deserts, where the population lives more than 0.5 miles away in urban areas and 10 miles away from a supermarket in rural areas.
Moreover, it is widely accepted that low-income communities and communities of color are disproportionately affected by increased rates of morbidity, mortality, and adverse health outcomes (Cubbin et al., 2001; Deaton and Lubotsky, 2003). These health disparities may be linked to neighborhood deprivation and the tendency of these communities to have fewer supermarkets compared to the number of small convenience stores (Morland et al., 2002; Larson et al., 2009). For instance, Weinberg found that the highest income neighborhoods in Philadelphia had 156% more supermarkets than the lowest income neighborhoods (Weinberg, 1995). He also determined that residents of low-income neighborhoods that lacked access to supermarkets had a greater prevalence of negative health outcomes including diabetes, heart disease, and cancer (Weinberg, 1995). In Chicago, African-American neighborhoods with food deserts had a high incidence of negative health outcomes (Mari Gallagher Research Consulting Group, 2006) including diabetes, obesity, cardiovascular disease and hypertension and hypertension. Additionally, several studies found that residents of areas that had greater access to grocery stores had lower BMIs and obesity rates than neighborhoods with less access (Powell et al., 2007a; Galvez et al., 2008; Larson et al., 2009; Zick et al., 2009; Tang et al., 2014; Zenk et al., 2017).
In Prince George's County, African-Americans bear a disproportionate burden of obesity, a negative health outcome that is strongly related to diet and food access. Between 2004 and 2008, close to 1 in 3 African-Americans in Prince George's County were classified as obese, compared to 1 in 5 non-Hispanic Whites (Sogie-Thomas et al., 2018). The obesity rates in the County may be due to disparities in the distribution of food outlets (Santo et al., 2015) and disparities in the quality and price of products these stores carry (The Maryland-National Capital Park Planning Commission, 2015).
While similar research has been conducted using Healthy Food Availability Index (HFAI) scores to observe inequities in food accessibility in Prince George's County as a whole (The Maryland-National Capital Park Planning Commission, 2015), no community-level analysis has been conducted. Analysis at a smaller geographic unit (i.e., block group level) is warranted because communities have unique issues, demographics, and local regulations that affect the food environment. These factors may not be adequately captured at the census tract level. To analyze how different characteristics at the neighborhood level influence the food environment in Prince George's County, we focused on three communities: Bladensburg, Greenbelt, and Hyattsville. We determined the availability, quality, and accessibility of healthy foods across each community using HFAI scores. Our analysis was conducted at the block group level instead of census tract level as seen in previous work (Center for Livable Future, 2010; The Maryland-National Capital Park Planning Commission, 2015). The block group level assessment presents a more nuanced analysis that represents neighborhood level differences that are locally relevant and could impact the food environment. Based on previous literature, we hypothesize that Bladensburg, the community with the highest level of household poverty and highest percent people of color would have the poorest mean food score; and Greenbelt, the community with the lowest level of household poverty would have the highest mean food score.
Methods
Spatial Mapping of Food Stores
We first secured a 2017/2018 dataset of stores that sold food in Prince George's County from the Maryland Food System Map created by the Johns Hopkins Center for a Livable Future (CLF) (Center for Livable Future, 2010). We also obtained a dataset of chain fast food stores for the county from the same source. We mapped median household income and percentage of non-White individuals for all block groups in Prince George's County, Maryland using ArcMap 10.6 (ESRI, Inc., Redlands, CA). Data for median household income and percentage non-White were obtained from the 2013–2017 American Community Survey (ACS) using the American FactFinder database. Percent non-White and median household income were divided into quartiles, mapped, and overlaid with locations of food stores in each town. All layers were projected using the NAD 1983 (2011) State plane FIPS 1,900 (meters) coordinate system. We then examined the spatial distribution of food stores and mapped the scores that were generated for each store using a modified version of CLF's Healthy Food Availability Index (HFAI) (Center for Livable Future, 2010).
We also conducted spatial analysis of sociodemographic (SOD) factors obtained from the 2013–2017 ACS data. The Getis-Ord Gi Hot Spot Analysis tool available in ArcToolbox's Spatial Statistics Tools was used to measure statistically significant clustering of stores and their scores. The Getis-Ord Gi Hot Spot Analysis used fixed distance band method as its method for conceptualizing spatial relationships, Euclidean distance as the distance method, and a threshold distance of 3080.14 meters. We used a threshold distance of 3080.14 meters, as this was the shortest distance at which every store had at least one neighbor.
In addition, the proportion of community residents and percent non-White individuals living within a half mile of all food stores was determined in ArcGIS. A half-mile Euclidean distance buffer was drawn around each food store type and chain fast food outlet; residents living in a census block group intersecting at least one of these buffers were considered within a half-mile of a store of that type. We also determined the average distance from the centroid of each block group to food stores, chain fast foods, and high scoring stores. It was important to assess distance to fast food outlets in addition to food stores because fast food outlets are nutritional sources that can adversely affect health in an economically disadvantaged neighborhood since they are typically devoid of fresh fruits and vegetables. Since distance is being considered as a proxy for access in this context, it was important to assess the distance to fast food outlets as it could serve as a competing feature in the food environment and proximity and better access to these outlets rather than to health promoting food stores such as supermarkets could prove detrimental to health in a community.
A Kruskal-Wallis test was used to test whether the median SOD features in these communities were statistically different. This test was chosen over the one-way ANOVA test because of the non-normality distribution of these features. Statistically significant tests were followed by Dunn's test to determine which community pairs were different with respect to the SOD feature. This procedure was also repeated for the average distance analysis. All statistical analysis were conducted in R (R Core Team, 2019).
Healthy Food Availability Scoring Process
We visited all stores that sold food in Hyattsville (n = 115, 21 food stores were closed leaving 94 food stores to score), Bladensburg (n = 21, 2 food stores were closed leaving 19 to score), and Greenbelt (n = 18, 4 food stores were closed with 14 food stores to score). Among the store types in each area were supermarkets, small grocery stores, and convenience stores. We also determined whether the scored stores were international food or ethnic food stores. In our analysis, we labeled these two types of stores as ethnic. We adapted the HFAI tool into an electronic store survey using google forms.
We updated the store survey to collect details beyond the presence and absence of certain foods. We collected data on food prices, status of the store (previously in operation, new, or closed), international/ethnic food outlet, and whether they carried alternative milk products such as almond and soy milk. It was important to note these details because they contribute to the overall quality of the store and food environment.
The data gathered by the HFAI tool focused on the presence or absence of twelve different food items, which served as a snapshot of the quality of food available in each store. The selected food items were: (1) fresh fruits, (2) fresh vegetables, (3) 100% fruit juice, (4) canned foods, (5) frozen foods, (6) packaged foods, (7) tilapia, (8) chicken, (9) ground beef, (10) milk, (11) bread, and (12) cereal. We generated scores based on the quality of these items. The HFAI points ranged from 1 to 27.5. Fresh vegetables and fresh fruits received scores ranging from 1 to 5 points (1–3 fruits = 1 point, 4–6 fruits = 2 points, 7–10 fruits = 3 points, 11–25 fruits = 4 points, and >25 fruits = 5 points). Stores received 2 points if they had 2 or more low sugar cereals (defined as <7 g of sugar per serving). Frozen vegetables, frozen fruit, milk, ground beef, lean ground beef, skinless, boneless chicken breast, fish, white bread, 100% whole wheat bread, healthy frozen meals, and low sodium soup each scored 1 point. Canned vegetables, canned fruit, rice, and pasta each received a score of 0.5 points. Our method for generating scores is included in Table 1. Any deformities that persisted among items in a category were noted since they represented a poorer quality of the selected food. For canned foods, frozen and packaged foods, we looked for the availability of healthier options such as low sodium varieties and noted them. We quantified the number of varieties available for fresh vegetables, fresh fruits, seafood, chicken, and ground beef.
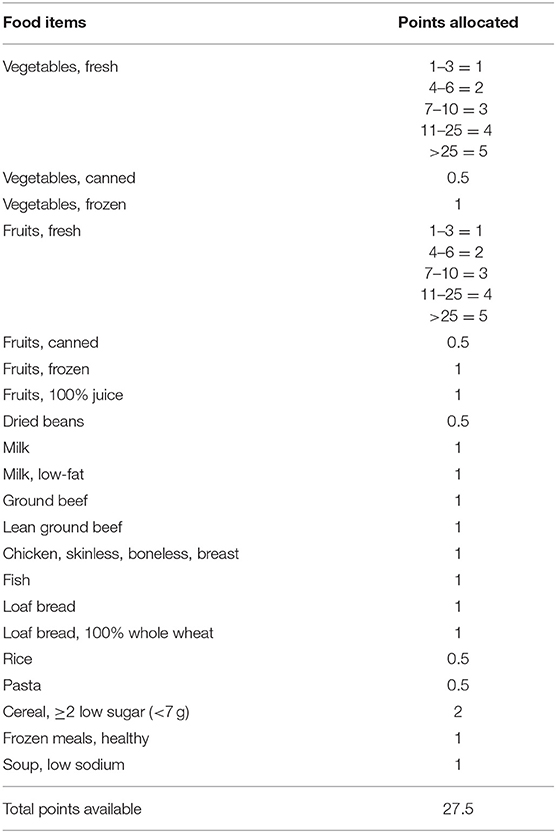
Table 1. Scoring methodology used in the healthy food availability index.
Prices of items were important to note, in order to compare affordability across communities and across store types. For milk, we assessed the presence of whole and low-fat options as well as alternative milk products such as nut-milks since this represented availability based on an individual's dietary requirements. However, nut-milks were not included in the final score. Neither were prices of items included although price was noted. We also noted the availability of healthier bread and cereal options such as 100% whole wheat bread and low sugar cereal products.
Potential scores range from 0 points to 27.5 points. Points were summed for each store, the higher the score, the higher the availability of healthy foods. The food scores for each of the three areas were averaged and compared, as seen below in our results section. The mean score for store types were calculated across communities as shown below as well. Finally, we generated three categories for the scores of the stores—low score (0–4.5), moderate score (>4.5–16.5), and high score (>16.5). These categories were created based on natural breaks in the data.
A team of students were then trained to score select stores individually by following a data collection protocol outlined in a food scoring training guide we created. We assessed inter-rater reliability and test-retest reliability after the initial training and retrained students to ensure consistency in scoring stores. Once trained, students were assigned stores to score across the three communities.
Data Analysis
HFAI scores were generated and described using Stata (StataCorp, 2017). Frequency counts and proportions were determined for the number and type of food stores, as well as the number of stores selling fresh fruits, vegetables, or alternative milks in each community. We also ran Chi-square tests to test for associations between each community and different features of the food environment. For cells with <2 features, Fisher's exact test was used. The three communities differed in population; therefore, we based the community comparison of store distribution on the number of stores per 100,000 residents. Descriptive statistics of SOD features were also determined for each community. A Kruskal Wallis test was used to test whether the distribution of HFAI scores across communities were statistically different.
Results
The team visited 154 stores between October and December 2018. In all, 127 out of the 154 stores visited were scored. This includes the stores used for training which were rescored. The other 27 stores were closed and therefore not scored. Mean store scores were calculated and compared for each of the three communities (Table 2). The mean store score for each community was 7.76, 10.75, and 9.60 for Bladensburg, Greenbelt, and Hyattsville, respectively. Although these scores appeared different, the differences were not statistically significant (p = 0.79). While Greenbelt and Hyattsville had similar profiles for % non-White residents (~76%); Bladensburg had the highest at 96.7%. Median household income values were $44,236, $65,452, and $67,162 for Bladensburg, Hyattsville and Greenbelt, respectively. Hyattsville had the highest number of food stores per 100,000 persons (n = 515) while Greenbelt, the most populous community, had the lowest number per 100,000 persons (n = 59).
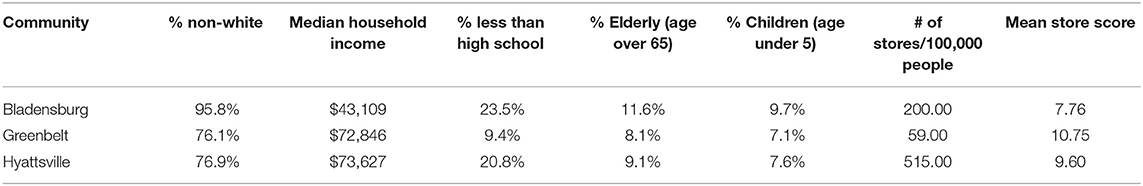
Table 2. Sociodemographic composition and store statistics of study communities.
A total of 21 food stores were visited and 19 were scored in Bladensburg (10 convenience stores, 7 small grocery stores, and 2 supermarkets) with a mean score of 4.45 for convenience stores, 8.29 for small grocery stores, and 22.5 for supermarkets (Table 3). In Greenbelt, we scored 14 (8 convenience stores, 2 small grocery stores, and 4 supermarkets) food stores with a mean score of 4.94 for convenience stores, 4.50 for small grocery stores, and 25.5 for supermarkets. In Hyattsville, 115 food stores were visited and 94 were scored (54 convenience stores, 20 small grocery stores, and 20 supermarkets) with a mean score of 3.65 for convenience stores, 10.13 for small grocery stores, and 25.15 for supermarkets. Out of the 57 chain fast food outlets identified, 48 located in Hyattsville while 1 and 8 located in Bladensburg and Greenbelt, respectively. Thirty-eight stores sold alternative milks, 76% of this number located in Hyattsville. Generally, stores sold fewer fresh vegetables (29–42%) compared to fresh fruits (0.5–0.58%). Associations between community and the provision of fruits (p = 0.012) and vegetables (p = 0.047) for sale were statistically significant (Figure 1).
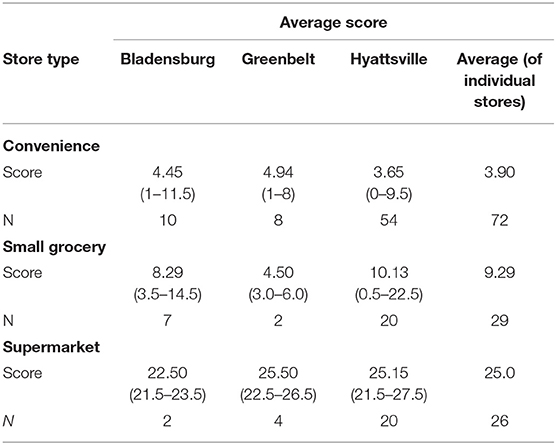
Table 3. Mean HFAI score for each store type in and across study communities.
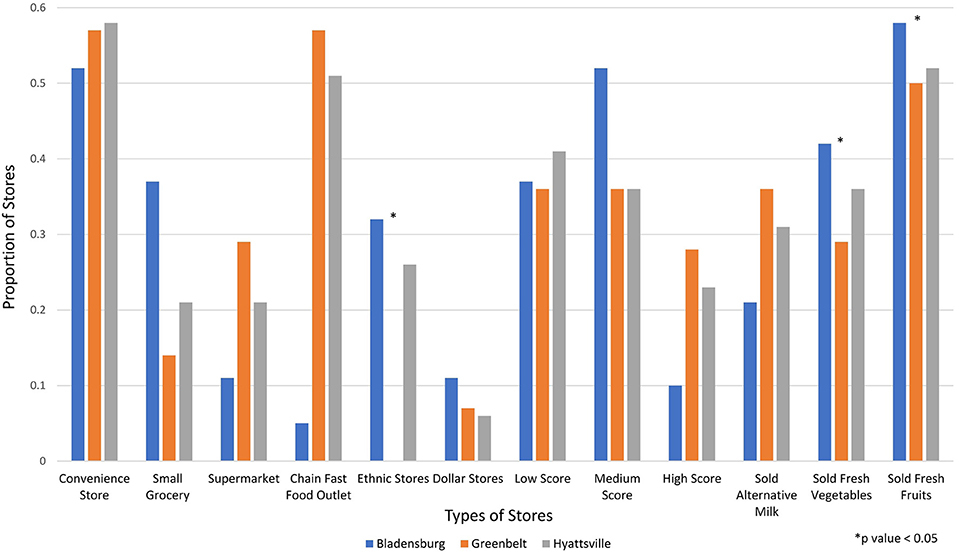
Figure 1. Proportions of different store categories and features across Bladensburg, Greenbelt, and Hyattsville, MD (2018).
Getis-Ord Gi Analysis identified one statistically significant cold spot in Hyattsville at a 95% confidence level (p < 0.05), and two cold spots existed at a 90% confidence level (p < 0.1) (Figure 2). Cold spots are stores that have a low HFAI score and are surrounded by stores with low HFAI stores, indicating a cluster of low-scoring scores in one place. These cold spots were all located in census tracts belonging to the second-lowest quartile for median household income. There were no hot spots in these three communities.
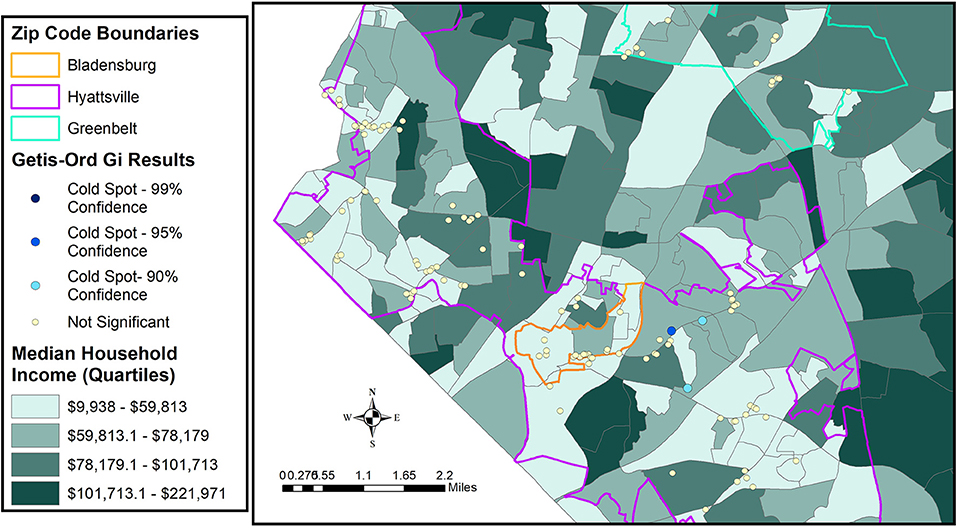
Figure 2. Distribution of hot and cold spots clusters in Bladensburg, Greenbelt, and Hyattsville, MD (2018).
The mean HFAI scores for different types of food outlets were determined across the three communities (Table 3). With the exception of small grocery store outlets, Greenbelt had the highest mean HFAI score across the categories while Bladensburg had the lowest mean score across supermarkets and Hyattsville had the lowest mean score across convenience stores. Across all three communities, supermarkets had the highest mean score of 25 (21.5–25.5) out of 27.5, while convenience stores had the lowest mean score of 3.90 (0–9.5) on the HFAI (Figure 3).
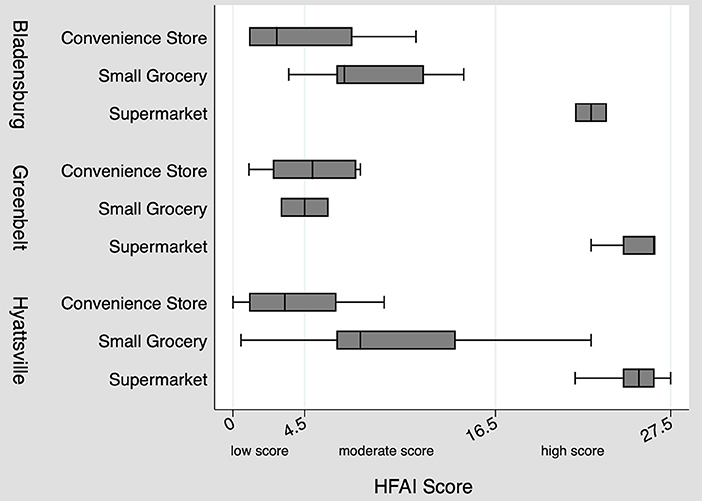
Figure 3. Distribution of food store categories across Bladensburg, Greenbelt, and Hyattsville, MD (2018).
Forty-one percent of stores in Hyattsville had low scores (0–4.5), while 23% were determined to have high HFAI scores (16.51–27.5) (Figure 4). All Greenbelt stores that were determined to have high HFAI scores were supermarkets while all small grocery stores scored moderately (4.51–16.5). Similarly, both supermarkets in Bladensburg received high scores. Convenience stores generally had low scores across all communities and tended not to sell fresh fruits and vegetables. Hyattsville was the only community to have high-scoring small grocery stores. Although thirty-four stores in Hyattsville received moderate scores, this accounted for only ~36% of stores in the community. However, 10 stores in Bladensburg received moderate scores (~53%) while five received moderate scores in Greenbelt (36%). Majority of the high scoring stores (~79%) were located in Hyattsville while Bladensburg and Greenbelt had 2 (~7%) and 4 (~14%), respectively.

Figure 4. Distribution of HFAI scores across Bladensburg, Greenbelt, and Hyattsville, MD (2018).
Most of the closed stores were found in or near block groups where the percentage of people of color was >82.2% (Figure 5). In all, we identified 5 new stores in Hyattsville, 4 in Bladensburg, and none in Greenbelt. We also identified 30 food stores as international markets or ethnic stores because they specifically marketed products toward Hispanic, Asian or African populations (Figure 5). While Greenbelt had no ethnic stores, Hyattsville had 24, and Bladensburg had 6. There appeared to be no specific spatial pattern to the distribution of ethnic stores in Hyattsville or Bladensburg.
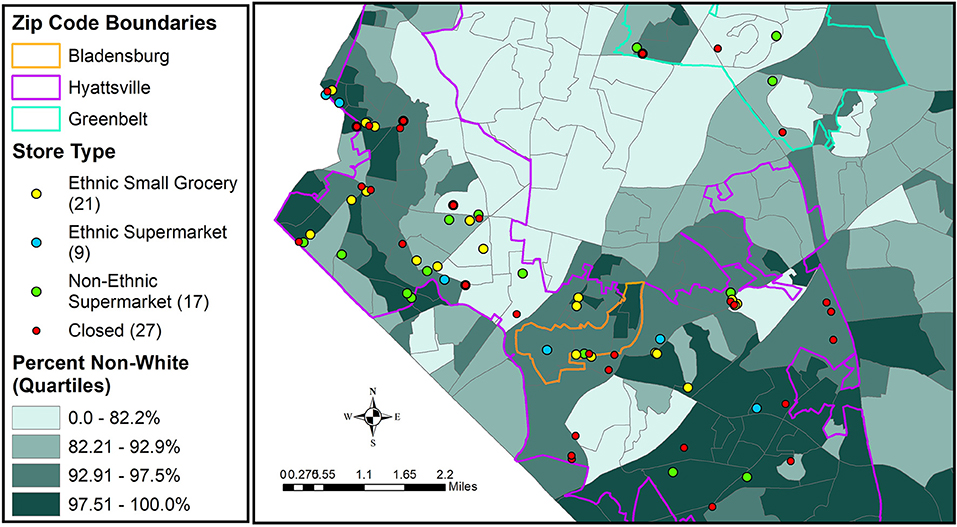
Figure 5. Distribution of closed and ethnic stores across Bladensburg, Greenbelt, and Hyattsville, MD (2018).
Between 4 and 42% of residents in the three towns lived within a half mile of a food store of some type (Table 4). Hyattsville had the least number of residents within a half-mile of any type of food store while Greenbelt had the most. Bladensburg which had only 19% of residents within a half-mile of any food store surprisingly had 91% of residents within a half mile of a fast food outlet. Greenbelt and Hyattsville had 64% and 77% of residents within a half-mile of a fast food restaurant, respectively. The differences in the distribution of the population within a half-mile of a fast food outlet was not statistically significant (p = 0.29) across communities whereas the differences in distribution of the population within a half-mile of any type of food store was statistically significant across communities (p = 5.88 × 10⁻¹³). Dunn's post-hoc analysis determined that the Bladensburg-Hyattsville (6.1 × 10⁻⁴) and Greenbelt-Hyattsville (p = 2.2 × 10⁻¹¹) population pairs were statistically different from each other in this respect. There were also statistically significant differences across communities, for percent non-White residents within a half-mile of a fast food outlet (p = 0.01 × 10⁻²) or any type of food store (p = 1.64 × 10⁻¹²). Bladensburg had the highest percentage of non-White residents within a half-mile of both food stores (92%) and fast food outlets (74%) while Greenbelt had the lowest for both fast food outlets (56%) and food stores (67%) (Table 4).
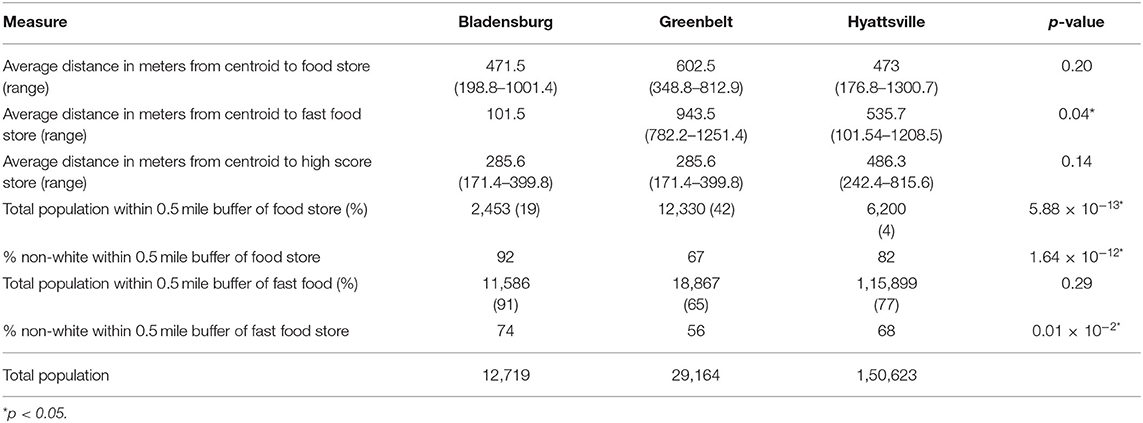
Table 4. Community comparison of distance analysis, population and percent non-white population within a half-mile of a fast food store outlet or food store.
Again, Table 4 features the average distance from the centroid of each block group to different store types within the block group. When average distance from the centroid of a census block group to a fast food outlet, food store, or high scoring store were compared across communities, only the average distance to fast food was determined to be statistically significant (p = 0.04). Post-hoc testing determined that only the Bladensburg-Greenbelt community were statistically different (p = 0.02) in this respect.
Discussion
Prince George's County was of particular interest for our study because it is predominantly African-American (62%) and Hispanic (18.5%); therefore, having limited nutritional resources within the region can be classified as environmental injustice. Our report specifically focused on Bladensburg, Greenbelt, and Hyattsville because these towns are located close to the University of Maryland, reducing logistical complications associated with scoring food stores. Prince George's County is also unique in having a Food Equity Council (FEC) which could use study results to advocate for new policies that will enhance accessibility to healthy food. The Transforming Neighborhoods Initiative (TNI), which aims to improve overall public health by increasing public funding in areas experiencing neglect, declining property values, decreasing neighborhood amenities, and increasing crime, is already in place in different parts of the County including Bladensburg. Findings of this study could help with TNI related efforts in Bladensburg.
Bladensburg had the lowest mean food score (7.76), Hyattsville had the second highest mean score (9.60), and Greenbelt had the highest mean score (10.13). The reason for the lower scores in Bladensburg was primarily due to the absence of high-quality produce since produce accounts for a large number of points, when quantity and quality are considered in the HFAI scoring process. The stores in Bladensburg both failed to meet standards in offering a selection of fresh fruits and vegetables, as well as having appealing, high-quality products. This occurred because most of the food outlets were convenience stores associated with gas stations which do not usually stock a lot of fresh produce.
Convenience stores in Greenbelt and Hyattsville also received relatively low scores as most of these stores were meant to supplement supermarkets and small grocery stores (i.e., these were places where individuals could quickly get some food stables quickly without having to make a trip to the supermarket). Most convenience stores carried a lot of pre-packaged processed foods. Seven convenience stores in Hyattsville scored zero because even though they carried some food items, they did not stock any of the items that were used in the scoring. It is necessary to note that the mean HFAI scores for the individual communities could be affected by outliers such as these. This could be an explanation for Hyattsville's lower score in this category (Figure 3).
Forty-four (61%) out of the 72 convenience stores we visited had a low HFAI score (0–4.5) while all 26 supermarkets in the three communities had a high HFAI score (>16.5). However, supermarkets in Bladensburg generally scored lower (21.5–23.5) while all three supermarkets that received a full score of 27.5 were located in Hyattsville. Small grocery stores generally scored better than most convenience stores although 21% of these received low scores and two received high scores. Nearly 29% of the stores in Greenbelt (n = 4) received high scores compared to 10.5% (n = 2) and 23.4% (n = 22) in Bladensburg and Hyattsville, respectively. Thirty-five percent of Greenbelt stores received a moderate score. Small grocers were found to be versatile and received scores that spanned all three score categories (6 = low score, 21 = moderate score, and 2 = high score). The two grocery stores that received high scores were both ethnic stores (1 in Hyattsville and 1 in Bladensburg).
Stores that we designated as ethnic stores stocked foods that were more reflective of the cultural background of their clientele. Thus, foods sold in these stores were ones patronized by people of Asian, Hispanic, and African descent. Most of these stores were either owned by individuals or families. A few were owned by a chain. Most of the chain-owned ethnic stores scored higher on the HFAI because they also sold American foods in addition to foods patronized by ethnic populations of color. This fact is exemplified by the two small grocery stores that are ethnic stores owned by a chain that received high scores when all other small grocers received either a low or moderate score. The individual/family-owned ethnic stores received lower scores in comparison to the chain-owned ones because most of them carried specialty items and carried items that were relevant to the population of interest (e.g., African, Indian, Hispanic, and Asian foods that would not be found in mainstream grocery stores or supermarkets). These stores usually scored lower because they did not have specific items we were searching for such as boneless skinless chicken breast or ground beef, when they stocked equally high-quality foods such as mutton, beef, etc. Most of the individual/family-owned ethnic stores did not stock milk, fresh fruits, and fresh vegetables although frozen fruits and vegetables were abundant. This weighed heavily on the generated scores for these stores as the HFAI is heavily skewed toward fresh fruits and vegetables.
These ethnic food stores were highly patronized based on the brisk business we observed during our visits and confirmation from store owners on the length of time that they had operated—most had operated for more than 5 years. The ethnic food stores were clearly fulfilling a need beyond serving as a food outlet as they also served as social hubs for their clientele. Ethnic stores generally scored higher than convenience stores, 4 out of 30 (13%) received low scores while 24 (80%) received moderate scores. Although we could not fully capture their importance in the food environment, it was evident that they acted as a salutogenic food resource for residents. Greenbelt had no ethnic stores (Figure 1). Almost all ethnic stores accept SNAP while none of the individual/family-owned ones accept WIC because they typically do not carry the type of foods that qualify for WIC purchase based on our observations.
Although our study did not identify any hot spots, we did identify cold spots. The lack of hot spots signify that high-scoring stores were randomly distributed, thus, there were no clusters. The three cold spots that were identified were located in block groups with >82% of the population being people of color thus, they can be deemed to be predominantly non-white. As previously explained, ethnic stores were specialty markets that catered to the palate of their clientele and tended not to carry most of the foods that the HFAI scores, they carried equally high-quality foods that most of the people who live close by patronize. This translated to lower score for some of these stores. Again, based on observation, most of the population in these areas patronize the ethnic stores and then supplement with other items from non-ethnic stores. Thus, even though, the median income was moderate in these areas, it is possible that the driving factor for these low scores is the proportion of people of color living in the area who typically patronize ethnic stores much more readily that non-ethnic stores.
Our results may be supported by other research on food access in Prince George's County. One study found that many residents in Prince George's County lacked basic nutrition knowledge, which means they may be unaware of the link between unhealthy food and poor health (The Maryland-National Capital Park Planning Commission, 2015). In terms of availability, cheap, processed, unhealthy food were more abundant in Prince George's County, while healthy food tended to be more expensive and difficult to find (The Maryland-National Capital Park Planning Commission, 2015). In addition, the study found that many residents did not frequent nearby supermarkets, but traveled elsewhere to seek out more variety and better quality food that was sold for less (The Maryland-National Capital Park Planning Commission, 2015). Surprisingly, it is not just the lack of supermarkets that creates food insecurity, but their spatial distribution and the price of products they carry and presence of fast food outlets that creates the inequity (The Maryland-National Capital Park Planning Commission, 2015).
The Healthy Food for all Prince Georgians report analyzed the accessibility of healthy food by dividing the county into three regions: North, Central, and South, respectively. Our project on the other hand, focused on Bladensburg, Greenbelt, and Hyattsville using the block group, a smaller unit of analysis to assess the food environment at a more localized scale. The methodology between the two different reports differ as well, because our report used “ground-truthing” in order to directly verify that the condition of the store did not change. Through the ground-truthing process, we successfully identified stores that were permanently closed and new stores that opened recently. We also identified stores that were incorrectly identified as food stores but did not sell any food items. Moreover, the Healthy Food for all Prince Georgians report had a strong emphasis on number and location of prepared food outlets in comparison to grocery stores in order to determine which ones were more accessible. The report also analyzed the quality of National School Lunch Program and quality of food being served in Prince George's County schools. While, our report focused on scoring all grocery stores, supermarkets, convenience stores, corner stores, and gas stations in the study area by using HFAI and spatial analysis in order to determine the accessibility of nutritional resources within the three towns.
In 2014, the average US county had more full service restaurants per 1,000 residents than fast food restaurants; 0.8 full service establishments per 1,000 residents, and 0.6 fast food establishments per 1,000 residents (USDA Economic Research Service, 2014). In the same year, Prince George's County had a higher number of fast food restaurants per 1,000 residents than full service restaurants; 0.83 fast food establishments per 1,000 residents and 0.32 full service establishments per 1,000 residents (USDA Economic Research Service, 2014). The high availability of fast food restaurants in Prince George's County may contribute to obesity in the County. Prince George's obesity rate (33%) was higher than the rate of neighboring counties including Montgomery County (21%) and Anne Arundel County (29%) and the state rate (29%) (RWJF, 2018).
Prince George's County residents also face an inequity concerning food stamp authorized stores. An average of 0.48 stores per 1,000 residents accept food stamp benefits in Prince George's County (USDA Economic Research Service, 2014). The county average was low compared to the Maryland average of 0.66 stores per 1,000 residents and the U.S. average of 0.88 stores per 1,000 residents accepting food stamp benefits (USDA Economic Research Service, 2014).
The average SNAP redemptions per SNAP authorized store in Prince George's County for 2012 was $560,785, $315,364 for Maryland, and $252,078 for the US (USDA Economic Research Service, 2014). We found that 66 (Bladensburg = 8, Greenbelt = 10, Hyattsville = 48) of 109 stores whose SNAP acceptance was known accepted SNAP. This number reflects 60.6% overall and 44.4, 71.4, and 62.3% for Bladensburg, Greenbelt, and Hyattsville, respectively. Based on this data, an average of 0.84 stores per 1,000 residents in Bladensburg, 0.42 stores per 1,000 residents in Greenbelt, and 2.62 stores per 1,000 residents accept SNAP in Hyattsville. Greenbelt's SNAP acceptance was below the average for both Maryland and the County, Bladensburg was above both but below the US rate, and Hyattsville's was well above that of the nation, the County, and the state.
Eight of the stores we visited were dollar stores, five of which were located in Hyattsville, two in Bladensburg, and one in Greenbelt. These stores generally generated low scores on the HFAI (0–4.5). Half received low scores while the other half received moderate scores. The poor scores were consistent with what we observed when we visited these stores. There was a paucity of fresh produce and an abundance of packaged processed foods. This impacted the scores heavily as the HFAI relies on the presence of fresh fruits and vegetables. While we do not know the SNAP acceptance status of two of these stores, all six whose status was known accepted SNAP.
The overabundance of these stores in low-income neighborhoods and communities of color may be construed as an environmental justice issue. Due to their presence and concentration, these stores tend to act as both food and economic pathogens (Wilson, 2009). Current evidence suggests that while dollar stores occasionally fill a need in cash-strapped communities, these stores are not just a result of economic distress. They cause it, this is because dollar stores trigger the closure of grocery stores in small towns and urban neighborhoods (Institute of Local Self Reliance, 2018).
Dollar stores generally impact grocery stores negatively by decreasing people's access to fresh food (Institute of Local Self Reliance, 2018). Small towns, which are often served by a single locally-owned supermarket typically experience cuts in sales of about 30% once a dollar store opens. This happens because of their aggressive pricing but the items sold are not necessarily cheaper; they have the lowest price points because they are packaged in single-serving quantities (Institute of Local Self Reliance, 2018). In some cases, that might be enough to put the local grocer out of business. Thus, the presence of dollar stores may exacerbate the quality of the food environment including the availability of high quality foods for small town residents.
On the other hand, in cities, dollar stores are sited in neighborhoods that are food deserts with few or no grocery stores (Walker et al., 2010). Often, dollar stores target African-American neighborhoods by saturating them with several outlets thereby impeding the establishment and growth of other grocers (Donahue and Mitchell, 2018) that may be more culturally responsive to local needs and provide more high quality options. They also eliminate jobs since they employ fewer people compared to smaller independent grocery stores. The jobs generated are not only few in number but are also low-quality and low-wage (Vargas, 2017). Although we did not observe this pattern of saturation in our three communities, the dollar stores we visited held true to form—they had little to no fresh produce. The fact that they accept SNAP makes it possible for consumers who would not have done so previously to purchase the unhealthy options they stock on their counters.
Our study had several limitations. One limitation is, it only focused on three towns in one of the largest counties in Maryland. Our study did not incorporate data on the perceptions that residents have of their food environment and how it impacts food availability and quality. This is important as there is a social context to food access. We also did not assess farmers' markets and non-traditional sources of food like cooperatives and mobile food trucks that can serve to supplement fresh healthy food or otherwise. We also failed to incorporate seasonality in our assessment as the study was cross-sectional and occurred only in the fall. This limits our ability to evaluate the impact of seasonal markets such as farmers' markets and ability to assess how different seasons impact food availability. Our methodology did not incorporate a price structure analysis although we observed that for fresh fruits such as bananas, all convenience stores priced the produce per a banana while small grocers and supermarkets priced them per pound across all three communities. Based on this, bananas were relatively more expensive in convenience stores than in small grocery stores and supermarkets. Although we collected data on alternative sources of milk such as almond and soy milks, we did not include them in the scoring process.
Based on the number of food stores in Greenbelt and Bladensburg, we could not conduct regression analysis to predict the influence of different SOD features and neighborhood characteristics on HFAI scores generated for these communities. However, we did notice disparities in average distance to food store and fast food outlets as well as the number of individuals and percent non-White residents that live within a half-mile of either a food store or fast food outlet (Table 4). This is important as it influences the quality of the food environment as well as access to it. This can impact food equity across these communities in regard to race/ethnicity and income.
This study alone is not enough to provide a basis for policy change but can act as the foundation for future studies and interventions on food security issues in Prince George's County, Maryland. Through our citizen science and local community-university partnerships, we hope to launch food and health literacy campaigns that will enable residents to understand their food environment and engage in decision-making concerning how grants and resources can be employed to improve the food environment such as identification and development of supermarket alternatives. Engaging stakeholders will be instrumental in building capacity for those residents who wish to take part in the decision-making process on the type of food stores that will be sited in their neighborhoods through existing initiatives such as the TNI program.
Future studies will utilize an updated food availability and quality index that incorporates a price structure and alternatives to traditional food products such as plant-based milks (e.g., almond and soy milk) that are milk alternatives. Milk alternatives such as almond milk and soy milk are important because consumers who purchase them do so because of milk protein allergies, lactose intolerance, cultural reasons, and diet (Chalupa-Krebzdak et al., 2018; Vanga and Raghavan, 2018). Therefore, plant-based milks could be reflective of the dietary needs of some residents and whether a food store carries these items or not ultimately affects food availability for those who need them. Furthermore, our scoring methodology did not allow us to incorporate the uniqueness of specialty stores such as ethnic stores that cater to specific subpopulations and how the foods offered by these stores may impact the local food environment.
We plan to utilize the updated HFAI tool to score stores in other parts of the County to identify other communities with low quality food infrastructure. In addition, we plan to use this scoring methodology to examine food security in higher income areas to compare food access and quality across more affluent communities with differing racial/ethnic composition. Ultimately, our studies will enable us to ascertain how the food environment including access to cultural food resources in addition to the perception of food availability and quality drives healthy food consumption across Prince George's County and other parts of Maryland.
Conclusion
The purpose of this study was to examine disparities in the food environment in Prince George's County, Maryland by focusing on the availability of affordable, healthy food options in three suburbs of the nation's capital: Bladensburg, Greenbelt, and Hyattsville. Based on our results, all three communities face a lack of healthy options within their jurisdictions, but Bladensburg had the lowest average HFAI score and the lowest for grocery stores and supermarkets. Sadly, this does support our initial hypothesis that the township with the lowest SES would have the worst food access. Even though Bladensburg had the worst mean HFAI score, all three communities had relatively low mean scores, only three stores based in Hyattsville receive the maximum number of points. The community with the highest mean HFAI score and highest median household income, Greenbelt, still faces many of the same problems that Bladensburg does, even if it is to a lesser degree. Particularly, the number of stores per 100,000 residents is the lowest and although the four supermarkets located in Greenbelt do relatively well, there are only two small grocery stores to bridge the gap between the low-scoring convenience stores and supermarkets. This makes the residents dependent on supermarkets no matter the distance if they want high quality food. To address food inequity in the study communities and other parts of the County, we encourage the use of alternative, less conventional food retail models such as mobile food markets, ethnic stores, and the expansion of federal nutrition assistance programs.
Data Availability Statement
The datasets generated for this study are available on request to the corresponding author.
Author Contributions
SW, LK, KA, and VR contributed to the conception and design of the study. MB generated the google forms, organized the data, and wrote code to analyze data and generate HFAI scores. LK performed the statistical, distance and buffer analysis. CB performed the hot-spot analysis and created the maps. JS wrote the first draft of the manuscript. SW and LK wrote sections of the manuscript. SW revised the manuscript critically for important intellectual content. LK, MB, KA, JS, VR, and J-MA visited food stores to score them. All authors contributed to manuscript revision, read, and approved the submitted version.
Conflict of Interest
The authors declare that the research was conducted in the absence of any commercial or financial relationships that could be construed as a potential conflict of interest.
The handling editor declared a shared affiliation, though no other collaboration, with the authors.
Acknowledgments
We would like to thank the team at the Johns Hopkins Center for a Livable Future and Prince George's County Food Equity Council for their support of this project. In addition, we would like to thank the contribution of interns and graduate students including Omid Barr, Sami Bara, Alphonzo Davidson, Roxana Amaya-Fuentes, Kesanet Seleshi, and Beza Dagnachew who assisted with scoring stores and project logistics.
References
Alwitt, L. F., and Donley, T. D. (1997). Retail stores in poor urban neighborhoods. J. Consum. Aff. 31, 139–164. doi: 10.1111/j.1745-6606.1997.tb00830.x
Block, J. P., Scribner, R. A., and DeSalvo, K. B. (2004). Fast food, race/ethnicity, and income: a geographic analysis. Am. J. Prev. Med. 27, 211–217. doi: 10.1016/j.amepre.2004.06.007
Center for Livable Future (2010). The Baltimore City Food Environment. Available online at: https://www.jhsph.edu/research/centers-and-institutes/johns-hopkins-center-for-a-livable-future/_pdf/research/clf_reports/BaltimoreCityFoodEnvironment.pdf (accessed August 5, 2018).
Chalupa-Krebzdak, S., Long, C. J., and Bohrer, B. M. (2018). Nutrient density and nutritional value of milk and plant-based milk alternatives. Int. Dairy J. 87, 84–92. doi: 10.1016/j.idairyj.2018.07.018
Chung, C., and Myers, S. L. (2005). Do the poor pay more for food? An analysis of grocery store availability and food price disparities. J. Consum. Aff. 33, 276–296. doi: 10.1111/j.1745-6606.1999.tb00071.x
Cubbin, C., Hadden, W. C., and Winkleby, M. A. (2001). Neighborhood context and cardiovascular disease risk factors: the contribution of material deprivation. Ethn. Dis. 11, 687–700.
Deaton, A., and Lubotsky, D. (2003). Mortality, inequality and race in American cities and states. Soc. Sci. Med. 56, 1139–1153. doi: 10.1016/S0277-9536(02)00115-6
Donahue, M., and Mitchell, S. (2018). Dollar Stores Are Targeting Struggling Urban Neighborhoods and Small Towns. One Community Is Showing How to Fight Back. Institute for Local Self-Reliance. Available online at: https://ilsr.org/dollar-stores-target-cities-towns-one-fights-back/ (accessed December 31, 2018).
Franco, M., Diez Roux, A. V., Glass, T. A., Caballero, B., and Brancati, F. L. (2008). Neighborhood characteristics and availability of healthy foods in Baltimore. Am. J. Prev. Med. 35, 561–567. doi: 10.1016/j.amepre.2008.07.003
Furey, S., Strugnell, C., and McIlveen, M. H. (2001). An investigation of the potential existence of “food deserts” in rural and urban areas of Northern Ireland. Agric. Hum. Values 18, 447–457. doi: 10.1023/A:1015218502547
Galvez, M. P., Morland, K., Raines, C., Kobil, J., Siskind, J., Godbold, J., et al. (2008). Race and food store availability in an inner-city neighbourhood. Public Health Nutr. 11, 624–631. doi: 10.1017/S1368980007001097
Guy, C., Clarke, G., and Eyre, H. (2004). Food retail change and the growth of food deserts: a case study of Cardiff. Int. J. Retail Distrib. Manage. 32, 72–88. doi: 10.1108/09590550410521752
Hendrickson, D., Smith, C., and Eikenberry, N. (2006). Fruit and vegetable access in four low-income food deserts communities in Minnesota. Agric Hum. Values 23, 371–383. doi: 10.1007/s10460-006-9002-8
Hilmers, A., Hilmers, D. C., and Dave, J. (2012). Neighborhood disparities in access to healthy foods and their effects on environmental justice. Am. J. Public Health 102, 1644–1654. doi: 10.2105/AJPH.2012.300865
Institute of Local Self Reliance (2018). Dollar Store Impacts. Available online at: https://ilsr.org/wp-content/uploads/2018/12/Dollar_Store_Fact_Sheet.pdf (accessed December 29, 2018).
Kaufman, P. R. (1998). Rural poor have less access to supermarkets, large grocery stores. Rural Am. Rural Development. Perspect. 13, 19–26.
Lamichhane, A. P., Warren, J., Puett, R., Porter, D. E., Bottai, M., Mayer-Davis, E. J., et al. (2013). Spatial patterning of supermarkets and fast food outlets with respect to neighborhood characteristics. Health Place 23, 157–164. doi: 10.1016/j.healthplace.2013.07.002
Larson, N. I., Story, M. T., and Nelson, M. C. (2009). Neighborhood environments. Am. J. Prev. Med. 36, 74–81.e10. doi: 10.1016/j.amepre.2008.09.025
Luan, H., Law, J., and Quick, M. (2015). Identifying food deserts and swamps based on relative healthy food access: a spatio-temporal Bayesian approach. Int. J. Health Geogr. 14:37. doi: 10.1186/s12942-015-0030-8
Mari Gallagher Research Consulting Group (2006). Examining the Impact of Food Deserts on Public Health in CHICAGO. Available online at: https://www.marigallagher.com/2006/07/18/examining-the-impact-of-food-deserts-on-public-health-in-chicago-july-18-2006/ (accessed December 29, 2018).
Moore, L. V., and Diez Roux, A. V. (2006). Associations of neighborhood characteristics with the location and type of food stores. Am. J. Public Health 96, 325–331. doi: 10.2105/AJPH.2004.058040
Morland, K., Wing, S., and Diez Roux, A. (2002). The contextual effect of the local food environment on residents' diets: the atherosclerosis risk in communities study. Am. J. Public Health 92, 1761–1767. doi: 10.2105/AJPH.92.11.1761
Powell, L. M., Auld, M. C., Chaloupka, F. J., O'Malley, P. M., and Johnston, L. D. (2007a). Associations between access to food stores and adolescent body mass index. Am. J. Prev. Med. 33, S301–S307. doi: 10.1016/j.amepre.2007.07.007
Powell, L. M., Slater, S., Mirtcheva, D., Bao, Y., and Chaloupka, F. J. (2007b). Food store availability and neighborhood characteristics in the United States. Prev. Med. 44, 189–195. doi: 10.1016/j.ypmed.2006.08.008
R Core Team (2019). R: A Language and Environment for Statistical Computing. Vienna: R Foundation for Statistical Computing.
RWJF (2018). Robert Wood Johnson County Health Indicators Report 2018. County Health Rankings & Roadmaps. Available online at: http://www.countyhealthrankings.org/app (accessed December 29, 2018).
Santo, R., Palmer, A., and Buczynski, A. (2015). Researching the Baltimore City Food Environments: Contributions from the Johns Hopkins Bloomberg School of Public Health. Available online at: https://www.jhsph.edu/research/centers-and-institutes/johns-hopkins-center-for-a-livable-future/_pdf/research/clf_reports/baltimore-food-environment-report2015.pdf (accessed August 1, 2018).
Sogie-Thomas, B., Sankofa, J., Reed, C., Mfume, K., and Doamekpor, L. A. (2018). Health policy responsiveness: lessons learned from Maryland and Prince George's County. J. Racial Ethnic Health Disparities 5, 366–374. doi: 10.1007/s40615-017-0379-4
Tang, X., Ohri-Vachaspati, P., Abbott, J. K., Aggarwal, R., Tulloch, D. L., Lloyd, K., et al. (2014). Associations between food environment around schools and professionally measured weight status for middle and high school students. Child Obes. 10, 511–517. doi: 10.1089/chi.2014.0065
The Maryland-National Capital Park Planning Commission (2015). Healthy Food For All Prince Georgians: An Assessment of Access to Healthy Food in Prince George's County, Maryland. Available online at: http://www.mncppcapps.org/planning/Publications/PDFs/304/Cover%20page,%20Introduction%20and%20Executive%20summary.pdf (accessed December, 4, 2017).
USDA Economic Research Service (2014). Food Environment Atlas. USDA ERS. Available online at: https://www.ers.usda.gov/data-products/food-environment-atlas/ (accessed December 31, 2018).
Vanga, S. K., and Raghavan, V. (2018). How well do plant based alternatives fare nutritionally compared to cow's milk? J. Food Sci. Technol. 55, 10–20. doi: 10.1007/s13197-017-2915-y
Vargas, T. L. (2017). Employees or suspects? Surveillance and scrutinization of low-wage service workers in U.S. Dollar Stores. J. Labor Soc. 20, 207–230. doi: 10.1111/wusa.12284
Walker, R. E., Keane, C. R., and Burke, J. G. (2010). Disparities and access to healthy food in the United States: a review of food deserts literature. Health Place 16, 876–884. doi: 10.1016/j.healthplace.2010.04.013
Weinberg, Z. (1995). No Place to Shop: The Lack of Supermarkets in Low-income Neighborhoods : Analysis of a University of Connecticut Study on Low-income Communitites and Households Receiving Public Assistance in 21 Metropolitan Areas. Washington, DC: Public Voice for Food and Health Policy.
Wilson, S. M. (2009). An ecologic framework to study and address environmental justice and community health issues. Env. Justice 2, 15–24. doi: 10.1089/env.2008.0515
Wrigley, N. (2002). “Food Deserts” in British Cities: policy context and research priorities. Urban Stud. 39, 2029–2040. doi: 10.1080/0042098022000011344
Zenk, S. N., Mentz, G., Schulz, A. J., Johnson-Lawrence, V., and Gaines, C. R. (2017). Longitudinal associations between observed and perceived neighborhood food availability and body mass index in a multiethnic urban sample. Health Educ. Behav. 44, 41–51. doi: 10.1177/1090198116644150
Zenk, S. N., Schulz, A. J., Israel, B. A., James, S. A., Bao, S., and Wilson, M. L. (2005). Neighborhood racial composition, neighborhood poverty, and the spatial accessibility of supermarkets in metropolitan detroit. Am. J. Public Health 95, 660–667. doi: 10.2105/AJPH.2004.042150
Keywords: environmental justice, built environment, food access, food environment, food availability, disparities, ethnic stores, dollar stores
Citation: Kavi L, Sinisterra J, Bodenreider C, Bellay M, Ayub K, Ravichandran V, Archer J-M and Wilson S (2019) Environmental Justice and the Food Environment in Prince George's County, Maryland: Assessment of Three Communities. Front. Built Environ. 5:121. doi: 10.3389/fbuil.2019.00121
Received: 08 January 2019; Accepted: 01 October 2019;
Published: 18 October 2019.
Edited by:
Jennifer D. Roberts, University of Maryland, College Park, United StatesReviewed by:
Hogeun Park, World Bank Group, United StatesDwayne E. Porter, University of South Carolina, United States
Copyright © 2019 Kavi, Sinisterra, Bodenreider, Bellay, Ayub, Ravichandran, Archer and Wilson. This is an open-access article distributed under the terms of the Creative Commons Attribution License (CC BY). The use, distribution or reproduction in other forums is permitted, provided the original author(s) and the copyright owner(s) are credited and that the original publication in this journal is cited, in accordance with accepted academic practice. No use, distribution or reproduction is permitted which does not comply with these terms.
*Correspondence: Lucy Kavi, bGthdmlAdW1kLmVkdQ==