 Wenting Hou
 Issam Qamhia
 Vincent Mwumvaneza2
 Erol Tutumluer
- 1Department of Civil and Environmental Engineering, University of Illinois at Urbana-Champaign, Urbana, IL, United States
- 2Dynatest North America, Alpharetta, GA, United States
- 3Arizona State University, Tempe, AZ, United States
Quarry by-products (QB), usually <1/4 in. (6 mm) in size, are the residual deposits from the production of required grades of aggregate. This paper provides findings of a detailed laboratory study with the objective of characterizing the engineering properties of QB materials produced in the primary, secondary, and tertiary aggregate production stages from four different quarries operating in Illinois. Property tests were conducted for determining aggregate gradation, morphological shape characteristics, compaction properties (moisture-density), chemical composition, and strength properties of QB samples. Since the unconfined compressive strength for QB materials is relatively low, chemical admixture stabilizers such as Portland cement and Class C fly ash were used to improve the strength properties. This study aims at evaluating properties governing the untreated and stabilized strength of QBs such as source variation, compacted density, chemical composition, gradation, particle shape and angularity, as well as the uniformity of distribution and the effectiveness of stabilizer. QB samples treated with 2% cement or 10% Class C fly ash by dry weight were found to be 10–30 times stronger than the virgin QB samples. Such significant increases in the strength of stabilized QB materials observed may indicate suitability of QBs for sustainable pavement applications.
Introduction
During aggregate production, multiple aggregate quarry processes such as blasting, crushing, and screening of aggregates produce large amounts of by-product mineral fine materials, commonly known as Quarry By-products (QBs). During the crushing stages, QBs are generally produced in three stages: primary crushing, secondary crushing, and tertiary crushing (Petavratzi and Wilson, 2007). Common types of crushers used to produce crushed aggregate materials in the primary, secondary, and tertiary crushing stages include jaw crushers, cone crushers, gyratory crushers, and impact crushers. The quantity of fines (and QB) produced from each crusher type depends on the crushing stage and the operating conditions. Jaw crushers are normally utilized for the primary crushing. Cone crushers are widely used by crushed rock producers due to the relatively lower operational costs and low fines (QB) generation. Horizontal shaft impact crushers are more commonly used for processing softer materials such as limestone, while vertical shaft impact crushers have more capability of producing cubical aggregates needed for concrete production. With vertical impact crushers, the quantities of fines generated during aggregates production can be limited to acceptable levels if the right operation techniques are implemented (Tarmac Ltd. Partners, 2011).
QBs are typically <¼ in. (6 mm) in size and consist of mostly coarse, medium and fine sand particles, and a small amount of clay/silt fraction. Research conducted in the early 1990s showed that stockpiled fines comprised an average of approximately 12% of the total annual aggregate production of the surveyed companies (Kumar and Hudson, 1992). Hudson et al. (1997) stated that the stockpiling and disposal of aggregate by-products is a major problem facing the aggregate industry. According to the recent NCHRP Synthesis 435 (volume 4), and depending on the type of rock quarried, quarry by-products can be up to 25% of the total aggregate produced (Stroup-Gardiner and Wattenberg-Komas, 2013). A more recent industrial survey distributed to aggregate producers in the State of Illinois in 2013 showed that, among 42 respondents, 90% of the respondents are producing QBs. Among the quarries that produce QBs, 55% of the respondents produce a typical annual amount of QB >100,000 short tons; 26% between 25,000 and 100,000 tons, and 19% <25,000 tons (Mwumvaneza et al., 2015).
Hence, it would be of value to evaluate the properties of QBs and find potential application areas in the construction and rehabilitation of transportation infrastructure. A number of previous researches have focused on laboratory property testing of QBs. Kalcheff and Machemehl (1980) conducted particle size distribution test for different types of QBs. It was reported that screenings generally contain freshly fractured faces, have fairly uniform gradation, and contain fewer plastic fines. The particle distributions of the evaluated QBs followed a similar gradation trend, with particles smaller than sieve No. 200 (0.075 mm) ranging from 6 to 12%. Stokowski (1992) showed that QBs are enriched in CaCO3, SiO2, Al2O3, and Fe2O3 relative to MgCO3. As a result of this finding, QBs have lower specific gravity and are relatively soft because of calcite (CaCO3) and enrichment of clay minerals (SiO2, Al2O3, and Fe2O3).
According to Dumitru et al. (2001), mineralogical tests such as X-ray diffraction analysis should be conducted to determine the compositions of secondary minerals and to quantify amounts of harmful content that can be detrimental in some applications. Petavratzi and Wilson (2007) concluded that QBs are composed of the same mineral substances as the soil and solid rock from which they are derived, and they are usually inert or non-hazardous. Puppala et al. (2008) reported the plasticity index properties of QBs and also concluded that the compressive strength of untreated (virgin) QBs can be very low. Puppala et al. (2012) conducted one-dimensional vertical free-swelling test of QB. In their study, the QBs were found to be of moderately swelling potential. Mwumvaneza et al. (2015) conducted the unconfined compressive strength test of QBs and found the strength to be relatively low.
Based on laboratory testing results, some researchers utilized chemical stabilization for improving strength of QBs; and based on their findings, different field applications for QBs were recommended. According to Kalcheff and Machemehl (1980), stabilization of QBs with cement developed relatively high rigidity with a small amount of Portland cement compared with granular soil–cement stabilization. The use of low-cement content has the advantage of decreasing the shrinkage cracking. In 1992, Kumar and Hudson examined the unconfined compressive strength, tensile modulus of elasticity, and Poisson's ratio of cement-treated QB. Their study concluded that stabilizing QBs with cement could produce the adequate compressive strength, modulus of elasticity, and tensile strength required for subbase material. They proposed base course material additive, flowable fill, under slab granular fill, and cement-stabilized subbase/base layers as possible pavement applications of QBs. According to the results presented in the study by Wood and Marek (1995), using 3% cement, 8% fly ash, and 89% QBs resulted in a flowable fill with adequate performance.
McClellan et al. (2002) reported engineering backfill as a potential area of QB material use, which was evaluated based on particle size distribution, moisture content, and mineralogy of by-products representing a variety of limestone and dolomitic QB. Naik et al. (2005) examined the use of QBs in Self-Consolidating Concrete (SCC). They found that the addition of QBs minimized the addition of the admixture without reducing the strength of the SCC. Puppala et al. (2008) reported that the addition of 2.3% cement increased the unconfined compressive strength to 174 psi (1,200 kPa). It was concluded that the strength and resilient modulus of the cement-treated QB are similar to those of sandy material with very few fines. Following the laboratory assessment of QBs, field performance tests were also conducted with QBs used as subbase/base material on expansive subgrade treated with lime (Puppala et al., 2012), where no substantial changes in the surface deformation profile were observed during the experimental testing. Lohani et al. (2012) found that the replacement of sand with QBs in concrete improved the properties of the mixture since QBs improved the pozzolanic reaction, micro aggregate filling, and concrete durability. Recently, Qamhia et al. (2018, 2019) utilized aggregate QBs in sustainable pavement applications as a filler material in the voids of large aggregate subgrade rocks and as a stabilized base/subbase material in flexible pavement, and reported satisfactory performance trends from accelerated pavement testing.
Problem Statement and Objectives
Large amount of non-hazardous QB materials are produced each year during various crushing stages and stockpiled over time in quarries. There exists potential for various construction application of QBs given having a good understanding of how these QBs behave alone and with proper stabilizers. Previous studies on QBs have provided many useful background information and insights. However, it is generally agreed that the properties of QBs could not be easily generalized because of the natural variability of parent rock and the different crushing technologies employed (Wood, 1995; Manning, 2004; Stroup-Gardiner and Wattenberg-Komas, 2013).
The main goal of this research is to evaluate physical and engineering properties of wide range of QBs from different sources and different crushing stages in Illinois and identify most feasible paving applications according to laboratory testing results.
To address the research objectives, a thorough laboratory characterization was conducted; which included determining the engineering properties as well as the chemical and compositional characteristics of QBs received from four quarries in Illinois and sampled from multiple crushing stages. Both 2% Portland cement and 10% Class C fly ash were used as stabilizers to investigate trends in strength improvement. Chemical admixture stabilization improvements of representative QB samples were evaluated to provide recommendations for potential sustainable QB applications. Effect of density, gradation, as well as chemical composition on the unconfined compressive strength of stabilized QB was also evaluated.
Materials and Experimental Plan
For simplicity, the QBs used in this study, which were received from four different quarries in the State of Illinois will be referred to as Quarry 1–Quarry 4, or Q1–Q4 for short. Two batches of QB samples were collected from Quarry 1 near the Chicago area and were sampled within a 5-month period. The laboratory testing results for the two batches of materials from Quarry 1 were presented in a recent paper by Mwumvaneza et al. (2015). In this paper, only the average values of the two batches of Quarry 1 are presented. After the first round of the experimental program was completed for the samples collected from Quarry 1, additional QB samples were collected from three other quarries (see Table 1). All four quarries generate large quantities of QB annually and are located in different regions of Illinois, in order to evaluate variability in engineering properties of QB from different geological origins and production techniques to better represent QB materials from all across Illinois.
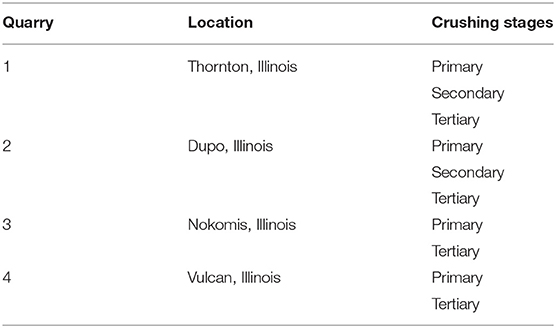
Table 1. Quarry by-products sources and samples.
In general, the three crushing and screening stages utilized in quarries (primary, secondary, and tertiary) can produce QBs along with the main aggregate products meeting specifications of various applications. The materials were sampled from three main crushing/screening stages when they were active and contributing to the aggregate production. The materials collected from Quarries 1 and 2 included all three stages however, samples were only collected from the primary and tertiary stages from Quarries 3 and 4 because only two crushing stages were utilized on site at these two locations.
The scope of the experimental program included sieve analysis, moisture density relationship, imaging-based aggregate shape property testing, Modified Methylene Blue (MMB), Atterberg limits, and Unconfined Compressive Strength (UCS) characteristics of QB samples collected from the crushing stages shown previously in Table 1. In addition, X-Ray Fluorescence (XRF) technique was also utilized for evaluating chemical composition of QB samples. Both Portland cement and Class C fly ash treated QB samples were also evaluated by standard Proctor test and UCS test. A summary of the experimental framework is illustrated in Table 2.
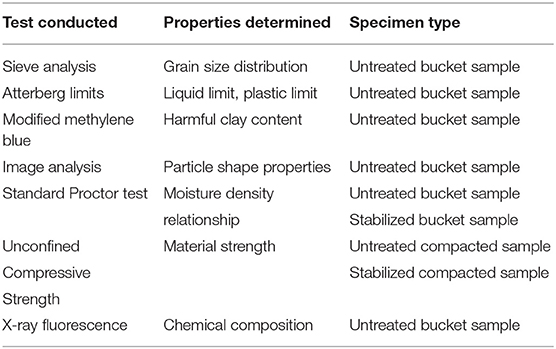
Table 2. Experimental plan.
Results and Discussion
Untreated Quarry By-Products
Grain Size Distribution, Atterberg Limits, and Soil Classification
Owing to the variety of parent rock types, and different crushers and technologies used in the aggregate production stages, the particle size of aggregate by-products may differ from one another. To quantify these differences, grain size distributions were determined by laboratory dry sieve analysis according to the ASTM C136 method (ASTM International, 2014). Quarry by-products were compared based on the quarry locations and crushing stages. Figure 1 shows gradation results for all the QB samples obtained from the four quarries also indicating the crushing stages. The aggregate by-products from Quarries 1–3 have a nominal maximum size of 4.75 mm (No. 4 sieve size). About 2% of the aggregate by-products sampled from Quarry 4 tertiary crusher were found to be slightly larger than 4.75 mm. The percentages of particles finer than 0.075 mm (No. 200 sieve) range from 7 to 15% for all quarry samples. Note that all the aggregate by-products follow a well-graded type of gradation curve except for the QB sample obtained from the tertiary production stage of Quarry 3.
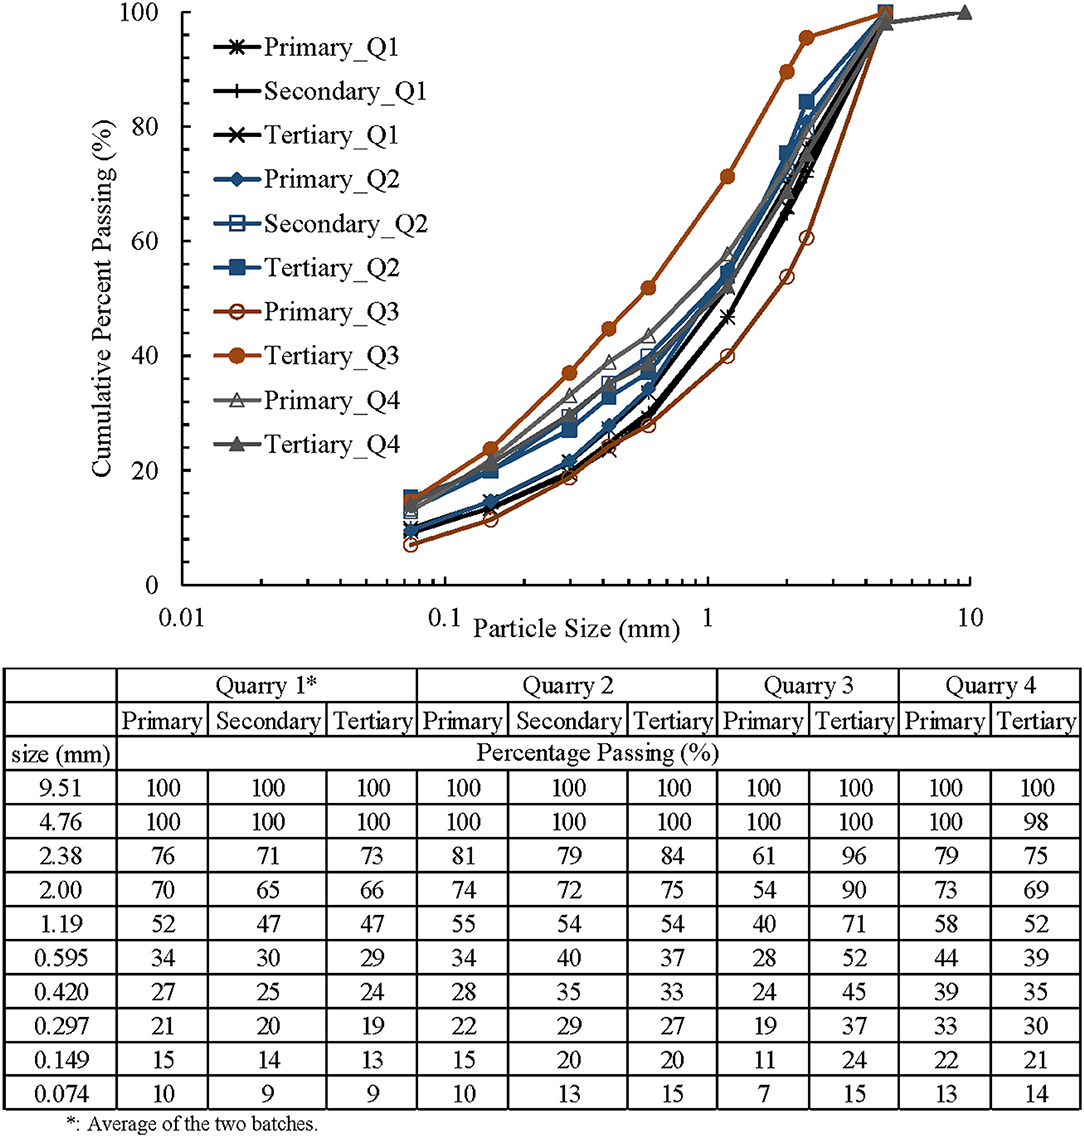
Figure 1. Particle size distributions of quarry by-products from all four quarry locations.
Clay contents of the aggregate by-products were determined from a Modified Methylene Blue (MMB) test, which is a quick assessment method of the amount of harmful clay in the fines portion of the aggregates (Pitre, 2012). For the two batches collected from Quarry 1, almost similar clay contents were observed, and an average was taken to represent the clay content for those samples. Harmful clay contents for samples from Quarries 1 through 4 are summarized in Table 3.
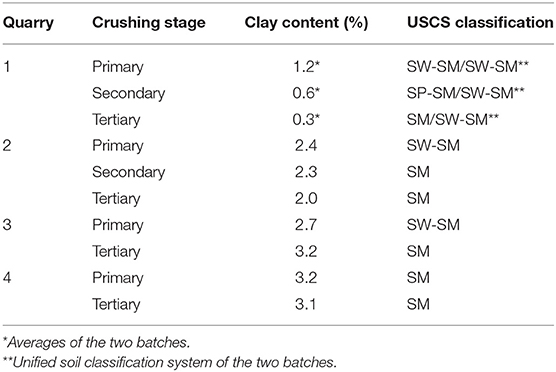
Table 3. Harmful clay content and USCS classification of quarry by-products sampled from quarries 1–4.
In general, harmful clay content comprised < ~3% of fines in the QB samples. There were some variations between quarries and within quarries. For example, the harmful clay contents of Quarry 1 samples were lower than those of the samples collected from the other three quarries. Slightly higher clay content was observed in QBs from the primary crushing stage except for Quarry 3, where higher clay contents were observed from samples collected during the tertiary crushing stage. The higher clay content in QBs from the primary crushing stage is possibly the result of weathered rock or overburden material, which are more likely to be found in the quarried rocks in the primary crusher.
Atterberg limit tests were performed in accordance with the ASTM D4318 method (ASTM International, 2017a). All QB samples from the four quarries and from different crushing stages were found to be non-plastic. This indicates that QB samples had a low moisture affinity and a low shrink-swell potential.
Based on the American Association of State Highway and Transportation Officials (AASHTO) Soil Classification System, all the QB samples were classified as A-2-4, which represented silty gravel and sand. Based on the Unified Soil Classification System (USCS), the QB samples were mostly well graded sands (SW) or silty sands as shown in Table 3. Classification of silty sand (SM) in general indicates that the percentage of fine materials passing sieve No. 200 was often >12%. Typically, the primary crusher QB samples from Quarries 1–3 produced less fines compared with the secondary and tertiary crusher materials.
Morphological Shape Properties
Aggregate particle shape and angularity were studied using an aggregate image analysis system, known as the Enhanced University of Illinois Aggregate Image Analyzer (E-UIAIA). The E-UIAIA is equipped with three high-resolution (1292 × 964 pixels) charge-coupled device progressive-scan color cameras to capture three orthogonal views (front, top, and side) of individual particles to establish the morphological indices of aggregate particle shape, texture, and angularity. More details on the features of the E-UIAIA can be found elsewhere (Moaveni et al., 2013). Figure 2 shows the E-UIAIA and an example of the three orthogonal views of a particle captured by the camera system.
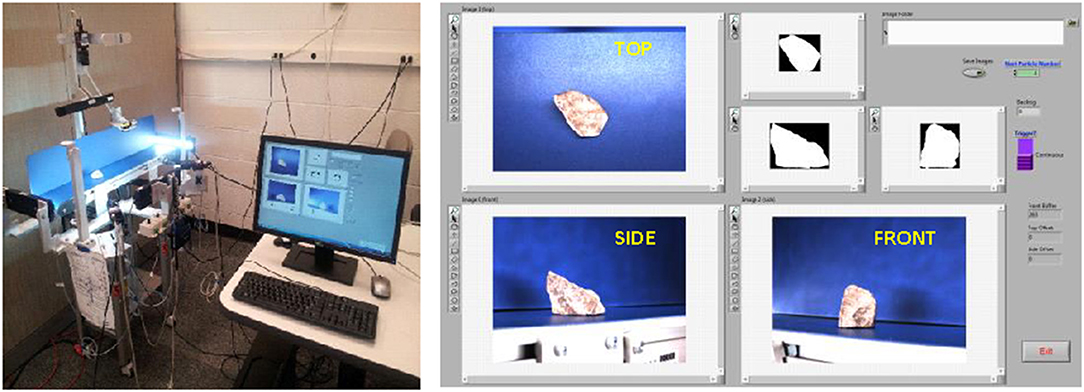
Figure 2. E-UIAIA and the particle front, top, and side views captured (Moaveni et al., 2013).
The Flat and Elongated (F&E) ratio and Angularity Index (AI) were the key image-based indices—measured with the E-UIAIA—for determining the particle shape properties of the different QBs from the different quarries and crushing stages. Approximately 50 particles retained on the No. 8 (2.38 mm) sieve were scanned for QBs from each crushing stage from each quarry to determine trends in particle shape. Average AI values and average F&E ratios for QB materials are presented in Table 4. QB samples from the primary crushers generally tended to have lower AI values indicating the least angular particles, except for Quarry 3. The samples from the secondary crusher had slightly higher value than the samples from the tertiary crusher. These findings supported the visual assessment that primary QB samples appeared to have more round particles than the secondary and tertiary QB samples. Another trend observed was that QB from the primary crusher had the lowest F&E ratio and that QB from the secondary and tertiary crushers had very close F&E ratios. These findings indicated that particles from the primary crusher were more cubical and therefore may have better resistance to breakage. Another observation is that QB samples from Quarry 1 tended to be more angular when compared with samples from the other three quarries. Detailed distributions of shape indices for all the particles scanned by the E-UIAIA are presented in Figure 3. Like the grain size distribution concept, Figure 3 presents the cumulative percent of QB vs. certain shape index from different crushing stages and quarries.
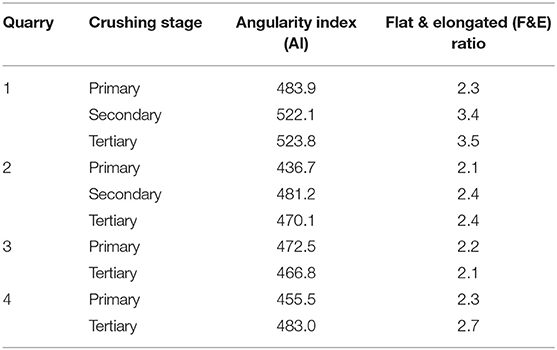
Table 4. Shape properties of quarry by-products sampled from quarries 1–4.
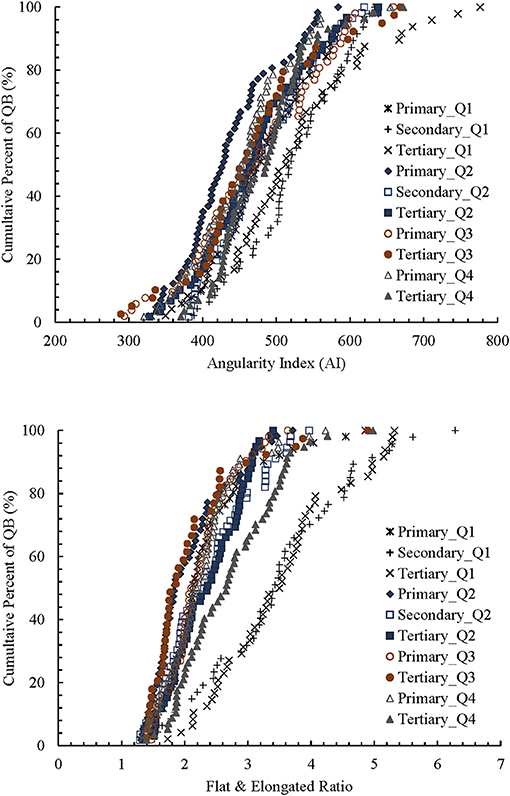
Figure 3. Angularity index and F&E ratio distributions of quarry by-products sampled from quarries 1–4.
Standard Proctor Test
In accordance with ASTM D698 (ASTM International, 2012), the moisture-density compaction characteristics of the virgin QB samples from the four quarries sampled in this study were evaluated; the results are summarized in Table 5. For all QBs from different quarry locations, the Optimum Moisture Contents (OMC) from standard Proctor tests ranged from 7.9 to 10.4%, whereas the Maximum Dry Densities (MDD) ranged from 129.7 to 142.1 pcf (20.4–22.3 kN/m3). In general, the MDD and OMC pairs varied from one quarry location to another. While there was no unique trend for the variation of OMC, for all quarry locations, higher maximum dry density values were observed in QBs from the primary crushing stages.
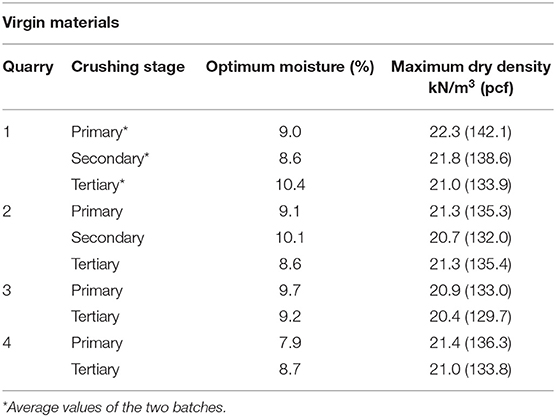
Table 5. Optimum moisture contents and maximum dry densities of quarry by-products sampled from quarries 1–4.
Unconfined Compressive Strength Test
Unconfined Compressive Strength (UCS) tests were performed on the QB samples from all four quarries. The samples prepared for UCS testing were compacted at the OMC and MDD obtained from the moisture-density characteristics of virgin QB materials. The UCS specimens were compacted in a split mold into cylindrical specimens in three equal lifts using the standard Proctor hammer for compaction. The final specimens were 2.8 in. (71 mm) in diameter by 5.6 in. (142 mm) high. All samples were then cured unsealed in a moisture-controlled room at 100% relative humidity and at room temperature for 7 days. Samples were prepared and tested in accordance with the ASTM D2166 method (ASTM International, 2016). For each QB material obtained from a certain crushing stage, two samples were prepared to conduct UCS tests.
In Figure 4, UCS values are presented with the maximum densities obtained from the standard Proctor tests. Note that all QB samples generally exhibited low UCS values. The average UCS values for the QB materials from Quarry 1 decreased in an orderly fashion in different crushing stages. For samples from Quarry 2, the UCS values decreased from the primary crusher QB to the secondary crusher QB but then increased for the tertiary crusher QB. For samples from Quarry 3, the UCS values also decreased from the primary crusher QB to the tertiary crusher QB. For samples from Quarry 4, the UCS values for both the primary and tertiary crushing stages were the same with an average value of 8.1 psi (55.8 kPa).
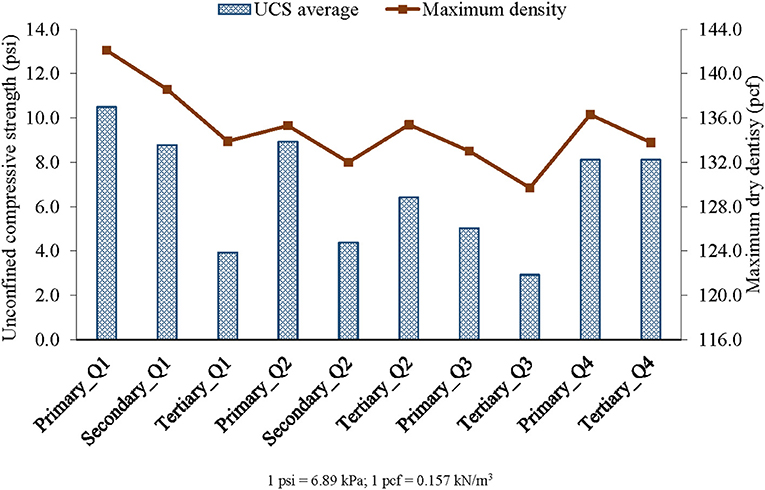
Figure 4. Unconfined compressive strengths and maximum dry densities obtained for virgin QB materials from quarries 1–4.
In addition, a clear trend can be seen between UCS and the maximum dry densities obtained: for samples from the same quarry source, the higher the maximum dry density, the larger the UCS was achieved. This emphasizes the importance of particle size distribution and packing on performance; and therefore, good compaction in the field is required if QB samples are to be used in future pavement applications. Overall however, the compressive strength values of the QB materials were low, thus indicating the need for improvement through stabilization depending on the strength requirements for various highway construction applications.
Stabilization of Quarry By-Products
To increase the strength properties of the QB samples, chemical stabilizers were chosen. While chemical stabilization of soil and aggregates improves their physical and engineering properties, this process depends heavily on the chemical reaction between soil/aggregates and the stabilizers. It is therefore important to choose the right stabilizers to effectively improve the strength. The rationale behind the selection of stabilizers is to obtain maximum strength gain with lowest cost and environmental impact.
According to the previous research study on similar materials, stabilization using low-cement contents appeared to be a cost-effective alternative successfully used in stabilizing quarry by-products. In addition, lower cement content has the benefit of reducing shrinkage potential of cemented materials. Therefore, two percent (2%) Type I Portland cement by the oven-dry weight of the aggregate by-products was used as the first stabilizer in the laboratory. The second choice was fly ash, a by-product of a different industry. Like cement, Class C fly ash possesses cementitious and pozzolanic properties that do not depend on the reaction with clay particles to develop strength. Initial trials of 5 and 10% of Class C fly ash were conducted to determine the proper stabilizer amount and effectiveness. The results of initial trials were presented in a previous publication (Tutumluer et al., 2015). Based on initial trials, the percentage of Class C fly ash used in this study was 10% by the oven-dry weight of the aggregate by-products. The Class C fly ash material conformed to ASTM C618 (ASTM International, 2019b) and AASHTO M295 (ASTM International, 2019a) standards.
Standard Proctor Tests on Stabilized Quarry By-Products
The compaction properties of the cement and Class C fly ash stabilized QB materials were determined as per the ASTM D558 method (ASTM International, 2011). The MDDs and OMCs determined are listed in Table 6. Note that for the 2% cement-treated quarry by-products the OMCs ranged from 6.6 to 9.9% and for the 10% Class C fly ash–treated aggregate by-products, the OMCs ranged from 7 to 8.3%. No clear trend could be established on the effect of quarry location and crushing stage on the MDD and OMC values.
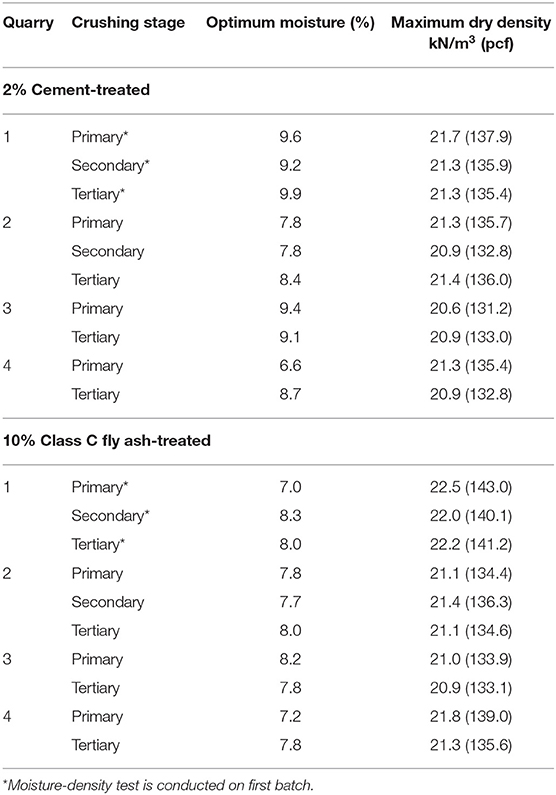
Table 6. Optimum moisture contents and maximum dry densities of stabilized quarry by-products sampled from quarries 1–4.
In general, smaller values of OMC and larger values of maximum dry density were observed for the 10% Class C fly ash-treated QB materials when compared to the 2% cement-treated QBs. Such a difference in the characteristics of aggregate by-products stabilized with Portland cement and Class C fly ash was attributed to the differing amounts of the free lime that each stabilizer contributed during the flocculation and agglomeration phase of the QB treatment.
Unconfined Compressive Tests on Stabilized Quarry By-Products
Unconfined Compressive Strength (UCS) tests were also conducted on the stabilized QB materials to evaluate the benefits of chemical admixture treatment and demonstrate how treated samples of weak soils could be improved to achieve the desired strength.
The maximum dry density and the OMC data obtained from the moisture-density characteristics of treated quarry by-products were used to prepare samples for the UCS tests. Specimens were prepared as per ASTM D1632 and ASTM D1633 for QB materials treated with each of the two stabilizers (ASTM International, 2017b,c). Significant strength increases were reported for the Quarry 1 QB specimens treated with the two stabilizers in an earlier published study (Mwumvaneza et al., 2015). In this paper, new results for QB materials from Quarries 2–4, together with old results for QB materials from Quarry 1 are presented. For these samples, two specimens from each crushing stage were prepared and tested. All the samples treated with admixtures were cured in a moisture-controlled environment for 7 days at room temperature at 100% humidity. Before UCS testing, all the stabilized samples were soaked for 4 h to evaluate the effects of a harsh, moist environment on strength properties.
Table 7 lists the average UCS values obtained for all of the QB samples collected from the four quarries at different crushing stages. Significant strength improvements could be achieved with proper admixture treatment. Note that virgin (untreated) aggregate by-products had very low UCS values, with an average of <11 psi (76 kPa). When 10% Class C fly ash was used, strength gains were ~20–30 times of the original untreated samples. The highest strength values were achieved with 10% fly ash in Quarry 1 samples (more than 300 psi/2,068 kPa), whereas other quarry samples had relatively lower strength values achieved of around 100–300 psi (689–2,068 kPa). On average, the 2% cement-treated QB specimens from all four quarries and crushing stages had consistently high UCS values above 200 psi (1,379 kPa). Virgin QB samples were strengthened by more than 20 times the initial strength by adding 2% cement. Approximately similar gains were achieved by 2% cement and 10% Class C fly ash treatment of QB samples.
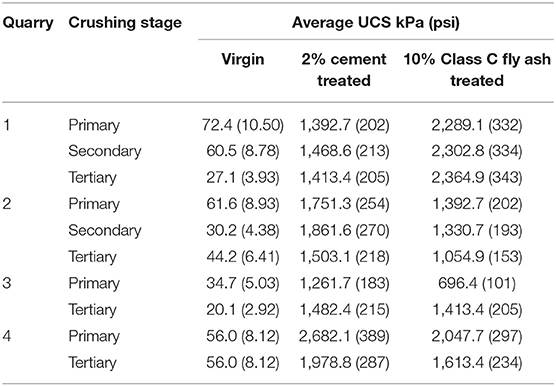
Table 7. Average UCS for virgin QB materials and stabilized QB materials with 2% cement and 10% class C fly ash.
Factors Affecting Unconfined Compressive Strength of Stabilized Quarry By-Products
Dry density achieved
Despite the fact that both 2% cement-treated and 10% Class C fly ash–treated QB materials can reach significantly high strength values compared with virgin materials; differences were observed in the stabilized samples. Figure 5 shows that the fly ash treatment resulted in the highest strength gains for all the QB samples from Quarry 1. However, for all samples from the other quarries, fly ash treatment was less effective than the cement treatment. One possible reason is that materials with 10% Class C fly ash treatment from Quarry 1 achieved significantly higher maximum dry densities when compared to the 2% cement treatment, while the stabilized QB materials from the other quarries did not show such large differences in maximum dry density (see Figure 5). Higher density indicates better compaction/packing and higher strengths, which was certainly the case for the rapid nature of tricalcium aluminate (C3A) reaction taking place in this self-cementing 10% Class C fly ash.
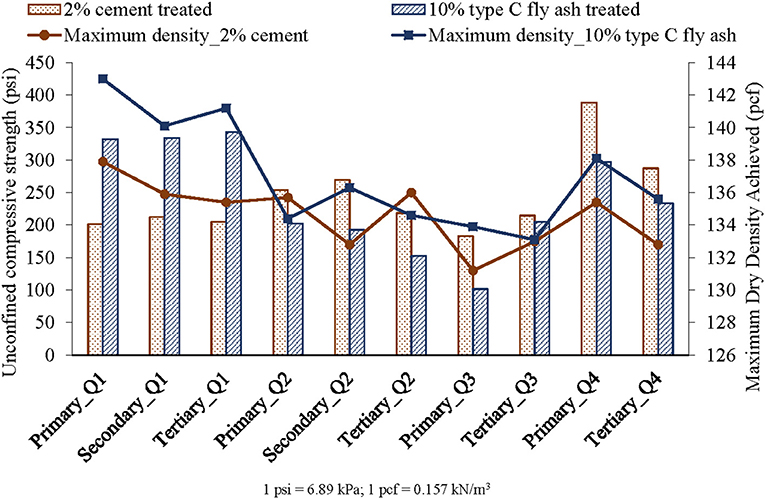
Figure 5. Unconfined compressive strengths and maximum dry densities obtained for 2% cement-treated and 10% Class C fly ash-treated QB materials.
Accordingly, one possible reason that would affect the strength properties of stabilized QB samples can be the compaction and density achieved. To take a closer look at the UCS results, strength properties of the QB samples from the same quarry can be related to the densities achieved (six out of the 10 materials). For example, materials with 10% Class C fly ash treatment from Quarry 1 achieved higher maximum dry density than that achieved by the 2% cement treatment, which resulted in higher compressive strength of Class C fly ash treated materials. Similarly, materials from Quarry 2 primary and tertiary crushers treated with 2% cement achieved higher maximum dry densities and higher compressive strengths when compared to those treated with 10% Class C fly ash. Also, Quarry 3 tertiary crusher materials treated with 2% cement and 10% Class C fly ash achieved approximately the same maximum dry density and compressive strength characteristics. However, for the other four materials tested, such as those from secondary crusher from Quarry 2, primary crusher from Quarry 3, and primary and tertiary crushers from Quarry 4, the achieved maximum dry density trends did not correlate well with the compressive strength characteristics, which indicates that unlike virgin QB samples, whose strength mainly depends on density achieved, there are other governing factors affecting the strength properties of stabilized QB.
Gradation and packing
Another possible factor contributing to the strength of stabilized QB can be the gradation trend and its effect on particle packing. To address the gradation and particle packing concerns, laboratory tests were conducted to determine the effect of QB grain size distribution on the unconfined compressive strength of cement and Class C fly ash stabilized QB. The QBs from Quarry 3 were size separated and engineered to match certain gradation curves that are power exponents of the ratio of the sieve size to the maximum particle size according to the Fuller curve, also commonly known as the Talbot equation: , where pi is the percentage passing the ith sieve, Di is the ith sieve size in mm, Dmax is the maximum sieve size and is taken to be the No. 4 sieve for sampled QB, and “n” is power exponent of the curve. The “n” values considered in this study were 0.3, 0.4, 0.45, 0.5, and 0.6, to obtain five different gradation curves as shown in Figure 6A.
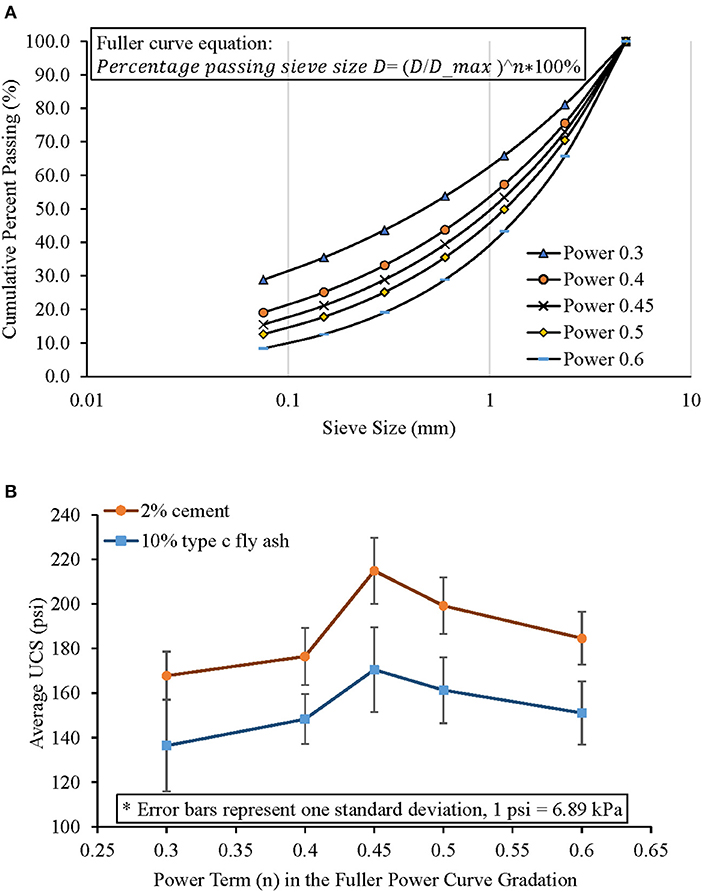
Figure 6. Quarry 3 stabilized QB sample engineered gradations (A) and UCS properties (B) according to Fuller power curve (Talbot equation).
In order to compare the gradation and packing effect, densities and moisture contents for each engineered gradation were set the same as the maximum density and optimum water content for the original gradation obtained from standard Proctor test. Densities achieved were 132.1 pcf (20.7 kN/m3) and 133.5 pcf (21.0 kN/m3) for cement and fly ash stabilized QB samples, respectively. Water contents targeted were 9.2% and 9.4% for cement- and fly ash-stabilized QB samples, respectively. Three replicates were tested for each engineered gradation. More details about this study can be found elsewhere (Qamhia et al., 2016). Accordingly, stabilized QB samples from Quarry 3 had varying strength properties at different engineered gradations. The engineered gradation with the power term “n” equals to 0.45 led to the highest UCS for both the 2% cement and 10% Class C fly ash treatment (see Figure 6B).
The virgin QB gradations from quarries 1–4 were then checked with the engineered gradations for the “n” power values of 0.3, 0.4, 0.45, 0.5, and 0.6 to explain some of the behaviors of stabilized QB strength in this study. As stated previously, four out of the 10 materials, i.e., the secondary crusher from Quarry 2, primary crusher from Quarry 3, and the primary and tertiary crushers from Quarry 4, did not exhibit strong correlations between density and strength. For the QB material from the Quarry 3 primary crusher, this can be explained since the QB gradation curve is close to n = 0.6 power curve. Therefore, possible explanations for a lower strength of the fly ash treated materials are insufficient packing and relatively larger particle sizes diminishing the effectiveness of the fly ash reaction with QB particles. In addition, the secondary crusher QB material from Quarry 2 had higher strength compared with the primary crusher and tertiary crusher QB materials even though the secondary crusher QB material had the lowest density achieved. One possible reason for this is due to a better packing of the secondary crusher QB materials from Quarry 2 since its gradation is very close to the n = 0.45 maximum density gradation curve.
Effectiveness of stabilizer
Effectiveness of the stabilizer can be another factor that affects the strength of stabilized QBs. Note that QB materials from Quarry 1 were tested and characterized for engineering properties first, and then, the rest of the QB materials from the other 3 quarries were tested 10 months later. Class C fly ash has a shelf life that depends on storage conditions, and the effectiveness of fly ash is reduced with time as it hydrates in damp conditions. As a result, the free lime in Class C fly ash decreases over time and the cement hydration process for QB samples from quarries 2–4 is less effective than for QB samples from quarry 1. This may explain the reduction in the strength gains with three of the QB materials tested afterwards. Thus, it is expected that fly ash was highly reactive when QB materials from Quarry 1 were tested and the strength gains with 10% Class C fly ash were possibly higher than those for the 2% cement treated samples as well as the other QB materials stabilized with 10% Class C fly ash.
Chemical composition of QB
Another factor that controls the effectiveness of stabilization is the chemical composition of QB. The cementitious and pozzolanic reactions are the major causes of strength increase, which depends highly on the properties of soils and stabilizers. In this study, X-Ray Fluorescence (XRF) technique was utilized to determine the chemical composition of the tested QB materials. XRF is a non-destructive analytical technique to determine the elemental composition of QB materials. The chemical composition results are shown in Table 8. Note that components <1% by composition of QB samples are omitted here.
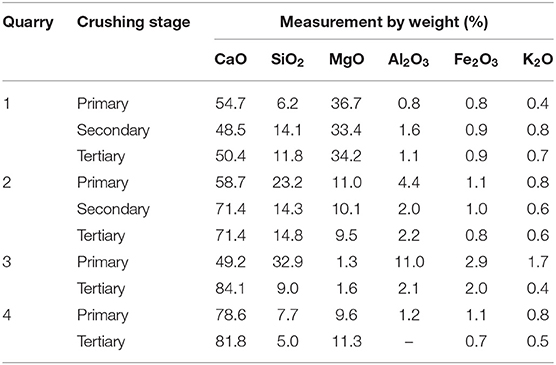
Table 8. Chemical composition of quarry by-products sampled from quarries 1–4.
As seen in Table 8, QB samples from the same quarry usually have similar chemical composition since they are composed of the same mineral substances as the parent aggregates from which they are derived. To be more specific, CaO is the major component for QBs from all four quarries. When comparing the percentage of MgO and SiO2, it can be seen that QBs from Quarry 2 and Quarry 3 primary crusher have higher amount of SiO2; QBs from Quarry 1 have higher amount of MgO; while QBs from Quarry 3 have least amount of MgO. However, there still might be substantial differences in composition among different crushing stages due to production processes and weathering condition due to storage of QBs. QBs from primary and tertiary crushers from Quarry 3 are quite different in composition. For example, QB from Quarry 3 primary crusher has significantly lower CaO content, significantly higher SiO2 content compared with QB from tertiary crusher, and also the highest amount of Al2O3 among all samples. This might explain why QBs from Quarry 3 primary and tertiary crushers exhibit such different strength behaviors. Unlike all the other samples from Quarries 1, 2, 4, where primary crusher has more strength gain than tertiary crusher, QBs from Quarry 3 primary crushers gains less strength during stabilization. This is probably due to higher CaO amount in QB from tertiary crusher, which accelerates the cement hydration process in the 7-day testing period. Similarly, QBs from Quarry 4 are rich in CaO, which exhibits the largest strength gain during cement stabilization. In terms of long-term strength gain, it is expected that QBs consisting higher amount of SiO2 and Al2O3 tend to gain more strength with pozzolanic reaction.
In conclusion, on the basis of the UCS measurements, both 2% cement and 10% Class C fly ash were shown to be effective stabilizers that can be used with the aggregate by-products for strength improvement. For the virgin QB samples, it appears that density is the main factor governing the strength of QB such that high densities correlate to high UCS values for all four quarry materials. On the other hand, for stabilized QB materials, several other factors may control strength, including density, gradation and packing, particle shape and angularity, chemical composition of QB samples as well as the effectiveness of stabilizer.
Summary and Conclusions
This paper presents findings of the Illinois Center for Transportation study on Quarry By-products (QBs), the residual deposits from the production of required grades of aggregate. The objectives of this study were to determine the material properties of aggregate by-products through laboratory testing and materials characterization, and to evaluate the feasibility of using QBs in various pavement applications. A full matrix of laboratory tests i.e., modified methylene blue, dry sieve analysis, moisture density, Atterberg limits, shape properties, XRF, and unconfined compressive strength were performed to explore the feasibility of using QB in pavement applications as an area that can consume higher amounts of QB. The performed tests also helped to evaluate and distinguish QB samples collected from the primary, secondary, and tertiary crushing stages. The overall strength properties of QBs from all the four quarries were found to be low. Accordingly, chemical admixture stabilization alternatives using Portland cement and Class C fly ash were studied as means to improve the strength and durability characteristics of QBs. For that evaluation, moisture density and UCS tests were conducted on treated QB samples. The addition of cement and fly ash considerably increased the strength properties. Several factors that affect the strength property of stabilized QB samples were discussed and evaluated, including density, gradation and packing, chemical composition, and the effectiveness of stabilizers.
Based on the research findings, the following conclusions can be drawn from the study:
1. According to Unified Soil Classification System (USCS), the QB samples collected from four different quarries in Illinois were determined to be primarily silt and sand-sized particles.
2. The QB samples obtained from all quarry locations were essentially non-plastic.
3. QB samples from the three crushing stages showed similar trends in strength characteristics. In general, all the samples obtained from the four quarries with different geological locations in Illinois exhibited low UCS values (<11 psi/76 kPa). The UCS results of virgin QBs were directly proportional to the maximum dry densities obtained from standard Proctor tests.
4. Significant increases in UCS values were achieved for QB samples treated with stabilizers (i.e., 2% Portland cement and 10% Class C fly ash). Based on the strength gains observed, it was determined that the use of the 10% Class C fly ash could be the most effective, considering both the environmental and economic aspects of aggregate by-product stabilization. The 10% Class C fly ash–treated materials could achieve UCS values as high as 340 psi (2,344 kPa) and no lower than 100 psi (689 kPa) for all the QBs tested.
5. The study on the effect of packing and grain size distribution on UCS of QB showed that gradation is one of the main factors controlling the strength of cement and Class C fly ash stabilized QB. The highest UCS values were obtained for gradation curves with a power term “n” equals to 0.45 in the Talbot equation (Fuller gradation curve with “n” equals to 0.45) for both the 2% cement and 10% Class C fly ash treatment.
6. The XRF test on QB showed that chemical composition is another main factor contributing to the strength of the stabilized QB. Further investigation of detailed correlation between chemical composition and strength is needed.
The use of QB materials with fly ash stabilization can provide opportunities to develop sustainable pavement construction strategies. Fly ash is a by-product of coal-burning plants, and using Class C fly ash as an admixture for treating aggregate by-products can be a more cost-effective option for sustainable pavement applications. While the 7-day gain in UCS values is promising, further investigation of the chemical properties of stabilized QB mixes is needed. Recommendations for future work include investigating the 28-day compressive strength properties for stabilized QB mixes, testing more QB sources with different parent materials and geological origins, and testing the dynamic properties of these QB materials with repeated load triaxial testing. Further, field validation is recommended for the full assessment of the performance of the treated QB materials in sustainable pavement applications.
Data Availability Statement
The datasets generated for this study are available on request to the corresponding author.
Author Contributions
The authors confirm contribution to the paper as follows: WH, IQ, VM, ET, and HO: study conception and design, analysis and interpretation of results. WH, IQ, and VM: data collection. WH and IQ: draft manuscript preparation. All authors reviewed the results and approved the final version of the manuscript.
Conflict of Interest
VM is employed by Dynatest Nort America. However, VM was a graduate student at UIUC when he was involved with the research work described in this paper.
The remaining authors declare that the research was conducted in the absence of any commercial or financial relationships that could be construed as a potential conflict of interest.
Acknowledgments
This publication is based on the results of ICT-R27-125 project which focused on characterizing quarry by-products in pavement applications. ICT-R27-125 was conducted in cooperation with the Illinois Center for Transportation; the Illinois Department of Transportation, Office of Program Development; and the U.S. Department of Transportation, Federal Highway Administration. The final report of the ICT R27-125 project, entitled, Sustainable Aggregates Production: Green Applications for Aggregate By-Products, can be accessed via https://apps.ict.illinois.edu/projects/getfile.asp?id=3507. The authors would like to acknowledge Pengcheng Wang and Joshua S. Cheung, graduate students at the University of Illinois at Urbana-Champaign, for their help with the laboratory work. Cooperation and support of the Illinois Association of Aggregate Producers is greatly appreciated. The contents of this paper reflect the views of the authors who are responsible for the facts and the accuracy of the data presented herein. This paper does not constitute a standard, specification, or regulation.
References
ASTM International (2011). “ASTM D558-11 standard test methods for moisture-density (unit weight) relations of soil-cement mixtures,” in Annual Book of ASTM Standards 2011 (West Conshohocken, PA: American Society for Testing and Materials).
ASTM International (2012). “ASTM D698-12e2 standard test methods for laboratory compaction characteristics of soil using standard effort (12 400 ft-lbf/ft3 (600 kN-m/m3)),” in Annual Book of ASTM Standards 2012 (West Conshohocken, PA: American Society for Testing and Materials).
ASTM International (2014). “ASTM C136/C136M-14 standard test method for sieve analysis of fine and coarse aggregates,” in Annual Book of ASTM Standards 2014 (West Conshohocken, PA: American Society for Testing and Materials).
ASTM International (2016). “ASTM D2166/D2166M-16 standard test method for unconfined compressive strength of cohesive soil,” in Annual Book of ASTM Standards 2016 (West Conshohocken, PA: American Society for Testing and Materials).
ASTM International (2017a). “ASTM D4318-17e1 standard test methods for liquid limit, plastic limit, and plasticity index of soils,” in Annual Book of ASTM Standards 2017 (West Conshohocken, PA: American Society for Testing and Materials).
ASTM International (2017b). “ASTM D1632-17 standard practice for making and curing soil-cement compression and flexure test specimens in the laboratory,” in Annual Book of ASTM Standards 2017 (West Conshohocken, PA: American Society for Testing and Materials).
ASTM International (2017c). “ASTM D1633-17 standard test methods for compressive strength of molded soil-cement cylinders,” in Annual Book of ASTM Standards 2017 (West Conshohocken, PA: American Society for Testing and Materials).
ASTM International (2019a). AASHTO M 295-19 Standard Specification for Coal Fly Ash and Raw or Calcined Natural Pozzolan for Use in Concrete. Washington, DC: American Association of State Highway and Transportation Officials.
ASTM International (2019b). “ASTM C618-19 standard specification for coal fly ash and raw or calcined natural pozzolan for use in concrete,” in Annual Book of ASTM Standards 2019 (West Conshohocken, PA: American Society for Testing and Materials).
Dumitru, I., Zdrilic, T., and Johnson, G. (2001). “Further investigations of soil remineralization using quarry fines in Australia,” in ICAR 9th Annual Symposium (Austin, TX).
Hudson, W., Little, D., Razmi, A., Anderson, A., and Weissmann, A. (1997). An Investigation of the Status of By-Product Fines in the USA. Austin, TX: International Center for Aggregates Research.
Kalcheff, I., and Machemehl, C. (1980). “Utilization of crushed stone screenings in highway construction,” in 59th Annual Meeting of the Transportation Research Board (Washington, DC), Vol. 135.
Kumar, D., and Hudson, W. (1992). Use of Quarry Fines for Engineering and Environmental Applications. Austin, TX: National Stone Association, Center for Transportation Research.
Lohani, T., Padhi, M., Dash, K., and Jena, S. (2012). Optimum utilization of quarry dust as partial replacement of sand in concrete. Int. J. Appl. Sci. Eng. Res. 1, 391–404. doi: 10.6088/ijaser.0020101040
Manning, D. (2004). Exploration and Use of Quarry Fines. Manchester, UK: Report No. 087/MIST2/DC/01, MIST Project Reference: MA/2/4/003, Mineral Solutions.
McClellan, G., Eades, J., Fountain, K., Kirk, P., and Rothfuf, C. (2002). Research and Techno Economic Evaluation: Uses of Limestone Byproducts. Gainesville, FL: University of Florida; Florida Department of Transportation.
Moaveni, M., Wang, S., Hart, J., Tutumluer, E., and Ahuja, N. (2013). Evaluation of aggregate size and shape by means of segmentation techniques and aggregate image processing algorithms. J. Transp. Res. Board 2335, 50–59. doi: 10.3141/2335-06
Mwumvaneza, V., Hou, W., Ozer, H., Tutumluer, E., Al-Qadi, I. L., and Beshears, S. (2015). Characterization and stabilization of quarry byproducts for sustainable pavement applications. Transport. Res. Rec. J. Transport. Res. Board 2509, 1–9. doi: 10.3141/2509-01
Naik, T., Rudolph, N., Chun, Y., Fethullah, C., and Bruce, W. (2005). Use of Fly Ash and Limestone Quarry Byproducts for Developing Economical Self-Compacting Concrete. Milwaukee, WI: Center for By-Products Utilization.
Petavratzi, E., and Wilson, S. (2007). Sustainable Utilization of Quarry By-Products. Birmingham: Mineral Industry Research Organization (MIRO).
Pitre, B. (2012). Application of the Modified Methylene Blue Test to Detect Clay Minerals in Coarse Aggregate Fines. Station, TX: Texas A&M University.
Puppala, A., Saride, S., Sirigiripet, S., and Williammee, R. (2008). “Evaluation of cemented quarry fines as a pavement base material,” in GeoCongress 2008: Geotechnics of Waste Management and Remediation (New Orleans, LA), 312–319.
Puppala, A., Saride, S., and Williammee, R. (2012). Sustainable reuse of limestone quarry fines and RAP in pavement base/subbase layers. J. Mater. Civil Eng. 24, 418–429. doi: 10.1061/(ASCE)MT.1943-5533.0000404t
Qamhia, I., Cheung, J., Hou, W., Mwumvaneza, V., Ozer, H., and Tutumluer, E. (2016). “Gradation effects on the strength properties of cement and fly ash stabilized quarry by-products,” in Geo-Chicago 2016 (Chicago, IL), 610–620.
Qamhia, I., Tutumluer, E., and Ozer, H. (2018). Field Performance Evaluation of Sustainable Aggregate By-product Applications. Rantoul, IL: Illinois Center for Transportation/Illinois Department of Transportation.
Qamhia, I., Tutumluer, E., Ozer, H., Shoup, H., Beshears, S., and Trepanier, J. (2019). Evaluation of chemically stabilized quarry byproduct applications in base and subbase layers through accelerated pavement testing. Transport. Res. Record 2673:0361198118821099. doi: 10.1177/0361198118821099
Stokowski, S. (1992). “Pond screening from aggregate plants: an industrial minerals resource,” in 28th Forum on the Geology of Industrial Minerals (Morgantown, WV: West Virginia Geological and Economic Survey), 187–191.
Stroup-Gardiner, M., and Wattenberg-Komas, T. (2013). “Recycled materials and byproducts in highway applications, mineral and quarry byproducts,” in NCHRP Synthesis of Highway Practice (Washington, DC: Transportation Research Board of the National Academics), Vol. 4. doi: 10.17226/22549
Tarmac Ltd. and Partners (2011). New and Novel Streams for Quarry Dust and Fillers Feasibility Review. Final Project Report No. MA/7/G/5/004–WP3.
Tutumluer, E., Ozer, H., Hou, W., and Mwumvaneza, V. (2015). Sustainable Aggregates Production: Green Applications for Aggregate By-Products. Rantoul, IL: Illinois Center for Transportation/Illinois Department of Transportation.
Keywords: aggregate, quarry by-product, engineering properties, admixture stabilization, unconfined compressive strength, sustainable pavement applications, aggregate packing, X-ray fluorescence
Citation: Hou W, Qamhia I, Mwumvaneza V, Tutumluer E and Ozer H (2019) Engineering Characteristics and Stabilization Performance of Aggregate Quarry By-Products From Different Sources and Crushing Stages. Front. Built Environ. 5:130. doi: 10.3389/fbuil.2019.00130
Received: 11 September 2019; Accepted: 21 October 2019;
Published: 19 November 2019.
Edited by:
Yifei Sun, Hohai University, ChinaReviewed by:
Libin Gong, University of Wollongong, AustraliaPei Tai, Hong Kong Polytechnic University, Hong Kong
Copyright © 2019 Hou, Qamhia, Mwumvaneza, Tutumluer and Ozer. This is an open-access article distributed under the terms of the Creative Commons Attribution License (CC BY). The use, distribution or reproduction in other forums is permitted, provided the original author(s) and the copyright owner(s) are credited and that the original publication in this journal is cited, in accordance with accepted academic practice. No use, distribution or reproduction is permitted which does not comply with these terms.
*Correspondence: Erol Tutumluer, dHV0dW1sdWVAaWxsaW5vaXMuZWR1