 Marius Nygaard
 Isaak Elias Skjeseth Bashevkin
 Ute Groba
- The Oslo School of Architecture and Design (AHO), Oslo, Norway
The choice of materials may play an important role in achieving the common European aims of near zero energy demand and greenhouse gas (GHG) emissions in the lifecycle of buildings. The production of timber materials demands lower emissions than concrete and steel. To guide political and industrial priorities, it is vital to estimate the emission effects of increased use of timber.
The article reports on a broad study that had the following aims:
1. To forecast the number, types, floor area, and location of new buildings that will be built in Oslo and Akershus counties between 2015 and 2030.
2. To estimate how many of these new buildings (a) will be and (b) could be built with timber as the main construction material.
3. To compare these timber potentials to the present and future availability of nationally and sustainably sourced and manufactured timber.
4. To estimate the effect on GHG emissions when substituting concrete and steel with timber in the production of new buildings in Oslo and Akershus counties between 2015 and 2030.
The research is based on official prognoses for population growth. They are combined with building predictions derived from municipal statistics and plans. A GHG reduction factor is extracted from existing studies of the effects of conversion to timber. This factor is used to estimate the GHG saving potentials of different scenarios for timber use.
Main results:
• The forecast of building numbers, categories, sizes and location is a useful tool when discussing environmental, urban, industrial and architectural strategies.
• Housing in 2–8 stories, not high-rise buildings, represents the biggest potential for increased use of timber in Norway.
• Scientific consensus is not established regarding timber buildings and emissions. Especially the effects of carbon storage in long-lived products and use of residues for biofuel substitutes fossil fuel are still debated. To convey an order of magnitude, the different emission-saving effects are separated.
• The estimates of GHG mitigation indicate that conversion to use of timber may have significant effects, but measures in the transport sector are more important for reaching the ambitious emission targets in Oslo and Akershus counties.
• To be robust, the argument for timber buildings must include the perspective of a green industrial shift based on renewable resources and innovative technology, design and architecture.
• The vicinity of Norway's biggest and most rapidly growing market for timber buildings and the country's largest forests and timber-based industries represents a unique opportunity for sustainable urban and regional development.
Background
Emissions Context
Global—National—Counties
The Intergovernmental Panel on Climate Change (IPCC) delivered its fifth assessment report in 2014. The report concludes that it is “extremely likely” (95–100% probability) that greenhouse gas emissions related to human activity is the dominant cause of the global warming observed since the mid Twentieth century. Continued high emissions will have negative impacts for biodiversity, ecosystems and economic development, and amplify risk for livelihoods and human security (IPCC, 2014).
The Paris climate agreement was formulated 12th of December 2015, at the end of the 21st Conference Of the Parties (COP 21) to the United Nations Framework Convention for Climate Change (UNFCCC, 2015). It entered into force 4th of November 2016. Norway was one of the first countries to ratify the agreement, which aims to keep the “increase in the global average temperature to well below 2°C above pre-industrial levels and pursue efforts to limit the temperature increase to l.5°C” (UNFCCC, 2015). The parties of the agreement are obliged to formulate adequate and binding aims for their emission reductions and to report on their progress in fulfilling the aims.
Following up the Paris agreement, the Norwegian parliament in June 2017 passed a Climate bill (Ministry of Climate and Environment, 2017). Here, the national GHG emissions in 2030 are set to be 40% lower than in 1990. By 2050 Norway shall be a “low emission society,” which is estimated to represent 80% to 95% reduction compared to the 1990 emissions. The Norwegian policies on climate change have been founded on broad “Climate settlements” in the Parliament in 2008 and 2012.
In 2015 the total GHG emissions in Oslo were 1,232 million metric tons CO2eq, and in Akershus 1,773 million tons CO2eq, in all ca. 3 million tons CO2eq. This was 8.6% of the 35 million tons CO2eq that could be allocated to Norway's counties. The remaining 19 million tons of the national total of 54 million tons could not be linked to individual counties (Statistics Norway, 2017a). They include emissions from air transport, off-shore oil and gas production and coastal ship transport. In 2015 Oslo, with 0.648 million people, and the adjacent Akershus county with 0.585 million, together had 24.8% of Norway's 5.1 million inhabitants (Ministry of Foreign Affairs, 2015). This means that the per capita emissions in Oslo and Akershus are low. The main reasons are the absence of heavy industries and, especially in Oslo, a denser urban structure that reduces transport-related emissions. The dominance of hydroelectric power for heating means that the emissions from use of buildings in Norway are low compared to other regions with similar climate. On the other hand, Oslo and Akershus constitute the fastest growing urban region in Norway (Leknes, 2016). Accordingly, the emissions related to production of building materials and construction of buildings are higher than the national average.
In June 2016 the “Climate and Energy Strategy for Oslo” was adopted by the City council (Oslo City Council, 2016). It targets 95% reduction of GHG emissions by 2030 compared to 1990 levels. The proposed Climate and Energy Plan (2018) for Akershus county sets the aim to 55% reduction by 2030 compared to 1991 levels, and a further reduction to 85–90% by 2050 (Akershus County Council, 2018). The combined 2030 aims of the counties amounts to a reduction of around 2.1 million tons CO2eq, of the annual GHG emissions.
Emissions From Buildings
IPCC estimated that the building sector accounted for 19% of global GHG emissions in 2010, most of which were indirect emissions from use of electricity (IPCC, 2014, p. 678). In Oslo, fossil fuel for heating of buildings represented 17% of the city's 2013 GHG emissions (Oslo City Council, 2016). In Akershus county, where road transport is a more dominant factor, heating of buildings accounted for 5.8% (Akershus County, 2016).
The 2010 EU Directive on the energy performance of buildings aims for “nearly zero” energy consumption for all new buildings by 2020 (EC, 2017). As climate change and global warming has become the central environmental issues, zero energy has been substituted by zero emissions as the ultimate ambition. This is also the aim of initiatives like the Norwegian Research Center on Zero Emission Buildings (ZEB). ZEB has defined levels of Zero Emission performance for buildings and methods for life cycle emission analyses (Dokka et al., 2013). Their research shows that as the energy required for the use of buildings is reduced, the energy and emissions embedded in the building itself gain importance. Low emissions from production of materials and the construction and maintenance of buildings must be minimized to achieve zero energy and zero emission lifecycles (Lützkendorf et al., 2014).
Emissions From Production of Materials
The IPCC reports and the national, regional, and municipal strategies in Norway have so far focused on emissions related to the use of buildings, not on their production. In Norwegian statistics, emissions from manufacturing of building materials are included in the industrial emissions. The industries are subdivided in branches like metallurgy, mineral products, chemicals, wood, oil refinery and mining, and not in market segments like construction, shipbuilding etc. (Norwegian Environment Agency, 2014). This limits the overview needed for integrated policy-making. In a study from 2007, energy consultants KanEnergi made rough estimates of emissions from production of building materials in each industry (Bernhard and Jørgensen, 2007). They amounted to 3.85 million tons CO2eq, or 7% of the annual Norwegian emissions. The use of buildings accounted for only 4.3% due to the availability of hydroelectric power for heating.
IPCC (2014, p. 841) refers to studies showing that using wood from sustainably managed forests as substitute for concrete, steel etc. in the construction sector will reduce GHG emissions in most cases. Wood should primarily be used for products with long lifecycles, and the energy use of woody biomass focused on residues from production and end-of-lifecycle of the long-lived products. In a comprehensive study, Oliver et al. (2014) estimated that wood-based substitutes could save 14–31% of the global emissions by using 34–100% of the worlds' sustainable forest growth. The Norwegian Environment Agency, The Norwegian Agriculture Agency, and the Norwegian Institute for Bioeconomy Research (NIBIO) also conclude that using wood as substitute for more emission-intensive materials, and wood residues as bioenergy to substitute fossil fuel was more effective than preservation of forests alone in reducing GHG emissions (Norwegian Environment Agency, 2016). The time perspective and the biodiversity effects of achieving carbon neutral or carbon-negative forestry are still under discussion (IPCC, 2014, p. 841).
Timber has been the dominant building material in Norway, and new products like cross-laminated timber (CLT) has increased the applicability of wood also in large, urban projects. An international shift to performance-based building codes together with special Norwegian requirements for sprinkler systems in multi-story buildings have also removed barriers for use of timber (Sorthe et al., 2015). In Norway the use of timber in larger projects was supported by public initiatives like the Wood-based Innovation Programme (2006–2016) and the Norwegian Wood Project (NAL/Ecobox, 2009). Among the innovative timber projects were Svartlamoen housing in Trondheim by Brendeland and Kristoffersen (2005), The Pulpit Mountain Lodge (2008), and Vennesla library and cultural center (2011) by Helen & Hard, Artec's 14-story Treet in Bergen (2015), and Moholt 50/50 student housing in Trondheim by MDH architects (2017). The steadily growing number of varied built examples and the technical and environmental aspects of multi-story urban timber buildings are well-documented in recently published books (Cheret et al., 2014; Mayo, 2015; Kaufmann et al., 2017). Flindall and Nygaard (2016) showed that when clients, consultants and constructors are systematically updated on new timber solutions, market penetration may be rapid.
Method and Results
Aims of Article and Calculation Overview
This article reports on a broad study that had the following aims:
1. To forecast the number, types, floor area, and location of new buildings that will be built in Oslo and Akershus counties between 2015 and 2030.
2. To estimate how many of these new buildings (a) will be and (b) could be built with timber as the main construction material.
3. To compare these timber potentials to the present and future availability of nationally and sustainably sourced and manufactured timber.
4. To estimate the effect on GHG emissions when substituting concrete and steel with timber in the production of new buildings in Oslo and Akershus counties between 2015 and 2030.
Current buildings statistics were distributed among categories of buildings within sub-regions according to the sub-regions' development characteristics. Together with population forecasts the building statistics were used to estimate the total floor area of new buildings to be built between 2015 and 2030 in Oslo and Akershus counties. These building forecasts were used as the basis for estimating the potential floor area of timber buildings in three scenarios ranging from (i) current levels of timber usage, (ii) a moderate increase, and (iii) a theoretical potential. A rough estimate of the timber volume needed to realize the scenarios was also made to see if it could be harvested sustainably from Norwegian forests. In the final phase, the timber building scenarios were used to calculate the GHG emission reduction potential related to the substitution of more emission-intensive building materials. The emission effects of using wood residues as bioenergy to substitute fossil energy and of the sequestration of carbon in buildings were also estimated.
The authors envisioned a geographically distributed building prognosis as basis for the research. It will contribute to an understanding of the architectural character of urban development as well as the accumulated need for building materials and its industrial, environmental and political implications. The study reveals limitations in data about buildings and research related to materials and emissions. The simple and transparent approach is intended to offer a robust framework for further refinement.
Population Forecast
Method
Statistics Norway's (Statistics Norway, 2017b) registrations of Oslo and Akershus' current population and SSB's main alternative for population development (MMMM—the medium projection of fertility rates, life expectancy, domestic migration, and immigration) were used to calculate the current and predicted population numbers for all Akershus municipalities and Oslo districts.
The municipalities and city districts of Oslo and Akershus were grouped into nine sub-regions with similar development patterns and roles in The Regional Plan for Oslo and Akershus (Akershus County, 2015). They are shown in Figure 1:
1. Oslo Inner City (districts: Frogner, Gamle Oslo, Grünerløkka, Sagene, Sentrum, and St. Hanshaugen)
2. Oslo Outer City West (districts: Nordre Aker, Ullern, and Vestre Aker)
3. Oslo Outer City East (districts: Alna, Bjerke, Grorud, and Stovner)
4. Oslo Outer City South (districts: Nordstrand, Søndre Nordstrand, and Østensjø)
5. Akershus West City Band (municipalities: Asker and Bærum)
6. Akershus South City Band (municipalities: Oppegård, Ski, and Ås)
7. Akershus North City Band (municipalities: Lørenskog, Skedsmo, Sørum, and Ullensaker)
8. Akershus South (municipalities: Enebakk, Frogn, Nesodden, and Vestby)
9. Akershus North & East (municipalities: Aurskog-Høland, Eidsvoll, Fet, Gjerdrum, Hurdal, Nannestad, Nes, Nittedal, and Rælingen).
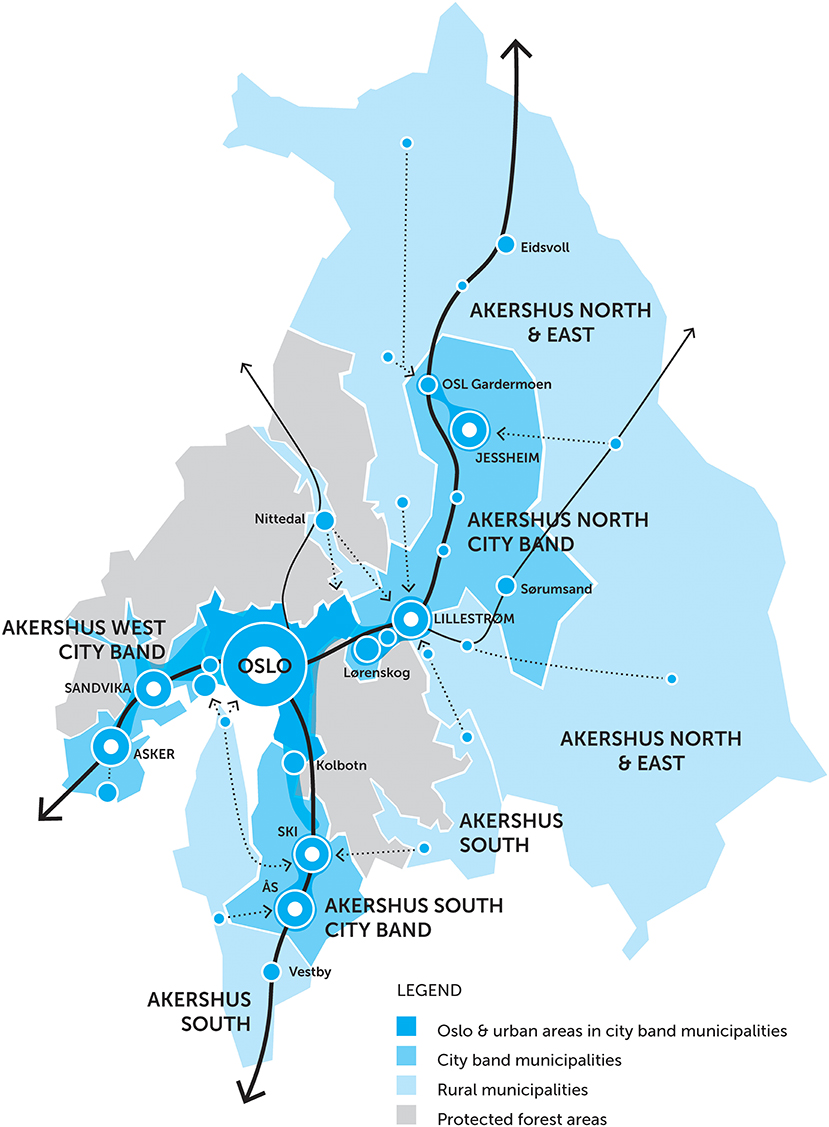
Figure 1. The geographic boundaries of the defined sub-regions on a map of Oslo and Akershus.
Results
The projected increase in population in the municipalities and city districts of Oslo and Akershus between 2015 and 2030 is between 10 and 40% per municipality and 12–30% per sub-region, with an overall average of 20%. The grouped city districts within Oslo are between 20 and 25% (Figure 2).
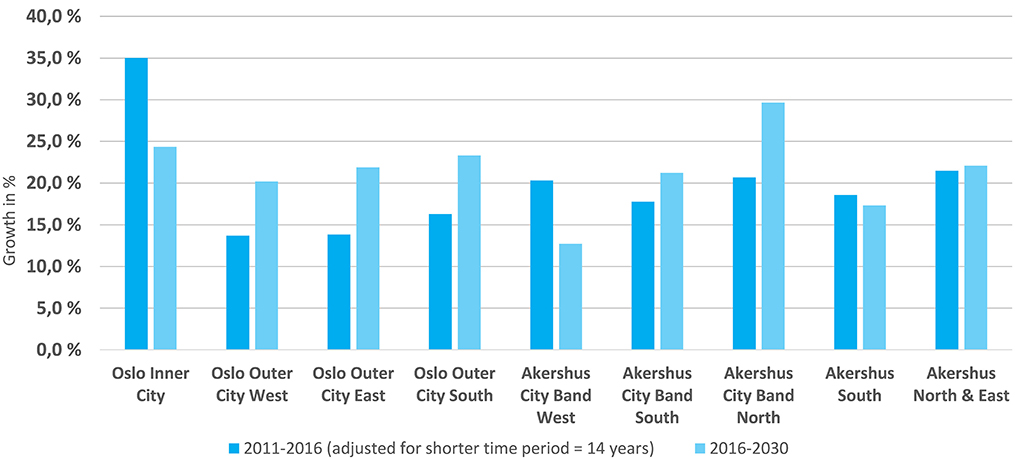
Figure 2. The distribution of population growth in the sub-regions.
Building Forecast
Method
Building data was collected from the cadastre (Infoland Ambita, 2016) and Statistics Norway (SSB) (Statistics Norway, 2016) and structured into six main categories of buildings. The buildings within each category share requirements regarding functions, structures, technology and regulations. They also belong to specific sectors and markets that depend on common economic cycles and political programs. These factors influence the demand for new buildings in each category and also architectural design and choice of building materials.
1. DETACHED AND ROW HOUSING +
Includes data from the following SSB building categories:
• Detached housing
• Row housing
• Cabins
• Housing garages
• Temporary housing.
2. HOUSING COMPLEX 2–8 STORIES
Includes data from the following SSB building categories:
• Apartment buildings 2–4 stories
• Apartment buildings 5–8 stories.
3. HOUSING COMPLEX 9+ STORIES
Includes data from the following SSB building categories:
• Apartment buildings nine or more stories.
4. OFFICE, HOTELS, AND SHOPPING +
Includes data from the following SSB building categories:
• Offices, service buildings, and hotels
• Shopping centers, terminals, and congress halls.
5. EDUCATION, HEALTH CARE, CULTURE, AND SPORTS +
Includes data from the following SSB building categories:
• Educational, research, and child care
• Culture, religion, and sports
• Healthcare and emergency services.
6. INDUSTRY, LOGISTICS, AND AGRICULTURE
Includes data from the following SSB building categories:
• Industry, warehouses, and farming.
Building data for the remaining categories, related to energy supply and underground buildings were deliberately left out of further calculations due to a negligible volume of buildings and since they in most cases are not compatible with timber as a main building material.
In this study, square meters of gross internal area (m2 GIA) is used throughout as a functional unit for area of buildings. This also goes for data extracted from existing studies.
Current building data (2015) was collected for the total number of buildings, total GIA, average GIA per capita, and average GIA per building and category. Additional data was collected for the total number of housing units, average GIA per housing unit and average housing units per building and housing category.
Projected building data (2030) was collected based on the SSB MMMM population predictions, and the building activity trends and registered population development in the past 5–8 years (up to 2015). Data was collected for both the number of new buildings and the total number of buildings, as well as new and total GIA per building category, and new and total number of housing units per housing category.
The cadastre-database was found to be lacking a substantial amount of information, between 25 and 45% of the building areas in most municipalities. The resulting data is therefore based on the information and distribution in the cadastre, but adjusted to match the more accurate total numbers in the SSB database.
Results
The current distribution of building categories differs between the nine sub-regions, with a dominance of fewer and larger buildings in central areas. For example, 90% of dwellings in Oslo Inner City are in apartment buildings, of which 50% are between 5 and 8 stories. In contrast, 94% of dwellings in Akershus North & East are in detached housing and row housing. The current average size of housing units also differs between sub-region, ranging from 50 m2/capita in Oslo Inner City to 80 m2/capita in Akershus North & East.
Based on building trends in the past 5–8 years (before 2015), and The Regional Plan for Oslo and Akershus, the distribution between the different building categories is projected to change from 2015 to 2030. The total projected new building area in Oslo and Akershus is 25 million m2, distributed on 64,000 new buildings. In our building forecast, Oslo Outer City East sees the largest increase in floor area with 4.6 million m2 shared between 9,000 new buildings, whilst Akershus South sees an increase of only 1.1 million m2 in 3,800 new buildings. Oslo Inner City is projected to have a new building area of 4 million m2 divided on only 2,200 new buildings.
The estimated total new number of housing units for Oslo and Akershus is 120,000, roughly following the distribution pattern of new floor areas, with the greatest increases in Oslo Inner City, Oslo Outer City East, Akershus North City Band and Akershus North & East.
The method used above is based on a strong correlation between population increase and the initiation of building projects. In practice, the industry has had a delayed response to variation in demand. After 2015, important sectors like the oil-based industries and building and property in Norway has showed signs of slowing down. Both the population and the building forecast therefore must be regarded as high.
Timber Potential Estimate
Method
Three different timber scenarios were developed in order to calculate the potential use of timber in future developments. These were based on:
• Scenario 1, current use. Assumes the % of timber buildings in each category to stay the same in the future as it is today (2015),
• Scenario 2, moderate increase. Assumes a significant growth of the % of timber buildings in each category compared to the present (2015),
• Scenario 3, theoretical increase. Assumes a theoretical maximum increase of the % of timber buildings in each category compared to the present (2015).
No comprehensive statistics is available on the use of materials in existing buildings. Therefore, assumptions about the present situation and future development were made. They are based on the authors' overview aquired during an interdisciplinary research project on increased use of timber in urban areas. The availability of suitable timber-based solutions for different building categories was considered, together with the probability of a shift to timber in the different subsectors and markets (see Figure 3).
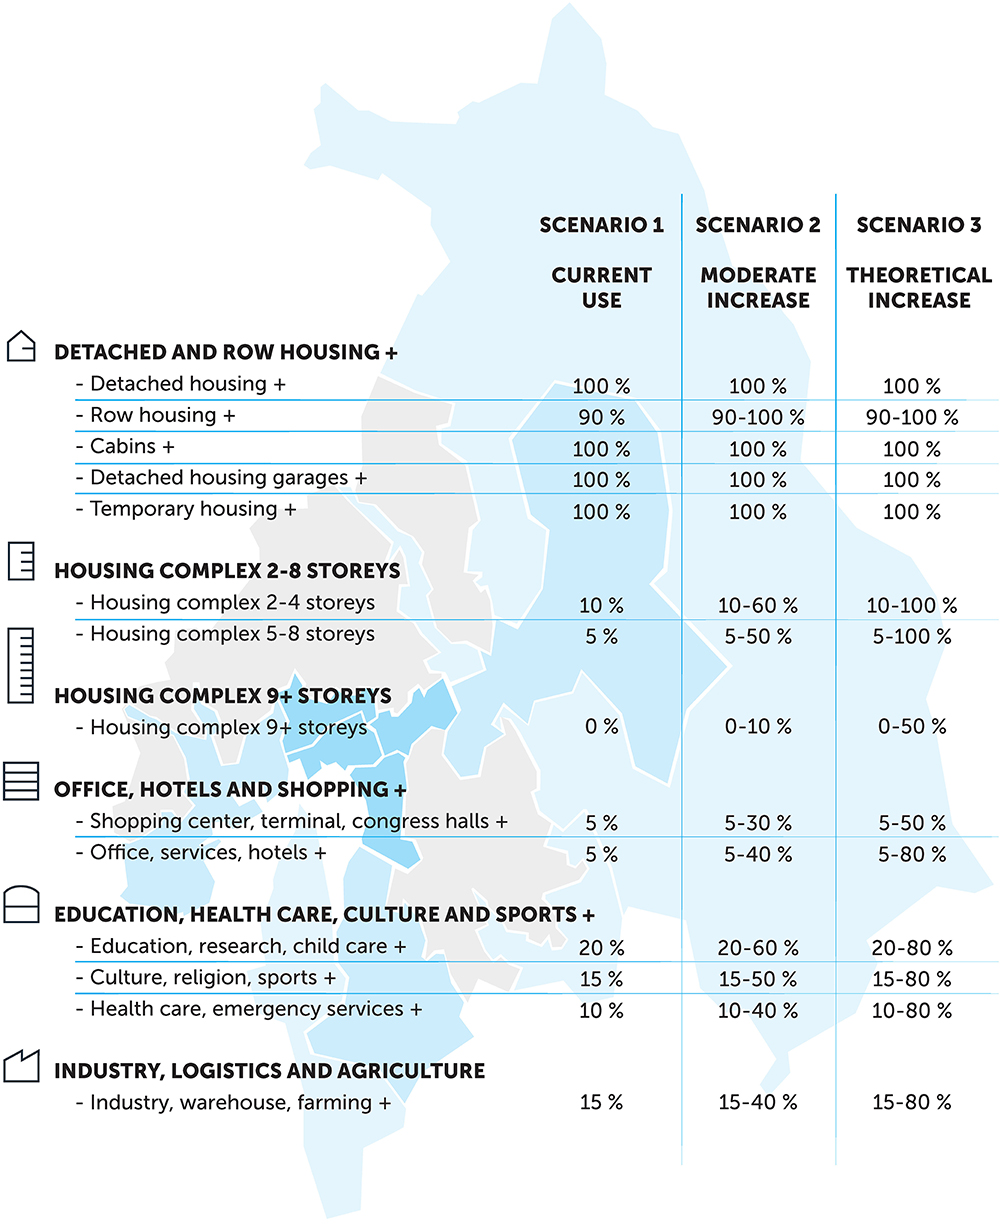
Figure 3. The estimated current (2015) and increased (2015–2030) percentages of timber buildings in the different building categories.
The percentage of new timber buildings in each category according to the three scenarios were multiplied against the projected new building floor area per. building category. This gave a potential new timber building floor area to be built between 2015 and 2030, distributed among building categories and sub-regions.
Results
The potential floor area built with timber as the main construction material in in Oslo and Akershus between 2015 and 2030 is (Figure 4):
• Scenario 1: 9,010,000 m2
• Scenario 2: 12,160,000 m2
• Scenario 3: 15,460,000 m2.
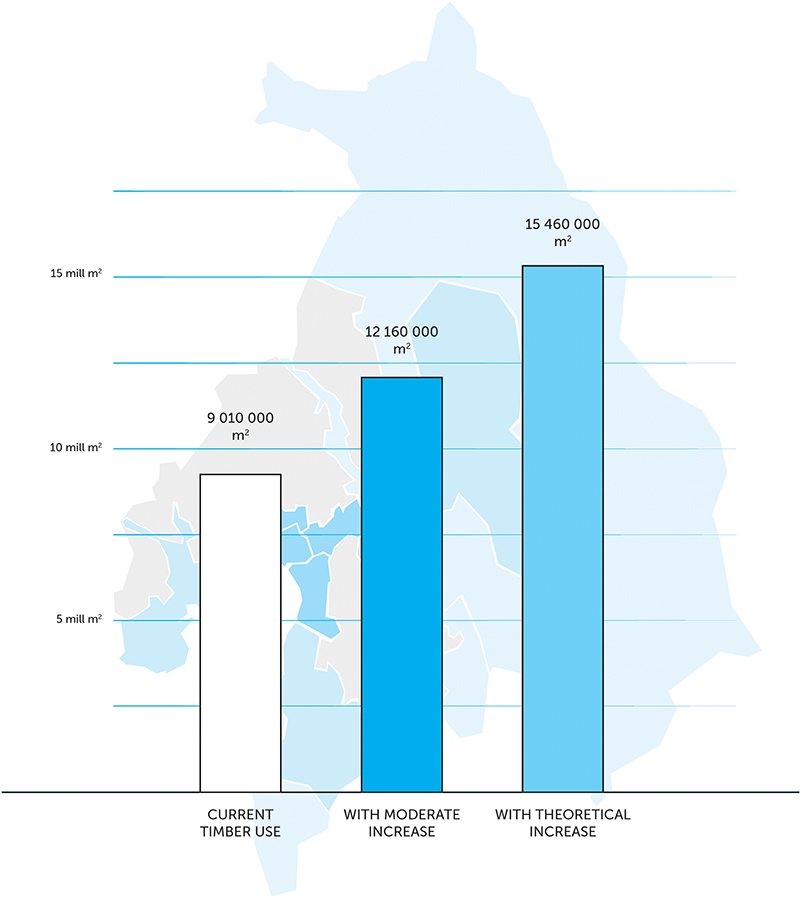
Figure 4. The projected total floor area of timber buildings in Oslo and Akershus according to the three scenarios.
In Figure 5, these total areas and timber potentials are distributed among building categories according to the building forecast.
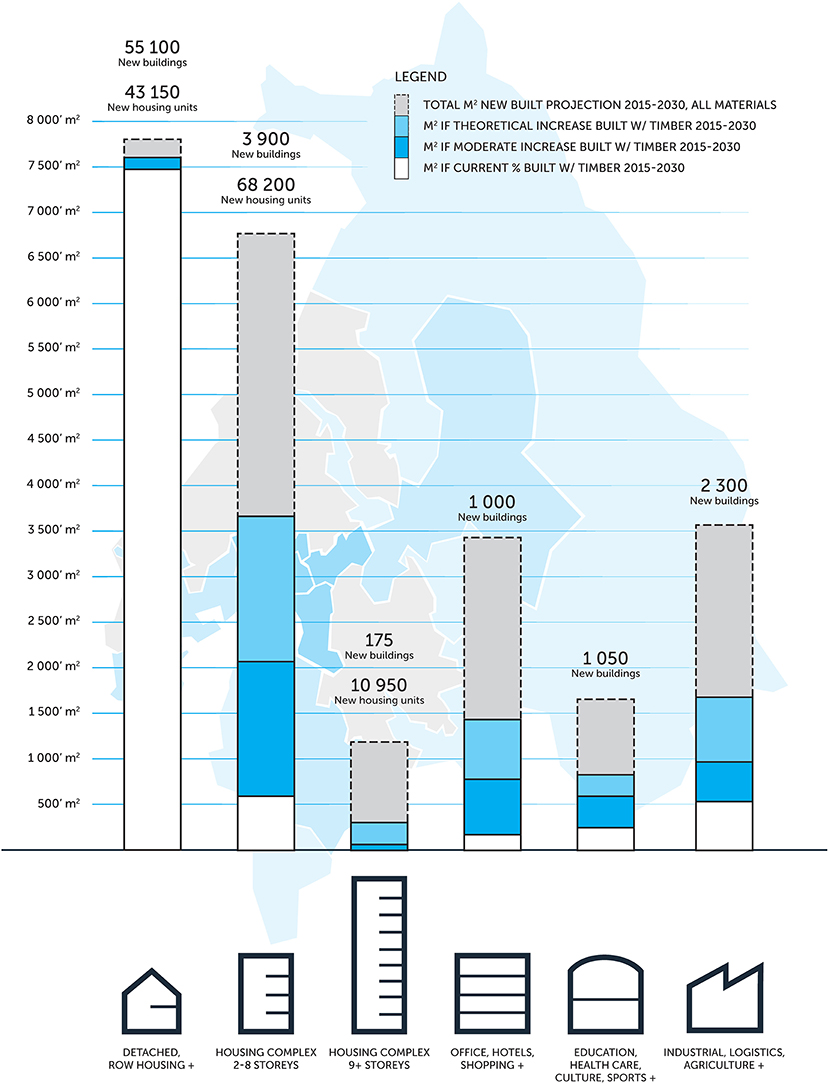
Figure 5. The total area of new buildings (m2 GIA), the number of new buildings and the number of new housing units in Oslo and Akershus between 2015 and 2030.
Figure 6 shows the buildings, floor areas and timber potentials distributed among the nine sub-regions in Oslo and Akershus Counties.
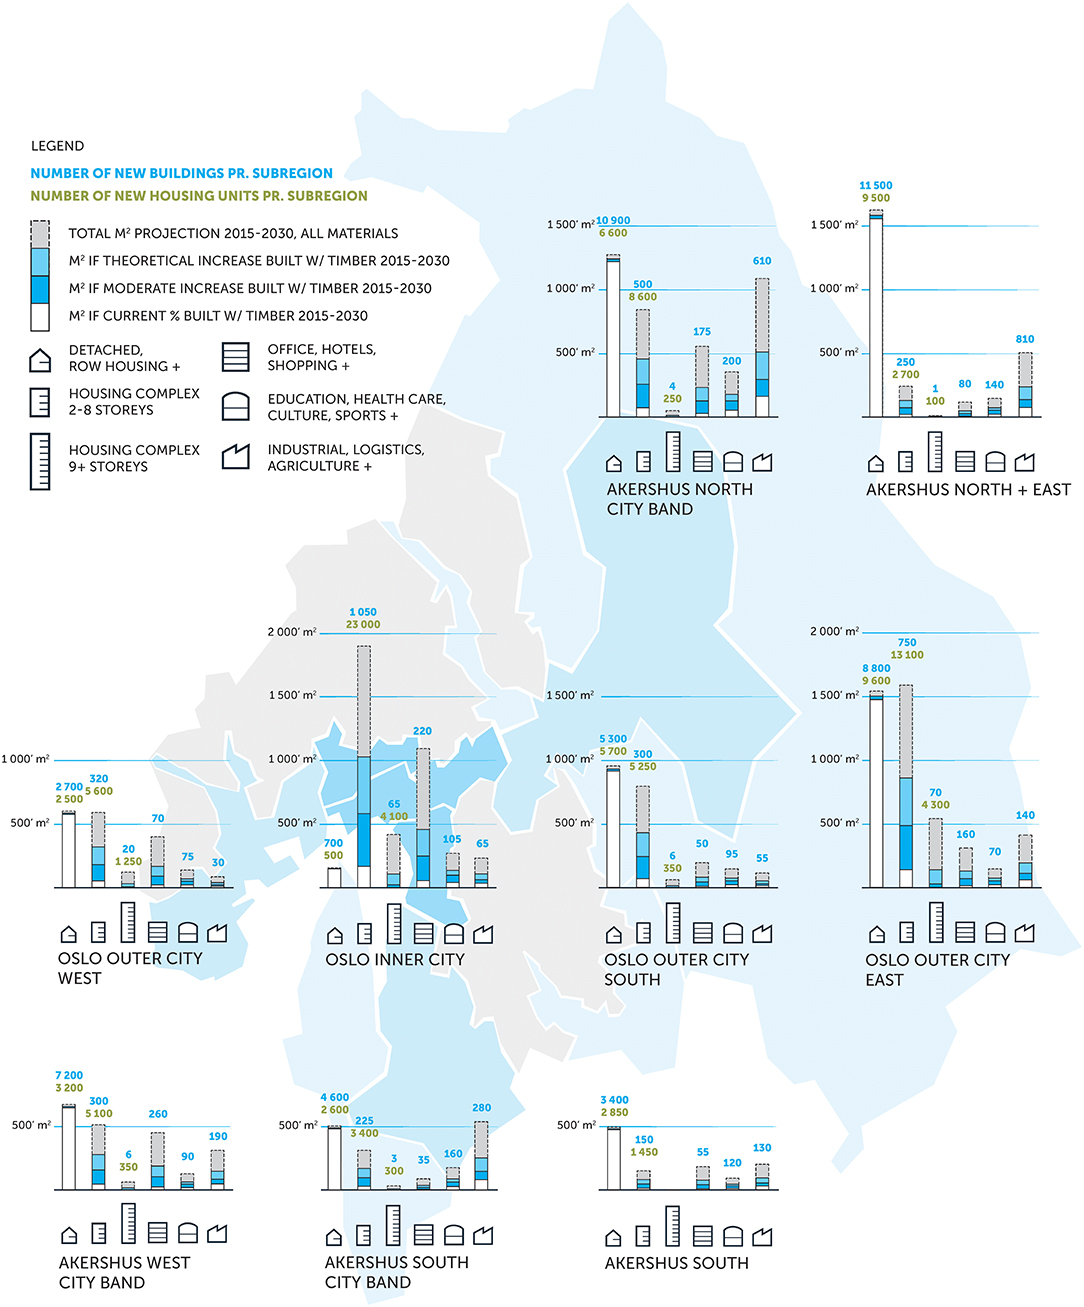
Figure 6. The distribution of new buildings, new housing units and floor area in the nine sub-regions.
Timber Volume
Method
Based on typical structural systems and figures from reference buildings (Cheret et al., 2014, p. 104), an average timber volume (m3) per m2 GFA was defined for each building category. This was multiplied against the floor areas of the three timber potential scenarios to find the total net volume of timber materials and components. To produce this, a much larger gross harvest from forests is needed, estimated to be in the order of 4,5 times the net volume (Økstad, 2011; Borge and Lier, 2013) This gross timber volume was then compared to the available, sustainably produced timber locally and in Norway.
Results
The potential net volume of timber utilized in new developments in Oslo and Akershus between 2015 and 2030 is (Figure 7):
• Scenario 1: 2,210,000 m3 (150,000 m3/year)
• Scenario 2: 3,140,000 m3 (210,000 m3/year)
• Scenario 3: 4,080,000 m3 (270,000 m3/year).
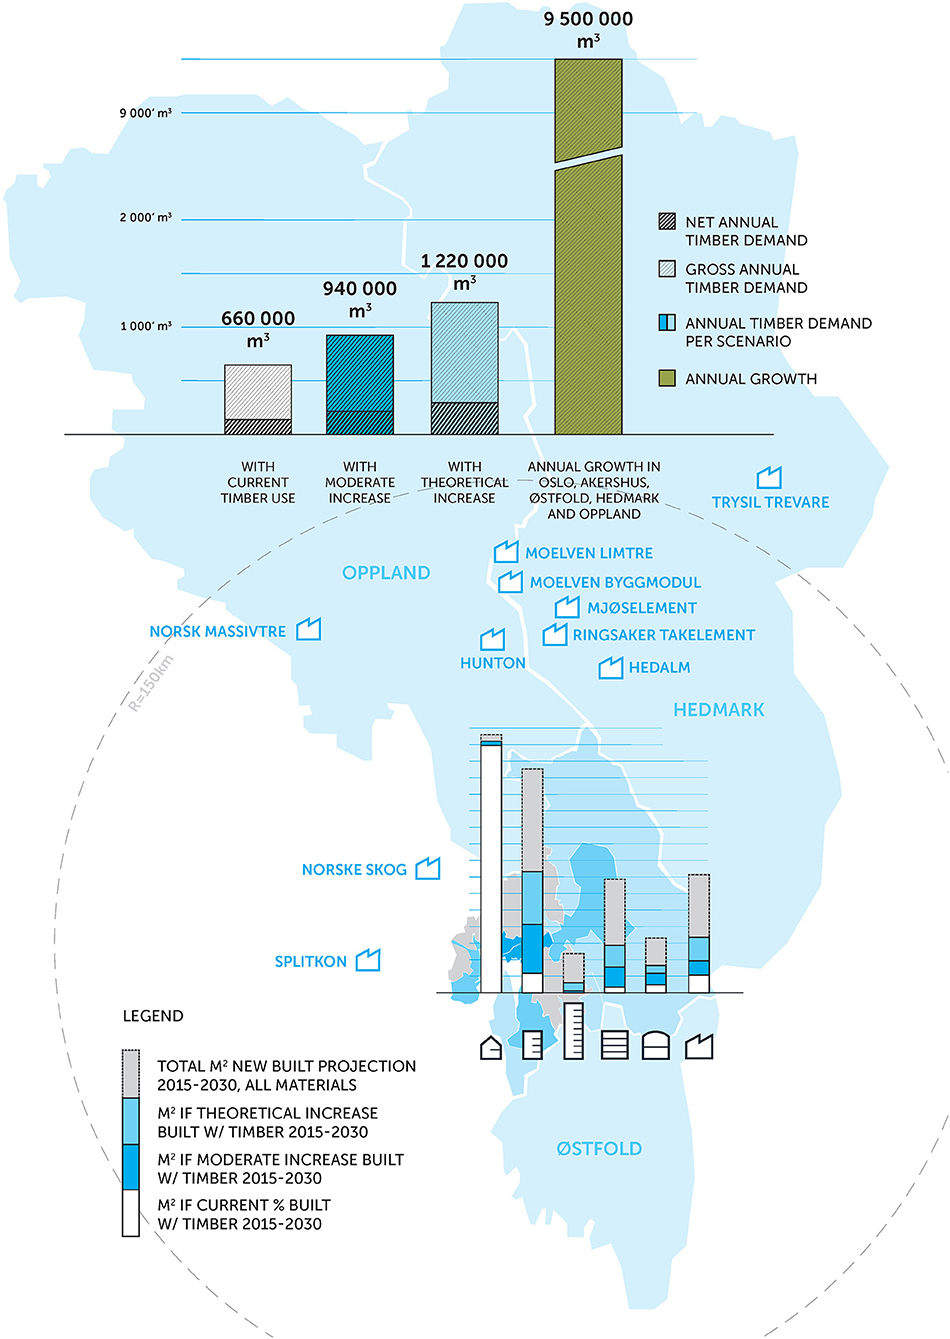
Figure 7. The annual net and gross timber demand in the three timber usage scenarios, compared to the annual growth in forest en Eastern Norway. Big timber industries are shown together with the estimated potential/demand for new timber buildings in Oslo and Akershus in 2015–2030.
The estimated gross timber harvest related to new timber buildings in Oslo and Akershus between 2015 and 2030 is (Figure 7):
• Scenario 1: 9,950,000 m3 (660,000 m3/year)
• Scenario 2: 14,130,000 m3 (940,000 m3/year)
• Scenario 3: 18,360,000 m3 (1,220,000 m3/year).
Even the theoretical maximum annual demand of 1.22 million m3 is well within the combined annual growth (2015) of 9.5 million m3 in Oslo, Akershus and the adjacent counties of Østfold, Hedmark, and Oppland. The sustainable annual harvest from Norwegian forests is estimated to be ca. 15 million m3 in the next decades, which is 2 million m2 more than the present production. Spruce and pine, the main species used in construction, are dominant both in growth and harvest (Tomter and Sandved, 2014; LMD and Ministry of Agriculture Food, 2016).
The present study has clarified the proximity of the potential market for timber buildings in Oslo and Akershus counties and the large and productive forests in Eastern Norway. The country's largest timber industries are centrally located to the forests, and within a distance of 150 km from Oslo. This creates a unique opportunity for industrial and societal development (Figure 7).
GHG Emission Reduction Due to Material Substitution
Method
Dodoo et al. (2016) describe the complexity and methodological issues related to Life Cycle Analyses (LCA) of wood vs. non-wood buildings. International standards, like EN 15978 for assessment of environmental performance of buildings, together with continuously updated databases for environmental product information, e.g., Ecoinvent, are gradually making analyses more comparable. On the other hand published research (Hofmeister et al., 2015) emphasizes differing results both for the life cycle emissions of buildings and the effect of wood as a substitution for concrete and steel construction. Disagreement seems primarily to relate to the use of wooden residues for biofuels to substitute fossil fuels and emission reduction achieved through carbon storage in timber structures. These factors are therefore estimated and reported separately in this study.
The selected examples show that the choice of materials has limited effect on the emissions during the building process. The construction phases, A4–A5 according to EN 15978, are therefore not included in this study. Hofmeister et al. (2015, p. 21), found the data related to the end of life phases, C1–C4 to be less solid than for production of materials. They also concluded that “compared to the production stage emissions, the end-of-life emissions add <10% to the overall balance.” Since the present study aims to clarify the main effects of choice of materials, the end of life emissions are not included. Focus is put on the “Cradle to gate” phases, or A1–A3 according to EN 15978.
In seeking consensus for the purposes of this study, the authors have focused on Norwegian and Swedish publications. The studies contain (mainly attributional) LCA analyses related to specific built projects or detailed digital models of generic building types. The examples are located in similar climatic zones with similar building codes. They are primarily utilizing northern boreal forests and similar, or shared, production environments and electricity networks. The functional unit used in the existing studies is 1 m2 of GIA, also used in the building prognosis described previously. Accordingly, the emission reductions are measured in CO2eq/m2. A lifecycle of 60 years (Norwegian norm) is used throughout.
The ZEB center at NTNU developed a concept model of an office building as the basis for analysis of life-cycle impacts of different building subsystems and design solutions. Hofmeister et al. (2015) concluded that a change from concrete and steel to timber in main parts of the structure would reduce emissions from production of materials by 41%, or 1.3 kg CO2eq/m2/year. This included the “cradle to gate” phases, or A1–A3 according to EN 15978. In the analysis concrete was kept in a full parking basement in the timber alternative, as were shafts for elevator and staircase. Envelope and internal walls were not included in the calculations. These factors indicate that CO2 savings could be significantly higher than 1.3 kg CO2eq/m2/year.
Dodoo et al. (2014) at The Linnaeus University in Växjö, Sweden, analyzed lifecycle carbon implications of three theoretical, timber building systems applied to “rebuild” an existing, four-story housing block of flats in Växjö in Sweden. The three strategies were: (1) CLT system, (2) Beam-and column system, and (3) Modular system (prefabricated room modules). In this study the internal walls and building envelope were included in the calculations. Previously, the researchers had calculated the carbon implications of a concrete frame version of the same building. This enabled a comparison of concrete and timber alternatives. Dodoo and Gustavsson (2014) recalculated the Swedish examples for Norwegian conditions as a part of the Norwegian KlimaTre research project. In this report, a fourth structural alternative, light-frame timber system, was added. A conventional and a passive house alternative were analyzed for both Swedish and Norwegian cases. In the present study, the Norwegian passive house alternatives are used, as they are similar to the 2017 version of Norwegian building codes. The emission savings related to material production vary between 1.6 and 2.1 kg CO2eq/m2/year when compared to the concrete frame structures. Since a mix of timber building systems is expected in Oslo and Akershus counties, an average of 1.85 kg CO2eq/m2/year indicate the level of emission reductions found by Dodoo et al.
Solem (2014) carried out a detailed LCA analysis of emissions from production of materials for the new Åsveien School by Eggen Architects in Trondheim. The structure, internal walls and building envelope were included, and the emissions were 2.2 kg CO2eq/m2/year lower than in the reference concrete building using standard materials.
GHG reduction factor for material substitution
The examples above show GHG emission reductions due to material substitution ranging between 1.3 and 2.2 kg CO2eq/m2/year. None of the cases were optimized for a specific timber solution. This indicate that reductions around 2 kg CO2eq/m2/year is realistic if optimal wood-based strategies are applied. This figure was therefore used in the calculations in this study. The total emission reduction per m2 will be 2 kg CO2eq/m2/year ×60 years (standard life cycle) = 120 CO2eq/m2. For continuation of current timber use, no substitution effect is counted in.
The reference concrete and steel alternatives in the studies described above, probably are based on conventional concrete types. The concrete industries are developing lower-carbon processes and products. Comparison of a variety of timber and concrete solutions may include cases where the differences are smaller.
Results (Emission Reduction Due to Material Substitution)
The effects of choosing building materials with lower emissions during their production can be regarded as achieved at the completion of a building. This means that for the period 2015–2030, the reduction will be 120 CO2eq/m2 × the total area of new timber buildings in the three timber usage scenarios described previously. The alternative approach of calculating savings per year in a 60 year lifespan is theoretical and does not show the actual results of decisions within the period of study.
GHG emission reductions (2015–2030) related to substitution of concrete and steel with timber as the main construction material in new buildings in Oslo and Akershus between 2015 and 2030 is:
• Scenario 1: current use of timber: No change
• Scenario 2: a moderate increase in use of timber: 370,000 tons CO2eq
• Scenario 3: a theoretical increase in use of timber: 760,000 tons CO2eq.
GHG Emission Reduction Due to Energy Substitution
Method
In this study we have applied results from the comprehensive analyses by Dodoo and Gustavsson (2014); Dodoo et al. (2014) of four different timber solutions compared to a concrete alternative. They studied the GHG mitigation effect of utilizing residues from forest harvest and wood processing as biofuel that will substitute fossil fuels. This fuel substitution effect varies from 59 kg CO2eq/m2 in the light-frame timber alternative to 222 kg CO2eq/m2 if cross-laminated timber (CLT) is chosen. Here, the average value of 133 kg CO2eq/m2 for the four systems is applied.
For new buildings where concrete is substituted by timber, the potential for emission reductions from bioenergy substitution was calculated by multiplying 133 kg CO2eq/m2 (2.2 kg CO2eq/m2/year in life cycle) with the floor area.
When energy substitution is included, the continuation of current timber usage will also have an energy substitution effect, as residues will be produced which may be utilized as bioenergy. Since the present study have focus on the effect of changes in use of materials, this factor, is not included. As in the case of material substitution, the total GHG emission reduction due to fuel substitution is regarded as achieved at the time of building completion.
Results (Emission Reduction Due to Energy Substitution)
GHG emission reductions (2015–2030) related to substitution of fossil fuels with bioenergy from residues of forest harvest and wood processing due to increased timber use in new buildings in Oslo and Akershus between 2015 and 2030 is:
• Scenario 1: current use of timber: No change
• Scenario 2: a moderate increase in use of timber: 430,000 tons CO2eq
• Scenario 3: a theoretical increase in use of timber: 870,000 tons CO2eq.
GHG Emission Avoidance or Compensation Due to Carbon Storage
Method
Dodoo and Gustavsson (2014) found added carbon stored in wooden building materials, compared to a concrete alternative, to represent avoided or compensated emissions ranging from 41 kg CO2eq/m2 in a light-frame timber solution to 89 kg CO2eq/m2, in the cross laminated timber (CLT) system. In the present study, the average factor of the four timber systems, ca. 59 kg CO2eq/m2 is applied.
The added storage effect of timber compared to a concrete alternative was calculated by multiplying 59 kg CO2eq/m2 against the area of new timber buildings according to the scenarios described previously. Carbon stored through continuation of present timber use, is not counted in, as this study focuses on changes in use of materials.
In the same way as for material substitution, the carbon storage effect is regarded as achieved at the time of building completion.
Results (Emission Avoidance or Compensation Due to Carbon Storage)
The emissions avoidance or compensation due to carbon storage effects of increased timber use in new buildings in Oslo and Akershus between 2015 and 2030 is:
• Scenario 1: current use of timber: No change
• Scenario 2: a moderate increase in use of timber: 190,000 tons CO2eq
• Scenario 3: a theoretical increase in use of timber: 380,000 tons CO2eq.
Below, the carbon storage effects are included in emission reductions, as they contribute to the accumulated carbon balance achieved through the different strategies for choice of materials.
Combined GHG Emission Reductions
Emission Status in 2015 and Aims for 2030
In 2015 the annual GHG emissions in Oslo and Akershus were virtually the same as in 1991 (Statistics Norway, 2017a):
• Oslo, 2015: 1,232 million tons CO2eq, 1991: 1,166 million tons
• Akershus, 2015: 1,773 million tons CO2eq, 1991: 1,735 million tons
• Combined 2015: 3,005 tons CO2eq, 1991: 2,901 tons.
In Norway, the common year of reference for defining emission reduction aims is 1990, but emission data for counties were not available before 1991. The emissions in 1990 and 1991 are regarded as equal, and the 1991 figures are used as reference for counties.
Oslo and Akershus have formulated ambitious aims for reduction in annual emisions by 2030 compared to 1991. Oslo targets a reduction of 95% to 58,000 tons CO2eq, while Akershus aims for a 55% decrease to 780,000 tons CO2eq. In all a reduction to 838,000 tons CO2eq, which means a cut in annual emissions of 2,340,000 tons CO2eq by 2030. To estimate the accumulated GHG emissions and reductions in Oslo and Akershus between 2015 and 2030, a linear reduction from 2015 to targeted levels in 2030 was assumed. This aligns with the projections in the counties' climate plans (Oslo City Council, 2016; Akershus County Council, 2018). The average annual reduction then will be 144,000 tons CO2eq (Figure 8).
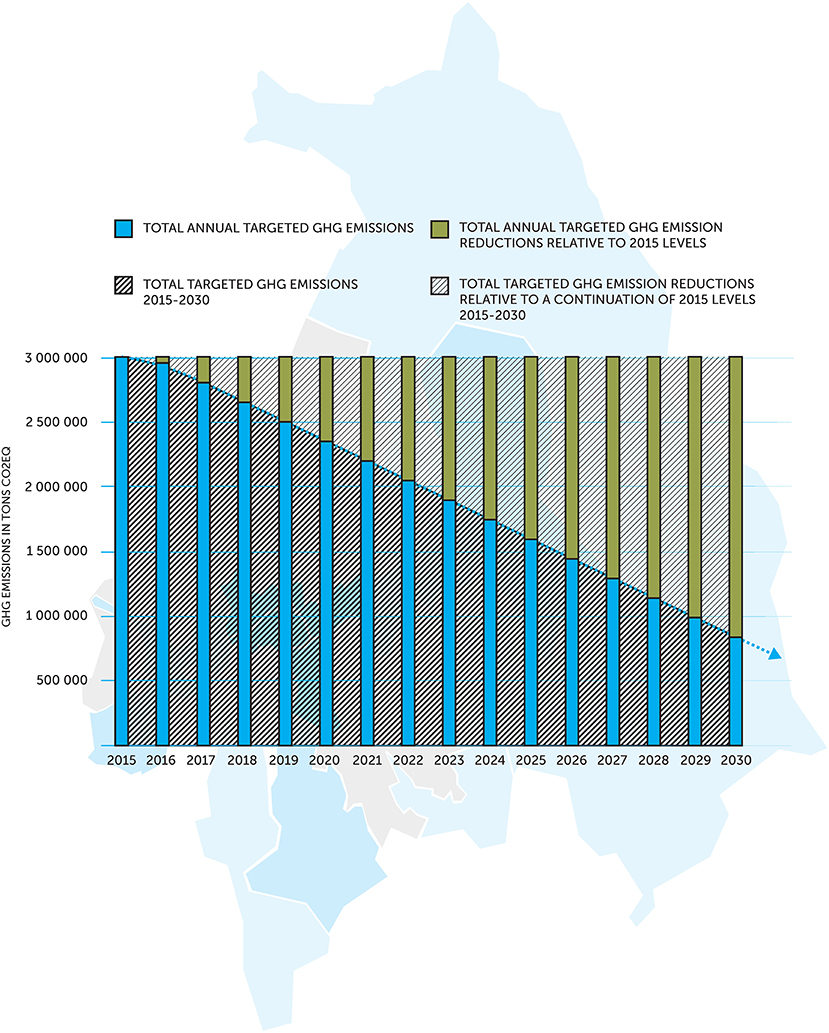
Figure 8. The GHG emissions aims for 2030 based on a linear reduction to the targeted levels for Oslo and Akershus.
The accumulated GHG emissions in Oslo and Akershus between 2015 and 2030 will be 31.5 million tons CO2eq. The necessary accumulated reduction compared to a continuation of current emission levels (2015) will be 16.6 million tons CO2eq.
Potential Emission Reduction by Increased Use of Timber
The potential combined GHG emission reduction was calculated by adding the effects of material substitution, energy substitution and carbon storage in the three timber use scenarios.
Compared to the accumulated GHG aims in the region, the GHG reductions related to increased timber use in new buildings in Oslo and Akershus between 2015 and 2030 are:
• Scenario 1, current use of timber: No change
• Scenario 2, a moderate increase in use of timber: 990,000 tons CO2eq reduction out of 16.6 million tons CO2eq, which is 6.0% of the accumulated reduction aims between 2015 and 2030
• Scenario 3, a theoretical increase in use of timber: 2.01 million tons CO2eq reduction out of 16.6 million tons CO2eq, which is 12.1% of the accumulated reduction aims between 2015 and 2030 (Figures 9, 10).
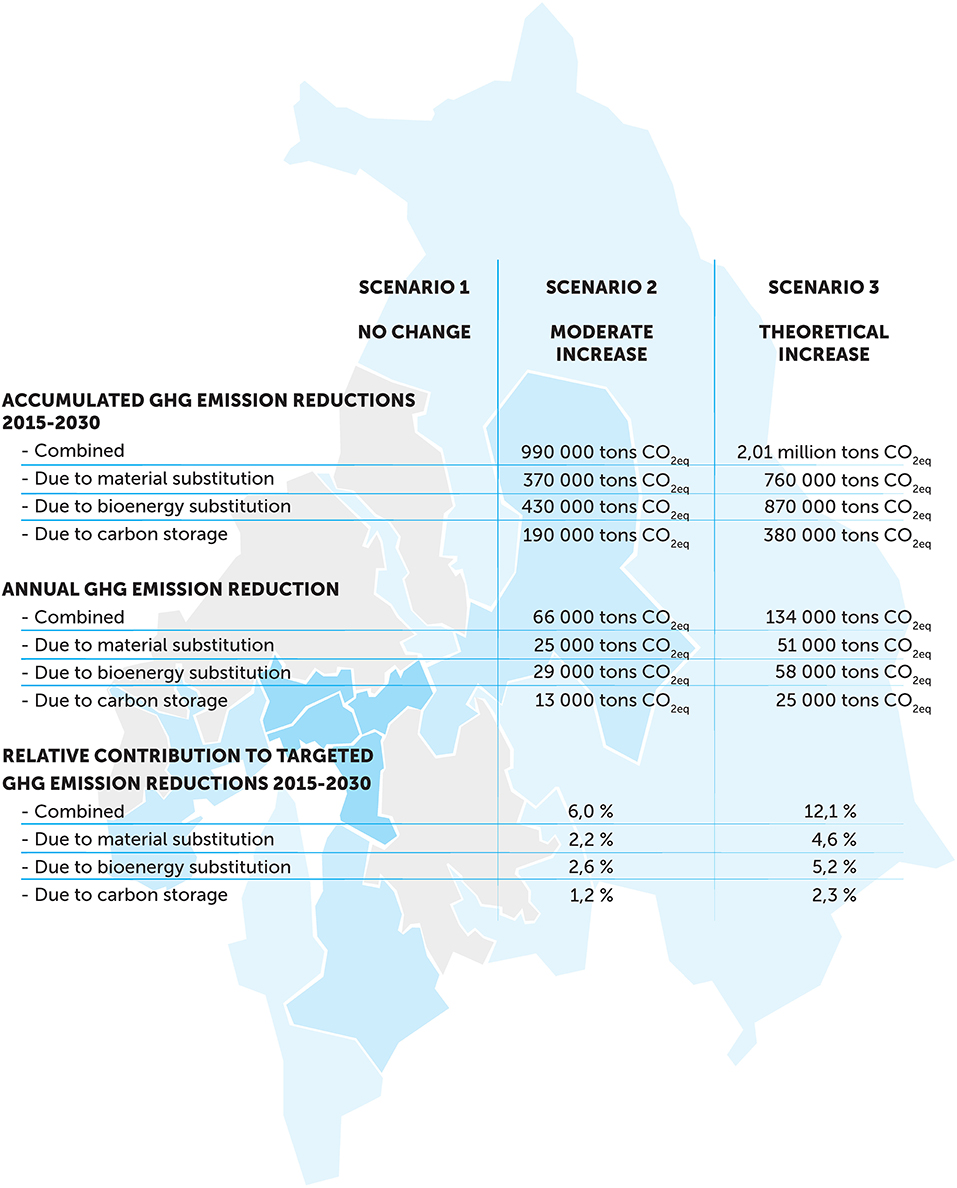
Figure 9. The potential emission reduction related to increased use of timber in Oslo and Akershus Counties 2015–2030. The significance of different factors.
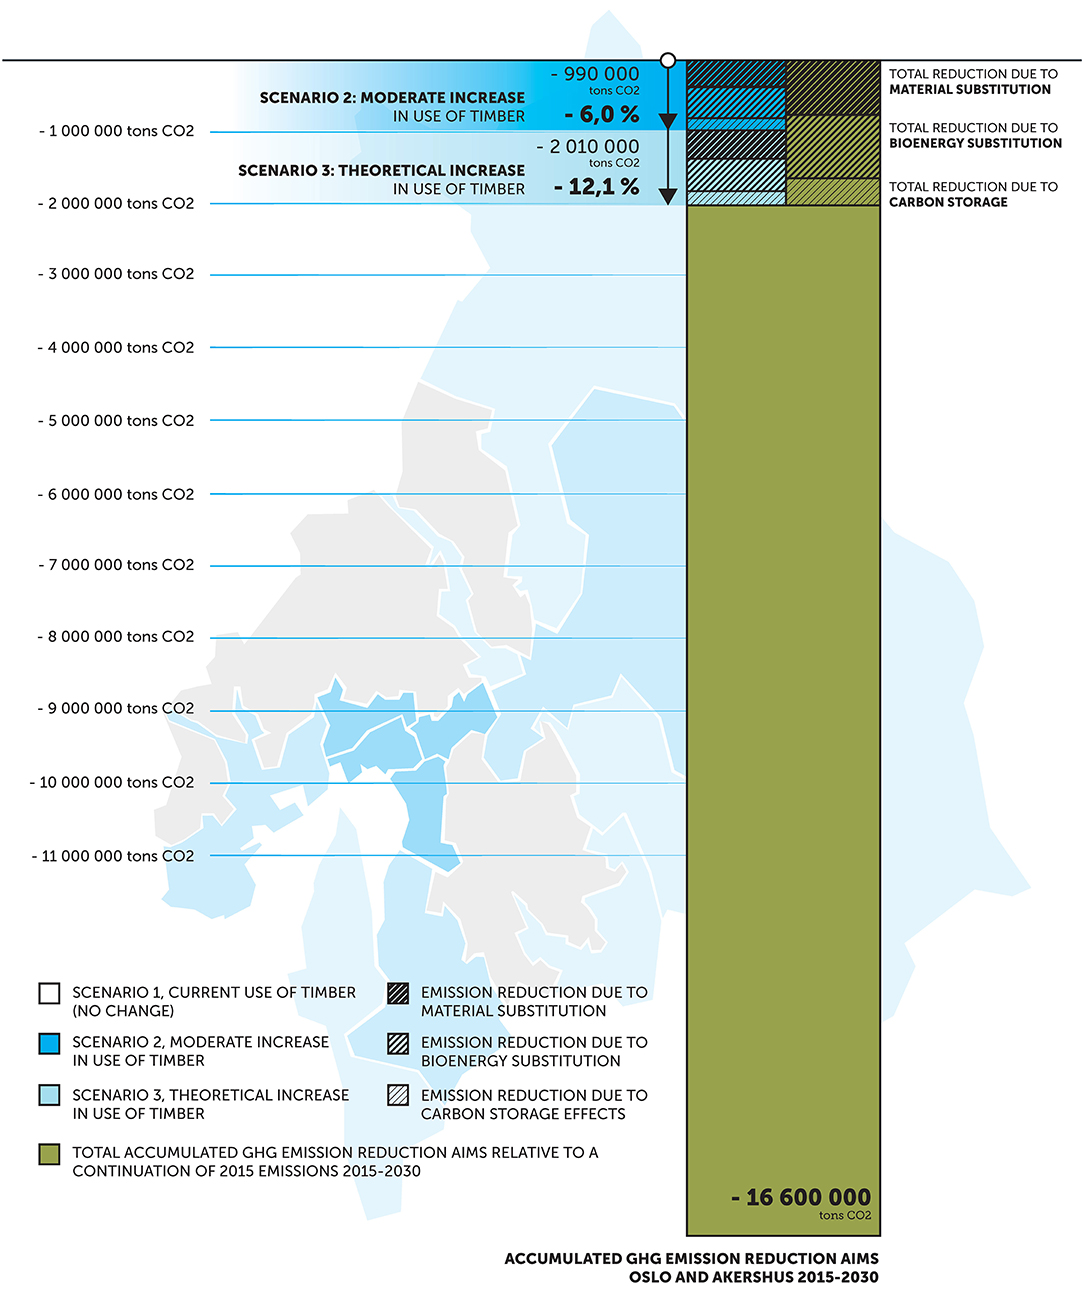
Figure 10. The GHG emissions reductions related to increased use of timber compared to the accumulated reduction aims for Oslo and Akershus between 2015 and 2030, with GHG emission reduction due to material substitution, carbon storage, and bioenergy substitution.
Discussion and Conclusion
Discussion
Global urbanization implies an enormous and continuous transformation and relocation of materials. A steadily growing number of cities and municipalities are developing political strategies for reduction of their GHG emissions. This study aims to shed light on the climate effect of the choice of building materials on an urban and regional scale. Transformation and upgrading of existing buildings are not studied. This is an obvious but deliberate limitation. Refurbishment examples are fewer and the data more scarse. The scope of the study demanded that focus was put on a small number of closely linked themes.
The development of a building forecast for Oslo and Akershus counties formed the basis for estimating the potential for increased use of timber in new buildings. The diagram (Figure 6) showing distribution of buildings between subregions and building categories proved to be a valuable result. It provides a visual tool for a multifaceted discussion of urban, architectural, industrial, and environmental strategies.
The building forecast clarified that 1–2 story buildings will constitute a large part of future buildings, even in Norway's most rapidly urbanizing region. This tends to be overlooked in the discussion of innovation and industrialization. The spread of the traditional, detached housing counteracts high-speed, low emission transport. Denser suburban patterns, decentralized water and sewer systems and optimized, electrified transport should therefore complement the dominant transport node focus.
The buildings in the “Detached and Row Housing+” category of buildings in scenario 1 represent no change in use of materials. Residues will however be produced and carbon stored, that will compensate for emissions from production of wooden materials used in the buildings. Preliminary estimates indicate that this may represent avoided emission of about 1.5 million tons CO2eq. Since this study focuses on the effects of changes in use of materials, this “base reduction” is not specified above.
Another finding is that 2–8 story buildings represent a much larger timber potential than taller structures. The media focus on height records in “plyscrapers” is deviating attention from the obvious advantages of timber in medium rise projects. Structures of up to 8 stories allow combinations of high density and high quality. Here, the fire and acoustics challenges are easier to solve. Rational and scalable solutions are evolving rapidly for this category of buildings.
The estimates show that even the theoretical maximum demand for timber in new buildings (2015–2030) in Oslo and Akershus can be harvested sustainably from forests near by.
The study indicates that scientific consensus on the emissions related to production of building materials (stages A1–A3) is within reach. IPCC (2014) seems to be on safe ground in stating that using timber instead of concrete, steel etc. will reduce GHG emissions in most cases. The condition is that the timber is harvested from sustainably managed forests, and that it is primarily used for long-lived products and buildings. However, improvements in concrete technology and systematic reuse of concrete and metal components may reduce the difference in emissions compared to timber solutions. The debate is heavily influenced by industrial interests, and the authors emphasize that material fundamentalism is unscientific. Timber solutions presently are the reference for GHG emission reductions, but combinations of materials are inevitable, and the best combinations are improving rapidly.
Substitution effects requires changes in complex processes and should be applied with caution. Choosing timber instead of concrete in a building will not result in an immediate drop in concrete production. It may instead lead to redirection of concrete products to other markets. Substitution implies that emission reduction is achieved at the place of production of materials, but is credited to the place of construction of a building. Emission reduction by using timber residues as biofuel to substitute fossil fuel is debated. It assumes that any alternative use, e.g., in wood fiber-based products would give more emissions. It is also dependent on the emission factors of the electricity grid and other energy sources. The effects both of fuel substitution and of storing carbon in buildings depend on the carbon balance between forests, soil and atmosphere. In this study, the different emission effects of increased use of timber are therefore estimated separately to enable a systematic discussion of data and of future strategies.
The accumulated emission reductions 2015–2030 by a moderate increase in timber use is estimated to constitute 6.0% of the reduction needed to reach the targeted levels for Oslo and Akershus (assuming a linear decrease). The material production part will be around one third or 2.2% of this (Figure 10). If the county-level emission reductions are not linear, but starts slowly and then accelerate closer to 2030, the accumulated reductions will be smaller and the relative importance of building materials will be bigger. The estimated reductions are substantial. They are however credited at the time of building completion, which is favorable.
The theoretical maximum timber use is estimated to represent an accumulated emission reduction of around 12% between 2015 and 2030. This level of urban timber breakthrough appears unlikely, but indicates a potential beyond present trends and technologies.
For GHG emissions, transport is much more important than building materials. The location of buildings may play a bigger role than how they are built. Transport accounted for around 60% of Oslo's emissions in 2013 and 80% of Akershus' emissions in 2015 (Oslo City Council, 2016; Akershus County Council, 2018). Both counties are optimistic about a rapid conversion to zero emission vehicles and biofuel. Oslo is dependent on a combination of reductions in transport and other sectors to reach its 2030 targets. Akershus may fulfill its 2030 aims by measures related to transport alone, but toward 2050 other sectors must contribute. Like for buildings, the methods for calculating emissions from transport are under development. Relying on measures in a single sector will be vulnerable to future changes in knowledge and perspectives.
To be manageable within the time and resource limits of a project subtask, this study aimed to clarify main factors and their impact on the total emissions of cities and city regions. This overview is vital to policy-making and to the development of integrated models of emissions related to urbanism and architecture.
Conclusion
In the extended perspective of this study, the climate effects of increased use of timber as a building material are found to be significant, but small compared to other measures, especially related to transport. To be robust, the argument for timber should not be founded on emission effects alone. As a renewable resource, timber will have sustained availability as a low-carbon or carbon negative building material. It will support future development of knowledge and innovation in architectural design and manufacturing of buildings and components. This will be relevant in large regions along the northern boreal forest belt. The adjacency of a big demand for new timber buildings in Oslo and Akershus and the large forests and timber industries in Hedmark, Oppland (and also Buskerud) counties represents an historic opportunity. It may strengthen a green shift in construction, which is the biggest land-based industry in Norway. The associated timber industries will benefit from new markets and technology. They may also form the basis for a regional development that is more diversified, and in the end more sustainable. Some of Oslo's problems, like escalating housing prices, may be solved outside Oslo.
Data Availability Statement
The raw data supporting the conclusions of this manuscript will be made available by the authors, without undue reservation, to any qualified researcher.
Author Contributions
MN was project leader, defined the themes and aims of the study, had main role in writing of final version. IB gathered and processed most of the statistical data and presented the results in writing, tables and figures. CS coordinated writing and editing in the final phases. UG wrote first draft of article and key diagrams.
Funding
This work was supported by The Norwegian Research Council, Main funder; Skogtiltaksfondet v/Viken Skog and AT Skog, Industrial co-funder; Lunner Allmenning, Industrial funder, Industrial co-funder; and The Oslo School of Architecture and Design. Project owner and funding of open access publication.
Conflict of Interest
The authors declare that the research was conducted in the absence of any commercial or financial relationships that could be construed as a potential conflict of interest.
References
Akershus County (2015). Regional Plan for Areal og Transport i Oslo og Akershus. Available online at: http://www.akershus.no/ (accessed March 15, 2016).
Akershus County (2016). Akershusstatistikk. Nr.2-2016. Tall og Fakta om Akershus - del 2. Available online at: http://www.akershus.no/ (accessed February 15, 2016).
Akershus County Council (2018). Regional Plan for Klima og Energi i Akershus. Utkast - Høringsdokument 6. Available online at: http://www.akershus.no/ (accessed February 8, 2018).
Bernhard, P., and Jørgensen, P. F. (2007). Byggesektorens Klimagassutslipp. Byggemiljø, Byggenæringens Miljøsekretariat. Available online at: http://www.byggemiljo.no/wp-content/uploads/2015/01/Notat-klimagassutslipp-fra-byggsektoren21des06rev190407.pdf (accessed July 10, 2007).
Borge, L. E., and Lier, B. (2013). Bygg i tre! (Presentation). Available online at: http://docplayer.me/353323-Bygg-i-tre-lars-erik-borge-itre-as-bjorn-lier-trebruk-as.html (accessed June 10, 2016).
Cheret, P., Schwaner, K., and Seidel, A. (2014). Urbaner Holzbau. Handbuch und Planungshilfe. Berlin: DOM Publishers.
Dodoo, A., and Gustavsson, L. (2014). Lifecycle primary energy and greenhouse gas implication of multistory buildings with different construction systems for norwegian conditions. Energy Build.
Dodoo, A., Gustavsson, L., and Sathre, R. (2014). Lifecycle carbon implications of conventional and low-energy multi-storey timber building systems. Energy Build. 82, 194–210. doi: 10.1016/j.enbuild.2014.06.034
Dodoo, A., Gustavsson, L., and Sathre, R. (2016). Climate Impacts of Wood vs. Non-wood Buildings. Sveriges Kommuner och Landsting.
Dokka, T. H., Sartori, I., Tyholt, M., Lien, K., and Byskov Lindberg, K. (2013). A Norwegian Zero Emission Building Definition. Gothenburg: Passivhus Norden (accessed October 15–17, 2013).
EC (2017). Directive of the European Parliament and of the Council, Amending Directive 2010/31/EU on the Energy Performance of Buildings. Available online at: https://eur-lex.europa.eu/ (accessed September 8, 2017).
Flindall, O., and Nygaard, M. (2016). “Tracing a timber breakthrough. The introduction of CLT to the student housing market in Norway,” in Sustainable Housing 2016, eds A. Rogério and C. Pinheira (Barcelos: GreenLines Institute), 199–210.
Hofmeister, T. B., Kristjansdottir, T., Time, B., and Wiberg, A. H. (2015). Life Cycle GHG Emissions From a Wooden Load-Bearing Alternative for a ZEB Concept. ZEB project report 20 – 2015, SINTEF Academic Press, Trondheim.
Infoland Ambita (2016). Property information database. Adressedata pr. Bydel i Oslo, Bygnings- og Adressedata pr. Bydel i Oslo, Byggdata i Oslo, Byggdata i Oslo og Akershus. Available online at: https://infoland.ambita.com/ (accessed March 7, 2016).
IPCC (2014). “Climate change 2014: mitigation of climate change,” in Contribution of Working Group III to the Fifth Assessment Report of the Intergovernmental Panel on Climate Change, eds O. Edenhofer, R. Pichs-Madruga, Y. Sokona, E. Farahani, S. Kadner, K. Seyboth, et al. (Cambridge; New York, NY: Cambridge University Press).
Kaufmann, H., Krötch, S., and Winter, S. (2017). Atlas Mehrgeschossiger Holzbau. Munich: Detail Business Information.
Leknes, S. (2016). Regionale Befolkningsframskrivninger 2016-2040: Flytteforutsetninger og Resultater. SSB, Statistics Norway. Available online at: http://www.ssb.no/ (accessed July 25, 2017).
LMD Ministry of Agriculture Food (2016). Meld.St. 6 (2016-2017). Verdier i Vekst. Konkurransedyktig Skog- og Trenæring. Available online at: http://www.regjeringen.no/ (accessed May 6, 2018).
Lützkendorf, T., Foliente, G., Balouktsi, M., and Wiberg, A. H. (2014). Net-zero Buildings: Incorporating Embodied Impacts. London: Building Research & Information; Routledge.
Mayo, J. (2015). Solid Wood: Case Studies in Mass Timber Architecture, Technology and Design. New York, NY: Routledge.
Ministry of Climate Environment (2017). Prop 77 L (2016-2017) Lov om Klimamål (Klimaloven). Available online at: https://www.regjeringen.no/ (accessed March 29, 2017).
Ministry of Foreign Affairs (2015). Minifakta om Norge 2015. Available online at: https://www.ssb.no/befolkning/artikler-og-publikasjoner/minifakta-om-norge (accessed May 27, 2017).
NAL/Ecobox (2009). Evalueringsrapport - Norwegian Wood 2009. NAL. Available online at: http://www.arkitektur.no./ (accessed September 1, 2012).
Norwegian Environment Agency (2014). Rapport M229-2014, Kunnskapsgrunnlag for Lavutslippsutvikling. Available online at: www.miljodirektoratet.no/ (accessed January 5, 2015).
Norwegian Environment Agency (2016). Rapport M-519 - 2016. Vern Eller bruk av Skog som Klimatiltak. Available online at: https://www.miljødirektoratet.no (accessed December 5, 2016).
Økstad, E. (2011). Anvendelse av Biomasse fra Skogen. Miljødirektoratet. (Presentation at seminar). Available online at: http://www.miljodirektoratet.no/old/klif/nyheter/dokumenter/skogseminar_110311_okstad.pdf (accessed November 14, 2016).
Oliver, C. D., Nassar, N. T., Lippke, B. R., and McCarter, J. B. (2014). Carbon, fossil fuel, and biodiversity mitigation with wood and forests. J. Sustain. Forest. 33, 248–275. doi: 10.1080/10549811.2013.839386
Oslo City Council (2016). Climate and Energy Strategy for Oslo (Proposition 195/16). Available online at: http://www.oslokommune.no/ (accessed November 21, 2016).
Solem, B. S. (2014). Åsveien Skole – Klimagassregnskap – Jakten på CO2-Utslipp (Hunting CO2 Using Environmental Budgets). Trondheim: Forum Holzbau Nordic. Available online at: http://forumholzbau-nordic.com/assets/bilder/Presentations/Solem_Åsveien_skole_klimagassregnskap.ppsx.pdf (accessed July 30, 2015).
Sorthe, L. E., Bjelland, H., and Forsén, N. E. (2015). Muligheter for Reduserte Branntekniske Ytelser ved Installasjon av Automatisk Slukkeanlegg. Multiconsult; Direktoratet for Byggkvalitet (DIBK). Available online at: www.dibk.no (accessed March 21, 2016).
Statistics Norway (2016). Bruksareal til Annet enn Bolig (m2), Etter Region, Bygningstype, tid og Statistikkvariabel. Boligbygg, Etter Region, Bygningstype, tid og Statistikkvariabel. Boliger, etter Region, Bygningstype, tid og Statistikkvariabel. Bebodde Boliger, Etter Region, Bygningstype, tid og Statistikkvariabel. Boliger, etter Region, tid, Statistikkvariabel og Antall Etasjer i Bygningen. Eksisterende Bygningsmasse, Alle Bygg, Etter Region, Bygningstype, tid og Statistikkvariabel. Eksisterende Bygningsmasse, Andre Bygg enn Boligbygg, Etter Region, Bygningstype, tid og Statistikkvariabel. Available online at: http://www.ssb.no/ (accessed February 29, 2016).
Statistics Norway (2017a). Table no. 10608, GHG Emissions. Available online at: https://www.ssb.no/statbank/table/10608 (accessed March, 2017).
Statistics Norway (2017b). Table no. 10213, 10826, 07549. Available online at: http://www.ssb.no/ (accessed February 26, 2016).
Tomter, S. M., and Sandved, L. S. (2014). Bærekraftig Skogbruk i Norge, Ås: Norwegian Forest and Landscape Institute (Ås:Norwegian Institute of Bioeconomy Research).
UNFCCC (2015). United Nations Framework Convention on Climate Change 2015. Paris Agreement. Available online at: https://unfccc.int/sites/default/files/english_paris_agreement.pdf (accessed March 30, 2016).
Keywords: urban timber buildings, timber building emissions, timber potential, sustainable timber buildings, timber architecture
Citation: Nygaard M, Bashevkin IES, Groba U and Sunter C (2019) Increased Use of Timber in New Buildings in Oslo and Akershus: Potentials and GHG Emission Effects. Front. Built Environ. 5:131. doi: 10.3389/fbuil.2019.00131
Received: 15 March 2019; Accepted: 24 October 2019;
Published: 22 November 2019.
Edited by:
Mark Hughes, Aalto University, FinlandReviewed by:
Dimitrios Kraniotis, Oslo Metropolitan University, NorwaySanja Stevanovic, Serbian Academy of Sciences and Arts, Serbia
Atsushi Takano, Kagoshima University, Japan
Copyright © 2019 Nygaard, Bashevkin, Groba and Sunter. This is an open-access article distributed under the terms of the Creative Commons Attribution License (CC BY). The use, distribution or reproduction in other forums is permitted, provided the original author(s) and the copyright owner(s) are credited and that the original publication in this journal is cited, in accordance with accepted academic practice. No use, distribution or reproduction is permitted which does not comply with these terms.
*Correspondence: Marius Nygaard, bWFyaXVzLm55Z2FhcmRAYWhvLm5v; cG9zdG1vdHRha0BhaG8ubm8=