 Ying Wang
 James Brownjohn
 Kaoshan Dai3*
- 1Department of Disaster Mitigation for Structures, Tongji University, Shanghai, China
- 2College of Engineering, Mathematics and Physical Sciences, University of Exeter, Exeter, United Kingdom
- 3Department of Civil Engineering, Institute for Disaster Management and Reconstruction, Sichuan University, Chengdu, China
Vibration serviceability of footbridges is important in terms of fitness for purpose. Human-induced dynamic loading is the primary excitation of footbridges and has been researched with traditional sensors, such as inertial sensors and force plates. Along with the development of computer hardware and algorithms, e.g., machine learning, especially deep learning, computer vision technology improves rapidly and has potential application to the problem. High precision pedestrian detection can be realized with various computer vision methods, corresponding to different situations or demands. In this paper, two widely recognized computer vision approaches are used for detecting body center of mass and ankle movement, to explore the potential of these methods on human-induced vibration research. Consumer-grade cameras are used without artificial markers, to take videos for further processing and wearable inertial sensors were used to validate and evaluate the computer vision measurements.
Introduction
Footbridges and floors can experience significant human-induced vibration due to design trends for structurally efficient long spans (Zivanovic et al., 2005). Although vibration levels would not cause safety concerns, the vibration serviceability is important in terms of fitness for purpose. Many footbridges still give rise to concerns about vibration serviceability, and the level of sophistication in studying the problem has increased, including vision-based tracking (Xu et al., 2018; Lydon et al., 2019).
Ground reaction forces (GRFs) are produced by humans moving across such structures, due to body center of mass (CoM) shifts during running, walking, jumping (etc.). There are many direct or indirect techniques that have been used to identify GRFs, the most common used methods being inertial measurement units (IMU), pressure insoles and force plates (Bocian et al., 2016; Chen et al., 2016; Ahmadi et al., 2018). These methods can be applied in the laboratory. However, it is more beneficial to be able to identify GRFs and their effects in situ for people using a full-scale operational structure. IMUs have been used successfully for this purpose (Brownjohn et al., 2016), despite being both intrusive and expensive. Nevertheless, there are practical and technical challenges needing to be addressed to enhance the process of characterizing the human load-structural response relationship outside the laboratory.
Computer vision (CV) is used in many fields, such as medical imaging and autonomous vehicles. However, it offers the ideal solution, since it requires neither instrumentation of the structure (e.g., with force plates) or pedestrians wearing devices (such as passive or active optical markers, IMUs or insoles). A method using CV would be neither invasive nor intrusive and potentially able to identify GRFs form multiple human subjects. It also offers the capability of tracking pedestrian location along with GRF. There is also the added attraction that CV is also used for structural vibration measurements (Xu et al., 2018; Hoskere et al., 2019).
Hence some CV-based methods have been used for pedestrian and human-structure interaction research. Such methods can track human movement in an original state. The template matching method is used to detect pedestrian movement in the mediolateral direction, and thus, identify lateral pedestrian-induced vibration of a footbridge (Yoshida et al., 2007). The background subtraction method is used for pedestrian tracking to record the trajectories and interactions of a pedestrian in public places, but the precision is not enough to differentiate the step stages. Furthermore, it cannot separate a crowd into individuals when there is an occlusion (Hislop-Lynch et al., 2017). Optical flow based algorithms have been used for capturing individuals and a crowds movement during jumping (Celik et al., 2018). The results have high precision but can only be used in the situation of vertical-only human movement.
Deep Learning CV Based Approaches
Along with the development of machine learning, especially deep learning, many new CV based object detection methods have been presented. What can be recognized by a deep learning approach is based on the data set used to train the deep learning model (the weights). A data set contains many photographs with objects or key points marked. A deep learning approach would abstract the corresponding features from the marked photos, and thus, update the weights corresponding to different kinds of features in a model. In reverse, with a well-trained model, a deep learning approach can combine features with their weights and give an estimation of the information in a photo.
To explore the practicality of CV in human induced vibrations, in the present work, two mainstream deep learning CV approaches are used, Mask R-CNN (Mask Region convolutional neural network) is used to detect pedestrian movement and OpenPose is used to detect foot position while walking. In spite of becoming available recently (both in 2017), Mask R-CNN and OpenPose have already been the most widely recognized approaches in instance segmentation (He et al., 2017) and human pose estimation (Cao et al., 2017), respectively. In this work, the Mask R-CNN and OpenPose approaches are used with pre-trained models provided by the corresponding research and both of the models were trained with Microsoft Common Objects in Context (MS COCO) data sets.
Mask R-CNN
Mask R-CNN, as the name implies, is a convolutional neural network approach, which was invented mainly for instance segmentation (Figure 1). Mask R-CNN can recognize people (and also other objects) and their locations in an image when well-trained, and can also be used to detect objects in an occlusion situation. When processing an image, Mask R-CNN provides a mask of a certain object as well as its bounding box, with different convolutional neural network branches. Therefore, the box is an estimation of the object location but not the enclosing rectangle of the mask. A corresponding confidence score is also given along with the bounding box to evaluate the accuracy of the estimation. More details of Mask R-CNN can be found from (He et al., 2017).
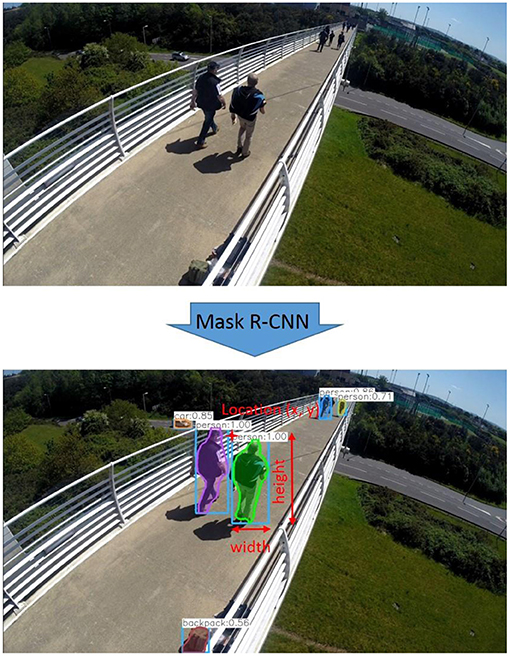
Figure 1. Instance segmentation with Mask R-CNN approach.
A pre-trained MS COCO weights model, Mask R-CNN can be used to detect common object classes, such as humans, bicycles, and cars. Typical detected bounding boxes are shown in Figure 1. Although the mask area is presented with relatively low accuracy compared to the bounding box, it has great potential to provide detail on pedestrian gait. The bounding box reflects the location of the pedestrian, thus it is used here to estimate movement of the pedestrian's body.
OpenPose
The OpenPose method is used for human pose estimation, which is estimating the body part or joint positions (key points) from an image. Similar to the Mask R-CNN approach, it has two different convolutional neural network branches. One of the network branches is used to detect human body key point locations and the other one is for their associations, therefore, it can be used for multi-person pose estimation (Figure 2). The key points which can be detected can vary according to the data set used. A pre-trained MS COCO weights model, which is used in the present work, provides 18 key points for human pose estimation (Table 1). In this work, the locations of ankle key points are used to determine the stages in footsteps. In addition to synchronizing the video measurements with wearable IMUs used for comparison in this study.
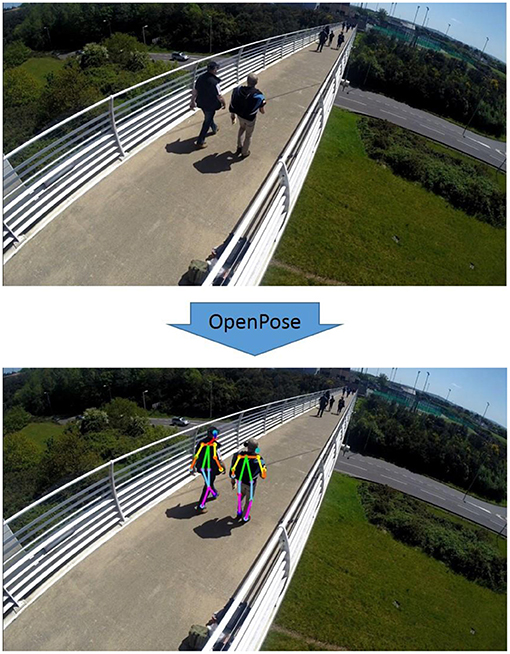
Figure 2. Key point detection and pose estimation with OpenPose approach.
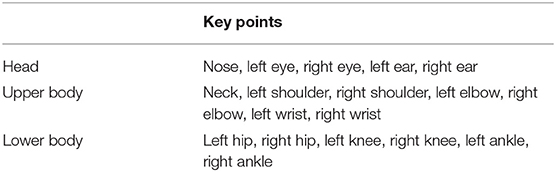
Table 1. Human body key points in MS COCO data set.
According to corresponding references (Cao et al., 2017; He et al., 2017), the mean average precision (AP) based on an MS COCO test data set of a Mask R-CNN approach for instance segmentation is 37.1 (for all objects) and the AP of an OpenPose approach for human pose estimation is 61.8 (for all key points). The AP used here is a standard suggested by MS COCO data set, which indicates the detection rate averaged over multiple Intersection over Union (IoU) values. Specifically, the MS COCO data set uses 10 IoU thresholds of 0.50:0.05:0.95.The accuracy depends on the situation, including illumination, occlusion, and angle of view (etc.). Generally, these approaches work better on large objects, since there are more precise features that can be used for detection.
Test Setup
The primary aim of this work is to use a CV based approaches to investigate human-structure interaction. To achieve this goal, a test was carried out on a lively footbridge, where pedestrian movement and the corresponding structural response could be obtained simultaneously. Wearable IMUs were also used in the test to validate the CV based approaches and to measure the structural vibration. CV has proven capabilities in measuring structural deformation (Xu et al., 2018) and to some extent, is easier to use in this application, as the structure is only oscillating about an equilibrium. Whereas, humans have a net translation unless moving on the spot (such as jumping).
The tested footbridge is an indoor footbridge located in “The Forum” student space at the University of Exeter, and a side view photo of the footbridge is shown in Figure 3. One of the footbridge ends is supported by two columns, while the other end is built into the supporting slab, which is also shown in Figure 3. A plan view, with sizes, of the footbridge is shown in Figure 4. A GoPro HERO 4 motion camera (“GoPro”) and a digital single lens reflex (DSLR) camera were set at the same end of the footbridge. The relative position between the cameras and the footbridge can be found in Figure 4. The wide-angle mode of the GoPro camera was used to capture a complete view of the bridge and the pedestrian test subject, while the DSLR camera was aimed lower than the GoPro camera for better detection of the feet. During the test, the pedestrian walked over the bridge as shown in Figure 4, requiring ~30 s for the return trip.
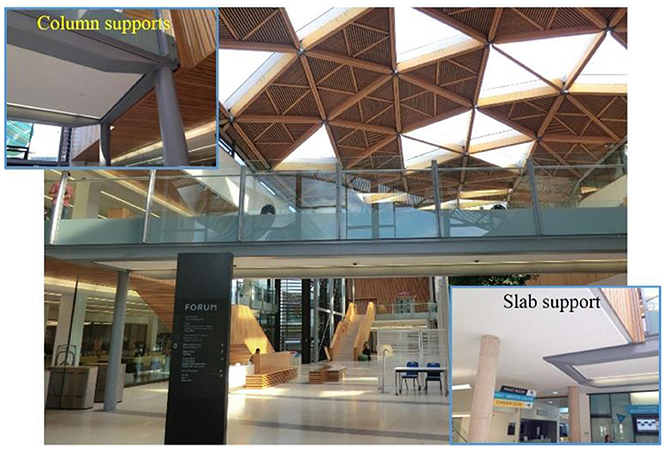
Figure 3. Side view of the tested footbridge and its supports.
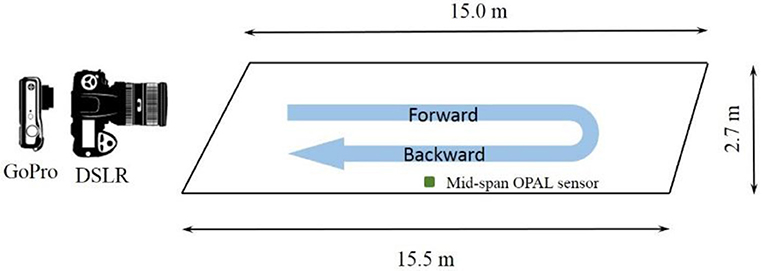
Figure 4. Plan view of the tested footbridge and cameras setup.
A corresponding coordinate system was defined prior to the test. The vertical plane (yellow plane in Figure 5) is parallel with the image plane, thus it is regarded as the x-y plane, and the direction that the pedestrian walked in is regarded as z axis (Figure 5).
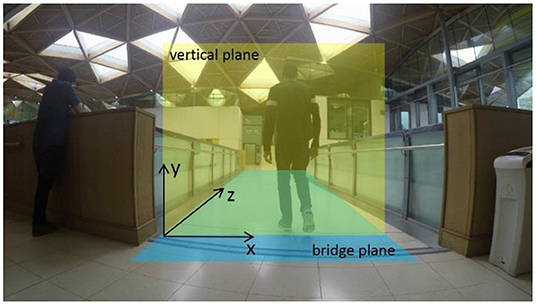
Figure 5. Definition of vertical and bridge plan and the corresponding coordinate system (Based on GoPro camera view).
OPALTM sensors developed by APDM are an example of wearable IMUs. They have been used in research on human gait, balance and postural sway (Horak et al., 2015; Bocian et al., 2016; Brownjohn et al., 2016). In the test, five OPALTM sensors were securely fixed on the pedestrian's lower back, left and right wrists and ankles with micropore tape (Figure 6). Additionally, one OPALTM sensor was fixed at the mid span of the footbridge. Measurements obtained from the sensor at the lower back were used to characterize pedestrian CoM movement, e.g., the center of a bounding box. It has been validated that the lower back point can be used to determine the total vertical walking force of pedestrian (Bocian et al., 2016). The sensors attached to the ankles were fixed at the same place corresponding to the MS COCO data set ankle key points.
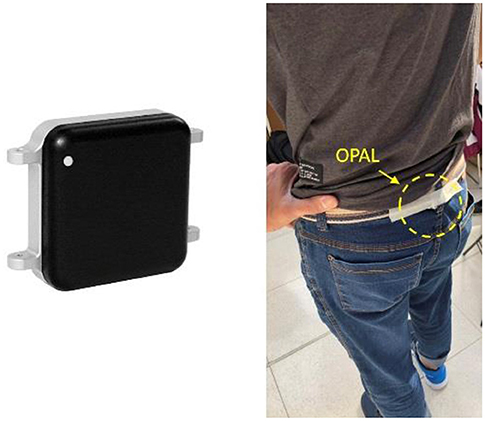
Figure 6. OPALTM sensor and fixation of OPALTM sensors.
Figure 7 shows the OPALTM sensor measurements in the coordinate system given in Figure 5 and the original measurements of OPALTM sensors are in (acceleration) units including the gravity component. Walking began from one end of the tested footbridge at around 2.5 s, reached the end at 14 s and reversed, reaching the start point at 27.5 s. Figure 8 shows the measurements in the period 5–10 s. Since CV measurements are in the displacement scale, the corresponding integrated measurements (low-frequency drift was eliminated by subtracting the polynomial-fitted curve, the same operation is used for the following integrated or original displacement data) are also shown in Figure 8. Figure 9 highlights the OPALTM sensor measurements in the frequency domain, and the spectrum of the footbridge vibration under ambient excitation are also provided in Figure 9. According to Figure 9, the tested person's main walking frequency is 1.8 Hz (corresponding to period for a single step), while the first peak occurs at 0.9 Hz (corresponding to period for a full walking cycle); the main frequency of the footbridge is 6.3 Hz, which is a harmonic of the walking frequency. As shown previously (Xu et al., 2018), such data can characterize human-structure interaction, including deliberate forcing by pedestrian movement.
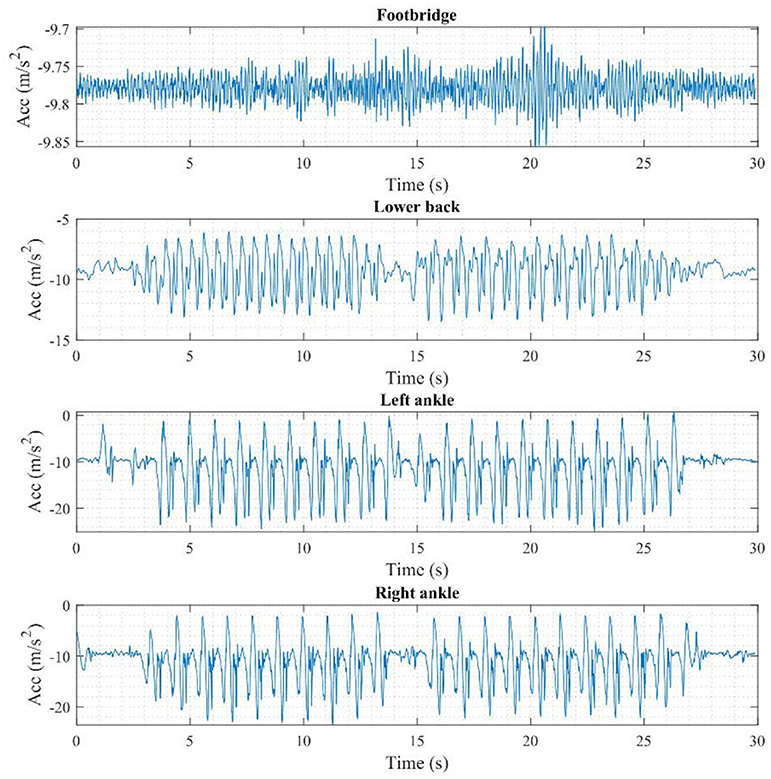
Figure 7. OPALTM sensor measurements (time domain).
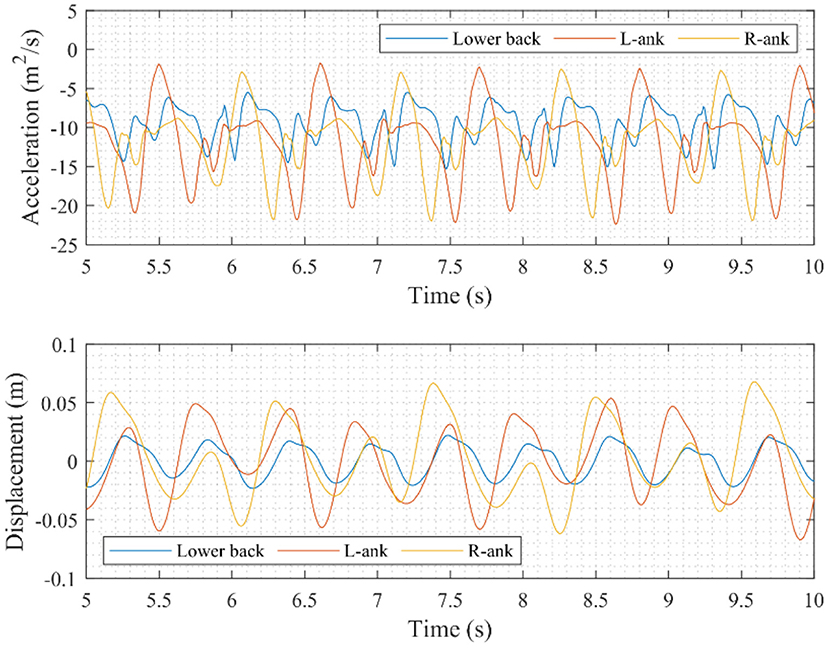
Figure 8. OPALTM sensor measurements (in 5–10 s).
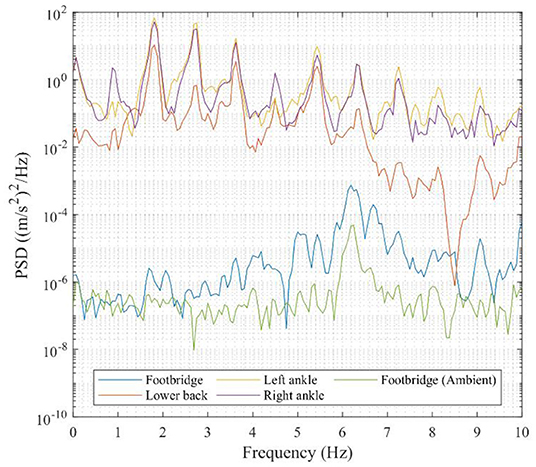
Figure 9. OPALTM sensor measurements (frequency domain).
Measurement Comparison
Raw Data Obtained With CV-Based Approaches
Using the Mask R-CNN approach, the time series of bounding box coordinates can be obtained, e.g., x location, y location, width and height, frame by frame. The raw data from GoPro and DSLR cameras are shown in Figures 10A,B, respectively. According to Figure 10, the pedestrian started walking at around 2.5 s. Before that, the pedestrian signaled to start by raising his left hand. After 27 s, some parts of the pedestrian are out of the video frame, thus the data becomes chaotic, except for the x coordinates. The x location is approximately a flat line which means the pedestrian was walking straight, forwards, and backwards. When the person is distant from the camera, the detected bounding box is small, and the resolution is relatively low. The width and the height of the bounding box should be inversely related to time, if the speed is a constant. However, the walking speed was slower at the beginning and when turning. The curves fluctuate along the steps, while the fluctuation of the height curve is relatively small. The data before 5 s and after 25 s in Figure 10B using the DSLR camera are chaotic, since some parts of the pedestrian are out of the frame, while the other data are similar with the data obtained with GoPro camera (Figure 10A).
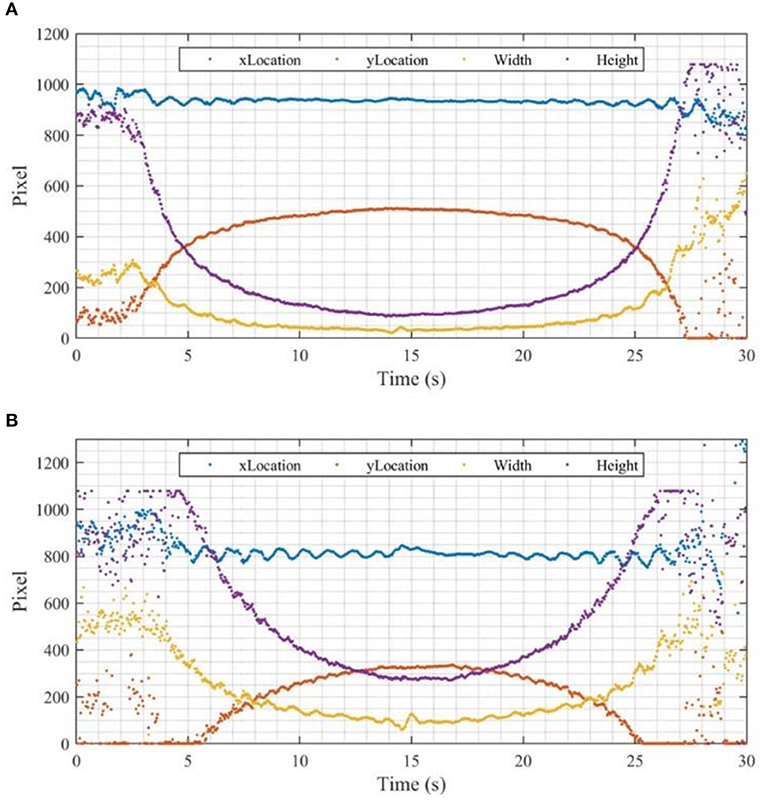
Figure 10. Original data obtained with Mask R-CNN: (A) GoPro, (B) DSLR.
Using an OpenPose approach, the location of the key points listed in Table 1 can be obtained. The locations of the concerned key points, including neck, left ankle, right ankle, left wrist, and right wrist in each frames of GoPro and DSLR videos are shown in Figures 11A,B, respectively. The y location of the bounding box obtained with the Mask R-CNN approach is also shown in Figures 11A,B as a reference. Due to the resolution of the OpenPose approach in key point detection, the movements of the key points are not continuous but discretised. In this case, the resolution of both GoPro and DSLR obtained videos are ~30 pixels/0.002~0.006 m.
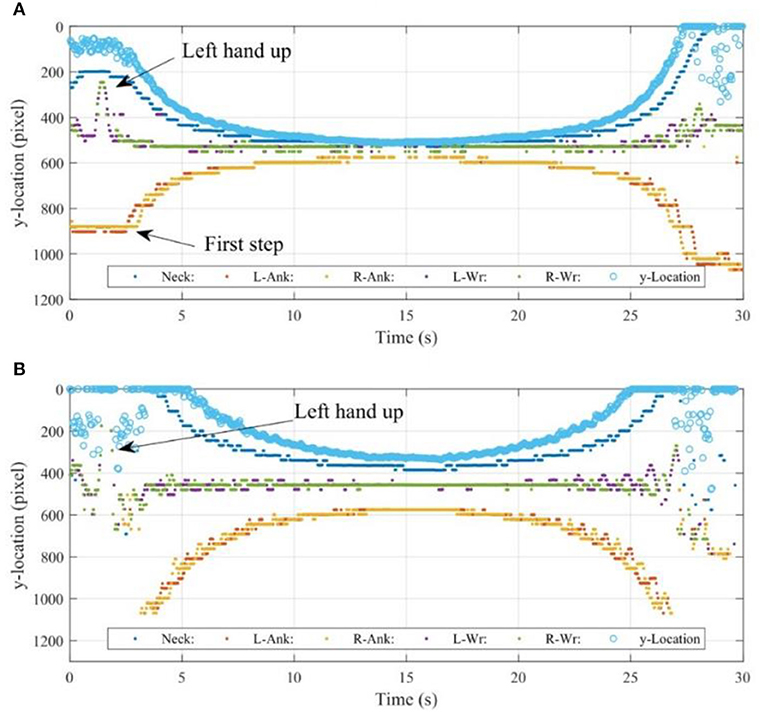
Figure 11. Original data obtained with OpenPose approach: (A) GoPro, (B) DSLR.
In Figure 11, it can be seen clearly that the pedestrian raised his left hand at around 1.5 s, and took the first step at around 2.5 s. In Figure 11B, the raised hand is also recognizable, but the first two and last two steps are missing, while the valid time series of ankle detection is longer than in Figure 11. No specific devices were used to synchronize the sensors: OPALTM sensors, GoPro, and DSLR cameras. In principle, using some key events, such as raised hands and steps, the measurements can be generally synchronized. In this case, the time point of first step is used to approximately synchronize the OPALTM measurement and the GoPro camera measurement, since the acceleration change is not identifiable in the OPALTM sensor measurement at the time the hand was raised. The event of raising the left hand is used to synchronize GoPro and DSLR camera measurements.
Data Processing
Mask R-CNN Measurement
As shown before, the center of the bounding box is regarded as an approximation of the pedestrian centroid. Thus, the pedestrian's center location, PX,c and PY,c in the image (in pixel) can be calculated as Equation (1):
The true 3D location of an object cannot be obtained directly with only one camera. In this case, the bridge plane (blue plane in Figure 5) and the pedestrian's vertical position (yellow plane in Figure 5) are in different planes and the real position of the person cannot be obtained directly, yet the position can be estimated using a reference. Assume the pedestrian's position is close to the mid-line of the frame, and his height is a constant, the real-world movements (in m) in both x (RX) and y (RY) directions can be calculated with Equation (2).
where 960 is half image width and 540 is half of the image height in pixels, the pedestrian's real-world height is 1.8 m. Additionally, the drift of measurements is subtracted to keep the data in an equilibrium position.
Comparison of movement detected with the GoPro video and movement obtained by integrating OPALTM sensor data can be found in Figure 12. These highlight that the movements in the y-direction obtained with GoPro video and OPALTM sensors are relatively close to each other since the detection in x-direction can be influenced by swaying arms and turning trunk. As previously mentioned in section deep learning CV based approaches, the detection precision can be influenced by the size of the objects. Thus, Figure 12 shows 2.5–12.5 s and 16.5–26.5 s as forward and backward sections, respectively (the bounding box is in a proper size and close to the image center during these time sections).
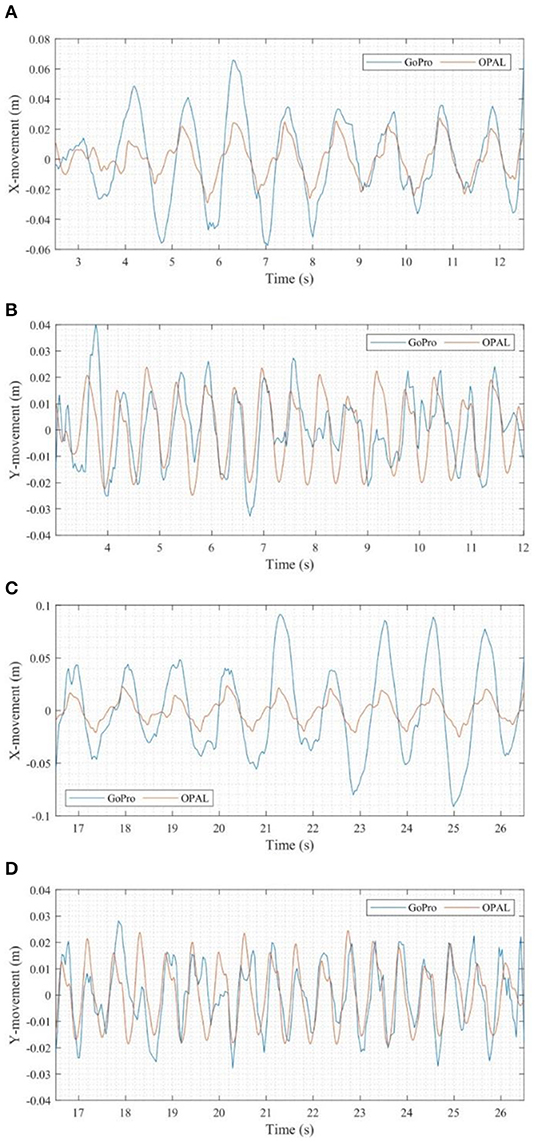
Figure 12. Time domain comparison of movements in: (A) x-direction (forward section), (B) y-direction (forward section), (C) x-direction (backward section), (D) y-direction (backward section).
Figure 13 shows the comparisons in the frequency domain. The period of the gait cycle identified from pedestrian body oscillation in the x-direction represents a full cycle including left and right feet movement which corresponds to 0.9 Hz, while the frequency in y-direction (vertical direction) is twice this value in x-direction (mediolateral direction), since it corresponds to a single movement of left or right foot. Linear plots are used here instead of semi-log plots, since the resolution of Mask R-CNN detection is relatively low. Only the main frequency of OPALTM sensor measurements can be seen in the plot. Although, the precision of Mask R-CNN detection is not as high as the OPALTM sensor measurements, it is sufficient to distinguish the step stages, and the Mask R-CNN detection can give an acceptable movement amplitude measurement in y-direction.
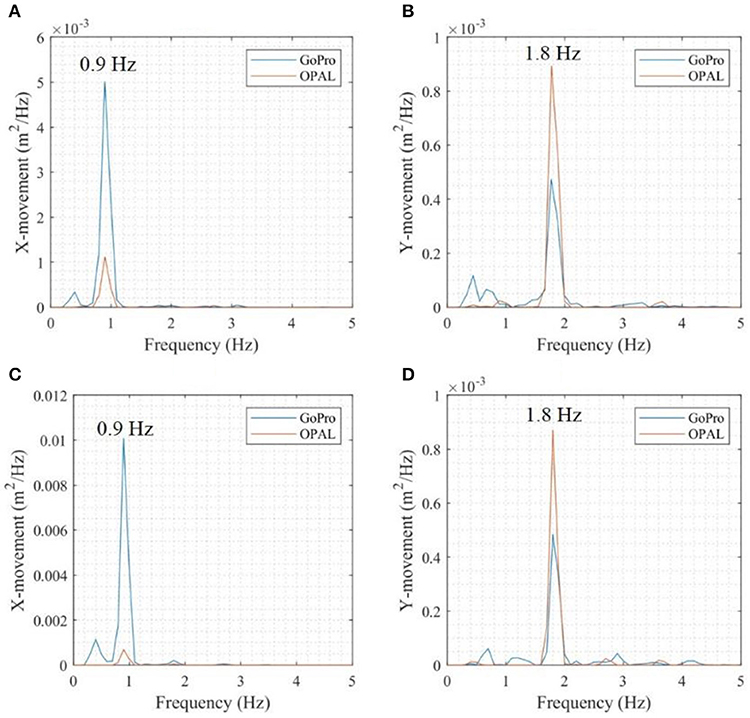
Figure 13. Frequency domain comparison of movements in: (A) x-direction (forward section), (B) y-direction (forward section), (C) x-direction (backward section), (D) y-direction (backward section).
OpenPose Measurement
Like Mask R-CNN, the OpenPose approach gives the locations of key points in a frame, with the real-world movement calculated using Equation (3).
where RL−ank and RR−ank are the real word movement of left ankle and right ankle (in meters), respectively. PL−ank and PR−ank are the locations in a frame (in pixels) and PNeck is the location corresponding to neck (in pixels). PHeight and 1.8 have the same meaning as in Equation (2).
The necessary conditions for key point detection with an equivalent accuracy are stricter than instance segmentation, since more detailed information is needed. In this case, the detection quality in time sections of 5–9 s (forward section). and 22–26 s (backward section) is acceptable. Similarly with the video processing with Mask R-CNN approach, the tested person was in a proper size in the video frames during these time sections. Comparisons of the ankle movement detected with the OpenPose approach and OPALTM sensors are shown in Figure 14, where acceleration data obtained with OPALTM sensors are integrated into displacement. The walking phases and movement amplitudes corresponding to different approaches match each other well. Note that there are peaks in the integrated acceleration even in “step down” phases that can also be observed in Figure 8. It can be also seen from Figure 14, that the detection quality of the left ankle is better than for the right ankle. Also, the backwards section (22–26 s, with the pedestrian facing the camera) is better than the forwards section (5–9 s), in this case. During the OpenPose approach, the movement of ankles corresponding to each step stages can be detected with an acceptable accuracy.
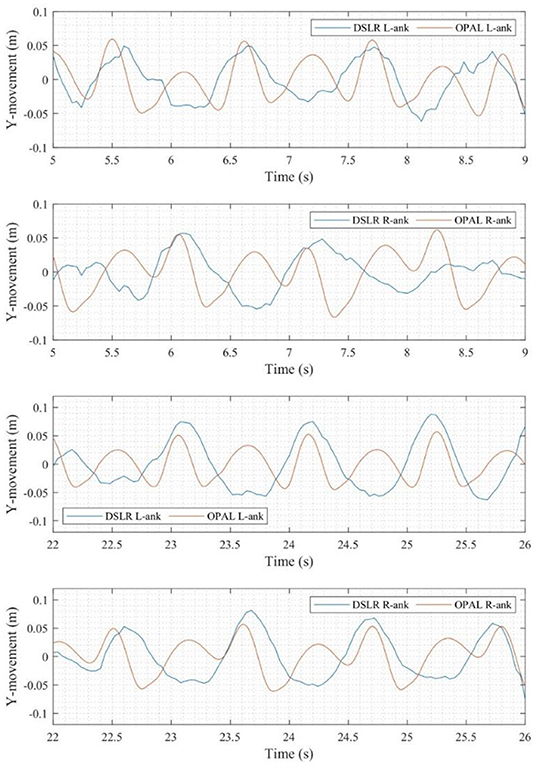
Figure 14. Time domain comparison of ankles movement.
Conclusions and Discussions
The CV based approaches can be used to detect the movement of people at both whole body and key point scale. The Mask R-CNN approach can be used for pedestrian location in an image or a video with a high resolution. It can also be used to find pedestrian movement in the vertical and mediolateral directions. The OpenPose approach can be used to detect several key points for pedestrians with precision and accuracy depending on the quality of the image or the video, and the relative position between pedestrian and camera.
Compared to the OPALTM wearable IMU measurements, the Mask R-CNN approach can identify walking period reliably, and amplitudes in the y-direction match well, whilst in the x-direction, the amplitudes have the same order of magnitude. Although, the error cannot be ignored, the CV based methods show great potential in detecting an individual's movement. With the OpenPose approach, the movements of an individual's ankles can be detected with reliable phase and amplitude. The camera measurement can be used or combined with some existing gait models to get the GRFs and the vibration of a structure (footbridge in this work) can be obtained with traditional sensors or corresponding CV approaches. In this way, the excitation and the response of a structure can be measured at the same time for refined dynamic analysis and the situation will be more close to a real-world one, since the movement of the tested people can be measured even when they are not aware of being tested.
The precision of the CV approach is not as high as traditional sensors (e.g., IMUs in this work), and the key points, which are used in the OpenPose approach, are not the exact anatomical locations. The CV technology, including instance segmentation and human pose estimation, is a hot research area in computer science (we chose relatively new and the most widely recognized approaches for the detection instead of the newest ones here in this work). Along with the developing of the CV algorithms and video taking and data processing hardware, the detection precision and efficiency will be improved.
Generally, video frames with good illumination and little object occlusion would be better for detection, but the impact is hard to quantify. When the object is too small in a frame, it can be hardly recognized by the algorithm. The re-identification also can be a problem that may restrict the application of the CV approaches. In this work, only one camera was used, thus the real 3D location or movement of people could not be obtained and the movement scale was obtained with the reference of the pedestrian's height. The procedure can be improved to capture 3D movement with a stereo camera system.
Data Availability Statement
The datasets generated for this study are available on request to the corresponding author.
Ethics Statement
The studies involving human participants were reviewed and approved by the ethics committee of the University of Exeter. The patients/participants provided their written informed consent to participate in this study.
Author Contributions
YW did the processing under the supervision of JB and KD. MP was in charge of the experimental work. All authors contributed to the writing.
Conflict of Interest
The authors declare that the research was conducted in the absence of any commercial or financial relationships that could be construed as a potential conflict of interest.
Acknowledgments
The authors would like to thank Marcio Goncalves, Qiankun Zhu, Xiaomin Huang, and Francesco Dell'Aira for helping with the test and the Open Source Computer Vision Library (https://opencv.org/) and the Big Vision LLC (LearnOpenCV.com) (https://www.learnopencv.com) for their software. The first author would like to thank China scholarship council for the sponsorship.
References
Ahmadi, E., Caprani, C., Živanović, S., Evans, N., and Heidarpour, A. (2018). A framework for quantification of human-structure interaction in vertical direction. J. Sound Vib. 432, 351–372. doi: 10.1016/j.jsv.2018.06.054
Bocian, M., Brownjohn, J. M. W., Racic, V., Hester, D., Quattrone, A., and Monnickendam, R. (2016). A framework for experimental determination of localised vertical pedestrian forces on full-scale structures using wireless attitude and heading reference systems. J. Sound Vib. 376, 217–243. doi: 10.1016/j.jsv.2016.05.010
Brownjohn, J. M. W., Bocian, M., Hester, D., Quattrone, A., Hudson, W., Moore, D., et al. (2016). Footbridge system identification using wireless inertial measurement units for force and response measurements. J. Sound Vib. 384, 339–355. doi: 10.1016/j.jsv.2016.08.008
Cao, Z., Simon, T., Wei, S. E., and Sheikh, Y. (2017). “Realtime multi-person 2D pose estimation using part affinity fields,” in Proceedings - 30th IEEE Conference on Computer Vision and Pattern Recognition, CVPR 2017 (Honolulu, HI). doi: 10.1109/CVPR.2017.143
Celik, O., Dong, C. Z., and Catbas, F. N. (2018). A computer vision approach for the load time history estimation of lively individuals and crowds. Comput. Struct. 200, 32–52. doi: 10.1016/j.compstruc.2018.02.001
Chen, J., Wang, L., Racic, V., and Lou, J. (2016). Acceleration response spectrum for prediction of structural vibration due to individual bouncing. Mech. Syst. Signal Process. 76–77, 394–408. doi: 10.1016/j.ymssp.2016.02.032
He, K., Gkioxari, G., Dollar, P., and Girshick, R. (2017). “Mask R-CNN,” in Proceedings of the IEEE International Conference on Computer Vision (Venice). doi: 10.1109/ICCV.2017.322
Hislop-Lynch, S. R., Ahn, S., and Kim, J. (2017). “Pedestrian tracking framework utilising computer vision for rapid analysis of public spaces,” in Australasian Transport Research Forum (ATRF) (Auckland).
Horak, F., King, L., and Mancini, M. (2015). Role of body-worn movement monitor technology for balance and gait rehabilitation. Phys. Ther. 95, 461–470. doi: 10.2522/ptj.20140253
Hoskere, V., Park, J.-W., Yoon, H., and Spencer, B. F. (2019). Vision-based modal survey of civil infrastructure using unmanned aerial vehicles. J. Struct. Eng. 145:04019062. doi: 10.1061/(ASCE)ST.1943-541X.0002321
Lydon, D., Lydon, M., Taylor, S., Del Rincon, J. M., Hester, D., and Brownjohn, J. (2019). Development and field testing of a vision-based displacement system using a low cost wireless action camera. Mech. Syst. Signal Process. 121, 343–358. doi: 10.1016/j.ymssp.2018.11.015
Xu, Y., Brownjohn, J., and Kong, D. (2018). A non-contact vision-based system for multipoint displacement monitoring in a cable-stayed footbridge. Struct. Control Health Monit. 25:e2155doi: 10.1002/stc.2155
Yoshida, J., Fujino, Y., and Sugiyama, T. (2007). Image processing for capturing motions of crowd and its application to pedestrian-induced lateral vibration of a footbridge. Shock Vib. 14, 251–260. doi: 10.1155/2007/763437
Keywords: human-induced vibration, footbridge, computer vision, instance segmentation, human pose estimation
Citation: Wang Y, Brownjohn J, Dai K and Patel M (2019) An Estimation of Pedestrian Action on Footbridges Using Computer Vision Approaches. Front. Built Environ. 5:133. doi: 10.3389/fbuil.2019.00133
Received: 11 August 2019; Accepted: 29 October 2019;
Published: 15 November 2019.
Edited by:
Benny Raphael, Indian Institute of Technology Madras, IndiaReviewed by:
Jian Li, University of Kansas, United StatesDavid Lattanzi, George Mason University, United States
Copyright © 2019 Wang, Brownjohn, Dai and Patel. This is an open-access article distributed under the terms of the Creative Commons Attribution License (CC BY). The use, distribution or reproduction in other forums is permitted, provided the original author(s) and the copyright owner(s) are credited and that the original publication in this journal is cited, in accordance with accepted academic practice. No use, distribution or reproduction is permitted which does not comply with these terms.
*Correspondence: James Brownjohn, Si5Ccm93bmpvaG5AZXhldGVyLmFjLnVr; Kaoshan Dai, a2RhaUBzY3UuZWR1LmNu