 Fabio Mazza
 Giovanna Imbrogno
- Department of Civil Engineering, University of Calabria, Cosenza, Italy
School buildings are susceptible to high incidents of fire because of carelessness, faulty electrical installation and arson, raising the attention on their seismic retrofitting after fire exposure. Hot and residual mechanical properties of a reinforced concrete (r.c.) structure exposed to fire depend on duration of the heating and cooling phases. As a consequence, seismic retrofitting of a fire-damaged framed structure may not be effective when the peak temperature during a fire is considered. For a successful retrofit, ultimate capacity resulting from residual properties after cooling needs to be taken into account. To this end, the state secondary school Collina-Castello of Bisignano (Cosenza, Italy), a three-story r.c. framed structure designed in a medium-risk seismic region to comply with a former Italian seismic code, is considered as test structure. Thermal analysis of r.c. frame members is preliminarily carried out for two fire scenarios, on the assumption that the fire compartment is confined to the ground (F0) and first (F1) levels. Moreover, four fire-damage cases are examined, considering only the heating phase, at 30 (i.e., F1) and 45 (i.e., F0) minutes of fire resistance, and the overall fire cycle, for fast, medium and slow phases of cooling. Afterwards, the school is supposed to be retrofitted with hysteretic damped braces (HYDBs), in order to achieve the performance levels imposed by current Italian code in a high-risk seismic zone. Non-linear static and dynamic analyses of the unbraced and damped braced structures are carried out, with reference to the degradation of r.c. frame members for different fire durations in the design procedure of the HYDBs.
Introduction
Fires have heating and cooling phases, yet the effects of the latter on temperature distribution and residual mechanical properties are generally not considered when evaluating structural behavior. However, recent experimental (e.g., Gernay, 2019) and computational (e.g., Behnam, 2017) studies, characterizing detrimental effects of the cooling phase, have highlighted the possibility of a further decrease in the carrying capacity of reinforced concrete (r.c.) members even after maximum fire temperature has been reached. Specifically, degradation of the mechanical properties of r.c. structures may continue when the fire cools slowly because of the delayed increase of temperature in the inner layers due to thermal inertia of concrete (Dimia et al., 2011; Mazza and Alesina, 2019). Concrete does not recover strength (i.e., thermal decohesion) and stiffness (i.e., thermal damage) after fire and its heat properties are progressively reduced as function of the duration of the heating and cooling phases (Lee et al., 2008; Maraveas and Vrakas, 2014). Progressive and explosive spalling are also evident in high and ultra-high strength concrete rather than in normal one, on account of low permeability (i.e., hydraulic spalling) and restrained thermal dilation (i.e., thermal spalling) of the zone near the heated surface produced by the cooler inner layers of concrete (Maraveas and Vrakas, 2014). Moreover, the residual compressive strength of the concrete is significantly influenced by the cooling method, with an additional strength reduction of 38% for quenching but not for spraying (Botte and Caspeele, 2017). On the other hand, reinforcing steel bars recover most of their initial properties provided that maximum temperature during fire remains below a critical value (Felicetti et al., 2009). Specifically, mild- and high-strength and stainless steels regain at least 75% of their initial mechanical properties after exposure to fire temperatures above 600°C (Maraveas et al., 2017). As a result, the assessment of fire damage to the structure upon cooling is necessary to establish whether the residual capacity should be increased by retrofitting. However, the simplified 500°C isotherm method, proposed by Eurocode 2 (European Committee for Standardization, EC 2.1-2, 2004b) for assessing the fire resistance of r.c. frame members, applies in the case of thermal profiles inside the member similar to those induced by a standard fire, but it fails in the case of natural fire when the external layers undergo cooling while the internal ones remain hot. In a realistic fire scenario, thermal analysis of the r.c. cross-sections should be performed in the time domain considering the intensity and duration of the fire, because verification at the maximum temperature is not always a sufficient precaution.
On the basis of the above, the seismic retrofitting of r.c. structures damaged by a fire can be a serious problem because an earthquake after a fire can find a different, more vulnerable, condition with respect to the hot stage related to the maximum gas temperature (Mazza, 2015). Damped bracing systems represent a cost-effective strategy which can simultaneously add damping and increase strength (e.g., Christopoulos and Filiatrault, 2006), thereby limiting structural damage without changing the existing structural components. As a matter of fact, the use of dissipative braces also provides significant additional stiffness in the structure, that usually affects maximum base shear and sometimes floor accelerations adversely. But this problem loses its relevance for post-fire resistance because a significant decrease in stiffness and strength is confirmed in the structural members exposed to fire, in comparison with the no-fire condition (Mazza and Alesina, 2019), thus stiffer and stronger damped braces can be inserted in the fire-damaged level; these will be able to restore the corresponding initial values at that level. As final remark, many design procedures of damped braces have been developed according to the performance-based design philosophy (Mazza et al., 2015; Sorace et al., 2016), in parallel to the notable improvement in damper technology, although specific seismic code provisions are still lacking.
The present work shows how to retrofit school buildings damaged from fire, taking into account effects of different fire durations. The Collina-Castello school building in Bisignano (Italy), a three-story r.c. framed structure designed in a medium-risk seismic region to comply with a former Italian code (Italian Ministry of Public Works, 1975), is considered as test structure. Two fire scenarios are assumed considering the fire compartment confined to the area of the ground (F0) and first (F1) levels, with the parametric time-temperature fire curves evaluated in accordance with Eurocode 1 (European Committee for Standardization, EC 1.1-2, 2004a). Four fire cases are investigated: i.e., only the heating phase, at 30 (i.e., F1) and 45 (i.e., F0) minutes of fire resistance; the overall fire duration, in cases of fast, medium and slow cooling. Residual strength and stiffness properties of r.c. frame members after fire are evaluated by experimental results, taking into account the fact that when concrete (Chang et al., 2006) and steel rebars (Slowanski et al., 1971) have cooled down an additional decrease in their performance may occur. Then, the fire-damaged school is retrofitted with hysteretic damped braces (HYDBs) on the basis of a displacement-based design procedure (Mazza et al., 2015) modified in order to recover structural regularity compromised by fire. Finally, in order to check the effectiveness of the proposed retrofitting criterion, non-linear static and dynamic analyses of the unbraced and damped braced fire-damaged structures are carried out.
The Collina-Castello School Building
Layout and Design
The school building Collina-Castello in Bisignano (Cosenza, Italy), monitored since 2004 within the Italian network of the Seismic Observatory of Structures is considered for the numerical study (Figure 1A). The three-story reinforced concrete (r.c.) structure was constructed in 1983; it is made of four plane frames along the principal in-plan X direction (Figure 1C). Only perimeter frames are placed along the short side (Figure 1D), lacking interior beams in parallel with the floor slab direction. In plan orientation of columns, having a 0.4 m × 0.5 m cross-section, and typologies of the longitudinal (0.4 m × 0.6 m) and transversal (0.5 m × 0.4 m) beams are also reported in Figure 1B. The r.c. structure was designed to comply with the admissible tension method, in compliance with a former Italian seismic code (Italian Ministry of Public Works, 1975), assuming a medium-risk seismic region (coefficient of seismic intensity C = 0.07) and a medium subsoil class (coefficient of subsoil ε = 1.0). In 2004, the Department of Civil Protection (D.C.P.) carried out a geometrical survey and material controls of the building. A cylindrical compressive strength of 20.4 MPa and an elastic secant modulus Ec = 25,140 MPa, for concrete, and a yield strength of 375 MPa for steel are assumed. The strengths of concrete and steel are divided by a confidence factor valued at 1.2, corresponding to a suitable level of knowledge of the building as provided by the current Italian seismic code (Italian Ministry of the Infrastructures, 2018). The gravity loads are represented by: dead loads of 5.52 and 5.00 kN/m2 on the first and second floor, respectively, and 6.78 kN/m2 on the top floor, assigning the weight of the roof at the third level; live loads of 3.0 kN/m2 on the first two floors and 0.5 kN/m2 on the top floor, omitting the snow load on the roof in the seismic load combination. Masonry-infills regularly distributed in elevation are placed along the perimeter, assuming a weight of 11 kN/m3. Additional details on the steel reinforcement of columns and beams, constant along the height of the building, are reported in other works (Mazza and Vulcano, 2014a; Sorace and Terenzi, 2014).
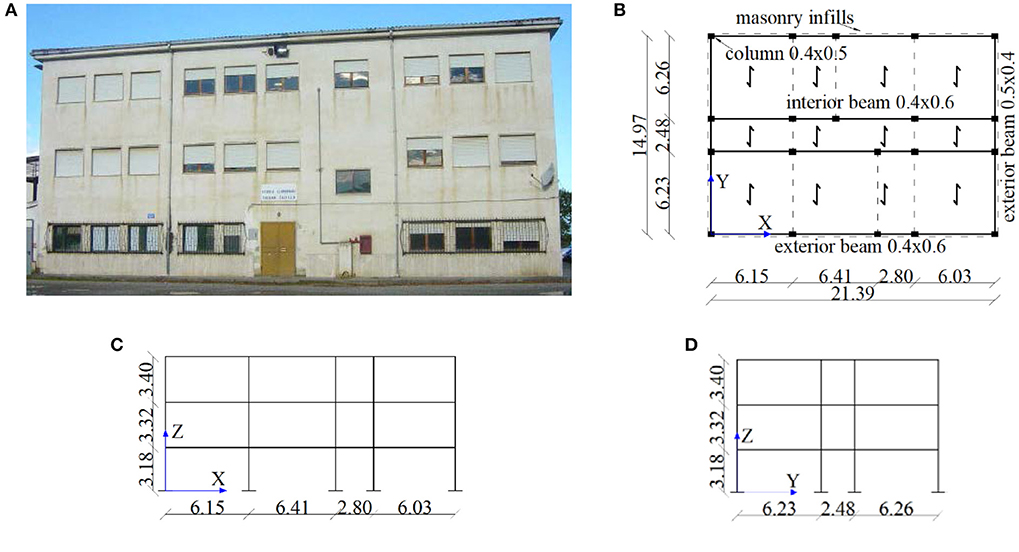
Figure 1. Original Collina-Castello school in Bisignano (units in m). (A) Front view. (B) Plan. (C) Longitudinal perimeter frame. (D) Transversal perimeter frame.
Design of the Fire Scenarios
Ground and first floor levels of the Collina-Castello school are used for offices and classrooms, respectively, producing two different fire scenarios (i.e., F0 and F1) with a uniform temperature extended to the whole floor area (Figure 2). Fire involves four and three sides of the interior columns and beams, respectively, and one side for all the exterior elements. The design value of the fire load density is function of the combustible contents of the compartment (EC 1.1-2):
related to At, the total area of enclosure (i.e., walls, ceiling, and floor, including openings), and qf, d. The latter is the value corresponding to the surface area of the floor (Af)
being: Qf, k the characteristic fire load; δq1 and δq2 partial factors related to the risk of fire; δn differentiation factor depending on the active fire prevention measures. With reference to 30 min (R30) and 45 min (R45) of exposure, the design parameters of the fire load for the two levels of the test structure are shown in Table 1.
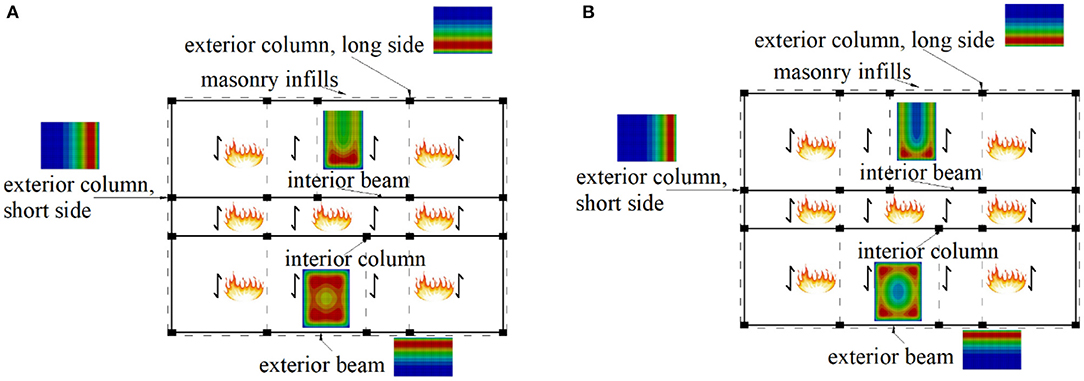
Figure 2. Fire compartments for the Collina-Castello school. (A) Fire scenario F0. (B) Fire scenario F1.
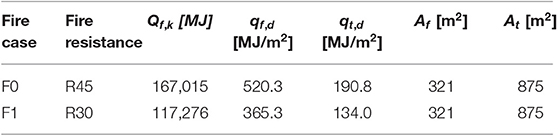
Table 1. Design parameters of the fire load (EC 1-1.2).
Many time-temperature curves are available in order to simulate post-flashover fully developed fires (Ariyanayagam and Mahendran, 2014). The EC 1.1-2 expression of the gas temperature θg(°C) during the heating phase takes into account size, thermal properties, and ventilation conditions of the fire compartment by using the following equation
where the actual duration of the fire is determined by considering fictitious time t* given by time t (in hours) multiplied by a dimensionless parameter equal to
where O is an opening factor related to Av, area of vertical openings, heq, weighted average of vertical openings, and At, total area of enclosure
and b is the thermal inertia of all enclosure surfaces of the compartment. The gas temperature in the cooling phase is evaluated as
where the maximum temperature θmax in the heating phase lasts for
being tlim = 25, 20, and 15 min in the case of slow, medium and fast fire growth, respectively. This parametric curve shall apply to compartments with mainly cellulosic type fuel loads, floor area up to 500 m2 and thermal inertia 100 ≤ b ≤ 2,200 J/m2s1/2K and opening factor 0.02 ≤ O ≤ 0.2 m1/2. It is interesting to note that the duration of the cooling phase is unaffected by the fuel load density while it increases for decreasing values of the opening factor and increasing values of thermal inertia. In particular, Table 2 reports the above mentioned parameters defining the final instant of the cooling phase (tcooling). Three cooling laws are assumed for the F0 (Figure 3A) and F1 (Figure 3B) fire scenarios, corresponding to different final instants to recovery the ambient temperature of 20°C: i.e., fast (RFC), medium (RMC), and slow (RSC) cooling.
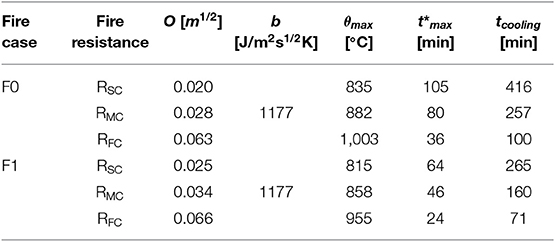
Table 2. Design parameters of the cooling phase.
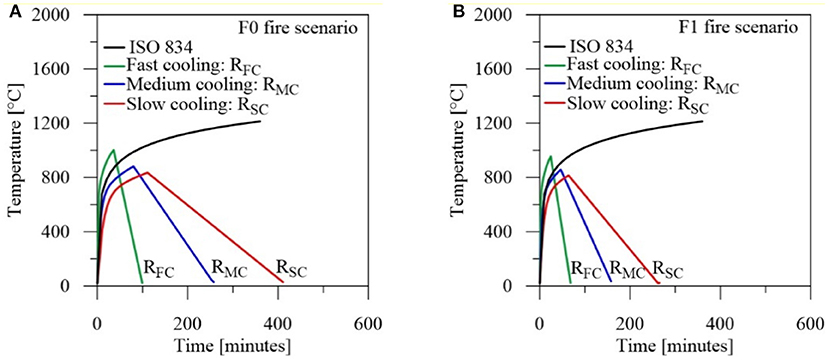
Figure 3. Time-temperature curves for the Collina-Castello school. (A) F0 fire scenario. (B) F1 fire scenario.
The standard ISO-834 curve (ISO 834, 1999) is also reported in Figure 3, representing the heating phase with fire temperature depending on the elapsed time only. The combination of the design parameters results in an increase of maximum temperature and a concurrent reduction of duration of the heating and cooling phases when increasing values of the opening factor are assumed.
Next, the temperature distribution in the r.c. frame members is evaluated considering boundary conditions on the heat flow derived from the parametric time-temperature curves proposed by EC 1.1-2. Specifically, quadratic 8-node quadrilateral elements, with a mesh size equal to 1 cm, are assumed for two-dimensional uncoupled heat transfer transient finite element analysis of r.c. cross-sections (ABAQUS, 2014). The unexposed cross-section sides are assumed to be at ambient temperature of 20°C, while temperature is considered constant along the longitudinal axis of each frame member. Thermal parameters used for concrete (c) and steel (s) are as follows: thermal conductivity, kc = 2 W/mK and ks = 50 W/mK; specific heat, cp, c = 900 J/kgK and cp, s = 450 J/kgK; density, ρc = 2,300 kg/m3 and ρs = 7,850 kg/m3. Finally, a heat convection factor equal to 35 W/m2K and radiation emissivity equal to 0.56 are assumed for the concrete of surfaces exposed to fire, while 9 W/m2K is selected as convection factor for the surfaces not exposed.
With regard to the interior beams and columns on the ground level of the Collina-Castello school, thermal mappings of r.c. cross sections are shown in Figures 4A–D,E–H, respectively, considering thermal diffusion in the part of beams included in the floor slab. The internal distribution of temperature during the heating phase, after 45 min of fire exposure (R45), is compared with that evaluated at the end of fast (RFC), medium (RMC), and slow (RSC) phases of cooling for the F0 fire scenario. Note that for decreasing decay rates of the cooling phase (Figures 4B–D,F–H), the internal layers show higher temperatures than the exterior ones. This behavior depends on the delayed increase in temperature in the internal layers due to thermal inertia of internal concrete, while the external layers cool down. On the other hand, during the heating phase the external layers are heated to temperatures much higher than those of the internal layers (Figures 4A,E). Finally, a close relation between duration of the cooling phase and maximum temperature and extension of the damaged part of the cross-section is observed, while the number of sides exposed to fire is the main parameter when the heating phase is considered.
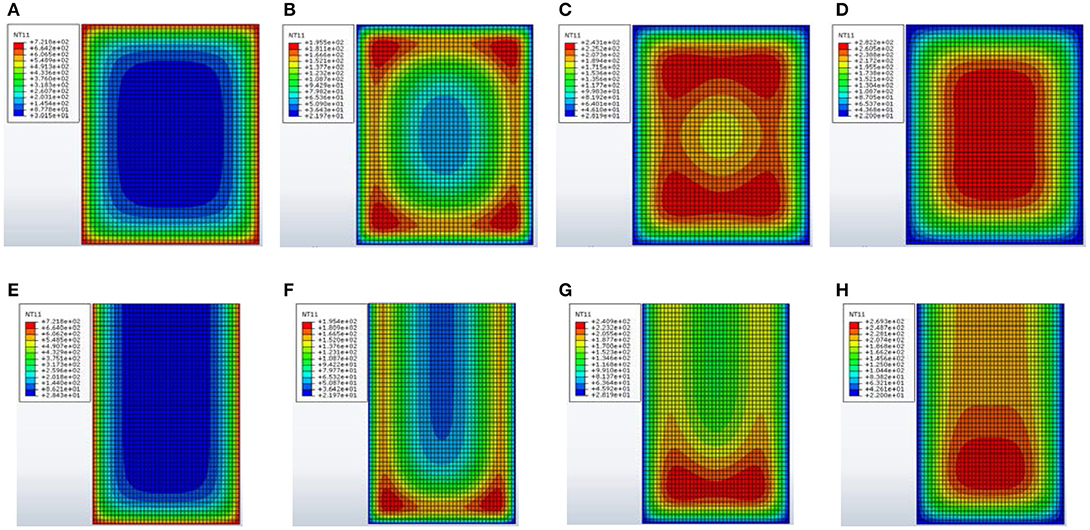
Figure 4. Thermal mappings of interior r.c. frame members for the F0 fire scenario. (A) R45: columns. (B) RFC: columns. (C) RMC: columns. (D) RSC: columns. (E) R45: beams. (F) RFC: beams. (G) RMC: beams. (H) RSC: beams.
Specifically, the most heated areas are found to be the corners (Figures 4B,F), edges (Figures 4C,G), and center (Figures 4D–H) when RFC, RMC, and RSC are considered, respectively. Similar results, omitted for the sake of brevity, are obtained for the exterior columns, with a short and long side exposed to fire, and beams, with the most headed areas parallel to the side exposed to fire.
Residual Properties of r.c. Frame Members After a Fire
The residual values of the stiffness, strength, and ductility properties of r.c. frame members exposed to fire are evaluted by a variable isotherm method, on the assumption that the temperature is constant along their longitudinal axis. To a specific duration of the heating () and cooling (tcooling-) phases of a fire, the r.c. cross-section is divided into an appropriate number of concentric subsections, each of which is further subdivided in a number of subelements corresponding to the exposed sides. Discretization of the cross-sections of r.c. frame members is shown in Figure 5, distinguishing interior columns (Figure 5A) and beams (Figure 5B) and exterior columns (Figure 5C) and beams (Figure 5D). Specifically, the temperature in the center of the i-th subelement is considered and simmetry is used in the case of opposite sides exposed to fire (e.g., Tbottom, i = Ttop, i and Tleft, i = Tright, i, for an interior column, and Tleft, i = Tright, i, for an interior beam). It should be noted that the innermost subelement (see blue edge) has an equal temperature on all sides.
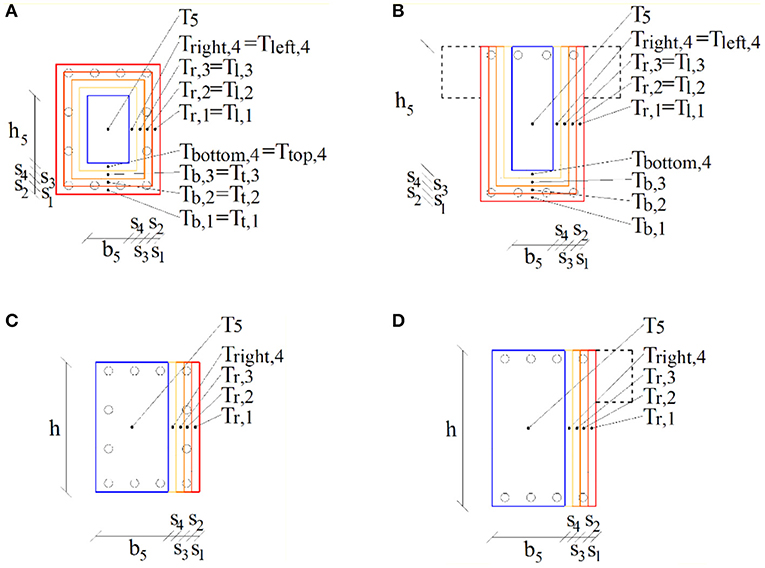
Figure 5. Discretization of an r.c. cross-section with the variable isotherm method. (A) Interior column. (B) Interior beam. (C) Exterior column. (D) Exterior beam.
As an example, time-temperature profiles for the cross-section of r.c. interior columns at the ground (i.e., F0 scenario) and first (i.e., F1 scenario) levels of the school are plotted in Figure 6, starting from the border and ending at the center along the horizontal direction. Temperatures in the center of five concrete concentrically layers are shown, with reference to the slow (Figures 6A,D), medium (Figures 6B,E), and fast (Figures 6C,F) cooling rates. Note that the temperature evolution in the concentric layers is different during the heating and cooling phases and more marked differences are observed for decreasing values of the cooling rate. Moreover, maximum temperature in the outer layers is reached before for all rates of cooling, while this occurs during or at the end of the cooling phase for the inner ones. Finally, temperature variations are more evident for the F0 scenario characterized by the highest temperature during fire, while the temperature of the internal layers does not recover the ambient value at the end of the time-temperature curves (tcooling) reported in Table 2.
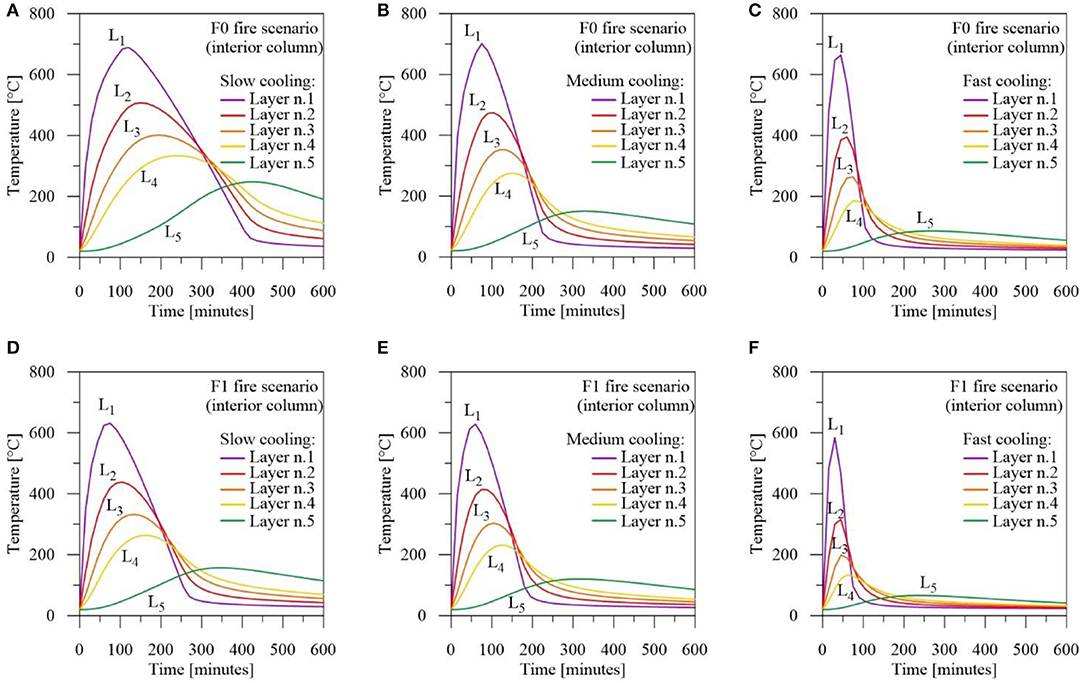
Figure 6. Time-temperature profiles for the cross-section of an interior column exposed to fire at the ground (A,B,C) and first (D,E,F) level of the Collina-Castello school.
Two approaches are applied to evaluate the residual capacity of the cross-sections subjected to different fire scenarios and decay rates: (i) the 500°C isotherm method proposed by EC 2.1-2, combined with R30 and R45 fire resistances in the heating phase; (ii) the proposed variable isotherm method, using time-temperature profiles of the internal layers during the cooling phase. For this purpose, reduction factors of the compressive strength, αfc = fcθ/fc20, and elastic modulus, αEc = Ecθ/Ec20, for concrete (Chang et al., 2006) and the yield strength, αfy = fyθ/fy20, for steel (Slowanski et al., 1971) are reported in Figure 7, with reference to the hot (Figure 7A) and cold (Figure 7B) conditions.
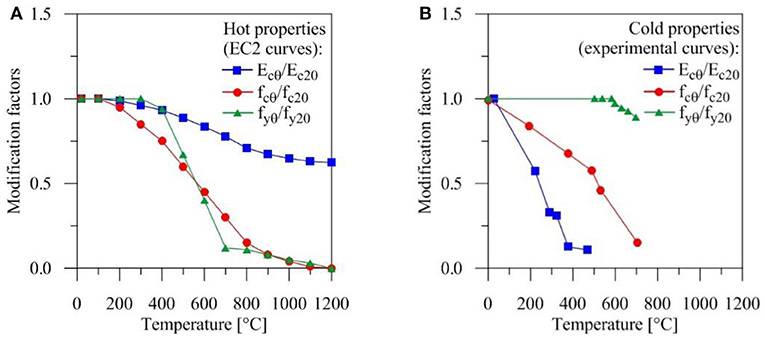
Figure 7. Modification factors of mechanical properties for r.c. frame members during heating and cooling phase: hot (A) and cold (B) properties.
Note that notable reduction of the residual strength of the concrete is observed during the cooling phase due to thermal inertia of the inner layers, contrary to the EC 2.1-2 where concrete exceeding the temperature of 500°C is not considered. The situation is quite different for the yield strength of steel highlighting an almost complete recovery after cooling, differently from the EC 2.1-2 where a notable reduction is hypothesized referring to the maximum temperature during the heating phase.
For the sake of brevity, only post-fire mechanical properties of the interior columns along the main local axis of the cross-section are reported in Figure 8, with reference to the first (Figures 8A,C,E) and second (Figures 8B,D,F) levels of the Collina Castello school. The influence of the duration of the cooling phase is investigated by comparing slow (RSC), medium (RMC), and fast (RFC) cooling processes with results at the R30 (i.e., F1) and R45 (i.e., F0) fire resistances and the no fire condition (i.e., T = 20°C). In particular, the axial load (NRd) and bending moment (MRd) ultimate interaction domain narrows for decreasing values of the cooling rate (Figures 8A,B), especially when the balanced compressive load is exceeded.
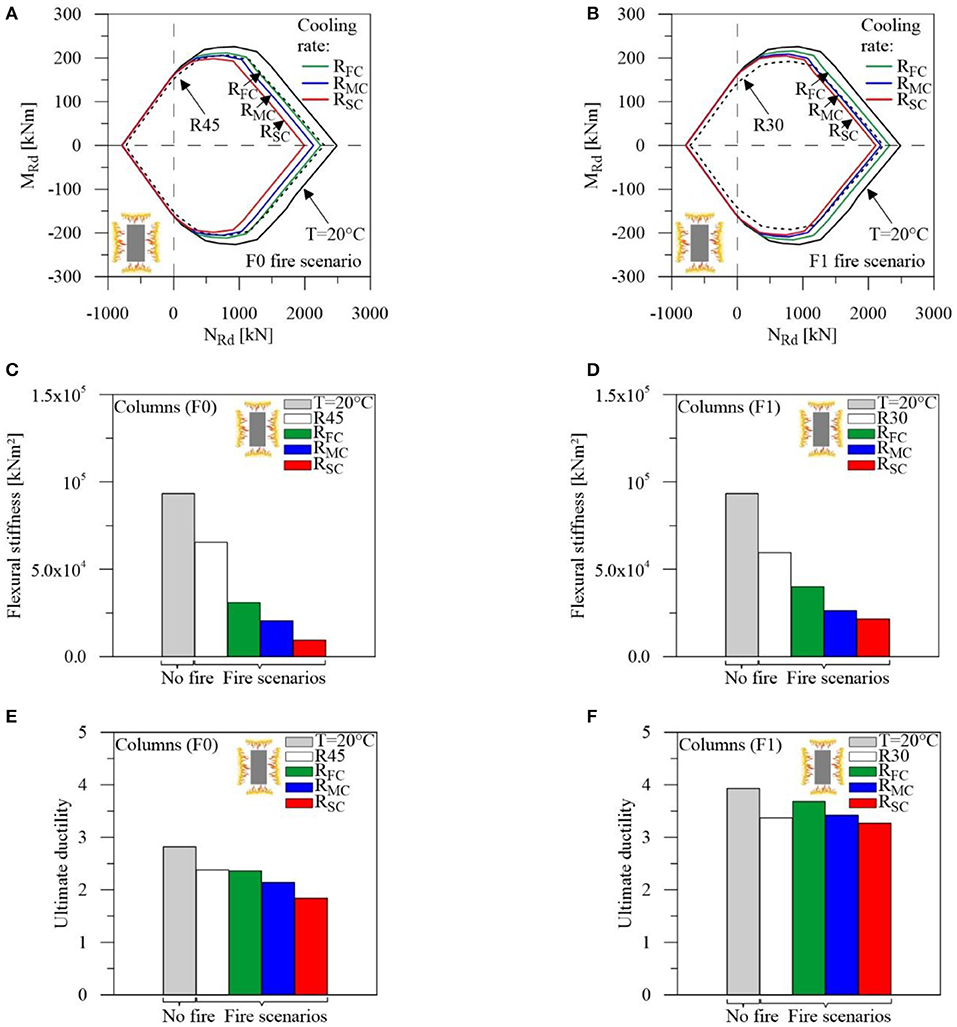
Figure 8. Residual properties for interior columns of the Collina-Castello school: F0 (A,C,E) and F1 (B,D,F) fire scenarios.
Moreover, the notable reduction of the flexural stiffness after heating and cooling (Figures 8C,D) leads to a different distribution of the seismic loads between the exterior and interior columns of the fire compartment, compared to the heating (i.e., R30 and R45) and no fire conditions. Finally, only limited fire effects are found on the ultimate ductility corresponding to the axial force due to the gravity loads (Figures 8E,F).
Seismic Retrofitting With Hysteretic Damped Braces
The non-linear static (pushover) analysis of the school is carried out before and after fire, along the in-plan X and Y principal axes. The inelastic behavior of the r.c. frame members is modeled with plastic hinges lumped at both ends, assuming an elastic-plastic moment-curvature law with linear hardening (i.e., hardening ratio rF = 3%). A three-step algorithm, based on the Haar–Kàrmàn principle, and the arc-length method are adopted to evaluate the capacity curve (Mazza and Mazza, 2010; Mazza, 2014a). Invariant lateral force distributions are considered for the non-linear static analysis, varying the intensity proportionally to the floor masses with (“modal type”) or without (“uniform type”) the fundamental vibration mode. The pushover analyses are terminated once the ultimate value of the curvature ductility demand is attained at critical sections of frame members (see NTC18 provisions for existing buildings). As an example, normalized base shear (i.e., Vb/Wtot, Wtot being the total seismic weight) and horizontal top displacement (i.e., utop/Htot, Htot being the total height) of the structure, along the X and Y directions, are plotted in Figure 9 with and without fire.
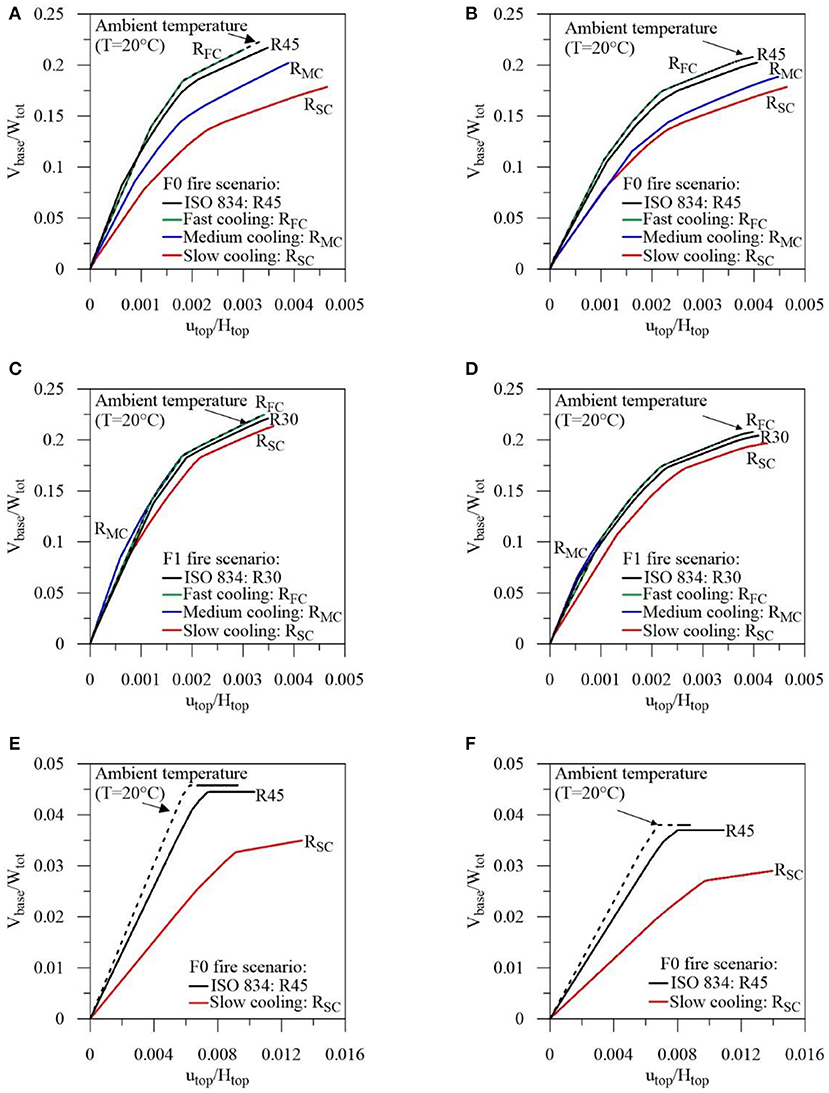
Figure 9. Comparison of pushovers curves for the Collina-Castello school before retrofitting, with and without fire at ground (F0) and first (F1) level. (A) Uniform pattern in the X direction: F0 scenario. (B) Modal pattern in the X direction: F0 scenario. (C) Uniform pattern in the X direction: F1 scenario. (D) Modal pattern in the X direction: F1 scenario. (E) Uniform pattern in the Y direction: F0 scenario. (F) Modal pattern in the Y direction: F0 scenario.
The capacity curves along the X direction are plotted in Figures 9A–D with reference to the F0 and F1 fire scenarios, respectively. In detail, results obtained for fast (RFC), medium (RMC) and slow (RSC) cooling phases are compared with those corresponding to the ISO-834 curve with R45 and R30 fire resistances, respectively. Pushover curves corresponding to the “uniform” (Figures 9A,C) and “modal” (Figures 9B,D) load distributions are more restrictive in terms of displacement and shear, respectively. Moreover, the significant decrease of stiffness and strength in the structural elements exposed to the F0 fire scenario corresponds to an increase of displacement and reduction of shear in comparison with the no-fire condition, when an increasing fire duration is considered (Figures 9A,B). Little difference is found with results obtained for ambient temperature for the F1 fire scenario (Figures 9C,D). This may be justified by the fact that capacity curves corresponding to different fire conditions depend on undamaged columns at the ground level when fire at the first level is assumed. Finally, central columns at the ground level affect the ultimate behavior in the no fire condition, while exterior columns collapse when the F0 fire scenario is considered. Similar curves are plotted in Figures 9E,F referring to pushover curves of the undamaged and R45 and RSC fire-damaged structures in the F0 scenario. As can be seen, top displacement in the Y direction is greater than in the X direction, due to the lack of interior beams in parallel with the floor slab direction, but the opposite occurs in terms of base shear depending on the in-plan orientation of the cross-sections of all columns (see Figure 1B).
In order to carry out seismic retrofitting of the school building in line with the provisions imposed by NTC18, a steel chrevron bracing system with hysteretic dampers (HYDBs) is inserted in the exterior bays of the perimeter frames at all three stories (Figure 10). The coordinates of the seismic zone (longitude 16.17° and latitude 39.31°) correspond to peak ground accelerations on rock equal to 0.323 and 0.426 g at the life safety (LS) and collapse prevention (CP) limit states, respectively, and medium subsoil class (subsoil parameter equal to 1 and 1.08 at LS and CP, respectively).
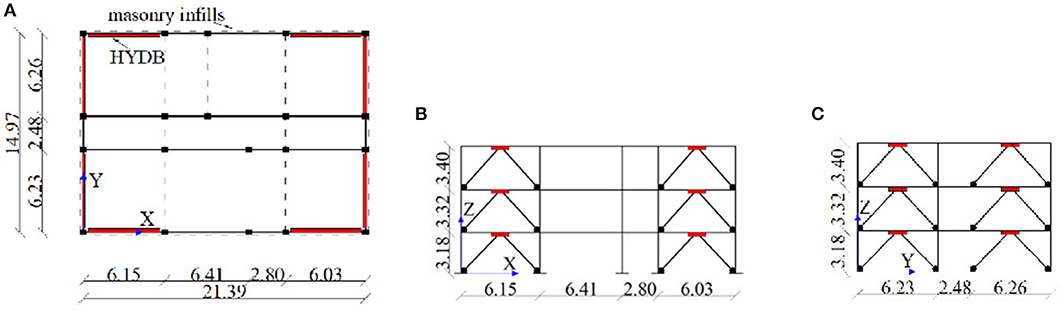
Figure 10. Retrofitted Collina-Castello school in Bisignano (units in m). (A) Plan. (B) Longitudinal perimeter frame. (C) Transversal perimeter frame.
The Displacement-Based-Design (DBD) procedure of HYDBs already proposed by the authors (Mazza, 2014b; Mazza and Vulcano, 2014b; Mazza et al., 2015) is applied to in-elevation irregularity due to fire. The distribution criterion of the HYDBs is aimed to obtain a retrofitted structure globally regular with regard to stiffness and strength, by balancing the degradation of fire-exposed r.c. frame members. In detail, the stiffness distribution of the HYDBs is selected assuming the same value of the drift ratio at each story of the irregularly fire damaged building (i.e., case A). Moreover, the strength distribution of the HYDBs is assumed so that their activation tends to occur at each story simultaneously, before reaching the shear resistance of the r.c. frame members. A proportional stiffness criterion (i.e., case B) is also applied, assuming that mode shapes of the fire-damaged structure remain practically the same after the insertion of HYDBs. The distribution of the lateral loads supported by the damped braces at the yielding point is assumed proportional to the stiffness distribution. This criterion is preferable in the case of an in-elevation regular structure, because the stress distribution in the frame members remains practically unchanged after retrofitting, but it may be misleading in the case of vertical irregularity due to fire. Stiffness (KDB) and yield-load (Ny, DB) values of the HYDBs for the A and B cases described above are reported in Tables 3A–D, respectively, for the in-plan X and Y directions.
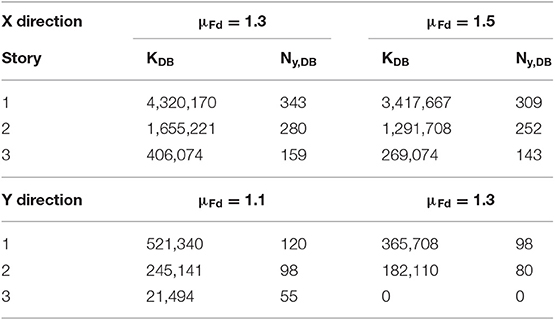
Table 3A. Stiffness (kN/m) and strength (kN) of the HYDBs (case A, LS limit state).
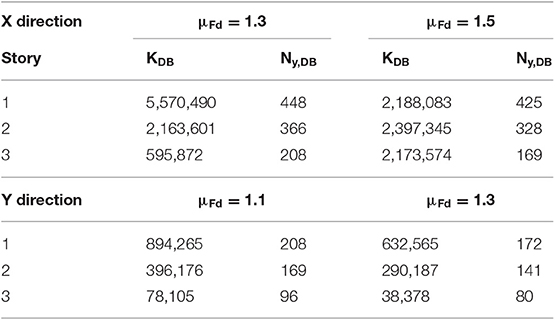
Table 3B. Stiffness (kN/m) and strength (kN) of the HYDBs (case A, CP limit state).
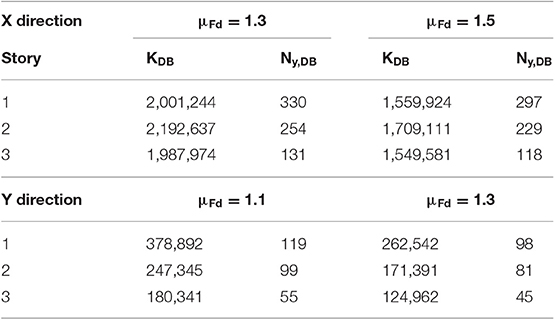
Table 3C. Stiffness (kN/m) and strength (kN) of the HYDBs (case B, LS limit state).
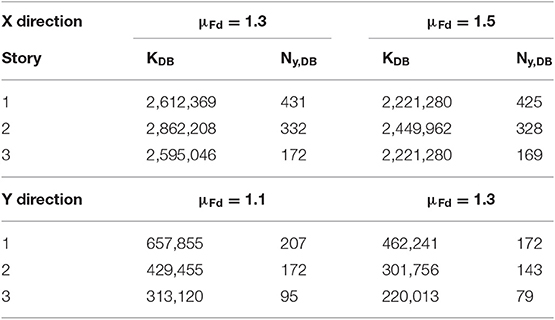
Table 3D. Stiffness (kN/m) and strength (kN) of the HYDBs (case B, CP limit state).
The design of the HYDBs is carried out to prevent brittle failure mechanisms of the original structure. To this end, different values of the design frame ductility are assumed at the LS and CP limit states (i.e., μFd = 1.3 and 1.5 in the X direction; μFd = 1.1 and 1.3 in the Y direction) combined with a constant design value of ductility for the HYDs (i.e., μD = 20). It should be noted that the flexibility of the supporting steel brace connecting the damper to the frame is not considered (i.e., brace stiffness KB → ∞), so that the lateral stiffnesses of the HYDBs (KDB) and HYDs (KD) are assumed equal as well as the corresponding stiffness hardening ratios (i.e., rDB = rD = 3%).
Numerical Results
A numerical study is performed to investigate the effectiveness of the new DBD procedure of the HYDBs and their distribution over the height of the building (i.e., cases A and B). To this end, non-linear static and dynamic analysis of the fire-damaged unbraced (UF) and damped braced (DBF) frames are carried out. The focus is mainly on the slow cooling phase (i.e., RSC) that corresponds to the most severe fire in relation to duration, even if maximum temperature less than that observed for medium (i.e., RMC) and fast (i.e., RFC) cooling occurs (see Figure 3). Reduced stiffness, strength and ductility of the frame members at the ground and first levels, where the F0 and F1 fire compartments are localized, are evaluated by means of the variable isotherm method. Columns are assumed to behave elastically under axial forces, accounting for the interaction with bending moment in the yield condition, while axial strains are not considered in the beams; shear deformations are neglected in all the r.c. frame members. The hysteretic behavior of the HYDBs is simulated with a bilinear law, to prevent yielding and buckling of the steel braces. The non-linear static and dynamic responses are evaluated by an incremental step-by-step procedure (see Mazza, 2014a, 2015). At each step of the analysis, the incremental elastic response is evaluated as function of the known initial state and given nodal displacements; then, the elastic-plastic flexural solution is obtained by an initial stress iterative procedure. A Rayleigh damping matrix is assumed in the analysis of the test structures, imparting a viscous damping ratio equal to 5% to the first and third modes of the UF and DBF structures in the selected horizontal direction, so covering those modes important to the response.
Firstly, capacity curves are plotted in Figures 11A–D with reference to the X and Y directions, to evaluate the seismic vulnerability of the UF and DBF structures, assuming constant drift ratio (i.e., DBF.A in Figures 11A,C) and proportional stiffness (i.e., DBF.B in Figures 11B,D) design criteria. Stiffness and yield strength properties of the HYDBs are evaluated for both the displacement response spectra at the LS and CP limit states. The non-linear static analysis of the DBF.A and DBF.B structures is terminated once the ultimate value of damper ductility, assumed equal for all the examined cases (i.e., μDu = 20), is attained. Checks of the ultimate limit state for ductile mechanism have also been carried out for the r.c. elements, for both unbraced and damped braced frames. As shown, the seismic retrofitting with HYDBs has proved to be more effective for the X direction rather than the Y, the latter exhibiting high deformability and low strength of the original structure due to the lack of interior beams. Moreover, the increase of lateral stiffness due to the insertion of the HYDBs produces a more marked increase of seismic loads in the Y direction characterized by the highest value of the fundamental vibration period. Note that the displacement capacity of the DBF.A (Figures 11A,C) is greater than that obtained for the DBF.B structures (Figures 11B,D), while comparable values of total base shear are obtained. As expected, the optimal design solutions are obtained when the CP limit state (see green lines) is combined to the lowest design values of the frame ductility along the X (i.e., μFd = 1.3) and Y (i.e., μFd = 1.1) directions.
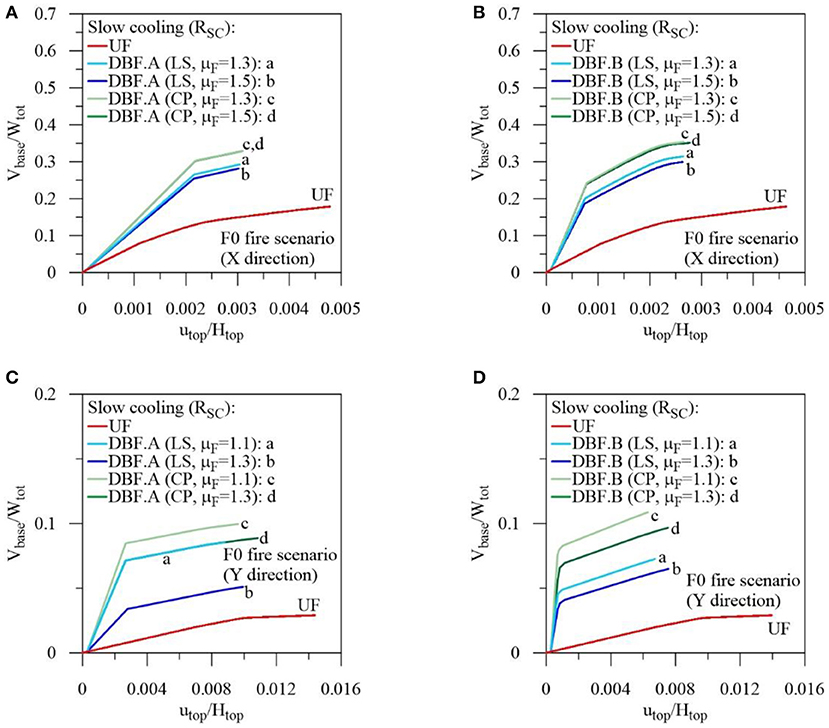
Figure 11. Comparison of pushovers curves along the in-plan X and Y directions for the retrofitted Collina-Castello school, at LS and CP limit states. (A) Constant drift ratio criterion: X direction. (B) Proportional stiffness criterion: X direction. (C) Constant drift ratio criterion: Y direction. (D) Proportional stiffness criterion: Y direction.
Afterwards, in order to evaluate the effects of the retrofitting criteria of the HYDBs (i.e., DBF.A and DBF.B) on the seismic response of the school, non-linear dynamic analyses are carried out to consider two sets of horizontal accelerograms, corresponding to the LS and CP limit states. In accordance with the minimum number of artificial motions imposed by NTC18, three accelerograms, each with a duration of the stationary part equal to 10 s and a total duration of 25 s, are generated for each set of motions using the computer code (Seismoartif, 2018). The elastic response spectra of the artificial accelerograms match, on average, NTC18 elastic response spectra in the range of vibration periods 0.05–4 s. Specifically, local damage in terms of the ductility demand of beams and columns is reported in Figures 12A–D, respectively, evaluated as mean values of the maximum ductility demand obtained for the three artificial earthquakes considered at the LS limit state. Two retrofitting solutions are considered for the F0 fire scenario, assuming X (Figures 12A,C) and Y (Figures 12B,D) directions. For a comparison, the results of the original structure in the no fire and fire-damaged conditions are also presented.
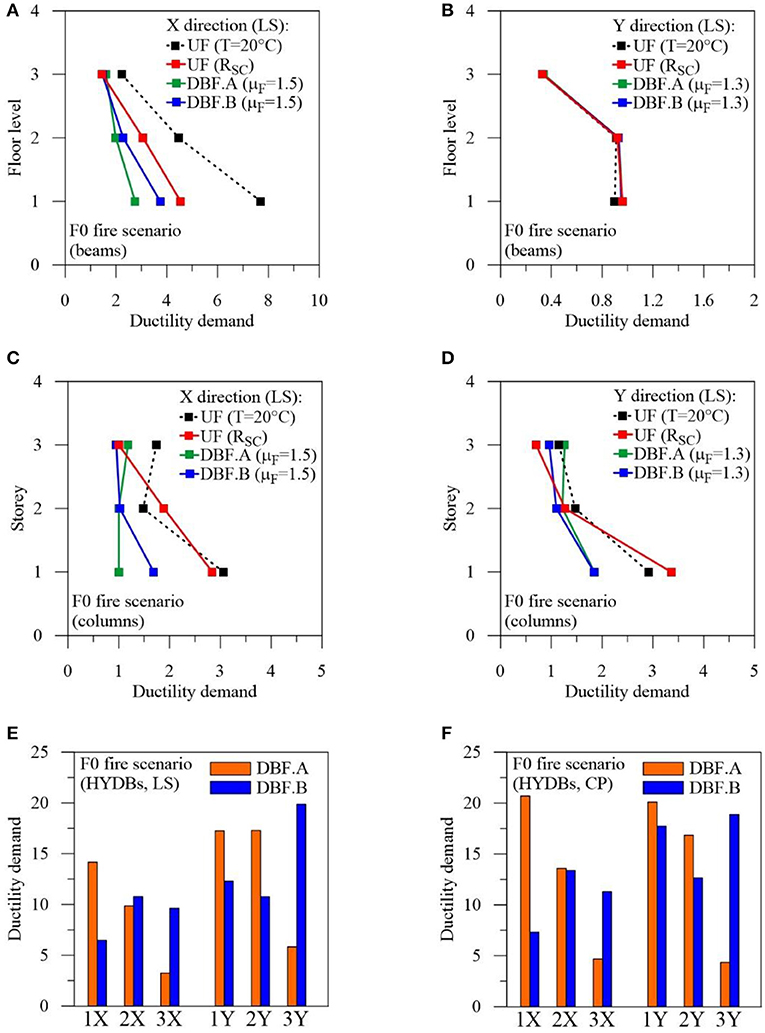
Figure 12. Ductility demand of r.c. frame members and HYDBs for the Collina-Castello school. (A) Beams (X direction, LS). (B) Beams (Y direction, LS). (C) Columns (X direction, LS). (D) Columns (Y direction, LS). (E) HYDBs (X and Y directions, LS). (F) HYDBs (X and Y directions, CP).
Moreover, a time ratio αt, defined as the ratio between the time corresponding to the ultimate curvature of a critical section of the r.c. members (tmax) and the total duration of the artificial motions (i.e., ttot = 25 s), is evaluated. Note that the analysis is terminated early for the UF at ambient temperature (i.e., αt, X = 0.170 and αt, Y = 0.158) and even before for slow cooling after fire (i.e., αt, X = 0.142 and αt, Y = 0.073), while αt equal to 1.0 is always obtained for the retrofitted structures. As can be observed, a “strong column-weak beam” mechanism is obtained by the insertion of HYDBs, with the DBF.A ensuring more effective damage control of the beams than the DBF.B, especially at the lower stories. Graphs similar to the previous ones, omitted for the sake of brevity, are obtained with reference to earthquakes at the CP limit state. As expected, the analyses of the original structure are interrupted before of what occurred at the LS limit state (i.e., αt, X = 0.084 and αt, Y = 0.043, at ambient temperature; αt, X = 0.075 and αt, Y = 0.045 after slow cooling). On the other hand, similar results are obtained for the DBF.A and DBF.B structures, but a premature collapse of the DBF.B occurs (i.e., αt, X = 0.08 and αt, Y = 0.16).
To check the effectiveness of the DBD procedure in involving most of the HYDBs in the energy dissipation, the vertical distribution of maximum ductility demand of the HYDBs is plotted in Figures 12E,F at the LS and CP limit states, respectively. At each story, comparison between constant drift (case A) and proportional stiffness (case B) criteria is made for the HYDBs placed along the in-plan X and Y directions where μFd = 1.5 and μFd = 1.3 are assumed, respectively. Note that distribution of HYDB ductility demand is fairly uniform for the DBF.B and maximum values at the second (X direction) and third (Y direction) levels generally take place. However, it is not surprising that the maximum value evaluated along the Y direction occurs at the LS instead of the CP limit state, given that the final instant for the latter is tmax = 4.0 s (i.e., αt, Y = 0.16). On the contrary, quite an irregular distribution of the ductility demand along the building height is obtained for HYDBs of the DBF.A structure, in both principal directions, with maximum values at the ground level where the F0 scenario is assumed. This result confirms the fact that the constant drift criterion is the best choice for reducing the seismic vulnerability of structures exposed to fire by acting mainly on the floor where fire damage occurs.
Conclusions
Effects of duration of a fire on the seismic retrofitting of school buildings by means of HYDBs is studied for increasing values of the opening factor, corresponding to increase of maximum temperature and reduction of duration of the heating and cooling phases. First, thermal analysis is carried out on an actual building represented by the Collina-Castello school in Bisignano (Italy), evaluating the distribution of temperature in the cross sections of fire exposed r.c. structural members. Fast, medium and slow cooling laws are assumed for the F0 and F1 fire scenarios corresponding to fire compartment confined to the area of the ground and first floor, respectively. A close relation between duration of the cooling phase and maximum temperature and extension of the damaged part of the cross-section is observed. In particular, the internal layers show higher temperatures than the exterior ones for decreasing decay rates of the cooling phase, while during the heating phase the external layers are heated to temperatures much higher than those of the internal layers. Then, a variable isotherm method is proposed for evaluating residual properties of r.c. frame members after the cooling phase of a fire, as an alternative to the simplified 500°C isotherm method proposed by EC 2.1-2. To this end, time-temperature profiles of concentrically layers of r.c. cross-sections are evaluated, highlighting that the temperature difference between the free surface and internal layers of a structural element varies during the heating and cooling phases and increases for decreasing values of cooling rate.
Afterwards, non-linear static analysis of the original school is carried out before and after fire, showing that the significant decrease of stiffness and strength in the r.c. structural elements exposed to fire corresponds to an increase of displacement and reduction of shear in comparison with the no-fire condition, especially when an increasing fire duration is considered for the F0 fire scenario. Stiffness and strength distributions of the HYDBs are evaluated with a criterion aiming to obtain a damped braced structure which can be considered globally regular after the degradation of fire-exposed r.c. frame members (i.e., case DBF.A). A proportional stiffness criterion is also applied, assuming that mode shapes of the fire-damaged structure remain practically the same after the insertion of HYDBs (i.e., case DBF.B). Results from non-linear static analysis highlight that the displacement capacity of the DBF.A structures is greater than that obtained for the DBF.B, while comparable values of total base shear are obtained. The effectiveness of the HYDBs is confirmed by non-linear dynamic analysis, forced to stop early for the UF structure, unlike for the retrofitted structures. A “strong column-weak beam” mechanism is obtained by the insertion of HYDBs, with the DBF.A ensuring more effective damage control of the beams than the DBF.B, especially at the lower stories. A rather irregular distribution of ductility demand along the building height is obtained for HYDBs of the DBF.A structure, acting mainly on the floor where fire damage occurs.
Data Availability Statement
The datasets generated for this study are available on request to the corresponding author.
Author Contributions
FM and GI contributed to conception and design of the study, numerical results, first draft of the manuscript, manuscript revision and read the submitted version.
Funding
The present work was financed by ReLUIS (Italian network of university laboratories of earthquake engineering), in accordance with the Convenzione DPC-ReLUIS 2019-2021, WP15, Code Revisions for Isolation and Dissipation.
Conflict of Interest
The authors declare that the research was conducted in the absence of any commercial or financial relationships that could be construed as a potential conflict of interest.
References
ABAQUS (2014). Computer Software, Dassault Systems. Users and Theory Manual Version 6.14. Johnston, RI: ABAQUS Inc.
Ariyanayagam, A. D., and Mahendran, M. (2014). Development of realistic design fire time-temperature curves for the testing of cold-formed steel wall systems. Front. Struct. Civil Eng. 8, 427–447. doi: 10.1007/s11709-014-0279-1
Behnam, B. (2017). On the interaction between span length and opening ratio of RC frames under natural fires. Proc. Inst. Civil Eng. Struct. Build. 171, 472–486. doi: 10.1680/jstbu.17.00044
Botte, W., and Caspeele, R. (2017). Post-cooling properties of concrete exposed to fire. Fire Saf. J. 92, 142–150. doi: 10.1016/j.firesaf.2017.06.010
Chang, Y. F., Chen, Y. H., Sheu, M. S., and Yao, G. C. (2006). Residual stress-strain relationship for concrete after exposure to high temperatures. Cement Concr. Res. 36, 1999–2005. doi: 10.1016/j.cemconres.2006.05.029
Christopoulos, C., and Filiatrault, A. (2006). Principles of Passive Supplemental Damping and Seismic Isolation. Pavia: IUSS Press.
Dimia, M. S., Guenfoud, M., Gernay, T., and Franssen, J.-M. (2011). Collapse of concrete columns during and after the cooling phase of a fire. J. Fire Protect. Eng. 21, 245–263. doi: 10.1177/1042391511423451
European Committee for Standardization, EC 1.1-2. (2004a). Eurocode 1: Actions on Structures - Part 1-2: General Actions - Actions on Structures Exposed to Fire. ENV 1991-1-2, 2004. Brussels.
European Committee for Standardization, EC 2.1-2. (2004b). Eurocode 2: Design of Concrete Structures - Part 1–2: General Rules - Structural Fire Design. ENV 1992-1-2, 2004. Brussels.
Felicetti, R., Gambarova, P. G., and Meda, A. (2009). Residual behavior of steel rebars and R/C sections after a fire. Constr. Build. Mater. 23, 3546–3555. doi: 10.1016/j.conbuildmat.2009.06.050
Gernay, T. (2019). Fire resistance and burnout resistance of reinforced concrete columns. Fire Saf. J. doi: 10.1016/j.firesaf.2019.01.007
Italian Ministry of Public Works (1975). Norme tecniche per le costruzioni in zone sismiche (DM75), D.M. 08-04-1975 (in Italian).
Italian Ministry of the Infrastructures (2018). Technical Regulations for the Constructions (NTC18), D.M. 17-01-2018. Rome (in Italian).
Lee, J., Xi, Y., and William, K. (2008). Properties of concrete after high-temperature heating and cooling. ACI Mater. J. 105, 334–341. doi: 10.14359/19894
Maraveas, C., Fasoulakis, Z., and Tsavdaridis, K. D. (2017). Post-fire assessment and reinstatement of steel structures. J. Struct. Fire Eng. 8, 181–201. doi: 10.1108/JSFE-03-2017-0028
Maraveas, C., and Vrakas, A. A. (2014). Design of concrete tunnel linings for fire safety. Struct. Eng. Int. 24, 319–329. doi: 10.2749/101686614X13830790993041
Mazza, F. (2014a). Modelling and nonlinear static analysis of reinforced concrete framed buildings irregular in plan. Eng. Struct. 80, 98–108. doi: 10.1016/j.engstruct.2014.08.026
Mazza, F. (2014b). Displacement-based seismic design of hysteretic damped braces for retrofitting in-plan irregular r.c. framed structures. Soil Dyn. Earthq. Eng. 66, 231–240. doi: 10.1016/j.soildyn.2014.07.001
Mazza, F. (2015). Seismic vulnerability and retrofitting by damped braces of fire-damaged r.c. framed buildings. Eng. Struct. 101, 179–192. doi: 10.1016/j.engstruct.2015.07.027
Mazza, F., and Alesina, F. (2019). Fragility analysis of R.C. seismically-isolated structures with residual mechanical properties after fire exposure. Soil Dyn. Earthq. Eng. 121, 383–398. doi: 10.1016/j.soildyn.2019.03.020
Mazza, F., and Mazza, M. (2010). Nonlinear analysis of spatial framed structures by a lumped plasticity model based on the Haar-Kàrmàn principle. Comput. Mech. 45, 647–664. doi: 10.1007/s00466-010-0478-0
Mazza, F., Mazza, M., and Vulcano, A. (2015). Displacement-based seismic design of hysteretic damped braces for retrofitting in-elevation irregular r.c. framed structures. Soil Dyn. Earthq. Eng. 69, 115–124. doi: 10.1016/j.soildyn.2014.10.029
Mazza, F., and Vulcano, A. (2014a). Equivalent viscous damping for displacement-based seismic design of hysteretic damped braces for retrofitting framed buildings. Bull. Earthq. Eng. 12, 2797–2819. doi: 10.1007/s10518-014-9601-5
Mazza, F., and Vulcano, A. (2014b). Design of hysteretic damped braces to improve the seismic performance of steel and r.c. framed structures. Ingegneria Sismica 31, 5–16.
Seismoartif (2018). Seismosoft, Earthquake Engineering Software Solutions. Available online at: www.seismosoft.com/seismoartif
Slowanski, L., Grabowski, J., and Kosiorek, M. (1971). The influence of temperature on mechanical properties of reinforcing steel 34GS. Inẑynieria i Budownictwo 4, 157–161.
Sorace, S., and Terenzi, G. (2014). Motion control-based seismic retrofit solutions for a R/C school building designed with earlier Technical Standards. Bull. Earthq. Eng. 12, 2723–2744. doi: 10.1007/s10518-014-9616-y
Keywords: r.c. school buildings, fire damage, duration of heating and cooling phases, hysteretic damped braces, thermal analysis, seismic retrofitting, non-linear seismic analysis
Citation: Mazza F and Imbrogno G (2019) Effects of Fire Duration on the Seismic Retrofitting With Hysteretic Damped Braces of r.c. School Buildings. Front. Built Environ. 5:141. doi: 10.3389/fbuil.2019.00141
Received: 13 August 2019; Accepted: 11 November 2019;
Published: 03 December 2019.
Edited by:
Panagiotis Mergos, City University of London, United KingdomReviewed by:
Ehsan Noroozinejad Farsangi, Graduate University of Advanced Technology, IranChrysanthos Maraveas, University of Liège, Belgium
Emanuele Brunesi, Fondazione Eucentre, Italy
Gloria Terenzi, University of Florence, Italy
Copyright © 2019 Mazza and Imbrogno. This is an open-access article distributed under the terms of the Creative Commons Attribution License (CC BY). The use, distribution or reproduction in other forums is permitted, provided the original author(s) and the copyright owner(s) are credited and that the original publication in this journal is cited, in accordance with accepted academic practice. No use, distribution or reproduction is permitted which does not comply with these terms.
*Correspondence: Fabio Mazza, ZmFiaW8ubWF6emFAdW5pY2FsLml0