 Khandakar M. Rashid
 Joseph Louis
- School of Civil and Construction Engineering, Oregon State University, Corvallis, OR, United States
Real-time monitoring and assessment of construction resources have always been a challenge due to the unique, dynamic, and complex nature of each construction site and operation. The ability to automatically classify activities performed by various equipment in real time can aid in making timely tactical operational decisions that can lead to increased fleet productivity, reduced time and cost of operations, and minimized idle times. Such endeavors have traditionally been performed manually through human observation, making it extremely labor and time-intensive. Meanwhile, the development of low-cost micro-electro-mechanical systems (MEMS) with rapidly evolving computing, networking, and storage capabilities, along with the advances in computational techniques such as machine learning present new opportunities in the real-time activity identification domain. Even though previous studies have shown promising results for equipment activity identification at limited levels of detail, they have a fundamental limitation in their reliance on the equipment vibration. Equipment vibration is highly dependent on factors that are extrinsic to the performance of an activity itself such as ground conditions, age and condition of equipment, and operator skill. This aspect of current methods necessitates the collection of training data from the specific equipment of interest and requires manual labeling of training data, thereby limiting its application across different types of equipment and operating conditions. This paper investigates the use of activity-specific equipment motions instead of vibration for activity identification. This approach is the first step toward the larger goal of generating training data automatically from virtual kinematic models of equipment in the future. This paper also provides an array of sensitivity analyses in order to determine the most appropriate parameters for implementing machine learning algorithms for equipment activity identification. A case study was performed using an excavator working on an earthmoving site that demonstrated a significant improvement in equipment activity identification results by utilizing inertial measurement unit (IMU) data of different articulated elements over previous efforts. The results of this paper indicate that more accurate results for activity identification can be obtained by using articulated equipment motion over vibration, which paves the way for the automatic generation of labeled training data in the future.
Introduction
The effective use of equipment fleets is one of the key factors in the success of construction projects, alongside other aspects such as the use of labor, material, an project management (Zou and Kim, 2007). Toward this end, the cyclical process of monitoring, benchmarking, and optimizing the time spent by each equipment on various construction activities plays a vital role in improving construction productivity (Golparvar-Fard et al., 2013). Academic literature is rife with the benefits that can accrue through the continuous assessment of equipment's activity on the worksite, which include minimized idle times and improved operational efficiency (Su and Liu, 2007; Zhai et al., 2009; Gong et al., 2011; Goodrum et al., 2011); reduced time and cost on projects (Zou and Kim, 2007); and reduction of emissions and fuel use (Lewis et al., 2011). Systematic analysis of equipment can also improve equipment health and provide a safer environment for both equipment operators and workers (Golparvar-Fard et al., 2013). Accordingly, there have been numerous research efforts that have sought to utilize a variety of means to identify activities or states of the equipment on jobsite and their associated durations.
Automated activity identification of construction equipment enables real-time applications including, but not limited to, real-time productivity monitoring (Ahn et al., 2015; Louis and Dunston, 2016b; Kim H. et al., 2018), real-time safety analysis (Carbonari et al., 2011; Cheng and Teizer, 2013; Rashid et al., 2017; Rashid and Behzadan, 2018), real-time routing of resources (Louis and Dunston, 2016a), and real-time AR/VR visualization (Ku et al., 2011; Dong and Kamat, 2013; Park et al., 2014; You et al., 2018). Offline applications enabled by automated activity identification include preparing dynamic simulation input (Akhavian and Behzadan, 2013; Vahdatikhaki and Hammad, 2014), automated cycle time analysis (Vahdatikhaki and Hammad, 2014; Mathur et al., 2015; Kim H. et al., 2018), operation analysis (Vahdatikhaki and Hammad, 2014; Akhavian and Behzadan, 2015), and fuel use analysis (Lewis et al., 2011) etc. Despite all these benefits enabled by activity identification and analysis, this has historically been a manual effort that is typified by a designated human worker using a stopwatch to perform time-studies of equipment activities by observing the equipment's actions for the entire duration of its operation. Such an approach has several shortcomings including its prohibitive cost, excessive time requirements, and susceptibility to human errors and subjectivity (Heydarian et al., 2012). Thus, there is a real need for a low-cost, reliable, and automated method for equipment activity identification that can be implemented across all construction projects.
Toward that goal, past efforts have adopted different activity identification methods based on technologies such as computer vision, real-time location systems (RTLS), and inertial measurement units (IMU). The field of activity identification for construction equipment emerged with application of various RTLS in identifying operations performed by construction equipment (Su and Liu, 2007; Song and Eldin, 2012; Wang et al., 2012; Teizer et al., 2008). This approach of using RTLS in activity identification poses challenges in identifying the stationary activities, such as loading, swinging arm etc. In order to overcome this issue, several studies focused on using IMU sensors attached to the equipment cabin (Ahn et al., 2015; Akhavian and Behzadan, 2015; Mathur et al., 2015; Kim H. et al., 2018) to collect data regarding about equipment vibration for activity classification with a very satisfactory level of performance. Moreover, the use of a single IMU inside the cabin is a practical implementation for enabling activity identification because the sensors are not subject to environmental and site conditions outside the cabin, and can work for even older models of construction equipment which do not have pre-installed sensors.
Despite the successful performance of these previous efforts and their practicality of implementation, the authors identify a fundamental limitation in its application, which serves as the motivation for this paper. Previous efforts that attach sensors to the equipment cabin rely on analyzing data that is produced by the general vibration of the equipment in the cabin while performing activities. While this vibration can be used to determine the activities being performed as shown by previous studies, it does not result in identification models that can be re-used for different machines and even for the same machine under different site conditions. Doing so to maintain the level of performance would require collecting and further manually labeling of a new set of training data under the new conditions. This is because the vibration of the cabin is influenced by ground condition (i.e., different ground condition influences the vibration of the cabin), equipment quality (e.g., engine condition, suspension quality etc.), and operator skill: all of which are factors that are extrinsic to the activity being performed itself.
In order to overcome this limitation, this research takes a new approach to activity identification by focusing on the unique motion patterns that are generated by the articulated elements of the equipment, rather than on just the vibration of the cabin itself. It is posited in this research that different machines of the same type would still have the same motion patterns for various activities even when performing under different site conditions, enabling such an approach to be more generalizable. It is also anticipated that using the motion patterns of equipment can lead to the generation of training data for articulated equipment from kinematic models of the construction equipment (such as those used in Kamat and Martinez, 2005; Louis et al., n.d.), which would obviate the need for manual data labeling in the future. It is thus hypothesized in this paper that analyzing the motion of different articulated parts of the equipment enables the identification of higher level of details (LoD) activities with high fidelity.
Considering the importance of a low-cost, reliable, and automated activity identification framework for construction equipment and the limitations of previous efforts, this paper focuses on enabling accurate and reliable real-time identification of a higher number of activities (compared to previous studies) performed by construction equipment using motion data (expressed in terms of linear and angular acceleration) captured from different moving parts of the equipment. Moreover, this study conducts several sensitivity analysis to find out best combination of hardware (e.g., sensor placement), and analytical parameters (e.g., classifier type, window size etc.) for different application types (i.e., real-time, near real-time, offline).
The state-of-the-art in construction equipment activity identification studies are first reviewed to provide the context for this research, and to identify current challenges and limitations in this domain. These limitations inform the formulation of the research goal, objectives, and development of methodology in this paper. The proposed methodology is validated using field data collected from an excavator on an earthmoving site. The results are discussed and summarized for different types of application of equipment activity identification. Finally, the anticipated contributions to knowledge and practice, along with research limitations, and future directions are presented.
Background and Related Work
Construction site monitoring and operational analysis is an important contributor to overall project success, but has traditionally been a labor-intensive manual process. These manual approaches have been noted to adversely affect the quality of the analysis (Carbonari et al., 2011), minimize opportunities for continuous long-term monitoring (Cheng and Teizer, 2013), and result in subjective reports that together hinders proactive and informed decision making. Due to the aforementioned disadvantages, several research efforts have focused on developing techniques to automatically monitoring activity on the construction site.
Activity identification has been a major research focus in several industries such as surveillance and security systems, healthcare monitoring, home and work automation, human computer interaction, and context-aware behavior analysis (Lockhart et al., 2012; Ann and Theng, 2014; Ranasinghe et al., 2016). As opposed to the aforementioned applications where most studies target human activity identification (HAR), researchers in the construction engineering and management domain (CEM) have applied similar approaches to recognize, track, and identify activities performed by construction resources (both human workers and mechanical equipment).
Based on primary type of sensor used, these research efforts are broadly categorized into vision-based and sensor-based activity identification. In the latter category, researchers have explored both RTLS (e.g., GPS, UWB) and/or motion sensors (e.g., IMUs) for data collection. After the raw data are obtained, they are processed and analyzed using a variety of analytical methods (e.g., linear classifiers, support vector machines, decision trees, random forests, neural networks, nearest neighbors, etc.) to obtain the desired performance. It can be observed that previous efforts have explored applications of equipment activity identification for cycle time measurement, real-time activity control, and modeling dynamic simulation input. Also, various analytical methods such as statistical methods (i.e., Bayesian learning), distance algorithms (i.e., K-nearest neighbor), decision tree, neural networks (i.e., artificial neural network), and rule-based algorithms (i.e., Markov model) have been applied. A more detailed examination of these activity identification efforts is now provided in the following sub-sections.
Vision-Based Activity Identification
Many previous efforts have adopted vision based techniques to identify the activities of construction equipment. Zou and Kim (2007) used image processing to quantify the idle-times of hydraulic excavators by identifying only two states of the excavator: idle and busy. Rezazadeh Azar and McCabe (2012) proposed an activity identification framework using rational events to recognize dirt-loading activities of an excavator. Bao et al. (2016) investigated the use of long-sequence videos to automatically detect, track, and identify activities of an excavator and a dump truck. In a similar effort, excavator and dump trucks were also used to measure the performance of earthmoving operations utilizing image frame sequences (Kim J. et al., 2018). The concept of bag-of-video-feature-words model was extended using unsupervised classifiers into construction domain to learn and classify labor and equipment activities (Gong et al., 2011).
Vision-based techniques have shown promising results in tracking construction resources and identifying their operations. However, these techniques provide very limited information based on the field of view of the cameras used. It is a challenging to maintain a direct line of sight to targeted resources due to high level of noise (e.g., entity overlap, moving backgrounds, varying light conditions etc.) on dynamic construction sites. These challenges can be overcome by adopting motion sensors which are not thus constrained.
RTLS and/or IMU-Based Activity Identification
As opposed to vision-based methods, sensor-based approaches for activity identification leverage the location of the equipment and/or the motions of different parts of the equipment to identify its activity. Vahdatikhaki and Hammad (2014) proposed a multi-step data processing framework combining location and motion data to improve the accuracy of the localization to enhance the performance of equipment state-identification. Song and Eldin (2012) developed an adaptive real-time tracking of equipment operation based on their location to improve the accuracy of project look-ahead scheduling. Su and Liu (2007) presented a framework which used dynamic geometric data of resources and extracted construction operational data from them. In another effort, Wang et al. (2012) proposed an automated methodology for tracking earthmoving operations in near real-time by attaching low-cost RFID tags to hauling units (trucks) and attaching fixed RFID readers to designated gates of projects' dump areas. Remote tracking technology was also used to develop 3D animation of the equipment, and extracting equipment operations from the animation (Akhavian and Behzadan, 2012). Teizer et al. (2008) explored the feasibility of ultra-wide band (UWB) technology for real-time tracking and monitoring of resources.
Although location-based operation tracking can identify the state and operation of construction equipment at a coarse level (e.g., idle and busy states), it is incapable of classifying the activities performed by equipment when it is stationary. Such limitations of location-based operation tracking inspired researchers to explore the feasibility of both independent (Ahn et al., 2015) and smartphone embedded (Akhavian and Behzadan, 2015; Mathur et al., 2015) IMUs for automated equipment activity identification. Ahn et al. (2015) used a low-cost accelerometer mounted inside the cabin of an excavator to collect operational data of an earthmoving worksite. Several classifiers were tested to classify three different states (i.e., engine-off, idle, and busy) of an excavator. Mathur et al. (2015) utilized smartphone-embedded accelerometer by mounting it inside an excavator cabin to measure various activity modes (e.g., wheel base motion, cabin rotation, and arm movement) as well as duty cycles. Akhavian and Behzadan (2015) adopted a similar approach by attaching a smartphone to the cabin of a front-end loader to collect accelerometer and gyroscope data during an earthmoving operation, upon which several machine learning algorithms (i.e., ANN, DT, KNN, LR, SVM) were tested. Their study also investigated the impact of different technical parameters such as level of details, and selection of features on the performance of different classification algorithms. The same approach and technical parameters were further extended for construction workers (Akhavian et al., 2015).
Research Gaps and Point of Departure
Sensor-based activity identification frameworks have shown promising results to overcome some of the limitations of vision-based approaches. However, some challenges still remains unsolved, as described below.
RTLS-based operation tracking is incapable in identifying stationary activities of the equipment (e.g., loading, swinging for an excavator). In case of IMU-based approaches, the level of details (LoD) of activities has been limited due to prior efforts only attaching sensors to the cabin of the equipment and not leveraging the unique motions of individual moving articulated parts of the equipment (Ahn et al., 2015; Akhavian and Behzadan, 2015; Mathur et al., 2015). For example, Ahn et al. (2015) implemented classification algorithms for two classes (i.e., idle and busy) of an excavator. Extending this work, Mathur et al. (2015) classified excavators operation into 4 different classes (LoD4) to estimate duty cycle of the excavator. Akhavian and Behzadan (2015) investigated performances of different classification algorithms for up to 5 different activities for a front-end loader based on vibrations of the cabin. In these studies the vibration of the cabin can be used to determine the activities being performed, but it does not result in models that can be re-used efficiently for different piece of equipment and even for the same equipment under different site conditions. Doing so would require collecting and further manually labeling of a new set of training data under the new conditions. This is because the vibration of the cabin is influenced by ground condition (i.e., different ground condition influences the vibration of the cabin), equipment quality (e.g., engine condition, suspension quality etc.), and operator skill: all of which are factors that are extrinsic to the activity being performed itself.
Based on the above gaps in knowledge, the goal of this research is to develop a real-time, low-cost, and reliable activity identification framework for construction equipment utilizing individual motions of their articulated structural parts. This paper achieves that goal undertaking the following objectives that address the aforementioned gaps in literature:
(1) Assess the performance of activity identification using motion data (i.e., linear and angular acceleration) from articulated structural parts of the equipment.
(2) Determine suitability of using motion data for activity identification by comparing results to other studies in literature.
(3) Generalize the selection of parameters for activity identification models based on target application by performing sensitivity analyses.
The next section describes the methodology developed to accomplish these research objectives.
Methodology
In this study, motion (i.e., linear and angular acceleration) of different articulated structural parts of the equipment are leveraged to identify their operational activities. The overall methodology of this study is illustrated in Figure 1.
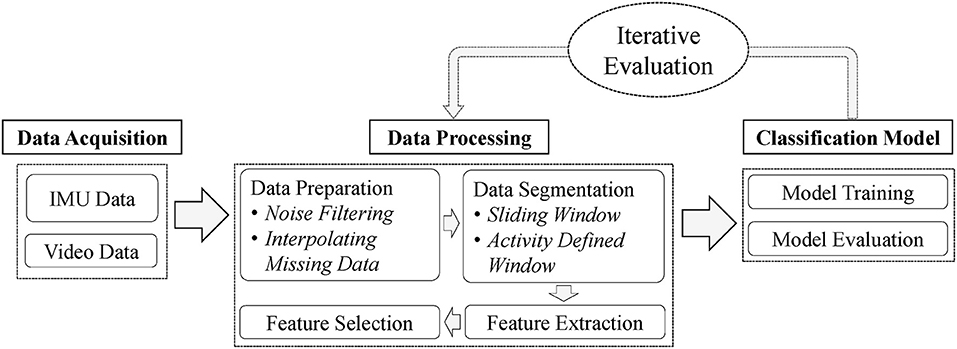
Figure 1. Framework for equipment activity identification.
As shown in Figure 1, there are three primary phases in the developed framework including data acquisition, data processing, and classification model. The data acquisition process consists of capturing two different types of sensor data; IMU data for analysis, and video data for labeling and validation. In the data processing phase, noises, and inconsistencies of the data were eliminated. The video was used as a reference for labeling the time-stamped sensor data for validating the developed methodology. The IMU data were further processed and used to train and evaluate the classification model. Following sub-sections discusses each of the methodological steps in details.
Data Acquisition
This study uses multiple low-cost IMUs mounted with 3-axis accelerometer and 3-axis gyroscope to collect linear and angular acceleration data. The primary reason for using multiple IMUs is to explore the feasibility of utilizing motion of articulated equipment to identify its activities. Moreover, equipment manufacturers and third party companies already use IMUs in their equipment to locate the cutting edge for automated machine guidance (AMG) and automated machine control (AMC) purposes. The use of multiple IMUs in articulated implements in this paper mimics the placement of those sensors so that the developed framework can be extended toward activity identification in practice. Additionally, the operation of the equipment is captured on video for data labeling and to validate the results.
The IMUs used in this research are equipped with a microSD card for logging data and requires 3.7 volt 1000 mAmp battery as shown in Figure 2A. The IMUs were placed in a robust plastic box stuffed with Styrofoam material to prevent movement and to withstand vibration and any impact from the debris. A powerful magnet at the bottom of the each box made sure the reliable placement of the IMUs on the metallic surface of the equipment. Figure 2B shows the IMU placed inside the magnetic box and Figure 2C shows the complete box ready to be attached to the excavator. Six sensor readings (accelerometer x, y, z, and gyroscope x, y, z) were collected from each of the IMU.
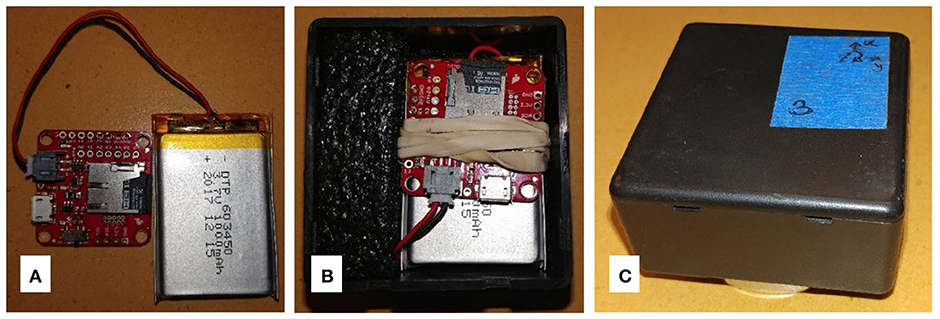
Figure 2. Setup of the IMU and the protective box, IMU with battery and micro SD card (A), IMU system placed on magnetic box (B), protective box with number and axes tag (C).
Data Processing
After collecting the raw data from sensors, several data processing techniques were applied to prepare the raw data to be used in the machine learning algorithms. Four main steps in the data processing are, data preprocessing (to remove noise and inconsistency from raw data), data segmentation, feature extraction, and feature selection. Each of these steps are discussed in the following sub-sections.
Data Preparation
After collecting the raw data from the sensors, it was prepared to ensure its usability for further analysis. Unlike smartphone-embedded IMUs, MEMS sensors generally do not contain any embedded noise reduction algorithm. Therefore, the raw data collected from the IMUs needed to be filtered first to remove any noise and inconsistency using the following methods. The choice for not using smartphone-embedded sensors in this research was due to the fact that the sensors would be mounted externally on the various implements of the equipment rather than being housed inside the cabin.
Noise filtering
Data collected from the IMUs can have noises due to various reasons, such as fabrication misalignment, static bias, and random noises (Nirmal et al., 2016). A noise reduction filter named Median filter was applied to reduce the noise of the IMUs. Figure 3 shows the raw accelerometer X data of IMU#1 with dashed blue lines and smoothed filtered data (obtained after filtering) with solid orange lines.
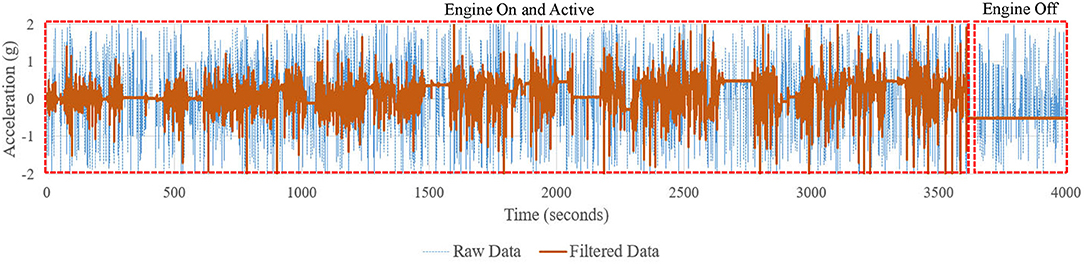
Figure 3. Raw and filtered IMU data.
For purposes of illustrating the need for data processing, the last section in this figure represents the data corresponding to the Engine Off state. For Engine Off state, the accelerometer data is expected to be a flat line, as there is no vibration on the equipment while the engine is off. Nevertheless, we see spikes in the data, which is essentially due to noise in the IMU. Median filtering is often applied to smooth this type of noise (Gather and Fried, 2002). The solid line in Figure 3 shows filtered data and the reduced noise for Engine Off data are now as expected.
Interpolating missing data
The next phase of data processing eliminates any inconsistencies associated with the IMU's frequency of collecting data. The IMU used in this study is capable of recording 80 data points per second which implies a sampling frequency of 80 Hz. However, the IMU can fail to maintain an uniform data logging frequency throughout the whole time due to unexpected hardware failures, communication conflicts between micro-electro-mechanical (MEM) components, and environmental impact (Xu et al., 2017). Thus, the collected data were processed into continuous uniform time series by removing redundant data and linearly interpolating the missing values.
Data Segmentation
Collecting raw data at 80 Hz results in a significantly large dataset that is computationally inefficient to handle. Moreover, while a single data point represents the position of a moving object at a single point of time, equipment activities consist of sequential motions distributed over a period of time (e.g., the load activity does not happen instantaneously but as over a period of time). For these reasons, data streams consisting of individual data points need to be segmented into data windows for processing. In this context, a window refers to a set of consecutive time series data points. Several state-of-the-art data techniques have been implemented in activity identification domain and are briefly explained here.
In this study, sliding window (SW), and activity defined (AD) window segmentation techniques were implemented. For SW, fixed sized windows with 50% overlapping are considered since overlapping is useful when there are transition between activities (Su et al., 2014). Several window sizes (1–5 s) were selected to investigate the effect of window sizes on classifier's performance.
For AD windowing techniques, a manual approach is adopted. Since the data are labeled using the video sequences as reference, the initial and end times of each activity can be readily obtained after visual observation. Due to the manual requirement of data labeling, AD windowing is not suitable for real-time applications. However, since it still applies toward non real-time applications, this study investigates the effect of AD windowing in the performance of different machine learning classifiers.
It should be mentioned here that implementation of AD windowing was possible in this study as both training and testing data were previously labeled. In practice, the start and end point of each activity has to be first identified in order to use AD windowing technique. Several methods have been proposed to automatically identify activity-transition points for both labeling and classification purpose (Sekine et al., 2000; Yoshizawa et al., 2013). However, no such method was applied in this study due to the availability of already labeled dataset. Moreover, as AD windowing only works when the end point of a certain activity is reached, it is limited to only near real-time or offline applications, rather than online applications.
Feature Extraction
After segmenting the time series data into windows, a set of time-domain statistical features, also called feature vectors, were extracted. This step is necessary as these feature vectors represent the pattern of the signal in the corresponding window. Time-domain features selected for this study are based on the findings and recommendations of past research in HAR (Shoaib et al., 2015). Twelve specific statistical features were extracted from each window: mean, maximum, minimum, standard deviation, mean absolute deviation, interquartile range, skewness, kurtosis, and fourth order autoregressive coefficients. As there are 6 readings (accelerometer x, y, z, and gyroscope x, y, z) per sensor, total 72 features (6 sensor readings × 12 statistical features per each reading) were extracted from each sensor.
Feature Selection
The next step of data preparation is to extract useful features that yield distinctive patterns in the data set. It must be noted that some features may not be useful as they do not contain value-adding information and thus can be discarded for further analysis. The main objective of this step is to select the most relevant and useful features that can be used to find any predefined patterns in the signal (Nath et al., 2018). A commonly used feature selection algorithm named Relief algorithm was applied to the dataset to identify the most distinguishable features. Relief is a feature selection algorithm that assigns weights to the features and ranks them according to how well their values distinguish between neighboring instances of same and different classes (Yu and Liu, 2003). All the features were ranked according to their relevance after applying this algorithm. This study explores the performance of classifiers based on different number of feature subsets.
To summarize the data processing step, collected data from the IMUs were first filtered and interpolated to account for any mechanical noise and inconsistency in the raw data. Then, data were segmented using two segmentation techniques and statistical features were extracted to represent the signal pattern in the corresponding windows. Finally, useful features that yielded distinctive patterns in the dataset were identified using Relief algorithm. At this stage, the data are ready to use for training the classification model. The following section discusses the model training and evaluation steps of the methodology.
Classification Model Training and Evaluation
Although activity identification frameworks are developed using both supervised and unsupervised techniques, supervised learning algorithms provide better performance for equipment activity identification (Golparvar-Fard et al., 2013). The choice of the supervised learning algorithm depends on the characteristics and the volume of data. As a result, there is no single best classifier and each algorithm should be separately evaluated. Therefore, a number of classifier algorithms were trained and tested in this study to compare their performance in classifying activities using IMU data. Based on the most commonly used supervised classifiers in construction resource activity identification (both human and equipment) in previous studies, four supervised machine learning methods were selected for analysis: (1) Decision Tree (DT), (2) K-Nearest Neighbor (KNN), (3) Artificial Neural Network (ANN), and (4) Support Vector Machine (SVM). The reason for using multiple classifiers is to reduce the uncertainty of results related to classification algorithms, each of which was evaluated using the overall accuracy of the model. Next, a case study was undertaken to validate aforementioned methodology explained in the following section.
Case Study
A Komatsu PC 300 LC excavator with a 2.6 cubic yard bucket capacity and 38.5 ft. maximum ground reach was selected for this study. The primary reason behind selecting an excavator is that it is one of the most dynamic equipment with a high degree of freedom (compared to a other equipment like loaders and dozers) resulting in a higher level of details of possible distinguishable activities (such as scoop, swing, ground leveling, etc.). A construction site in the city of Corvallis, Oregon was selected as the primary data collection site. The excavator was used to load trucks with cut material from the construction site that needed to be hauled to an offsite dumping location. Figure 4 shows the earthmoving operation wherein the excavator performs a cycle of digging, swinging loaded, dumping, and swinging empty. Apart from these four activities, the excavator also moved from one point to the next on the construction site.
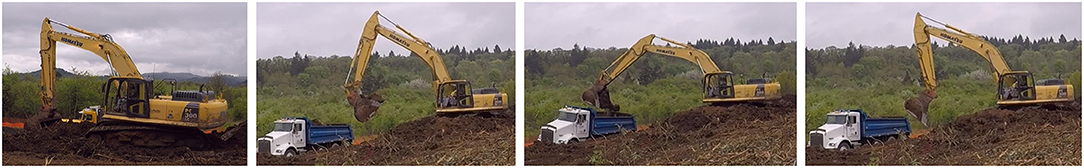
Figure 4. Typical excavator operation for earthmoving (starting from the left, digging, swinging loaded, dumping, and swinging empty).
As shown in Figure 5, IMU#1 was attached to the bucket, IMU#2 and IMU#3 were attached to the stick and boom, respectively. The whole earthmoving operation is recorded with three IMUs attached to the equipment. After the operation was finished for that day and the engine was turned off, IMUs were still attached to the equipment for collecting the data corresponding Engine Off state of the equipment. All IMUs logged the accelerometer and gyroscope data in the microSD cards. The excavator's working was videotaped for the duration of data collection using a camera from a static position. More than 1 h of continuous data were recorded using the IMUs. Considering an average 80 Hz data capture frequency of the IMU, the total number of data points recorded were 288,000 (3,600 s × 80 data points per second). After collecting the data from IMUs, the raw data was preprocessed for further analysis.
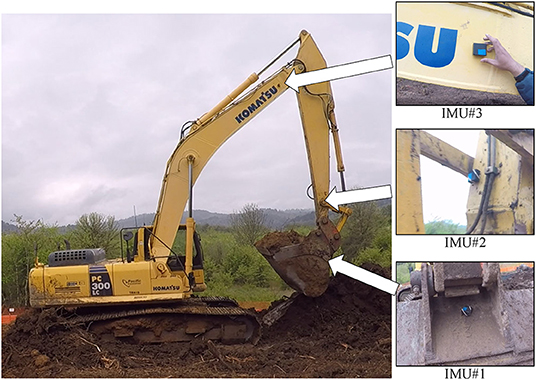
Figure 5. Location of IMUs on excavator.
Dividing the operation of the equipment into a set of the smallest distinguishable activities (i.e., classes) is an important aspect activity classification. The resolution of the classes (number of separate activities), herein referred to as level of details (LoD) and this factor depends upon the type of equipment, its operation, and the desired application of the analysis (Akhavian et al., 2015). In this study, 5 different LoDs (LoD2, LoD4, LoD5, LoD7, and LoD9) are used to explore the performance of the classifiers for different resolutions. Figure 6 depicts the hierarchy of activities that was performed by the excavator.
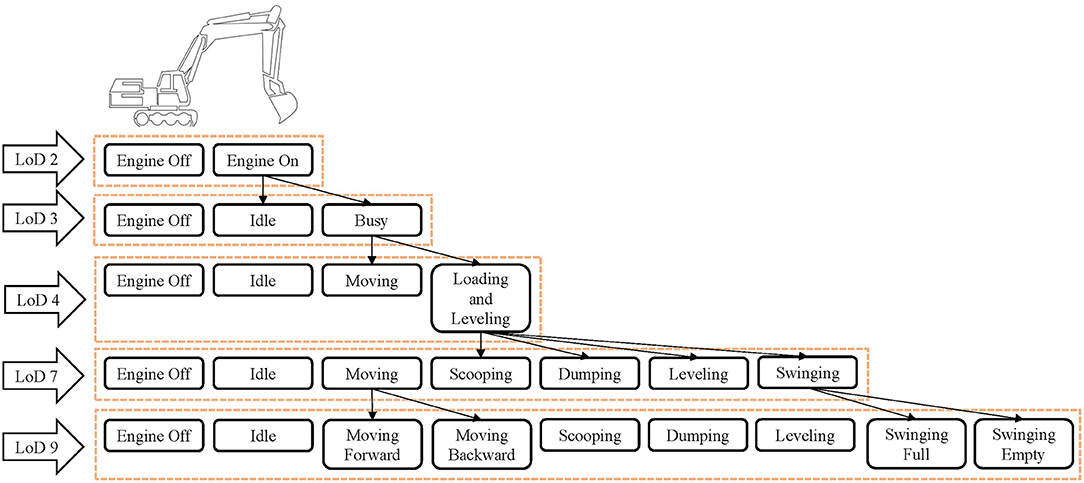
Figure 6. LoD in activity breakdown of an excavator.
In the coarsest breakdown (LoD2), 2 classes are defined: Engine Off and Engine On. In the next level, Engine On activity is further divided into 2 more activities: Idle and Busy. This process is continued and the finest breakdown (LoD9) contains 9 classes: Engine Off, Idle, Moving Forward, Moving Backward, Scooping, Dumping, Leveling, Swinging Full, and Swinging Empty. It must be noted that, Figure 6 is only the example case and the number of classes may vary based on the type of equipment and its application. Table 1 shows the number of instances each activity happened, their average duration, and total duration during the time period for which data was collected on the site.
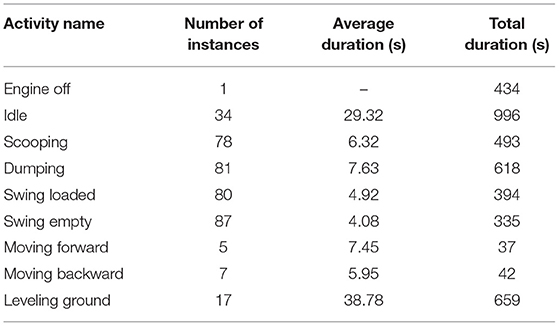
Table 1. Number of instances of each activity with duration for LoD9.
Although higher number of LoD is usually desired, dividing the activities into higher resolutions poses a challenge. For higher LoDs, the signal patterns of different classes become more similar to each other as the number of classes increase. Moreover, in couple of instances the excavator performed some activities which do not fall into any LoD defined in this study, such as breaking a big chunk of soil, shaking the bucket to get rid of residual soil etc. These activities are labeled as undefined, and as happened only a handful of times, are excluded from the analysis. Future work will develop methods to handle these instances of on-off activities.
Result and Discussion
This research conducted several sensitivity analysis in order to find a set of recommendations for selecting appropriate machine learning algorithms, related parameters (such as type of segmentation, window size, classifiers etc.) and hardware related parameters (such as sensor placement and combination) for construction equipment activity identification. Figure 7 depicts the overall process of the sensitivity analyses performed in this study.
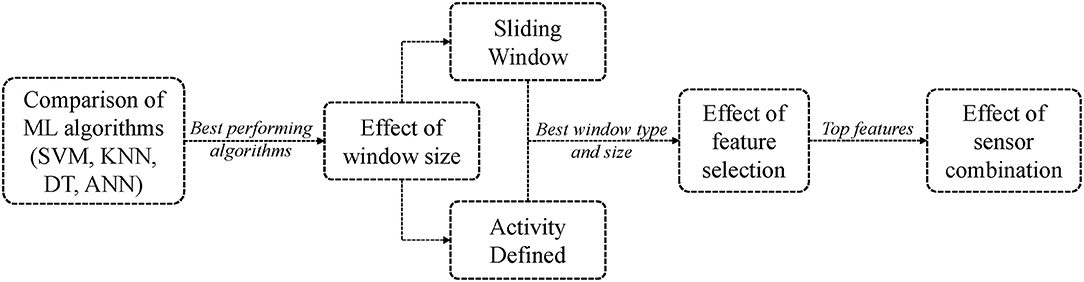
Figure 7. Overall process to develop recommendations for state identification.
As shown in Figure 7, a comparative analysis was first conducted to determine the best algorithms for a predefined set of parameters. Next, several sensitivity analyses were performed by using different segmentation techniques (i.e., sliding window and activity defined window) and varying the window sizes. Then, a feature selection technique was applied to determine the effect of number of features on the performance of different algorithms. The placement of IMUs was also investigated to explore the relative importance of different parts of the equipment in terms of representing the overall operational activity performed by the equipment.
Preliminary Evaluation: Comparison Among DT, SVM, KNN, and ANN
The four most commonly used supervised classification algorithms for activity identification in the construction domain were used in this study. They are decision tree (DT), K-nearest neighbor (KNN), artificial neural network (ANN), and support vector machine (SVM). Different parameters of each algorithms were selected to examine the parameters for corresponding algorithms that result in the best performance. Based on previous research, sliding window technique was used initially, with 2 s window size and 50% window overlapping. Table 2 summarizes all four algorithms with 3 different parameters and their associated accuracy for LoD9.
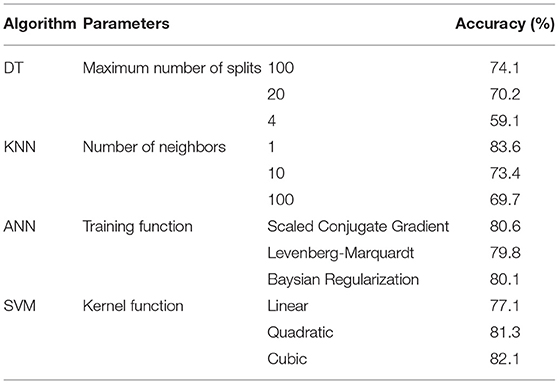
Table 2. Accuracy of different ML algorithms with different parameters.
As shown in Tables 2, 3 different number of splits (100, 20, and 1), and number of neighbors (100, 10, and 1) were selected for DT and KNN, respectively. For ANN, scaled conjugate gradient, Levenberg-Marquardt, and Baysian regularization were used as training function. Linear, quadratic, and cubic kernel function were tested for SVM. From Table 2, we can see that KNN with 1 neighbor performs best and DT with 4 maximum number of split performs worst for the primary evaluation. Maximum accuracy for KNN, ANN, and SVM are more than 80% while DT performed at 74.1%. So, KNN with 1 neighbor, ANN with scaled conjugate gradient training function, and SVM with cubic kernel function were selected for further sensitivity analysis. These sensitivity analyses include evaluation of the classifiers using different segmentation techniques, window sizes, feature subsets, and sensor placements.
Effect of Window Size
In this section, a sensitivity analysis was performed to observe the effect of different window sizes using sliding window (SW) segmentation technique. Five different window sizes (1–5 s) were tested. Their results are shown in Figure 8. Table 3 summarizes the maximum accuracies of each classifier for all LoDs and their associated window sizes.
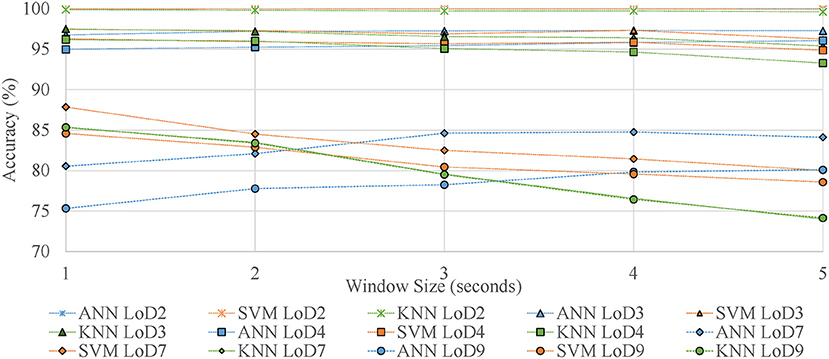
Figure 8. Accuracy of classifiers with different window sizes.
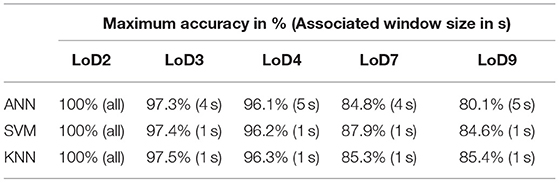
Table 3. Maximum accuracy of each classifiers with associated window size.
It can be seen from Figure 8 and Table 3 that the accuracy of all three classifiers are highest for LoD2 and lowest for LoD9 for all 5 window sizes. Moreover, Figure 8 shows that for all LoD, SVM and KNN performs best when window size is 1 s. If window size is increased, accuracy of SVM and KNN decreases. For example, for LoD9, KNN results in 85.4% accuracy for 1 s window size, and 74.2% for 5 s window size. However, ANN performs differently than SVM and KNN. We can observe that ANN accuracy generally increases with window size. For example, for LoD9, ANN accuracy is 75.3% with a 1 s window size, 80.1% for window size of 5 s. From this phase of data analysis, it is concluded that KNN and SVM performs best with a 1 s sliding window size, while the performance of ANN varies with different window sizes. Another segmentation technique [activity defined (AD) segmentation] is adopted in the next phase and a comparative analysis (SW vs. AD segmentation) is performed between two segmentation techniques.
Sliding Window (SW) vs. Activity Defined (AD) Window Segmentation
This section discusses the performance of ANN, KNN, and SVM after introducing activity defined (AD) segmentation techniques. This study explores the potential of AD segmentation to train the classifiers. The maximum accuracies found from the previous phase using SW segmentation are used to compare them with AD segmentation and shown in Table 4.
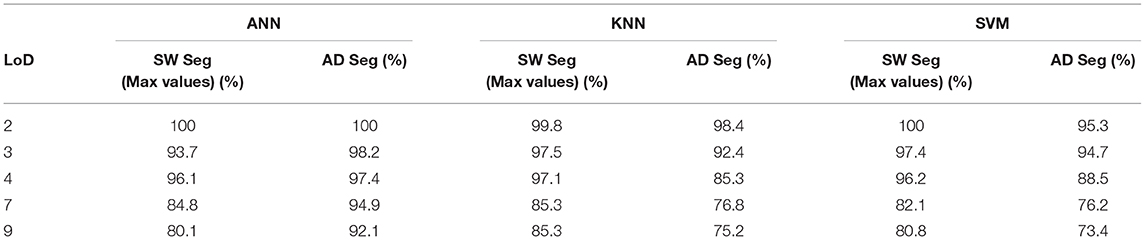
Table 4. Comparative analysis between SW and AD segmentation using all three classifiers.
Table 4 shows that ANN performs better with AD than SW for all LoDs. For example, for LoD9, maximum accuracy of ANN is 80.1% using SW, and increased to 92.1% using AD segmentation. On the other hand, the performance of KNN and SVM decreases when AD segmentation is implemented. KNN performs at 85.3% accuracy for SW which drops down to 75.2% while AD is used. Similarly, the accuracy of SVM decreases from 80.87 to 73.49% using AD segmentation. For overall maximum accuracy of all three classifiers, we see that ANN with AD segmentation performs best for all LoDs. For example, maximum accuracy for LoD9 using AD is 92.1% for ANN, while KNN and SVM performs at maximum 85.34%, and 80.87% accuracy, respectively, using SW.
Thus, it can be summarized from this section that ANN performs best with AD segmentation, while KNN and SVM performs best with SW segmentation with a 1 s window size. Even though AD segmentation produces maximum accuracy overall, it has some inherent limitations. Implementation of AD segmentation in the field requires the identification of activity-transitions in order to accurately find start and end point of each activity. An additional algorithm is needed to automate this process, thereby increasing the computational requirement. Moreover, AD segmentation cannot be applied unless an activity has ended and therefore cannot be used for real-time classification. However, this combination of ANN and AD segmentation along with an automated activity-transition identification algorithm can be applied to near real-time or offline applications (e.g., near real-time simulation updating, cycle time analysis, emission analysis etc.).
On the other hand, SVM and KNN performs best using SW segmentation. As this technique uses a fixed window size (1 s worked best in this study) which can slide over the continuous data stream, these combinations (SVM/KNN with SW segmentation) can be implemented for real-time applications such as real-time monitoring, safety warnings, and AR/VR applications.
Effect of Feature Selection
In this phase, a sensitivity analysis is performed using different subsets of the feature vector (e.g., mean, median, etc.). All features may not be relevant and useful for classification. The best segmentation technique for corresponding classifiers are selected (i.e., AD for ANN, SW for KNN and SVM) in this step. Figure 9 summarizes the accuracy of ANN, KNN, and SVM with various feature subset for LoD9.
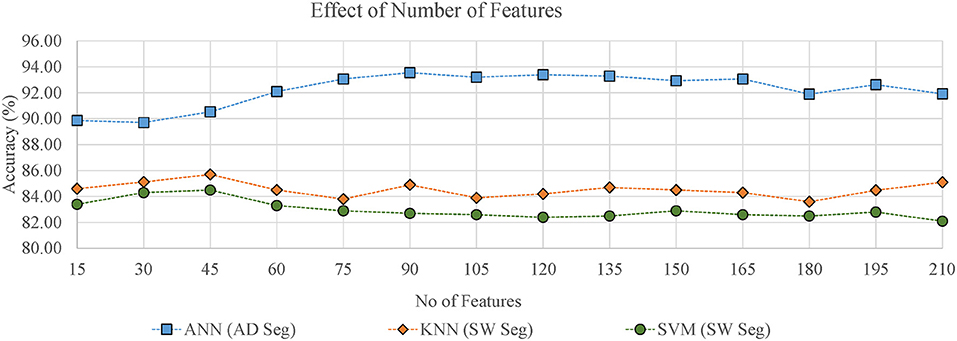
Figure 9. Performance of classifiers using different feature subsets for LoD9.
The X axis of this figure indicates the top number of features ranked by the Relief algorithm. Using a higher number of features did not necessarily result in the best performance for any of the classifiers. For example, accuracy of ANN is 93.55% with the top 90 features, and 91.92% with 210 features. Similarly, KNN and SVM performs best with the top 45 features (accuracy 85.7% for KNN, and 84.5% for SVM), while all the features produces an accuracy of 85.1% for KNN and 82.1% for SVM. This indicates that there may be some redundant features that negatively affect classifier performance.
Effect of Sensor Placement
While previous efforts have found promising results in equipment activity identification using single smartphone-embedded sensor mounted inside the equipment's cabin (Ahn et al., 2015; Akhavian and Behzadan, 2015; Mathur et al., 2015), this research utilizes three IMU sensors attached to three different implements of an excavator to leverage the motion of each moving part of the equipment. IMU#1, #2, and #3 was attached on the bucket, stick, and boom, respectively. The impact of the sensor placement on the equipment in this research is summarized in Figure 10.

Figure 10. Impact of placement and combination of IMUs on classifiers (LoD9).
Figure 10 illustrates that fusing data from all three IMUs results in highest performance for all three classifiers. If data from a single IMU is used for training the model, accuracy is highest for IMU#1 (attached to bucket), and lowest for IMU#3 (attached to boom). Moreover, when only two IMUs are used, accuracy is comparatively higher when IMU#1 is in use. Accuracy using combination of IMU #1, IMU #1, and IMU #2 are 79, 84.1, and 66.2%. As IMU#1 is attached to the bucket of the excavator, it can be concluded that motion data of the bucket contributes more in understanding the excavator activity than data from the stick or the boom. This indicates that using data from articulated parts of the excavator improves the accuracy over any individual sensor. Moreover, the bucket which is the end effector of an excavator, is the best location to collect motion data in order to identify equipment activity.
Summary of Results
While the findings of this paper are specific to excavators, the methodology can be generically applied to other construction equipment. Figure 11 compares the results of four most recent and similar efforts in equipment activity identification in construction using sensors and compares the results with this study. While it is acknowledged that the tests are from different equipment engaged in different operations, this comparison is provided to place the results of this study in context with similar studies.
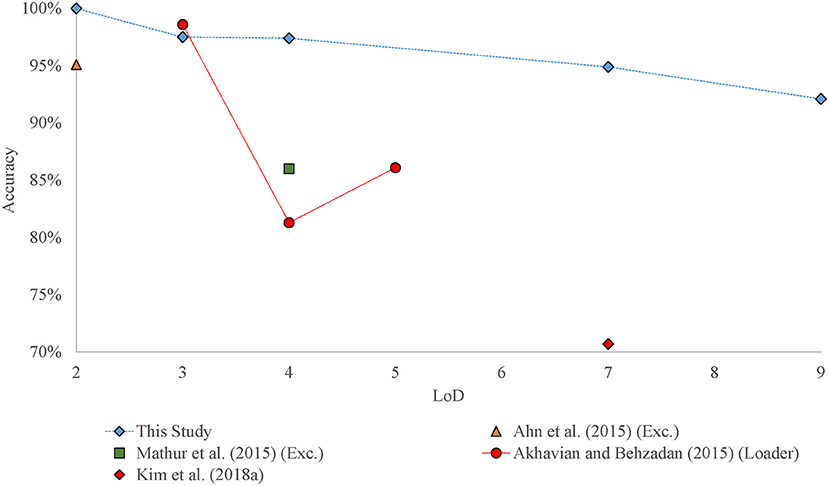
Figure 11. Comparison of the results of this study with most recent studies in equipment activity identification.
As shown in Figure 11, Mathur et al. (2015) reported a maximum accuracy of 86% for LoD4 while working with excavator and a single accelerometer. Ahn et al. (2015) obtained 95.1% accuracy for an excavator using low-cost accelerometer. Akhavian and Behzadan (2015) reported maximum accuracies of 98.6, 81.3, and 86.1% for LoD3, LoD4, and LoD5, respectively, for a front-end loader using smartphone-embedded sensors. Kim H. et al. (2018) used LoD7 depending on wheel base motion, cabin rotation, and bucket/arm movement of an excavator and achieved compiled classification accuracy of 70.68%. This study improved the accuracy of previous efforts by utilizing motions of various articulated parts of an excavator. Results shows a maximum accuracy of 100, 98, 97, 95, and 92.1% for LoD2, LoD3, LoD4, LoD7, and LoD9.
Based on the sensitivity analysis performed in this study, the results are summarized for practical application of this activity identification framework. As for the placement of sensor, it was found form the results that the bucket is the best place to collect motion data from in order to identify the activities of the excavator. From comparative analysis among classifiers and different segmentation techniques, we see that ANN performs best with activity defined (AD) segmentation and KNN produces best results using sliding window (SW) segmentation with 1 s window size. As AD segmentation technique requires the completion of an activity in order to identify that, combination of ANN and AD can be used for near real-time or offline applications, such as near real-time simulation update, emission analysis, cycle time analysis, etc. In case of real-time applications, such as real-time productivity monitoring, AR/VR visualization, KNN along with SW segmentation of 1 s window size can be implemented. As per using the subset of the total features, top 45 features produces best result for KNN, where using top 90 features, ANN achieved maximum accuracy.
Conclusion and Future Work
Automated, reliable, and accurate activity identification provides a foundational platform for implementing numerous applications such as productivity improvement, safety management, and fuel use and emission monitoring and minimization. Toward that goal, this study investigates the feasibility of using motion of different articulated structural equipment to identify different activities performed during operation. A case study of a hydraulic excavator was used to describe the methodology and evaluate the performance of the developed framework. The result of the case study shows that the motions of different articulated parts of the equipment can be used for activity identification for higher LoDs, as well as with high fidelity compared to the previous vibration-based efforts. KNN demonstrated higher potential to be used for real-time applications, and ANN for near real-time and offline applications. Moreover, it was found that motion of the bucket is most useful when identifying the activity of the equipment.
The primary contributions of this study is the successful implementation of activity identification framework using IMU data from different articulated parts of the equipment. This approach of leveraging the motion of multiple articulated parts of the equipment outperformed the previous studies that used just a single sensor on equipment's cabin in terms of accuracy as well as the number of LoD of activities. Moreover, using motions of different parts of the equipment, than the vibration of the cabin, have the potential of utilizing analytical and kinematic models in future. This is because the motion of equipment while performing different activities can be reproduced faithfully without prior knowledge about ground and equipment conditions.
As more manufacturers and contractors are mounting motion sensors to different parts of the equipment for AMG and AMC purposes, this study demonstrates the opportunity for using the same data for real-time activity identification of the equipment. This can facilitate monitoring the operation of the equipment in real-time and to take proactive decisions regarding the fleet operation. Moreover, the results of the sensitivity analyses performed in this study are available resource for the future researchers and practitioners regarding the parameters of the model, as well as the placement of the sensors while working in equipment activity identification domain.
One of the primary limitations of this study is the reliance of training data and data imbalance for implementing deep learning approaches. However, similar studies have used data augmentation techniques to generate synthetic training data and thus eliminating the data imbalance issue (Rashid and Louis, 2019). Another limitation is that the activity defined segmentation technique used in this study requires additional algorithms to automatically detect start and end point of activities in order for real-time application. Several methods have been proposed to automatically identify activity-transition points for both labeling and classification purpose (Sekine et al., 2000; Yoshizawa et al., 2013). Moreover, only one type of equipment was used in the case study to validate the proposed methodology. However, it is posited that the developed methodology can be applied for other types of equipment with minimal modification. Construction equipment sometimes performs two activities simultaneously, such as moving forward while swinging. These situations were not included in the case study. However, one future direction of this study includes developing a generic framework for more diverse operations with multiple construction equipment, and investigating methods to include simultaneous activities into the activity identification model.
The next step in this research is to utilize virtual kinematic models of articulated construction equipment to generate simulated training data, alleviating the manual data collection and labeling effort. Other future work include the investigation of data augmentation techniques to handle under-sampling and over-sampling issues in machine learning. Statistical and model based augmentation techniques can be explored to examine their feasibility along with other classifiers such as ensemble methods, and meta-learners. Ultimately, the process-level actions will be fused with productivity analysis, safety analysis, and fuel use to support better decision-making and control methods.
Data Availability Statement
The datasets generated for this study are available on request to the corresponding author.
Author Contributions
KR performed the research and analysis and prepared the first version of the paper. JL initiated the research idea, provided comments and feedback, and wrote parts of the introduction and conclusions.
Conflict of Interest
The authors declare that the research was conducted in the absence of any commercial or financial relationships that could be construed as a potential conflict of interest.
References
Ahn, C. R., Lee, S., and Peña-Mora, F. (2015). Application of low-cost accelerometers for measuring the operational efficiency of a construction equipment fleet. J. Comput. Civil Eng. 29:04014042. doi: 10.1061/(ASCE)CP.1943-5487.0000337
Akhavian, R., and Behzadan, A. H. (2012). “Remote monitoring of dynamic construction processes using automated equipment tracking,” in Construction Research Congress, eds H. Cai, A. Kandil, M. Hastak, and P. Dunston (West Lafayette, IN: American Society of Civil Engineers), 1360–1369. doi: 10.1061/9780784412329.137
Akhavian, R., and Behzadan, A. H. (2013). Knowledge-based simulation modeling of construction fleet operations using multimodal-process data mining. J. Construct. Eng. Manage. 139:04013021. doi: 10.1061/(ASCE)CO.1943-7862.0000775
Akhavian, R., and Behzadan, A. H. (2015). Construction equipment activity recognition for simulation input modeling using mobile sensors and machine learning classifiers. Adv. Eng. Inform. 29, 867–877. doi: 10.1016/j.aei.2015.03.001
Akhavian, R., Brito, L., and Behzadan, A. (2015). “Integrated mobile sensor-based activity recognition of construction equipment and human crews,” in Conference on Autonomous and Robotic Construction of Infrastructure (Ames, IA: Iowa State University), 1–20.
Ann, O. C., and Theng, L. B. (2014). “Human activity recognition: a review,” in International Conference on Control System, Computing and Engineering (Penang: IEEE), 389–393. doi: 10.1109/ICCSCE.2014.7072750
Bao, R., Sadeghi, M. A., and Golparvar-Fard, M. (2016). “Characterizing construction equipment activities in long video sequences of earthmoving operations via kinematic features,” in Construction Research Congress (San Juan: ASCE), 849–858. doi: 10.1061/9780784479827.086
Carbonari, A., Giretti, A., and Naticchia, B. (2011). A proactive system for real-time safety management in construction sites. Automat. Construct. 20, 686–698. doi: 10.1016/j.autcon.2011.04.019
Cheng, T., and Teizer, J. (2013). Real-time resource location data collection and visualization technology for construction safety and activity monitoring applications. Automat. Construct. 34, 3–15. doi: 10.1016/j.autcon.2012.10.017
Dong, S., and Kamat, V. R. (2013). SMART: scalable and modular augmented reality template for rapid development of engineering visualization applications. Visual. Eng. 1, 1–17. doi: 10.1186/2213-7459-1-1
Gather, U., and Fried, R. (2002). Robust Preprocessing of Time Series With Trends. Dortmund: Informatik bewegt.
Golparvar-Fard, M., Heydarian, A., and Niebles, J. C. (2013). Vision-based action recognition of earthmoving equipment using spatio-temporal features and support vector machine classifiers. Adv. Eng. Inform. 27, 652–663. doi: 10.1016/j.aei.2013.09.001
Gong, J., Caldas, C. H., and Gordon, C. (2011). Learning and classifying actions of construction workers and equipment using Bag-of-Video-Feature-Words and Bayesian network models. Adv. Eng. Informat. 25, 771–782. doi: 10.1016/j.aei.2011.06.002
Goodrum, P. M., Haas, C. T., Caldas, C., Zhai, D., Yeiser, J., and Homm, D. (2011). Model to predict the impact of a technology on construction productivity. J. Construct. Eng. Manage. 137, 678–688. doi: 10.1061/(ASCE)CO.1943-7862.0000328
Heydarian, A., Golparvar-Fard, M., and Niebles, J. C. (2012). “Automated visual recognition of construction equipment actions using spatio-temporal features and multiple binary support vector machines,” in Construction Research Congress (West Lafayette, IN: ASCE), 889–898. doi: 10.1061/9780784412329.090
Kamat, V. R., and Martinez, J. C. (2005). Dynamic 3D visualization of articulated construction equipment. J. Comput. Civil Eng. 19, 356–368. doi: 10.1061/(ASCE)0887-3801(2005)19:4(356)
Kim, H., Ahn, C. R., Engelhaupt, D., and Lee, S. (2018). Application of dynamic time warping to the recognition of mixed equipment activities in cycle time measurement. Automat. Construct. 87, 225–234. doi: 10.1016/j.autcon.2017.12.014
Kim, J., Chi, S., and Seo, J. (2018). Interaction analysis for vision-based activity identification of earthmoving excavators and dump trucks. Automat. Constr. 87, 297–308. doi: 10.1016/j.autcon.2017.12.016
Ku, K., Tech, V., Mahabaleshwarkar, P. S., and Tech, V. (2011). Building interactive modeling for construction education in virtual worlds. J. Info. Technol. Construct. 16, 189–208. Available online at: www.itcon.org/2011/13
Lewis, P., Leming, M., Frey, H. C., and Rasdorf, W. (2011). Assessing effects of operational efficiency on pollutant emissions of nonroad diesel construction equipment. J. Transport. Res. Board 2233, 11–18. doi: 10.3141/2233-02
Lockhart, J. W., Pulickal, T., and Weiss, G. M. (2012). “Applications of mobile activity recognition,” in Conference on Ubiquitous Computing (New York, NY: ACM), 1054–1059. doi: 10.1145/2370216.2370441
Louis, J., and Dunston, P. (2016a). “Platform for real time operational overview of construction operations,” in Construction Research Congress ASCE, 2039–2049.
Louis, J., Dunston, P., and Martinez, J. (n.d.). Simulating Visualizing Construction Operations using Robot Simulators Discrete Event Simulation.
Louis, J., and Dunston, P. S. (2016b). Methodology for real-time monitoring of construction operations using finite state machines and discrete-event operation models. J. Construct. Eng. Manage. 143:04016106. doi: 10.1061/(ASCE)CO.1943-7862.0001243
Mathur, N., Aria, S. S., Adams, T., Ahn, C. R., and Lee, S. (2015). “Automated cycle time measurement and analysis of excavator's loading operation using smart phone-embedded IMU sensors,” in International Workshop on Computing in Civil Engineering (Austin, TX: American Society of Civil Engineers), 215–222. doi: 10.1061/9780784479247.027
Nath, N. D., Chaspari, T., and Behzadan, A. H. (2018). Automated ergonomic risk monitoring using body-mounted sensors and machine learning. Adv. Eng. Informat. 38, 514–526. doi: 10.1016/j.aei.2018.08.020
Nirmal, K. J., Sreejith, A. G., Mathew, J., and Sarpotdar, M. (2016). “Noise modeling and analysis of an IMU-based attitude sensor: improvement of performance by filtering and sensor fusion,” in Advances in Optical and Mechanical Technologies for Telescopes and Instrumentation II (Edinburgh), 99126W.
Park, T., Kang, T., Lee, Y., and Seo, K. (2014). “Project Cost Estimation of National Road in Preliminary Feasibility Stage Using BIM/GIS Platform,” in International Conference in Computing in Civil and Building Engineering (Orlando, FL: ASCE), 423–430. doi: 10.1061/9780784413616.053
Ranasinghe, S., Al Machot, F., and Mayr, H. C. (2016). A review on applications of activity recognition systems with regard to performance and evaluation. Int. J. Distribut.Sensor Networks 12, 1–22. doi: 10.1177/1550147716665520
Rashid, K. M., and Behzadan, A. H. (2018). Risk behavior-based trajectory prediction for construction site safety monitoring. J. Construct. Eng. Manage. 144:04017106. doi: 10.1061/(ASCE)CO.1943-7862.0001420
Rashid, K. M., Datta, S., and Behzadan, A. H. (2017). “Coupling risk attitude and motion data mining in a preemtive construction safety framework,” in Proceeding of Winter Simulation Conference (Las Vegas, NV: IEEE), 4220–4227. doi: 10.1109/WSC.2017.8247971
Rashid, K. M., and Louis, J. (2019). Times-series data augmentation and deep learning for construction equipment activity recognition. Adv. Eng. Informat. 42:100944. doi: 10.1016/j.aei.2019.100944
Rezazadeh Azar, E., and McCabe, B. (2012). Part based model and spatial-temporal reasoning to recognize hydraulic excavators in construction images and videos. Automat. Construct. 24, 194–202. doi: 10.1016/j.autcon.2012.03.003
Sekine, M., Tamura, T., Togawa, T., and Fukui, Y. (2000). Classification of waist-acceleration signals in a continuous walking record. Medical Eng. Phys. 22, 285–291. doi: 10.1016/S1350-4533(00)00041-2
Shoaib, M., Bosch, S., Incel, O., Scholten, H., and Havinga, P. (2015). “A Survey of Online Activity Recognition Using Mobile Phones.” Sensors 15, 2059–2085. doi: 10.3390/s150102059
Song, L., and Eldin, N. N. (2012). Adaptive real-time tracking and simulation of heavy construction operations for look-ahead scheduling. Automat. Construct. 27, 32–39. doi: 10.1016/j.autcon.2012.05.007
Su, X., Tong, H., and Ji, P. (2014). Activity recognition with smartphone sensors. Tsinghua Sci. Technol. 19, 235–249. doi: 10.1109/TST.2014.6838194
Su, Y. Y., and Liu, L. Y. (2007). “Real-time Construction Operation Tracking from Resource Positions,” in Computing in Civil Engineering, Intergovernmental Panel on Climate Change (Cambridge: Cambridge University Press), 1–30. doi: 10.1061/40937(261)25
Teizer, J., Venugopal, M., and Walia, A. (2008). Ultrawideband for automated real-time three-dimensional location sensing for workforce, equipment, and material positioning and tracking. Transport. Res. Rec. J. Transport. Res. Board 2081, 56–64. doi: 10.3141/2081-06
Vahdatikhaki, F., and Hammad, A. (2014). Framework for near real-time simulation of earthmoving projects using location tracking technologies. Automat. Construc. 42, 50–67. doi: 10.1016/j.autcon.2014.02.018
Wang, X., Love, P. E. D., and Davis, P. R. (2012). “RFID+ for tracking earthmoving operations,” in Construction Research Congress (West Lafayette, IN), 778–786.
Xu, P., Sheng, Q. Z., and Yao, L. (2017). “Interpolating the missing values for multi-dimensional spatial-temporal sensor data : a tensor SVD approach,” Proceedings of the 14th EAI International Conference on Mobile and Ubiquitous Systems: Computing, Networking and Services (New York, NY: ACM), 442–451. doi: 10.1145/3144457.3144474
Yoshizawa, M., Takasaki, W., and Ohmura, R. (2013). “Parameter exploration for response time reduction in accelerometer-based activity recognition,” in ACM Conference on Pervasive and Ubiquitous Computing Adjunct Publication (Zurich), 653–664. doi: 10.1145/2494091.2495986
You, S., Kim, J.-H., Lee, S., Kamat, V., and Robert, L. P. (2018). Enhancing perceived safety in human–robot collaborative construction using immersive virtual environments. Automat. Construct. 96, 161–170. doi: 10.1016/j.autcon.2018.09.008
Yu, L., and Liu, H. (2003). “Feature Selection for High-Dimensional Data: A Fast Correlation-Based Filter Solution,” in Proceedings of the Twentieth International Conference on Machine Learning (Washington, DC: DCMA), 1–8.
Zhai, D., Goodrum, P. M., Haas, C. T., and Caldas, C. H. (2009). Relationship between automation and integration of construction information systems and labor productivity. J. Construct. Eng. Manage. 135, 746–753. doi: 10.1061/(ASCE)CO.1943-7862.0000024
Keywords: activity recognition, construction equipment, machine learning, inertial measurement unit, feature extraction
Citation: Rashid KM and Louis J (2020) Automated Activity Identification for Construction Equipment Using Motion Data From Articulated Members. Front. Built Environ. 5:144. doi: 10.3389/fbuil.2019.00144
Received: 22 October 2019; Accepted: 09 December 2019;
Published: 09 January 2020.
Edited by:
James Mark William Brownjohn, University of Exeter, United KingdomReviewed by:
Ke Chen, Huazhong University of Science and Technology, ChinaMichele Betti, University of Florence, Italy
Copyright © 2020 Rashid and Louis. This is an open-access article distributed under the terms of the Creative Commons Attribution License (CC BY). The use, distribution or reproduction in other forums is permitted, provided the original author(s) and the copyright owner(s) are credited and that the original publication in this journal is cited, in accordance with accepted academic practice. No use, distribution or reproduction is permitted which does not comply with these terms.
*Correspondence: Joseph Louis, am9zZXBoLmxvdWlzQG9yZWdvbnN0YXRlLmVkdQ==