 Ziad Azzi
 Filmon Habte2
 Amal Elawady
 Arindam Gan Chowdhury
 Mohammadtaghi Moravej
- 1Department of Civil and Environmental Engineering, Florida International University, Miami, FL, United States
- 2Karen Clark & Company, Boston, MA, United States
- 3Extreme Events Institute of International Hurricane Research Center, Florida International University, Miami, FL, United States
During strong wind events such as hurricanes and thunderstorms, building roofs are subjected to high wind uplift forces (suctions), which often lead to severe roofing component damage and possibly, water intrusion. It is therefore crucial to accurately estimate peak suctions (negative pressures) on roofs for design purposes and to develop mitigation devices to reduce wind uplift and possible damage. Past research suggests that mitigation devices, in various forms and configurations, can significantly reduce wind effects on buildings' roofs. Perforated parapets have been shown by many researchers to be one of the most effective and low-cost mitigation devices for reducing roof suction. However, such devices contain perforations of critical functionality that may be Reynolds number Re dependent. Therefore, it is essential to study their functionality and possible Re dependency in wind tunnel testing. This paper focuses on investigation of Reynolds number Re similitude aspects of porous devices and large-scale model testing of discontinuous porous parapets to estimate their roof uplift reduction efficacy that would be representative of the prototype (full-scale) conditions. Large scale (1:8) experiments were implemented at the 12-Fan Wall of Wind Experimental Facility (WOW) at Florida International University (FIU) to achieve adequate local Reynolds number Re to ensure realistic results. In this study, a relatively smaller ratio of parapet height to roof height has been considered as compared to previous studies. The paper delineates the step-by-step design of the parapets based on kinematic similitude requirements cited in the literature. The goal was to achieve a discontinuous porous parapet design that provides similar uplift reduction efficacy as compared to those reported in the literature, but with lower height and smaller length to ensure cost-effectiveness, ease of installation, and architectural aesthetics of the retrofitted building. The effects of perforated parapets on both individual tap and area-averaged pressure coefficients were explored. The results indicated a maximum of 45% reduction in individual tap peak pressure coefficients at the corner roof and a 40% reduction in area-averaged peak pressure coefficients. The study showed that low-height ratio perforated parapets could be as effective as those reported in the literature with higher height ratios.
Introduction
Past Research Work on Aerodynamic Load Mitigation Devices
In the past 50 years, windstorm-induced losses are estimated to represent about 70% of the total insured losses due to natural catastrophes (Holmes, 2015). Approximately, 39% of the United States population lives in shoreline counties that are prone to hurricanes and thunderstorms [National Oceanic and Atmospheric Administration (NOAA), 2013]. With improvements in building codes over the last few decades, wind induced forces may not impose a significant threat to the building structural system, but they still inflict severe damages to the building envelope, especially to roofing components such as roof sheathing and roof covering (e.g., tiles, shingles, metal roofing) of low-rise buildings (MDC-BCCO, 2006; Suaris and Irwin, 2010). Strong wind uplift or suction on the roof corners, edges, and ridges during high wind speed events induce roof damages (Bitsuamlak et al., 2013). High suction coefficients on roofs of low-rise buildings occur near the corners due to the development of conical vortices (Banks, 2000; Banks et al., 2000; Kopp et al., 2005). According to Ho and Surry (2000), these corner vortices have resulted in peak roof uplift pressure coefficients of 20 or more for gable roofs, with reference to the mean wind speed at the mean roof height. Due to these high uplift pressures (suctions) on the corners, possible dislodging of roofing components, such as pavers, shingles and tiles could become dangerous wind-borne debris (Hazelwood, 1981; Bienkiewicz and Sun, 1997; Peterka et al., 1997; Geurts, 2000; Parmentier et al., 2000; Kawai and Nishimura, 2003; Robertson et al., 2007; Aly et al., 2012; Bitsuamlak et al., 2013; Tecle et al., 2013). Furthermore, the loss of roofing components could lead to rainwater intrusion and interior damage (Visscher and Kopp, 2007). These issues highlight the importance of reducing local roof uplift during windstorms. To assess and mitigate wind induced uplift in vulnerable low-rise structures, several wind tunnel testing have been reported in the literature.
Passive aerodynamic mitigation devices can be used to reduce roof suctions under strong winds. Several previous wind tunnel researches have been conducted with the objective of modifying roof aerodynamics by using parapets and other passive aerodynamic shapes to suppress wind vortex generation. Various methods for disturbing the formation of conical vortices using different roof mounted edges or screens have been studied in the past by several researchers (Stathopoulos and Baskaran, 1987; Lin and Surry, 1993; Surry and Lin, 1995; Cochran and English, 1997; Pindado and Meseguer, 2003; Suaris and Irwin, 2010). Bienkiewicz and Sun (1992) reported that tall parapets generally reduce the high suction on roofs while short parapets may even aggravate the cornering suction. In particular, they showed that for ratios of parapet height to building maximum horizontal dimension (hp/L) up to 0.08, the mean roof corner suctions increased significantly, or remained constant in some other cases. Baskaran and Stathopoulos (1998) and Carter and Smith (2009) demonstrated that the ratio of parapet height to roof height (hp/Heave) is an important parameter to be considered for the reduction of uplift pressure. They also showed that perforations in parapets can significantly alleviate high uplift pressure on roofs. Surry and Lin (1995) tested various parapet configurations on a 1:50 scale of the Texas Tech University's (TTU) WERFL building model, including saw-tooth partial parapets, semi-cylindrical parapets, solid and porous roof corner splitters and porous parapets. In their tests, the ratio of parapet height to roof height (hp/Heave) ranged between 0.064 and 0.192. Out of all the configurations tested, the porous parapets resulted in the highest reduction in suctions near the roof corner. Banks (2000) and Banks et al. (2001) used a horizontal flat plate device, resembling a spoiler, to mitigate vortex induced roof suction. This device was designed to disrupt vortices by deflecting some of the shear layers. For that device design, the results obtained using small-scale wind tunnel testing and full-scale measurements on the WERFL building indicated that peak suction forces were reduced by over 50% near the roof edges. Similarly, perforated parapets installed on a 1:25 scale model of the TTU WERFL building were also investigated by Banks (2000) and a reduction of about 50% in wind suction was achieved. Banks et al. (2001) suggested that, because of the small size of the mitigation devices compared to the building size, subtle changes in devices shape were difficult to assess with scaled models and recommended the use of large-scale tests. Kopp et al. (2005) reported the effects of various parapets, including spoilers, in decreasing area-averaged loads associated with corner vortices. In their study, the ratio of parapet height to total building height [(hp/(Heave+ hp)] was 0.17. They reported that the spoilers and porous continuous parapets performed best. Maximum reductions of peak pressure coefficients near roof corner were found to vary between 44 and 56%. However, Kopp et al. (2005) did not investigate the effects of discontinuous porous parapets on roof suction pressures. Blessing et al. (2009) conducted testing on curved-shaped and porous aerodynamic devices attached to roof edges and reported around 55% reduction in area-average peak uplift pressure. Suaris and Irwin (2010) conducted wind tunnel testing to study the effects of porous parapets on a 1:20 model of a single story 3:12 gable roof low-rise building. Considering individual pressure taps at the roof corner zones, the authors noticed a maximum reduction of 60% in peak pressure coefficients by installation of the parapets.
Based on the previous literature review, porous parapets were found to be one of the effective passive mitigation devices that enable reducing roof corner suction in low-rise buildings (Surry and Lin, 1995; Cochran and English, 1997; Banks, 2000; Kopp et al., 2005; Suaris and Irwin, 2010). Their effectiveness in reducing roof uplift comes from their ability to, disrupt the formation of vortices along the roof, absorb some of the energy of the flow over the roof edge, and displace the weakened vortices that form over the top edge of the parapet away from the rooftop (Suaris and Irwin, 2010). However, limited studies have been conducted to assess possible scaling effects while modeling the porosity of mitigation devices using small-scale experiments.
Porosity is a critical parameter that governs the flow through porous mitigation devices and their functionality. Limited research has been performed to study such effects. For example, to evaluate the effect of porosity of perforated cladding in suppressing vortex shedding for a high slender tower, Belloli et al. (2014) performed wind tunnel tests at 1:50 scale at the large boundary layer wind tunnel test section of the Politecnico di Milano, Italy. It was observed that the influence of porosity on the dynamic response of the structure was significant. Vibrations due to vortex shedding were very strong in the case of non-porous panels but were almost absent when porous panels were tested. Moreover, tests were conducted at different wind speeds to evaluate possible effects of local Reynolds number Re that is a function of the diameter of the perforations. A range of wind speeds were tested to ensure that the results are stable, i.e., the effectiveness of the perforations was independent of local Re effects. Belloli et al. (2014) concluded that local wind loads on porous panels were lower than those on the same non-porous panel. Similarly, consideration of porosity and local Re is also important for porous parapets designed as roof uplift mitigation devices. Possible Re effects pertaining to porous parapets were pointed out by Suaris and Irwin (2010). These effects pertain to the loss of effectiveness of the perforated parapets when local Re drops below a certain threshold value (see section Aerodynamics of Porous Mitigation Devices). However, no further investigation was conducted on that topic. For low-rise buildings, typical wind tunnel testing with length scales ranging between 1:20 and 1:50 have constituted the majority of the previous studies on porous parapets (Suaris and Irwin, 2010). At these scales, Re close to its full-scale counterpart cannot be achieved and thus, it is difficult to estimate how effective the mitigation technique will be at full-scale. To the authors' knowledge, the consideration of scaling effects in evaluating the aerodynamic efficacy of porous mitigation devices for low-rise buildings has not been performed. The next subsection discusses the aerodynamics of porous structures. This context is important in terms of determining the range of model Re simulation in wind tunnels for achieving results that are expected to closely match their prototype (full-scale) counterparts.
Aerodynamics of Porous Mitigation Devices
By definition, the resistance of any porous structure to air flow passing through it may be characterized by a loss coefficient k which relates the pressure drop across the structure to the volume flow rate per unit area through the structure (Richards and Robinson, 1999). Equation 1 defines the loss coefficient k as a function of the pressure drop across the porous structure:
where pu and pd are the upstream and downstream static pressures on either side of the porous structure, respectively; ρ is the density of air (~1.23 kg/m3); and U is the volume flow rate of air per unit area through the porous structure, or in other terms, the velocity of the flow. This loss coefficient k is a function of the porosity β as well as the shape of the perforations. When using wire mesh screens, it is generally found that the loss coefficient k is reasonably constant at high Re (larger than 2,000) but increases at lower Re (Richards and Robinson, 1999). This concept is clearly shown in Figure 1, where data from (ESDU, 2007) item 72009 (2007) is presented. (ESDU, 2007) item 72009 (2007) tackles the topic of pressure drop in ducts across round-wire gauzes normal to the flow of a fluid (liquid or gas). In this document, an empirical factor is used to correct the pressure drop in fluids with Reynolds number Re values <2,000. Data extracted from (ESDU, 2007) item 72009 (2007) (Figure 1) shows that the pressure drop, and consequently the loss coefficient k, remain constant for Reynolds number Re values >2,000.
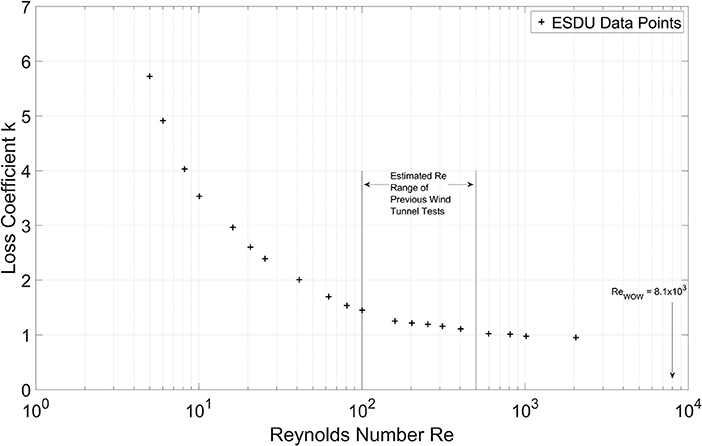
Figure 1. Variation of loss coefficient k with Reynolds number Re.
The figure emphasizes the importance of simulating the appropriate range of Re when modeling the porosity of mitigation components (such as perforated parapets or claddings) in order to preserve kinematic similitude between the model and prototype. In other terms, the velocities and accelerations of the flow at corresponding points should satisfy similitude requirements, which entail close matching of Re values (Fay, 1994; Letchford et al., 2000). To guarantee adequate Re similitude, the perforated elements must be scaled down geometrically while maintaining Re range for which loss coefficient k at the model scale closely matches its prototype counterpart (Fay, 1994; Letchford et al., 2000).
A perforation in a parapet can be likened qualitatively to an orifice plate. Consider a pipe with an interior plate normal to its axis and having a diameter equal to the inner diameter of the pipe. The role of the plate is to completely prevent the flow from passing within the pipe. On the contrary, an orifice in that same plate will allow the flow to pass. As such, the velocity of the flow through the orifice is a function of the local Reynolds number Red, as shown in Equation 2:
where d is the diameter of the orifice, ν is the kinematic viscosity of the fluid and Uor is the mean velocity of the flow through the orifice. By virtue of continuity between the pipe and the orifice, Uor > Upipe, where Upipe is the velocity of the oncoming flow in the pipe. Equation 3 shows the expression of the flow rate or discharge Q though a circular orifice:
where K is the flow coefficient and Ao is the orifice area. Δp, k and Uor were previously defined in Equations 1 and 2, respectively. At low and moderate values of Red, i.e., Red < 5,000, the dependence of the flow upon Reynolds number is significant (Crowe et al., 2009). However, at higher values of Red, i.e., Red > 10,000, the Reynolds number dependence and subsequently, the viscous effects largely disappear (Crowe et al., 2009; Büker et al., 2013). Therefore, it would be more appropriate to perform large-scale testing in order to obtain sufficiently large local Reynolds numbers (Red), in the order of 104. This supports the previous suggestion made by Letchford et al. (2000) and Belloli et al. (2014). This philosophy of Re similitude has been used in the current research on porous parapets.
It is worthwhile to clarify that the local Reynolds number Red (calculated in Step 2 of section Design of Porous Parapets for Roof Uplift Mitigation) is different than its global counterpart in that the former is a function of the diameter of the parapet perforation whereas the latter is a function of the building height. Previously published small-scale tests on perforated parapets violated the local Reynold number Red. The authors estimated that the Red in previously published works with length scales of 1:20 to 1:50 was in the order of 102. Estimated local Reynolds number Red in previous small-scale experiments along with the value for the model tested at the WOW are shown in Figure 1.
Focus of the Current Study
In light of the above literature review, this paper evaluates the effectiveness of porous parapets in roof uplift mitigation using wind testing technologies. The designed wind experiment adopts a large-scale experimentation to ensure adequate similitude requirements for realistic estimation of the reduction in wind loading. In particular, the main objective of the current study is to evaluate the effectiveness of discontinuous porous parapets with circular holes by assessing the reduction in peak roof suctions and by comparing the efficacy with those reported in previous studies. This study differs from the previous studies on porous parapets in two aspects. First, it uses a 1:8 large-scale model of a low-rise gable roof house for which the Re was considered to be adequate to minimize scaling effects (this is elaborated in section Experimental Setup, Design of Porous Parapets and Data Analysis Method). Second, the current research was carried out using a strategically designed lower parapet height as compared to those reported in the literature. The second aspect is considered important to improve the cost effectiveness, ease of construction and installation. The paper also explains the basis for selecting the different parameters of the perforated parapets such as height, hole diameter, and hole spacing. The tests were performed at the 12-fan Wall of Wind (WOW) at Florida International University (FIU) which is designated as an Experimental Facility (EF) under the National Science Foundation's (NSF) Natural Hazard Engineering Research Infrastructure (NHERI) program.
It is noted that, in large-scale testing, it is challenging to simulate the entire wind turbulence spectrum. However, previous work at the WOW EF has shown that a Partial Turbulence Simulation (PTS) methodology can be effectively used for large-scale testing to produce estimates of peak pressure coefficients on low-rise buildings that closely match full-scale field data (Mooneghi et al., 2016). It was shown that roof peak pressure coefficients (Cppeak) predicted using the PTS approach for 1:5 and 1:6 models of the WERFL and Silsoe field buildings closely matched the field data (Mooneghi et al., 2016). The PTS method was further enhanced by Moravej (2018) who investigated scaling effects on pressure coefficients using 1:100, 1:50, 1:20, 1:10, and 1:6 WERFL building models.
In this study, mean pressure coefficients Cpmean obtained for a low-rise gable roof building (with no parapets) constructed at a relatively large scale of 1:8 were compared to those available in the NIST database (Ho et al., 2003) for the same building modeled at a smaller scale (1:100) and discussions on possible Re effects are provided. Second, the large-scale model was fitted with discontinuous porous parapets and tested to evaluate the effectiveness of the parapets in reducing the peak roof pressures. The PTS methodology was adopted to estimate the peak roof Cppeak values. The results provided a means of comparison of the efficacy of porous parapets as evaluated at near full-scale Re and at low-Re tests described in the literature.
Section Experimental Setup, Design of Porous Parapets and Data Analysis Method provides details on the experimental setup, test model, testing protocol, design procedure for selection of perforated parapets as mitigation devices, and PTS method for the peak pressure estimation. In section Results and Discussion, comparisons of results for the WOW and NIST models are provided on one hand and efficacy of the mitigation devices by comparing results of the parapet- vs. no-parapet is discussed on the other hand. Section Conclusion presents a summary of the investigation along with some of the conclusions drawn.
Experimental Setup, Design of Porous Parapets and Data Analysis Method
Wall of Wind Experimental Facility (WOW EF)
The experimentation was performed at the Wall of Wind (WOW) Experimental Facility (EF) at FIU—an open jet large-scale facility comprised of a 12-fan system capable of generating wind speeds up to 70 m/s and turbulence characteristics. Figure 2A shows a schematic of the 12-fan WOW including wind flow management components to simulate Atmospheric Boundary Layer (ABL) flows. Figure 2B shows the intake side of the WOW EF. The open jet test section (6 m wide and 4.3 m high) allows large-scale aerodynamic testing for low-rise buildings and full-scale testing on building components such as, among others, rooftop equipment, roof pavers, and wall cladding elements. Design details and testing capabilities of the WOW EF, along with three case studies, are provided in Chowdhury et al. (2017).
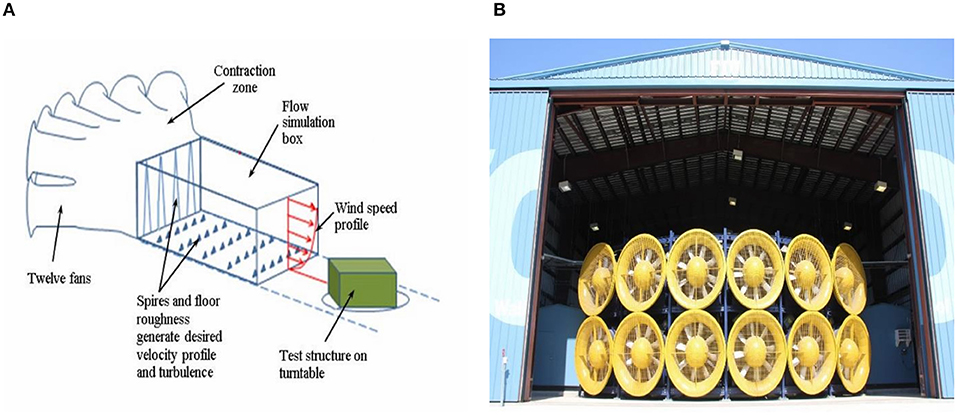
Figure 2. (A) Schematic of the WOW, and (B) WOW intake side.
Test Model Configurations
The National Institute of Standards and Technology (NIST) provides a large database containing data from boundary layer wind tunnel tests on scaled building models. To facilitate baseline comparisons of aerodynamic loadings and possible Re effects on roof pressures (without any mitigation device), a prototype building configuration from the NIST database was selected for the current study. The selected prototype building was a low-rise gable roof building with a roof slope of 1:12 and having the following full-scale dimensions: a length of 19.05 m, a width of 12.2 m and an eave height of 3.66 m. A low roof slope was selected since it is proven that such low pitches are subjected to the worst aerodynamic uplift forces. In the NIST database, aerodynamic pressures for this building are available based on wind tunnel testing of a 1:100 model conducted at The University of Western Ontario (Ho et al., 2003, 2005).
A large-scale 1:8 model of the prototype building was constructed at the WOW. The model was designed with two purposes in mind: on one hand, the model had to fit on the WOW turntable which has a diameter of 4.9 m and on another hand, adverse blockage effects had to be avoided (Aly et al., 2011). The side walls and the roof of the WOW test model were constructed using double layer acrylic glass material having a thickness of 1.3 cm (Azzi et al., 2018). Figure 3 shows the 1:8 model in the WOW along with the roughness elements for ABL flow simulation for open-country terrain exposure. A discussion about the flow field characteristics is provided in section Data Analysis Procedures.
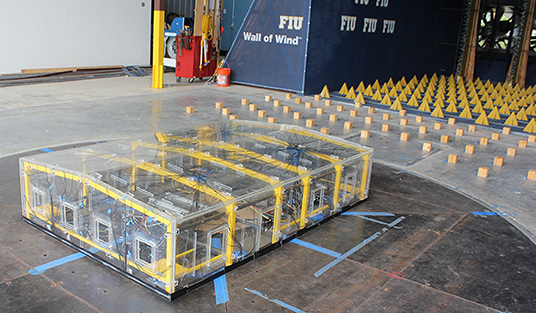
Figure 3. 1:8 model constructed at WOW.
Design of Porous Parapets for Roof Uplift Mitigation
This section briefly describes the rationale behind the design of the perforated parapets including the determination of the parapet height, hole size, hole spacing, porosity, parapet length and location. The goal was to achieve a “discontinuous porous parapet” design that provides similar uplift reduction efficacy as compared to those reported in the literature, but with lower height and length not only to make it aesthetically pleasing but also to enhance the cost-to-benefit aspect of the mitigation technology. The parapet design is described in four steps below. The design is based on the previous discussion on Reynolds Number Re sensitivity of flows through screens and orifices (see section Aerodynamics of Porous Mitigation Devices) and additional considerations on the cost and ease of construction.
Step 1—Parapet Height
In past studies, a ratio of the parapet height to the roof eave height (also known as “parapet height ratio” hp/H) ranging between 0.064 and 0.2 was used (Surry and Lin, 1995; Banks, 2000; Banks et al., 2001; Kopp et al., 2005; Suaris and Irwin, 2010). In this study, a smaller parapet height with a much smaller “parapet height ratio” was chosen. A prototype parapet height of 12.8 cm (5 inches) was chosen that is largely invisible to the naked eye from a distance and does not significantly alter the architectural appeal of the roof or the building itself (1.6 cm small-scale). This resulted in a lower “parapet height ratio” hp/H of 0.034. One of the objectives of the study aimed at testing the hypothesis that a smaller parapet, compared to parapet sizes adopted by previous researchers, can perform as well in reducing roof corner and ridge suction pressures. If proven correct, this would lead to a more economical design of porous parapets for roof uplift mitigation.
Step 2—Parapet Hole Diameter and Red
The choice of circular holes in the parapet was based on the ease of manufacturing. For flow through circular orifices, flow characteristics including the loss coefficient k and flow coefficient K (see section Aerodynamics of Porous Mitigation Devices), are strongly affected as the local Reynolds number Red = 67,000 × Vxd (V is the mean flow speed through the orifice in m/s, d being the diameter of the orifice in m) drops below 104 (Crowe et al., 2009; Büker et al., 2013). Also, the dependence of the flow coefficient K on Red decreases as the ratio of d/D (hole diameter to the dimension of the plate containing the hole) or in this case d/hp, decreases to about 0.5 (Figures 13, 14, Crowe et al., 2009).
It was deemed appropriate that the flow coefficient K depicts Reynolds number independence for the range of Red corresponding to different categories of wind events (e.g., minor to major hurricanes) under which the parapets are expected to perform effectively. To achieve a d/hp = 0.5, for which the porous parapets are expected to perform well under different intensity of hurricanes, a hole diameter of d = 0.5 × hp = 6.4 cm (full-scale) is proposed. This yields a hole diameter d of 8 mm for the 1:8 model tested at WOW. As mentioned later on in the testing protocol (section Testing Protocol), the mean wind speeds U at eave height of the building model selected for this experiment are 15 m/s and 35 m/s (small-scale). These speeds correspond to upper limits of Category 2 and Category 3 hurricanes based on Saffir-Simpson scale, as will be discussed later. The local Red for both wind speeds and for a hole diameter d of 8 mm were estimated at 8.1 × 10³ and 2.0 × 10⁴, respectively. This range is very close to the Red regime threshold beyond which the Red dependence of flows through porous devices, and the corresponding errors due to the scaling effects, were considered negligible (see section Aerodynamics of Porous Mitigation Devices, Letchford et al., 2000; Belloli et al., 2014).
It is noted that large- and full-scale testing to achieve local Re similitude is especially important for studies on aerodynamic mitigation devices for at least two reasons: (1) some mitigation devices contain perforations of critical functionality that are too small in size to be reproduced in small-scale model tests but can be adequately reproduced in large- or full-scale tests, and (2) some other devices involve curved surfaces with significant Re effects that can only be captured without compromise in large- or full-scale tests. In both of these cases local Re may affect the micro-scale flow-component interaction and the devices' aerodynamic functionality. In the current work, it was ensured that the flow parameters (e.g., loss coefficient k, flow coefficient K, flow rate Q) for flows through the scaled porous parapets in the wind tunnel testing are representative of their prototype (full-scale) counterparts. This similitude was achieved by ensuring that the local Reynolds number Red corresponding to the perforation diameter in the scaled porous parapet in the large-scale WOW testing is such that the loss coefficient k for flow through the perforations is independent of the local Red. Figure 1 shows the relationship between loss coefficient k and local Red. As can be observed in Figure 1, the range of Red in previous wind tunnel tests corresponds to a range for which k could still vary with Red. The prototype (full-scale) Red is estimated to be in the order of 105 for strong hurricane wind speeds. For current testing Red was ~8.1 × 10³, which ensured that k is almost constant between the WOW test and prototype conditions. Thus, Red dependence of flows through perforations, and the corresponding errors in aerodynamic mitigation results due to the scaling effects, can be considered negligible.
For mitigation of wind uplift on roofs for this research, the general aim of the perforated parapets is to perform well under moderate to high wind speeds; in this case, we considered wind speeds of Category 2 or 3 hurricanes according to a Saffir-Simpson scale [note: the devices are not intended to be designed for very strong hurricanes as Category 4 or stronger]. In a Saffir-Simpson scale, hurricane wind speeds are calculated over open-water, at a height of 10 m and for a sustained period of 1-min. For this research, the prototype (at full-scale) wind speeds at 10 m over open-water are considered as 50 m/s and 58 m/s, corresponding to upper limits of Category 2 and Category 3 hurricanes based on Saffir-Simpson scale. According to Simiu et al. (2007), the ratio between peak 3 s gusts at 10 m above terrain with open-country exposure (such as in our experiment) and its 1 min speed over open-water counterpart is equal to 1.03. Using this value, the prototype Saffir-Simpson scale based wind speeds of 50 and 58 m/s were converted to 3 s gusts at 10 m over open-country terrain as 52 and 60 m/s, respectively. Using power law, 3 s gusts at 10 m over open-country terrain can be converted to wind speeds at 3.66 m (full-scale mean roof height) over the same terrain as ~47 and 54 m/s, respectively. These values result in velocity scales of approximately 1:3 and 1:1.5 based on the test wind speeds of 15 and 35 m/s, respectively.
The previous reasoning means that if the perforated parapets are able to effectively reduce peak suction pressures on roofs belonging to a Category 3 hurricane, then they would have achieved their purpose. The local Reynolds number Red values for the previous full-scale wind speeds are in the range of 105 and 106, for which the loss coefficient k and flow coefficient K remain constant (Figure 1 and Figures 13, 14 in Crowe et al., 2009). Testing under this range of Red ensured that the WOW model scale results on the roof uplift reduction efficacy of the porous parapets would be representative of the performance at full-scale in real hurricanes.
Step 3—Spacing of Holes
A porosity of around 33% was chosen based on recommendations provided for low parapets by Pindado and Meseguer (2003) and conclusions reported by Suaris and Irwin (2010). The previous recommendations are provided based on the eddy-turbulence wake generated downwind of the parapets, which reduces the intensity of the vortices. The corresponding center-to-center spacing between adjacent holes was then determined to be 7.4 cm at full-scale (9.3 mm at small-scale).
Step 4—Locations and Length of Discontinuous Parapets
Instead of full perimeter parapets, discontinuous ones were considered at critical locations on the roof based on the critical spots subjected to high peak suctions. For the gable roof building model, the parapets were installed at two corners and at the gable end ridge intersection, which are regions of expected high peak suctions, as was demonstrated by Habte et al. (2017) in their full-scale study of the effects of wind loading on roof tiles. The length of each parapet was 1.22 m (15.3 cm small-scale) which represents 10% of the shorter horizontal dimension of the test building, as was proposed by Suaris and Irwin (2010). Figure 4A shows the different locations of the parapets on the model building and Figure 4B illustrates the parapet details.
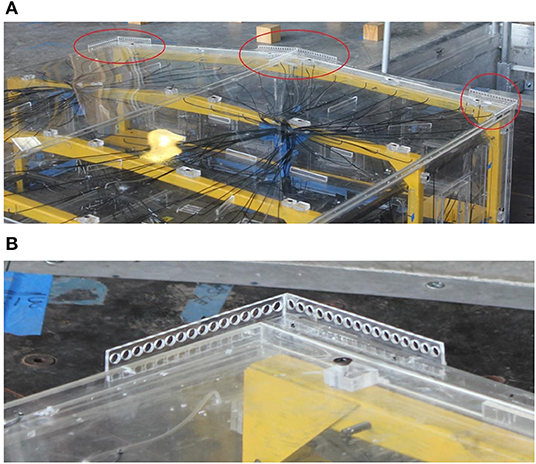
Figure 4. (A) Location of the parapets on the test model, and (B) Detailing of the perforated parapet (L = 15.3 cm, H = 1.6 cm, d = 0.8 cm).
Testing Protocol
For this research, open-country terrain exposure was selected for modeling terrain roughness conditions. To reproduce an open-country exposure, a set of spires as well as floor roughness elements were used as shown in Figure 3. Cobra probes, which are able to measure the wind velocities and turbulence characteristics, were installed at heights ranging between 0.15 and 3.05 m at the model location on the center of turntable without the model in place. The mean wind speed U at the height of 0.46 m (mean roof height of the building model) was ~15 and 35 m/s using 30 and 70% of the full throttle capacity of the 12-fan system. The test model was instrumented with 96 pressure taps that were connected to tubes with different lengths, which in turn, were attached to a ZOC33 Scanivalve pressure scanner system. According to the manufacturer's data sheet, this pressure system consists of 128 channels and is capable of measuring pressures up to 350 kPa with an accuracy of ± 2.5 kPa. The time histories of wind pressures were collected using 520 Hz sampling frequency. The raw pressure data were corrected using transfer functions for the different tubing lengths (Irwin et al., 1979). The resulting data were subjected to digital low-pass filtering at 250 Hz. Figure 5 shows the plan of the model roof, pressure taps layout, wind direction, and location of the perforated parapets on the model. Denser tap resolution was used near one corner of the building and wind directions ranging from 0 to 90° with increments of 5° were used for testing considering the symmetry of the model. Experiments were conducted for two cases: without (baseline case) and with the parapets. Each test for a specific wind direction was conducted for a duration of 90 s.
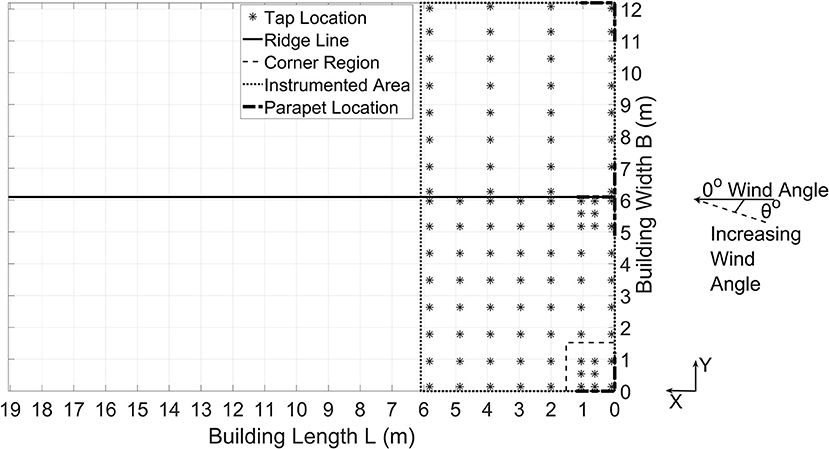
Figure 5. Tap layout, wind direction, and location of parapets on the model.
Data Analysis Procedures
Although of the advantages of large- and full-scale testing in reducing scaling effects, it is, however, challenging to simulate the low frequency (large-scale) turbulence at those scales. This results in an unrealistic estimation of peak pressures on buildings. To circumvent this constraint, an analytical and experimental methodology, called the Partial Turbulence Simulation (PTS), has been previously developed and validated at the WOW to predict realistic peak pressures on buildings using large-scale models. According to several researchers, adequate simulation of high frequency (small-scale) turbulence is the most important for aerodynamic testing of low-rise structures as it affects critical aerodynamic phenomena causing high suctions, represented by separating shear layers, flow reattachment, and conical vortices (Melbourne, 1980; Saathoff and Melbourne, 1997; Suresh and Stathopoulos, 1998a,b; Tieleman et al., 1998; Tieleman, 2003; Richards et al., 2007; Yamada and Katsuchi, 2008; Irwin, 2009; Banks, 2011; Kopp and Banks, 2013).
According to the PTS approach described by Mooneghi et al. (2016) and Moravej (2018), the high-frequency turbulence produced in the Wall of Wind is sufficiently matching that of a counterpart full-scale turbulence spectrum. Figure 6A shows the wind speed turbulence power spectrum at the building roof height, compared to the corresponding full-scale spectrum at zo = 0.08 m. The choice of the value for zo corresponds to an acceptable typical value for an open-country terrain exposure, as selected in the testing protocol, and is consistent with the mean wind profile achieved in the WOW (Figure 6B). As depicted by Figure 6A, the high frequency portions of the WOW and the (ESDU, 2001) item 85020 (2001) based spectra satisfactorily match and show good agreement. But at the lower frequencies, which belong to larger eddy sizes in the flow, the wind tunnel spectrum falls short of the full-scale one. This indicates a deficiency in the low frequency turbulence content and may result in an underestimation of the peak wind loads. In the PTS method, the effect of this shortage of low-frequency content is compensated through an analytical peak estimation process based on quasi-steady assumptions and by using a Gaussian probability distribution for the turbulence intensity. Details of the method and the verification studies at different model geometries and scales are provided in Mooneghi et al. (2016) and Moravej (2018).
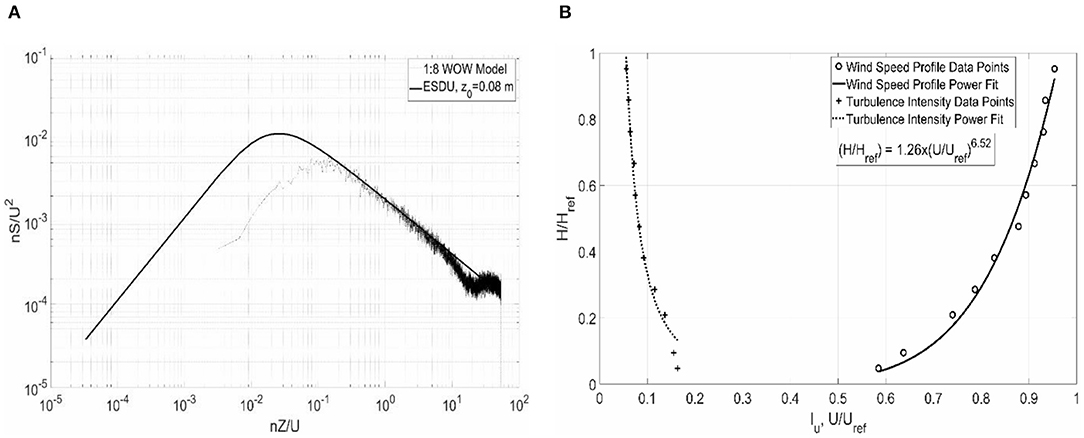
Figure 6. (A) Normalized power spectral density (PSD) of longitudinal turbulence fluctuations, and (B) Normalized mean wind speed profile at the WOW.
For this test, the turbulence intensity Iu at the reference height of 0.46 m was found to be around 13.6%. Figure 6B shows the normalized mean wind speed profile at the Wall of Wind. Table 1 shows the flow parameters measured at the WOW in comparison to the corresponding full-scale values. The different parameters presented in Table 1 are the following: Iu is the turbulence intensity, xLu is the integral length scale in m, H is the mean roof height in m, U is the mean wind speed at roof height in m/s, t is the exposure time in min, IuL is the estimated amount of missing low-frequency turbulence. The full-scale values presented in Table 1 were selected for the PTS analysis. The full-scale wind speed U of 47 m/s, depicted in Table 1, was selected based on the reasoning described in Step 2 of section Design of Porous Parapets for Roof Uplift Mitigation.
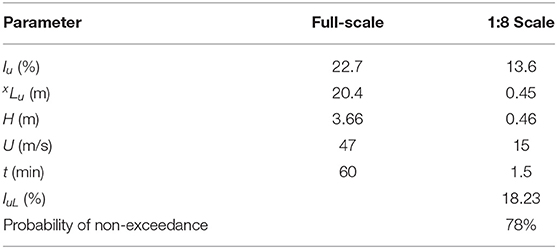
Table 1. Comparison of flow parameters between model and prototype.
Concerning the data analysis part, the results of localized and area averaged peak pressure coefficients in addition to localized mean pressure coefficients are presented. The mean pressure coefficient Cpmean is given by Equation 4 and the peak pressure coefficient Cppeak is given by Equation 5:
In Equations 4 and 5, Umean and U3s represent the mean and peak 3 s wind speeds at the model eave height in m/s, respectively, ρ is the density of air in kg/m3 and Pmean and Ppeak are the mean and peak differential pressures (difference between the model surface and the reference pressure) in Pa (with a probability of non-exceedance of 78%), respectively. In Equation 4, computing the different values of Cpmean does not require the use of the PTS method. As noted by many researchers, only adequate simulation of the high frequency spectrum is important to compute the different mean pressure coefficients Cpmean. Area-averaged peak pressure coefficients were calculated using the tributary areas of the pressure taps according to Equation 6:
In Equation 6, the parameter Pi, peak(t) is the pressure time history measured for pressure tap i. Ai denotes the tributary area for tap i. Instantaneous area averaging of the pressures was performed for all relevant taps, knowing the pressure data, using MATLAB® (2019) software and then area-averaged peak pressure coefficients were obtained according to Equation 6. Furthermore, percentages of reduction in peak pressures were obtained using Equation 7:
In addition, area-averaged non-Gaussian peak factors were calculated using Equation 8 (Winterstein et al., 1994; Winterstein and Kashef, 2000; Kwon and Kareem, 2011; Rizzo et al., 2018):
in which β = √(2ln(υo.T)); υo = √(m2/mo); mi = ith spectral moment = ∫ni.Sy(n)dn with Sy(n) = one-sided PSD and n = frequency in Hz; T is the duration in seconds and γ is Euler's constant, taken as 0.5772. Moreover, h3 and h4 are calculated using the equations provided in the Revised Hermite Model (Winterstein et al., 1994; Winterstein and Kashef, 2000).
Results and Discussion
Two sets of results are reported in this paper. On one hand, comparisons of mean pressure coefficients between the tested model at WOW (with a 1:8 length scale) and the NIST database for counterpart building (with a 1:100 length scale). On another hand, comparisons of mean and peak pressure coefficients as well as reduction percentages are portrayed for the with- and without-parapet cases. In addition, area-averaged reductions and peak factors are investigated and discussions are formulated.
WOW Model vs. NIST Model Results
The WOW and NIST models have the same full-scale dimensions. However, the WOW scale used is 1:8 and the NIST scale is 1:100. Other important parameters for both models used in the analysis are shown in Table 2.
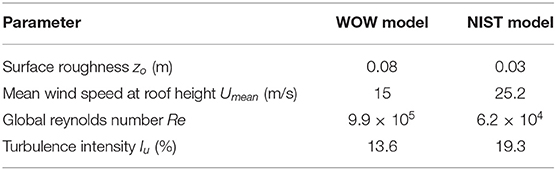
Table 2. Small-scale parameters of models tested.
Very limited studies have been performed to study the effects of change in Reynolds number Re on mean and peak pressure coefficients (Cpmean and Cppeak). Previous investigations conducted on the Silsoe cube by Hoxey et al. (1998) have observed the influence of changing wind speeds and length scales between full-scale and small-scale specimens. Of particular interest in the observations made was the influence of change in Reynolds number Re on mean pressure coefficients Cpmean values. Hoxey et al. (1998) have shown that, for each decade of increase in Reynolds number Re (one order of magnitude higher), a certain Cpmean value, collected from a pressure tap on the roof, decreases by 25% of its value. This observation motivated the WOW team to compare the mean pressure coefficients Cpmean of the 1:8 model to the one available in the NIST database. In order to effectively run the comparison, it was decided that the mean pressure coefficients Cpmean from winds approaching at 0° (parallel to the ridge), 45 and 90° (normal to the ridge) should be considered. Supplementary Figure 1 shows the tap layouts of both WOW and NIST models. Since a big part of this paper is the study of mitigation effects of perforated parapets on roof suction pressures, it was considered by the WOW team to have a concentration of taps around the edges and ridge lines in order to capture more measurements for the pressure coefficients in the most critical regions. Subsequently, taps belonging to the eave, ridge and gable lines were grouped for comparing results. The selected lines, shown in Supplementary Figure 1, represent the following entities: the gable end, the eave end and the ridge.
As previously mentioned in the testing protocol (section Testing Protocol), the WOW model was tested at two different wind speeds representing 30 and 70% of the maximum available throttle at the testing facility. These speeds represent 15 m/s for 30% throttle and 35 m/s for 70% throttle. Results of mean and peak pressure coefficients Cpmean and Cppeak were compared for both throttle speeds in Figures 7A,B. As can be seen in both figures, there is no significant difference between the values of 30 and 70% throttle speeds, which indicates minimal to no Reynolds number Re effects. Therefore, the team decided that the results obtained for the 30% throttle are sufficient to be compared with the NIST ones, and to be used later on in the rest of the analysis.
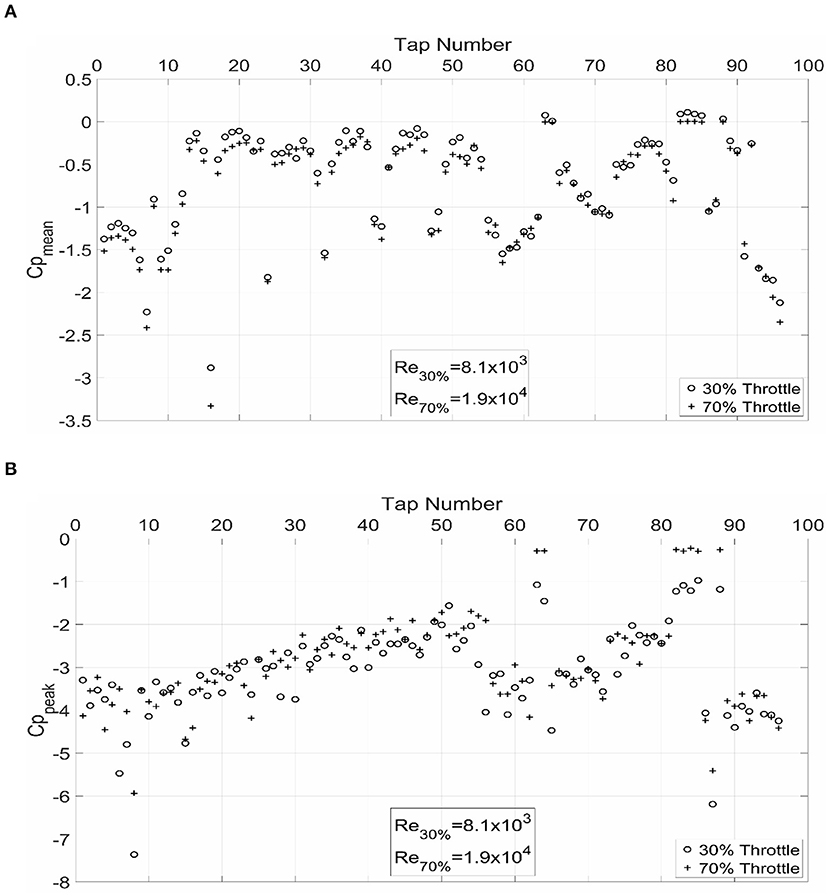
Figure 7. Comparisons for 30 and 70% throttle speeds: (A) Cpmean, and (B) Cppeak.
Regarding the comparison between the WOW and NIST models' values, Figures 8A,B and Supplementary Figure 2 depict the mean pressure coefficients Cpmean variations along the lines selected. The X and Y variables represent the coordinates of the taps along their respective lines (Figure 5 and Supplementary Figure 1).
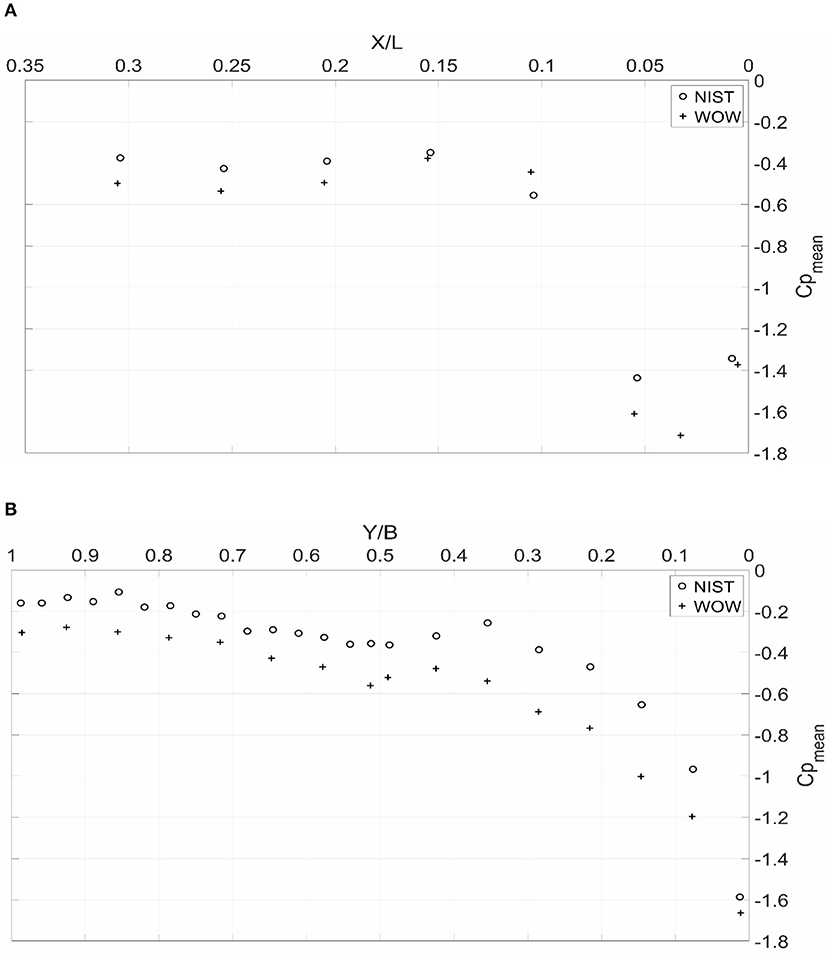
Figure 8. Cpmean variation along: (A) the ridge at 45° wind direction, and (B) the gable end at 90° wind direction.
As observed, there is a difference between the results with the mean pressures Cpmean of the WOW model being higher than the NIST values. The discrepancies can be attributed to the possible scaling effects along with the Reynolds Number Re differences at roof height of both models. For the WOW case and according to Equation 2 and Table 2, the global Reynolds number Re for the WOW test is about 9.9 × 10⁵ compared to about 6.2 × 10⁴ for the NIST case. Note that for the previous Re values, the mean velocity used is the velocity at roof height and the characteristic length is the eave height. As discussed by Cheung et al. (1997), Hoxey et al. (1998), Ho et al. (2005), and Suaris and Irwin (2010), Re can have a large effect on the mean and peak pressure coefficients experienced by roofs. Higher Re leads to higher pressure coefficients. For the current tests, the calculated Re at WOW is one order of magnitude higher than the one given for the NIST model. This gave confidence of the results and the method of analysis adopted for this study and enabled moving forward with analyzing the pressures obtained for the mitigation case as discussed in the next section. Furthermore, the mean pressure coefficients obtained from a single wind approaching angle tend to follow the same trend for both models, with the WOW results being higher. According to Hoxey et al. (1998) and as stated in the beginning of this section, a decade of increase in Reynolds number Re value leads to a 25% decrease in mean pressure coefficients Cpmean. In Supplementary Figure 2 as well as Figures 8A,B, the WOW values tend to fluctuate between 15 and 45% higher (absolute value) than the NIST ones, compared to the 25% previously reported by Hoxey et al. (1998).
Mitigation Investigation
This section discusses the efficiency of the proposed mitigation technique by testing the building model with the parapets installed on the corners and the ridge of the model roof (as shown in Figure 4A) and subjected to the same test conditions and protocol as the “no parapet” case. Comparisons of mean, peak, and area-averaged pressure coefficients are presented in the following sections and possible explanations and discussions are formulated.
Results of Mean and Peak Pressure Coefficients Cpmean and Cppeak
This first part of this subsection looks at how the mean pressure coefficients Cpmean compare between the “parapet” and “no parapet” cases. Consequently, two wind directions (0 and 45°) were chosen to run the analysis. Supplementary Figure 3 and Figure 9A portray the normalized line plots obtained for the gable and ridge ends for mean pressure coefficients Cpmean at 0 and 45°. The results show that, in some instances, there is a significant improvement in the results obtained after the addition of the parapets to help reduce suction pressures. The highest percentage of reduction in mean pressure coefficient Cpmean obtained is around 55%. This reduction is observed twice in Figure 9A when X/L is close to 0.035 (Cpmean decreased from −1.6 to −0.65) and when X/L is close to 0.055 (Cpmean decreased from −1.75 to −0.85). However, the rest of the plots show a range of variation fluctuating between 5 and 25%. In other few instances, there was a slight increase in the mean pressure coefficients observed with the addition of the parapets, mostly beyond the region where they were installed (for distances >15.3 cm (small-scale) (10% of shortest model dimension) from the origin O, see Step 4, section Design of Porous Parapets for Roof Uplift Mitigation).
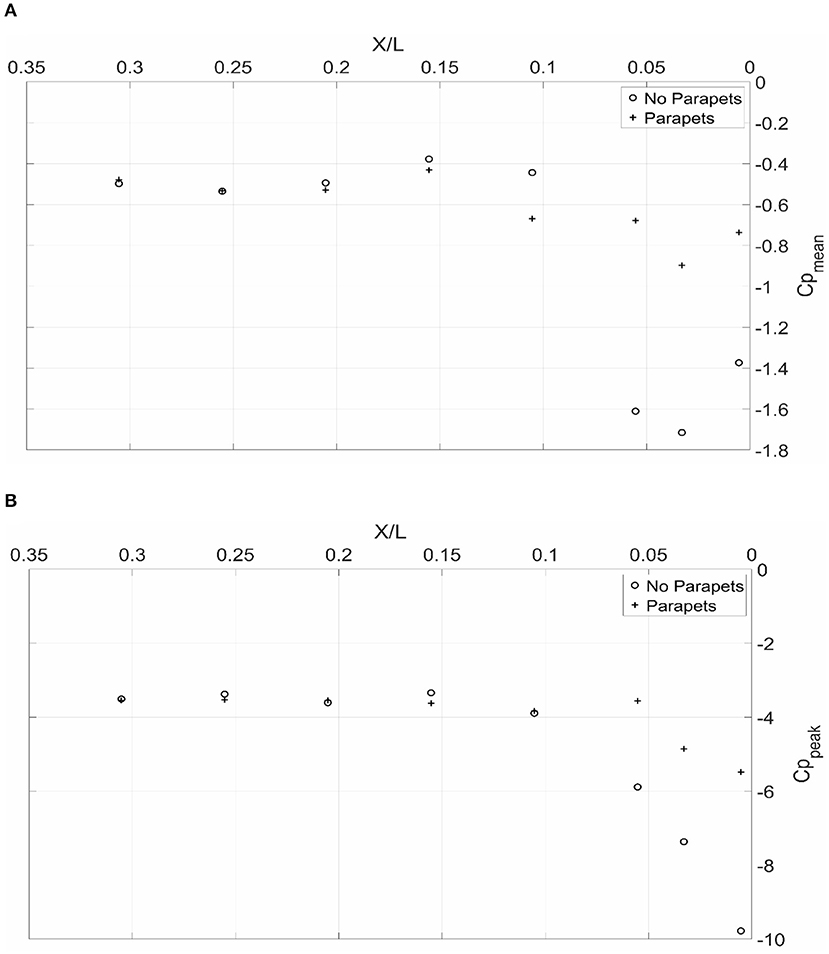
Figure 9. Variation of: (A) Cpmean along the ridge at 45° wind direction, and (B) Cppeak along the eave end.
The second part of this subsection investigates the effects of the mitigation technique on the peak pressure coefficients Cppeak. Figure 9B, Supplementary Figures 4, 5 summarize the normalized line plots obtained for the gable end, eave end and ridge lines for the worst coefficients obtained from all approach angles. By inspecting Supplementary Figure 4, the observations point out that there is a clear reduction in the peak pressure coefficients Cppeak along the entire gable end of the roof. The highest reduction percentage is noticed in Supplementary Figure 4 and Figure 9B at Y/B and X/L equal to 0.01 and 0.05, respectively. According to Equation 7, the reduction percentage is around 45% (Cppeak decreased from −9.8 to −5.4). The rest of the reductions seen in Supplementary Figure 4 fluctuate between 5 and 25%. However, in Figure 9B and Supplementary Figure 5, the mitigation effect of the parapets seems to cease when X/L goes beyond the value of 0.1. Recalling from section Design of Porous Parapets for Roof Uplift Mitigation that the design for the length of the parapets installed constituted 10% of the shortest dimension of the model. In other words, the observations point out that the ridge and eave parapets were effective in reducing the pressure coefficients in the region where they were installed but the performance was not improved beyond the region of the parapet. However, the regions beyond the parapet length do not have high suction pressures. More testing is required to determine the optimal length that the discontinuous perforated parapets should extend to.
Furthermore, previous authors including Suaris and Irwin (2010) reported a drop of 60% in corner suction pressures while using a parapet designed with the same length of 10% of the shortest dimension of the model and a similar porosity of 33%. However, the parapet height to roof height ratio of their model was about 0.056, compared to 0.034 for the current study model. i.e., 1.65 times higher. Earlier investigations such as the one published by Banks et al. (2001) also reported a drop of 50% in peak suction pressures for a similar configuration. Other authors including Baskaran and Stathopoulos (1998) and Carter and Smith (2009) demonstrated that the parapet thickness has no effect on the roof pressures. On the contrary, they stated that the height of the parapet does affect roof suction pressures. Additionally, Bienkiewicz and Sun (1992) reported that the reduction in suction pressures is directly proportional to the ratio of parapet height to roof height (hp/H). Such findings may have validated the results obtained at WOW since for a smaller hp/H, the reduction obtained was lower than the ones reported by other authors using a similar configuration.
On another hand, Figure 10 portrays a contour plot for the different peak suction pressure coefficients Cppeak obtained for both “no parapet” and “parapet” cases. The roof area on the right-hand side (“parapet” case) of Figure 10 clearly exhibits lower peak pressure coefficients Cppeak compared to its counterpart on the left (“no parapet” case). Although the reduction covers the entire roof area presented in Figure 10, it can be concluded that the reduction in pressures was higher in zones located on the edges and corners of the roof (e.g., where the parapets installed) than on internal areas. Moreover, another observation points out that the addition of parapets did not exhibit any unwanted effects such as an increase in pressures recorded by taps located in the central zones of the roof.
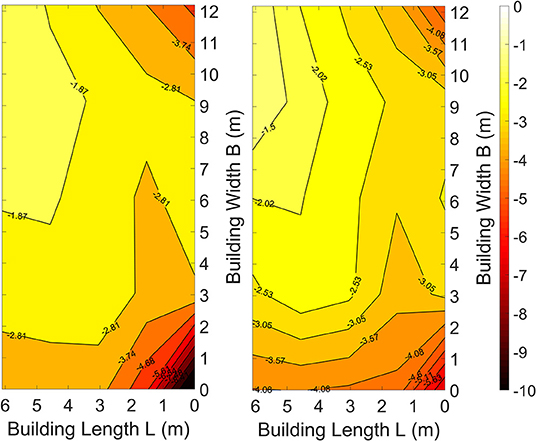
Figure 10. Peak pressure coefficients Cppeak for “No Parapets” case (Left) and “Parapets” case (Right).
Results of Area-Averaged Peak Pressure Coefficients Cppeak
This subsection explores the effects of the mitigation technique on area-averaged peak pressure coefficients Cppeak for the “no parapet” and “parapet” cases. Instead of looking at individual taps, it is more practical to investigate the reduction on area-averaged peak pressures, especially from a structural engineer's point of view, for design and/or rehabilitation purposes. A total of ten areas within ASCE 7-16 defined zones (Fig 30.3-2A in ASCE 7-16) and ranging between 0.092 and 1 m2 were considered for pressure averaging. Six of the areas were square and the remaining four were rectangular. Two locations on the roof were evaluated for reduction in area-averaged peak pressure coefficient Cppeak. One location involves the corner of the roof and the other is situated near the ridge. As previously mentioned, such areas are very vulnerable to roof elements dislodging and subsequently, water seepage and building interior damage. Supplementary Figures 6, 7 depict the areas on the roof. Tables 3, 4 summarize the results obtained. Once again, the worst peak pressure coefficients Cppeak from all approach angles were used in the comparison.
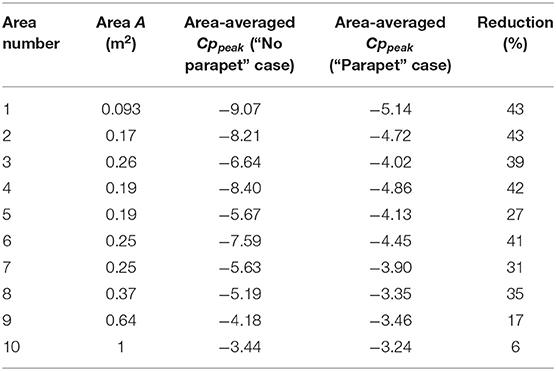
Table 3. Summary of results for the corner areas.
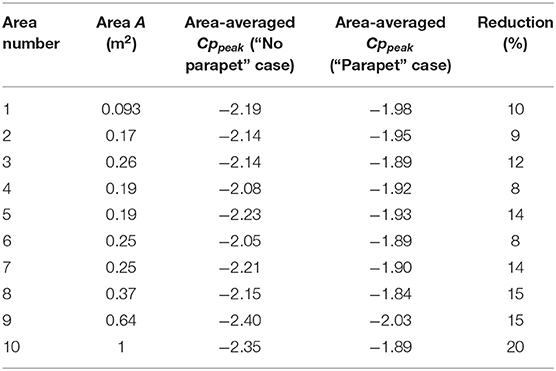
Table 4. Summary of results for the ridge areas.
By looking at Tables 3, 4, the reduction in peak pressure coefficients Cppeak was evident with the use of an area-average approach. However, the parapets installed on the corners were much more effective than the ones installed on the ridge. Decreases in coefficients reached a maximum of around 43% for area number 1 at the corner compared with 20% for area number 10 at the ridge.
Earlier authors investigating area-averaged reductions in peak pressure coefficients Cppeak reported similar findings. Banks et al. (2001) found that the reduction percentage is inversely proportional to the size of the areas for roof edge regions and for different spoiler configurations. In fact, for areas as small as 0.15 m2, the reduction is almost equal to 46% (Area-averaged Cppeak decreased from −13 to −7). For areas as big as 1.5 m2, that same percentage goes down to about 26% (Area-averaged Cppeak decreased from −7.5 to −5.5). And for zones having a 0.3 m2 area, the reduction reported was about 40% (Area-averaged Cppeak decreased from −11.5 to −7). The results reported in Table 3 show consistent values with the ones found by Banks et al. (2001). For zones of 0.17 m2 area, the reduction percentage was about 43% whereas, for zones of 0.37 m2 area, that number went down to approximately 35%. Kopp et al. (2005) reported similar observations as to Banks et al. (2001) concerning the inverse proportionality between the reduction percentage and the size of the area. However, in some of the mitigation geometries that Kopp et al. (2005) tested, there was an increase in area-averaged peak suction pressure coefficients Cppeak from the original roof configuration with no mitigation. Therefore, for comparison purposes, the results of the spoiler configuration tested by Kopp et al. (2005) will be used. For this particular case, the reduction reported drops from 50% for a 0.02 m2 zone (Area-averaged Cppeak decreased from −2.6 to −1.3) to 35% for a 2 m2 zone (Area-averaged Cppeak decreased from −1.1 to −0.7). Once again, the reductions reported at WOW are in line with previous findings, even though the parapets used are much shorter than the ones adopted earlier in the literature. Table 5 summarizes the reductions obtained at the WOW using large-scale testing compared with some of the previously published results for parapets for point pressures.
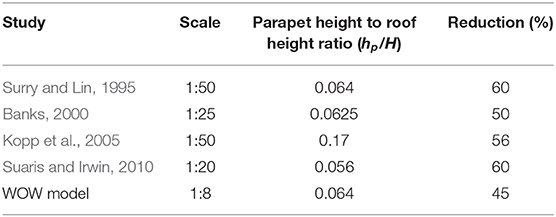
Table 5. Comparisons of current research results and those from the literature for perforated parapets.
Finally, in order to ensure the safety and reliability of designed structures, accurate estimation of the peak factors of externally applied load effects attributable to wind is required (Kwon and Kareem, 2011; ASCE 7, 2016). Since the time history of wind pressure fluctuations around low-rise buildings is a non-Gaussian process, the traditional peak factor equations for Gaussian processes (Davenport, 1964) widely used in most codes need to be adjusted to accurately estimate extremes. The area-averaged non-Gaussian peak factors gNG were estimated using Equation 8 for Zone 3 given in ASCE 7-16 (shown in Supplementary Figure 6) for both “parapets” and “no parapets” cases. The results are illustrated in Supplementary Figure 8 with respect to the wind direction. As can be observed in Supplementary Figure 8, the gNG values for both cases are almost identical for all wind directions. Values of gNG are fluctuating around 8. Recall that statistically, the extreme lower value (peak) of a process is equal to the mean of that same process minus the peak factor times the standard deviation. Since there is no observed reduction in the peak factor between both “parapets” and “no parapets” cases, this indicates that the addition of the perforated parapets helped reduce the mean as well as the standard deviation of the pressure time histories. This reinforced the findings previously stated in section Results of Mean and Peak Pressure Coefficients Cpmean and Cppeak.
Conclusion
Large-scale experimentation was performed to study the effectiveness of discontinuous perforated parapets in alleviating high suction at critical roof locations including roof corners, gable ends, ridges and eave intersection zones, especially under cornering winds. A design methodology for the parapet was presented based on available data on Reynolds number Re sensitivity for flow through screens and orifices along with the ease and cost of construction. The Partial Turbulence Simulation (PTS) methodology was used to allow testing of the large-scale models. Such simulations with deficient low-frequency spectral content allows for testing of larger model sizes so that model length scales are only limited by blockage considerations. This is a major advantage, because it allows for both testing at higher Reynolds number Re and better spatial resolution of the pressure taps in high pressure zones. Flow management devices were used in an open-jet 12-fan Wall of Wind facility to generate a turbulence spectrum with high frequency turbulence components similar to those of ABL flows. Note that the main objective of the current study was to evaluate the effectiveness of perforated parapets in mitigating roof suctions by comparing roof mean and peak pressures with and without the parapets. In addition, roof mean pressures for the 1:8 WOW model were compared to an identical model from the NIST database having a 1:100 scale.
The discontinuous perforated parapets were very effective in reducing the extreme wind suctions. The parapets were effective even though they were installed only at the corners and the ridges zones, indicating that full perimeter parapets are not necessary to mitigate the extreme suctions on the roof. The highest reduction achieved for corner taps was about 45% whereas the area-averaged reduction was approximately 43%. Overall, the discontinuous perforated parapets, which can be also used as architectural features, performed well in reducing high suctions at critical roof locations and did not have any unwanted effects on the remaining roof area. The Reynolds number Re similitude in the current testing ensured that results obtained on model roofs are representative of the reduction in uplift on the prototype roofs under cornering winds. It also ensured that such results are Re independent (for Re ≈ 104). With respect to the comparison between the 1:8 WOW model and the 1:100 NIST one, the trend of change of the mean pressure coefficients is similar. However, the gap between the results of both models could be attributed to the big difference between the respective Reynolds numbers Re, which confirms past findings that a decade of difference largely changes the mean pressure coefficients Cpmean.
It should be mentioned that more experimental and numerical investigation need to be performed to account for different other types of roof geometry and slopes with perforated parapets to arrive at a more general conclusion about the effectiveness of such a mitigation system. It is also desirable to involve near-roof-surface wind speed measurements using Irwin sensors (Irwin, 1981; Moravej et al., 2016, 2017) to correlate flow characteristics near the roof surface with the pressures. This study suggested an economic design for a certain mitigation technique capable of withstanding low to moderate hurricanes. The perforated parapets in question can be used as architectural features and retrofitted to existing buildings or constructed on new low-rise ones to improve roof performance. These devices can significantly reduce hurricane induced roof damage—one of the biggest concerns during hurricanes.
Data Availability Statement
All datasets generated for this study are included in the article/Supplementary Material.
Author Contributions
AG supervised the experiments and data analyses and revised the manuscript. ZA has carried out most of the data analyses and has written sections of this manuscript in collaboration with all the co-authors. FH and MM have helped with the data analyses and writing parts of the manuscript in addition to building the model. AG and AE helped in reviewing and interpreting results and providing input for enhancing the scientific value of the manuscript.
Funding
The authors would like to acknowledge the financial support from the National Science Foundation (NSF Award No. CMMI-1151003; NSF Award No. 1520853).
Conflict of Interest
The authors declare that the research was conducted in the absence of any commercial or financial relationships that could be construed as a potential conflict of interest.
Acknowledgments
The authors greatly acknowledge the help offered by Walter Conklin and Roy Liu-Marques to conduct the experiments at FIU Wall of Wind. The authors would also like to thank Mr. Bodhisatta Hajra for his support in some of the data analysis.
Supplementary Material
The Supplementary Material for this article can be found online at: https://www.frontiersin.org/articles/10.3389/fbuil.2019.00149/full#supplementary-material
Supplementary Figure 1. Tap layouts and lines chosen for comparison of WOW (left) and NIST (right) models.
Supplementary Figure 2. Cpmean variation along the eave end at 0° angle of attack.
Supplementary Figure 3. Cpmean variation along the gable end at 0° angle of attack.
Supplementary Figure 4. Cppeak variation along the gable end.
Supplementary Figure 5. Cppeak variation along the ridge.
Supplementary Figure 6. Location of the different areas on the corner of the roof.
Supplementary Figure 7. Location of the different areas on the ridge of the roof.
Supplementary Figure 8. gNG variation with respect to the wind angle of attack.
References
Aly, A. M., Bitsuamlak, G. T., and Gan Chowdhury, A. (2012). Full-scale aerodynamic testing of a loose concrete roof paver system. J. Eng. Struct. 44, 260–270. doi: 10.1016/j.engstruct.2012.05.008
Aly, A. M., Gan Chowdhury, A., and Bitsuamlak, G. (2011). Wind profile management and blockage assessment of a new 12-fan wall of wind facility at FIU. J. Wind Struct. 14, 285–300. doi: 10.12989/was.2011.14.4.285
Azzi, Z., Moravej, M., Elawady, A., and Chowdhury, A. G. (2018). “Roof uplift under cornering winds and wind uplift mitigation,” in Proceedings of the 5th American Association for Wind Engineering Workshop (Miami, FL).
Banks D. (2011). “Measuring peak wind loads on solar power assemblies,” in The 13th International Conference on Wind Engineering (Amsterdam).
Banks, D. (2000). The Suction Induced by Conical Vortices on Low-Rise Buildings With Flat Roofs (Ph.D. Thesis). Department of Civil Engineering, Colorado State University, Fort Collins, CO, United States.
Banks, D., Meroney, R. N., Sarkar, P. P., Zhao, Z., and Wu, F. (2000). Flow visualization of conical vortices on flat roofs with simultaneous surface pressure measurement. J. Wind Eng. Ind. Aerod. 84, 65–85. doi: 10.1016/S0167-6105(99)00044-6
Banks, D., Sarkar, P. P., Wu, F., and Meroney, R.N. (2001). “A device to mitigate vortex induced rooftop suction,” in Proceedings Americas Conference on Wind Engineering (ACWE) (Clemson, SC).
Baskaran, A., and Stathopoulos, T. (1998). Roof corner pressure loads and parapet configurations. J. Wind Eng. Ind. Aerod. 29, 79–88. doi: 10.1016/0167-6105(88)90147-X
Belloli, M., Rosa, L., and Zasso, A. (2014). Wind loads and vortex shedding analysis on the effects of the porosity on a high slender tower. J. Wind Eng. Ind. Aerod. 126, 75–86. doi: 10.1016/j.jweia.2014.01.004
Bienkiewicz, B., and Sun, Y. (1992). Local wind loading on the roof of a low-rise building. J. Wind Eng. Ind. Aerod. 45, 11–24. doi: 10.1016/0167-6105(92)90003-S
Bienkiewicz, B., and Sun, Y. (1997). Wind loading and resistance of loose-laid systems. J. Wind Eng. Ind. Aerod. 72, 401–410. doi: 10.1016/S0167-6105(97)00235-3
Bitsuamlak, G. T., Warsido, W., Ledesma, E., and Chowdhury, A. G. (2013). Aerodynamic mitigation of roof and wall corner suctions using simple architectural elements. J. Eng. Mech. 139, 396–408. doi: 10.1061/(ASCE)EM.1943-7889.0000505
Blessing, C., Gan Chowdhury, A., Lin, J., and Huang, P. (2009). Full-scale validation of vortex suppression techniques for mitigation of roof uplift. J. Eng. Struct. 31, 2936–2946. doi: 10.1016/j.engstruct.2009.07.021
Büker, O., Lau, P., and Tawackolian, K. (2013). Reynolds number dependence of an orifice plate. Flow Meas. Instrum. 30, 123–132. doi: 10.1016/j.flowmeasinst.2013.01.009
Carter, R., and Smith, D. (2009). “Parapet effects on full-scale wind-induced pressures,” in 11th Americas Conference on Wind Engineering (San Juan), 22–26.
Cheung, J. C. K., Holmes, J. D., Melbourne, W. H., Lakshmanan, N., and Bowditch, P. (1997). Pressure on a 1:10 scale model of the Texas tech building. J. Wind Eng. Ind. Aerod. 69–71, 529–538. doi: 10.1016/S0167-6105(97)00183-9
Chowdhury, A. G., Zisis, I., Irwin, P., Bitsuamlak, G., Pinelli, J. P., Hajra, B., et al. (2017). Large-scale experimentation using the 12-fan wall of wind to assess and mitigate hurricane wind and rain impacts on buildings and infrastructure systems. J. Struct. Eng. 143:04017053. doi: 10.1061/(ASCE)ST.1943-541X.0001785
Cochran, J. S., and English, E. (1997), Reduction of roof wind loads by architectural features. Architect. Sc. Rev. 40, 79–87. doi: 10.1080/00038628.1997.9697388
Crowe, C. T., Elger, D. F., Williams, B. C., and Roberson, J. A. (2009). Engineering Fluid Mechanics, 9th Edn. Hoboken, NJ: John Wiley and Sons, Inc.
Davenport, A. G. (1964). Note on the distribution of the largest value of a random function with application to gust loading. Proc. Inst. Civil Eng. 28, 187–196. doi: 10.1680/iicep.1964.10112
ESDU (2001). Characteristics of the Atmospheric Boundary Layer, Part II: Single Point Data for Strong Winds (Neutral Atmosphere). London: Engineering Sciences Data Unit, Item 85020.
ESDU (2007). Pressure Drop in Ducts Across Round-Wire Gauzes Normal to the Flow. London: Engineering Sciences Data Unit, Item 72009.
Geurts, C. P. W. (2000). “Wind loads on permeable roof covering products,” in Fourth Colloquium on Bluff Body Aerodynamics and Applications (Delft: Ruhr Universität Bochum), 511–514.
Habte, F., Mooneghi, M. A., Baheru, T., Zisis, I., Chowdhury, A. G., Masters, F., et al. (2017). Wind loading on ridge, hip and perimeter roof tiles: a full-scale experimental study. J. Wind Eng. Ind. Aerod. 166, 90–105. doi: 10.1016/j.jweia.2017.04.002
Hazelwood, R. A. (1981). The interaction of the two principal wind forces on roof tiles. J. Wind Eng. Ind. Aerod. 8, 39–48. doi: 10.1016/0167-6105(81)90006-4
Ho, T. C. E., and Surry, D. (2000). “Factory mutual–high resolution pressure measurements on roof panels,” in Boundary Layer Wind Tunnel Laboratory Report BLWT-SS11-2000, University of Western Ontario, London, ON.
Ho, T. C. E., Surry, D., and Morrish, D. (2003). NIST/TTU Cooperative Agreement – Windstorm Mitigation Initiative: Wind Tunnel Experiments on Generic Low Buildings. The Boundary Layer Wind Tunnel Laboratory, University of Western Ontario. (London, ON).
Ho, T. C. E., Surry, D., Morrish, D., and Kopp, G. A. (2005). The UWO contribution to the NIST aerodynamic database for wind loads on low buildings: part 1. Archiving format and basic Aerodynamic data. J. Wind Eng. Ind. Aerod. 93, 1–30. doi: 10.1016/j.jweia.2004.07.006
Hoxey, R. P., Reynolds, A. M., Richardson, G. M., Robertson, A. P., and Short, J. L. (1998). Observations of reynolds number sensitivity in the separated flow region on a bluff body. J. Wind Eng. Ind. Aerod. 73, 231–249. doi: 10.1016/S0167-6105(97)00287-0
Irwin, P. (1981). A simple omnidirectional sensor for wind tunnel studies of pedestrian level winds. J.Wind Eng. Ind. Aerod. 7, 219–239. doi: 10.1016/0167-6105(81)90051-9
Irwin, P. (2009). “Wind engineering research needs, building codes and project specific studies,” in 11th Americas Conference on Wind Engineering (San Juan).
Irwin, P., Cooper, K., and Girard, R. (1979). Correction of distortion effects caused by tubing systems in measurements of fluctuating pressures. J. Wind Eng. Ind. Aerod. 5, 93–107. doi: 10.1016/0167-6105(79)90026-6
Kawai, H., and Nishimura, H. (2003). “Field measurement on wind force on roof tiles,” in Proceedings of the 11th International Conference on Wind Engineering, International Association for Wind Engineering and American Association for Wind Engineering (Lubbock, TX: Texas Tech University), 599–606.
Kopp, G. A., and Banks, D. (2013). Use of the wind tunnel test method for obtaining design wind loads on roof-mounted solar arrays. J. Struct. Eng. 139, 284–287. doi: 10.1061/(ASCE)ST.1943-541X.0000654
Kopp, G. A., Mans, C., and Surry, D. (2005). Wind effects of parapets on low buildings: part 4. Mitigation of corner loads with alternative geometry. J. Wind Eng. Ind. Aerod. 93, 873–888. doi: 10.1016/j.jweia.2005.08.004
Kwon, D. K., and Kareem, A. (2011). Peak factors for non-gaussian load effects revisited. J. Struct. Eng. 137, 1611–1619. doi: 10.1061/(ASCE)ST.1943-541X.0000412
Letchford, C. W., Row, A., Vitale, A., and Wolbers, J. (2000). Mean wind loads on porous canopy roofs. J. Wind Eng. Ind. Aerod. 84, 197–213. doi: 10.1016/S0167-6105(99)00103-8
Lin, J. X., and Surry, D. (1993). “Suppressing extreme suction on low buildings by modifying the roof corner geometry,” in Proceedings of the 7th US National Conference on Wind Engineering (Los Angeles, CA), 413–422.
MDC-BCCO (2006). Post Hurricane Wilma Progress Assessment. Miami, FL: Miami-Dade County Building Code Compliance Office, 1–22.
Melbourne, W. H. (1980). Turbulence effects on maximum surface pressures – a mechanism and possibility of reduction. Proc. Int. Conf. 1, 541–551. doi: 10.1016/B978-1-4832-8367-8.50055-3
Mooneghi, M. A., Irwin, P., and Chowdhury, A. G. (2016). Partial turbulence simulation method for predicting peak wind loads on small structures and building appurtenances. J. Wind Eng. Struct. Aerod. 157, 47–62. doi: 10.1016/j.jweia.2016.08.003
Moravej, M. (2018). Investigating Scale Effects on Analytical Methods of Predicting Peak Wind Loads on Buildings. (FIU Electronic Theses and Dissertations). Florida International University, Paper 4939, Miami, FL, United States.
Moravej, M., Hajra, B., Irwin, P., and Chowdhury, A. G. (2016). “An experimental investigation on the effects of building height on velocity coefficients and local wind pressure on building roofs,” in Proceedings of the 4th American Association for Wind Engineering Workshop (Miami, FL).
Moravej, M., Irwin, P., Zisis, I., Chowdhury, A. G., and Hajra, B. (2017). Effects of roof height on local pressure and velocity coefficient on building roofs. Eng. Struct. 150, 693–710. doi: 10.1016/j.engstruct.2017.07.083
National Oceanic and Atmospheric Administration (NOAA) (2013). Population Trends From 1970 to 2020. Silver Spring, MD: National Costal Population Report.
Parmentier, B., Schaerlaekens, S., and Vyncke, J. (2000). Evaluation of The Peak Forces on Roof Tiles Under Stormy Conditions. Abnormal Loading on Structures: Experimental and Numerical Modelling, 22.
Peterka, J. A., Cermak, J. E., Cochran, L. S., Cochran, B. C., Hosoya, N., Derickson, R. G., et al. (1997). Wind uplift model for asphalt shingles. J. Architect. Eng. 3, 147–155. doi: 10.1061/(ASCE)1076-0431(1997)3:4(147)
Pindado, S., and Meseguer, J. (2003). Wind tunnel study on the influence of different parapets on the roof pressure distribution of low-rise buildings. J. Wind Eng. Ind. Aerod. 91, 1133–1139. doi: 10.1016/S0167-6105(03)00055-2
Richards, P. J., Hoxey, R. P., Connell, R. P., and Lander, D. P. (2007). Wind-tunnel modelling of the Silsoe Cube. J. Wind Eng. Ind. Aerod. 95, 1384–1399. doi: 10.1016/j.jweia.2007.02.005
Richards, P. J., and Robinson, M. (1999). Wind loads on porous structures. J. Wind Eng. Ind. Aerod. 83, 455–465. doi: 10.1016/S0167-6105(99)00093-8
Rizzo, F., Barbato, M., and Sepe, V. (2018). Peak factor statistics of wind effects for hyperbolic paraboloid roofs. Eng. Struct. 173, 313–330. doi: 10.1016/j.engstruct.2018.06.106
Robertson, A., Hoxey, R., Rideout, N., and Freathy, P. (2007). Full-scale study of wind loads on roof tiles and felt underlay and comparisons with design data. J. Wind Struct. 10, 495–510. doi: 10.12989/was.2007.10.6.495
Saathoff, P. J., and Melbourne, W. H. (1997). Effects of free-stream turbulence on surface pressure fluctuation in a separation bubble. J. Fluid Mech. 337, 1–24. doi: 10.1017/S0022112096004594
Simiu, E., Vickery, P., and Kareem, A. (2007). Relation between saffir-simpson hurricane scale wind speeds and peak 3-s gust speeds over open terrain. J. Struct. Eng. 133, 1043–1045. doi: 10.1061/(ASCE)0733-9445(2007)133:7(1043)
Stathopoulos, T., and Baskaran, A. (1987). Wind pressures on flat roofs with parapets. J. Struct. Eng. 113, 2166–2180. doi: 10.1061/(ASCE)0733-9445(1987)113:11(2166)
Suaris, W., and Irwin, P. (2010). Effect of roof-edge parapets on mitigating extreme roof suctions. J. Wind Eng. Ind. Aerod. 98, 483–491. doi: 10.1016/j.jweia.2010.03.001
Suresh, K., and Stathopoulos, T. (1998a), Power spectra of wind pressures on low building roofs. J. Wind Eng. Ind. Aerod. 74–76, 665–674. doi: 10.1016/S0167-6105(98)00060-9
Suresh, K., and Stathopoulos, T. (1998b). Spectral density functions of wind pressures on various low building roof geometries. Wind Struct. 1, 203–223. doi: 10.12989/was.1998.1.3.203
Surry, D., and Lin, X. J. (1995). The effect of surroundings and roof corner geometric modifications on roof pressures on low-rise buildings. J. Wind Eng. Ind. Aerod. 58, 113–138. doi: 10.1016/0167-6105(95)00016-K
Tecle, A., Bitsuamlak, G., Suksawang, N., Gan Chowdhury, A., and Fuez, S. (2013). Ridge and field tile aerodynamics for a low-rise building: a full-scale study. Wind Struct. 16, 301–322. doi: 10.12989/was.2013.16.4.301
Tieleman, H. W. (2003). Wind tunnel simulation of wind loading on low-rise structures: a review. J. Wind Eng. Ind. Aerod. 91, 1627–1649. doi: 10.1016/j.jweia.2003.09.021
Tieleman, H. W., Hajj, M. R., and Reinhold, T. A. (1998). Wind tunnel simulation requirements to assess wind loads on low-rise buildings. J. Wind Eng. Ind. Aerod. 74–76, 675–685. doi: 10.1016/S0167-6105(98)00061-0
Visscher, B., and Kopp, G. A. (2007). Trajectories of roof sheathing panels under high winds. J. Wind Eng. Ind. Aerod. 95, 697–713. doi: 10.1016/j.jweia.2007.01.003
Winterstein, S. R., and Kashef, T. (2000). Moment-based load and response models with wind engineering applications. J. Sol. Energy Eng. 122, 122–128. doi: 10.1115/1.1288028
Winterstein, S. R., Ude, T. C., and Kleiven, G. (1994). “Springing and slow-drift responses: predicted extremes and fatigue vs. simulation,” in Proceedings of the Seventh International Conference on the Behavior of Offshore Structures (Cambridge, MA).
Keywords: low-rise building, roof uplift mitigation, partial turbulence simulation, perforated parapets, reynolds number, wall of wind
Citation: Azzi Z, Habte F, Elawady A, Gan Chowdhury A and Moravej M (2020) Aerodynamic Mitigation of Wind Uplift on Low-Rise Building Roof Using Large-Scale Testing. Front. Built Environ. 5:149. doi: 10.3389/fbuil.2019.00149
Received: 15 May 2019; Accepted: 18 December 2019;
Published: 15 January 2020.
Edited by:
Brian M. Phillips, University of Florida, United StatesReviewed by:
Abul Fahad Akon, University of Western Ontario, CanadaFabio Rizzo, Università degli Studi G. d'Annunzio Chieti e Pescara, Italy
Copyright © 2020 Azzi, Habte, Elawady, Gan Chowdhury and Moravej. This is an open-access article distributed under the terms of the Creative Commons Attribution License (CC BY). The use, distribution or reproduction in other forums is permitted, provided the original author(s) and the copyright owner(s) are credited and that the original publication in this journal is cited, in accordance with accepted academic practice. No use, distribution or reproduction is permitted which does not comply with these terms.
*Correspondence: Arindam Gan Chowdhury, Y2hvd2RodXJAZml1LmVkdQ==