 Jean Lucas dos Passos Belo
 Jefferson Lins da Silva
- 1Department of Civil Engineering, Aeronautical Infrastructure Engineering, Technological Institute of Aeronautics, São José dos Campos, Brazil
- 2Laboratory of Geosynthetics, Department of Geotechnical Engineering, São Carlos School of Engineering, University of São Paulo, São Carlos, Brazil
Geosynthetic reinforcement has become a very practical technique to improve geotechnical structure safety. In spite of improved soil behavior, structures are affected by uncertainties related to soil and reinforcement material properties. This paper aims to present a reliability analysis in order to take statistical information (uncertainties) into account in a safety analysis of reinforced embankments. The analysis was used in a case study on a controlled stage-constructed embankment on soft ground in order to investigate its probabilistic stability. Modeling was performed by commercial geotechnical software usage (GeoStudio and RocScience packs, SIGMA/W+SLOPE/W, and SLIDE3, respectively) and the reliability structural analysis was acquired by coupling this software with a reliability program. Then, two numerical models were simulated: a 2D and a 3D one. For this application, the First Order Reliability Method (FORM) was assumed for the reliability analyses. The statistical information, as well as the correlation between variable pairs, was based on a literature review. In total, 29 parameters were assumed as random variables (splitting parameters from different zones and layers). At the same time, the influence of the uncertainty level on reliability analysis and the sensitivity of parameters (assumed as random variables) were investigated. As a result, the reliability indexes obtained showed that the structure analyzed should not be considered with a satisfactory safety level. Meanwhile, the uncertainty level assumed for random variables can lead the probabilistic analysis to very different conclusions about the structural safety, and the most sensitivity parameters observed were the bulk unit weight (clay—soft soil—and fill material) and the undrained shear strength, followed by a slight importance of the initial void ratio.
Introduction
Soil retaining structures are, sometimes, essential for several engineering constructions and designs. Generally, these structures are conceived and constructed by using cyclopean or reinforced concrete, anchored or not. However, with increasing soil heights to contain and eventual poor foundation soils, the cost of these structures has increased considerably. Therefore, an alternative system has arisen to deal with these conditions. For example, according to Elias et al. (2001), the advantages provided by using geosynthetic materials to reinforce soil structures are noted under these conditions. Besides, the polymeric material can be employed with other solutions to improve lateral support, such as exposed by Fattah et al. (2015, 2016a,b).
Many deterministic methods have been proposed aiming to determine the key design features of geosynthetic-reinforced soil structures (Koerner, 2012; Ariyarathne and Liyanapathirana, 2015; Fonseca and Palmeira, 2018). Nevertheless, nowadays, probabilistic analysis, or reliability analysis, has gained attention, and is widely used in diverse areas. In the geotechnical area or, more specifically, in slope stability problems, this growing attention is easily noted. The main factor that improves this importance for geotechnical problems is the uncertainty associated with the material, i.e., soil. In particular, natural soil presents a great spatial variability, varying in all directions of space, but may also vary over time as a result of other factors, such as the environmental condition changes (precipitation, temperature, vegetation, water table, etc.) and anthropogenic conditions (superficial surcharge, profile modifications, materials insertion, etc.).
Since its first steps, reliability analysis used in slope stability has shown significant advantages (Cornell, 1971; Tang et al., 1976; McGuffey et al., 1982). Thus, this analysis has been more and more studied and performed, presenting many improvements over time. For example, in the beginning, only one pre-specified slip surface was investigated. After that, studies started to determine the deterministic critical slip surface and assumed it as a slip surface for probabilistic analysis. However, some authors affirmed that the deterministic and probabilistic slip surfaces were not coincident (Chowdhury and Tang, 1987; Li and Lumb, 1987). Therefore, probabilistic analysis used in the Limit Equilibrium Method (LEM) emerged, which was later adopted in the Finite Element Method (FEM).
Generally, the Monte Carlo simulation (MCS) is the most assumed method in order to perform probabilistic analyses of slopes stability (Genevois and Romeo, 2003; Chalermyanont and Benson, 2005; Salgado and Kim, 2014; Ferreira et al., 2016; Xia et al., 2017). This method is already available in most commercial geotechnical programs, making it even more common and easy to use. However, there are limitations to this usage, such as limited random variables, distribution types, statistical input information, analysis monitoring, and high computational costs. The high computational costs are the main limitation faced by the method because they require a significant number of samples in order to achieve an effective approximation of the failure probability, reducing this usability in design practice.
Nevertheless, there are alternative methods that aim to reduce this computational cost, such as transformation methods (analytical methods). Some examples are First-Order Second-Moment (FOSM), First-Order Reliability Method (FORM), and Second-Order Reliability Method (SORM). These methods usually speed-up the analyses and achieve good estimation for Pf and β values, when compared to MCS. Therefore, some authors have studied and adopted these methods in probabilistic analyses of slope stability (Xu and Low, 2006; Low, 2014; Wang et al., 2017; Xia et al., 2017).
In spite of the fact that recent studies have used alternative methods to carry out these probabilistic analyses, few studies have been carried out to evaluate geosynthetic-reinforced structures (Low and Tang, 1997; Ferreira et al., 2016; Luo and Bathurst, 2017). Studies that address these analyses and the alternative methods with well-known commercial geotechnical programs are even rarer, which does not encourage, or facilitate, the probabilistic analyses in practice, mainly via alternative methods that could significantly reduce the involved computational costs and achieve accurate results.
Therefore, this paper aims to present a reliability analysis in order to take statistical information (uncertainties) into account in a safety analysis of geosynthetic-reinforced embankments. To that end, an alternative reliability evaluation method was used, the FORM, and two well-known commercial geotechnical programs were adopted (GeoStudio and RocScience). The analysis was carried out using a reported case study of a controlled stage-constructed embankment on soft ground (Chai and Bergado, 1993) to investigate its probabilistic stability for each stage.
Methods
Monte Carlo Simulation
The Monte Carlo simulation technique is the most common and used in practice and in the literature. This technique allows users to solve complex systems without limitations of complexity and number of variables, solving all of them just as easily and providing unbiased estimations. Conceptually, the method is simple, easy to implement, accurate and robust. The only limitation is associated with the computational capacity.
In structural analysis terms, simulation can be understood as a numerical way to simulate impractical experiments. The experiment consists of “testing” the structure for “all” possible combinations of resistances and solicitations. The probability of failure is estimated by calculating the relationship between the failure samples and the total of simulated samples.
Note that the variance in results is inversely proportional to the number of simulated samples. According to Melchers and Beck (2017), the MCS requires around 10(p+2) samples in order to achieve a good estimative of Pf, where p assumes the order expected for the Pf of the analyzed structure (Pf = x·10−p). Therefore, a very high number of simulation samples can be required to evaluate a structure when expecting a significant low Pf, turning it into an impractical analysis due to its high computational costs.
Analytical Reliability Methods
In the literature, the main three analytical methods in use are FOSM, FORM, and SORM, all based on the transformation method proposed by Hasofer and Lind (1974). The transformation consists of mapping the random variables from the design space (𝕏, dimensional space) to the standard normal space (𝕐, dimensionless space, where random variables assume that means equal zero and standard deviations equal the unit).
Melchers and Beck (2017) address these three methods. In the FOSM solution, the limit state function [g(x)] is approximated by a linear function. The statistical information is limited up to the second-order moments (μ e σ). The method is simple to implement, and random variable distributions do not need to be reported but note that due to the limitation of statistical moments, it is equivalent to assuming the random variables with normal distributions. This hypothesis limits the solution of practical problems, mainly in significant non-linearity conditions of the performing function.
Nevertheless, the FORM, which is based on FOSM, allows the solution to take into account all statistical information about the random variables assumed for the problem. The statistical information includes the non-normal marginal distributions, as well as the correlation coefficients between variable pairs. In the FORM, the correlations are processed by the model proposed by Nataf (1962) and by the orthogonal decomposition or the Cholesky factorization (presented by Benoît, 1924) of the correlation matrix.
Limit State Function
Studies usually assume the limit state function as g(X) = FS(X)−1. FS is the ratio between the sum of resisting (R) to activating (A) forces and/or moments along the slip surface, and X is the vector of random variables. However, note that this function introduces non-linearity to the evaluation, and as great as the non-linearity is, the advantages of using analytical methods are lost, increasing the computational costs. In some cases, non-linearity can lead the analysis to a non-convergence condition or equivocated results. Therefore, authors assumed another function for the performing function in order to avoid or reduce this possibility, g(X) = R(X) − A(X).
Case Study
The reliability analysis was used in a reported case, a controlled stage-constructed and reinforced embankment on soft ground, presented by Chai and Bergado (1993). The reinforcement was achieved by introducing a geogrid into the structure, i.e., the geosynthetic element. In addition to the reinforcement, vertical drains were installed into the soft clay layer in order to accelerate the settlement process and, consequently, the gain of resistance and stability of the structure.
Figure 1 shows the soil profile and the embankment geometry. On the one hand, according to Chai and Bergado (1993), the soil profile is comprised of a weathered crust at the top 2 meters which is underlain by about 5 meters of very soft silty clay. Adjacent to this layer is a 10 meters thick layer of soft clay which in turn is underlain by about 0.6 meters of peat. Finally, a thick deposit of medium dense to dense clayey silty sand is found below the peat layer.
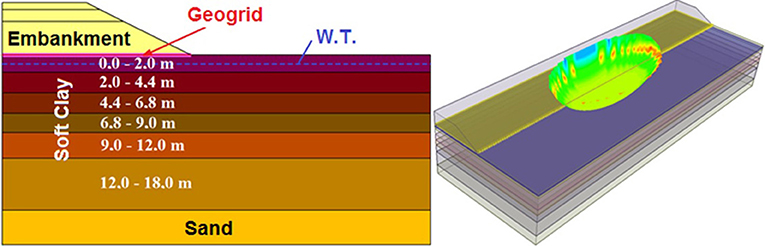
Figure 1. Embank geometry (model via GeoStudio and RocScience).
On the other hand, the embankment has a base width of 44 meters, it is 50 meters long and has a crest width of 11.46 meters (final configuration), and 6.07 and 5.27 meters high for conditions with and without the surcharge layer, respectively. In total, five stages were assumed for the analyses: three constructive stages (two fill stages and one surcharge removal stage); and two non-constructive stages associated with the settlement process. The material parameters were based on the reference study. In short, Tables 1, 2 present the stages and parameters assumed for modeling, respectively.
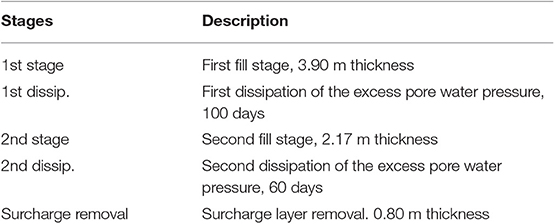
Table 1. Stages assumed for analysis.
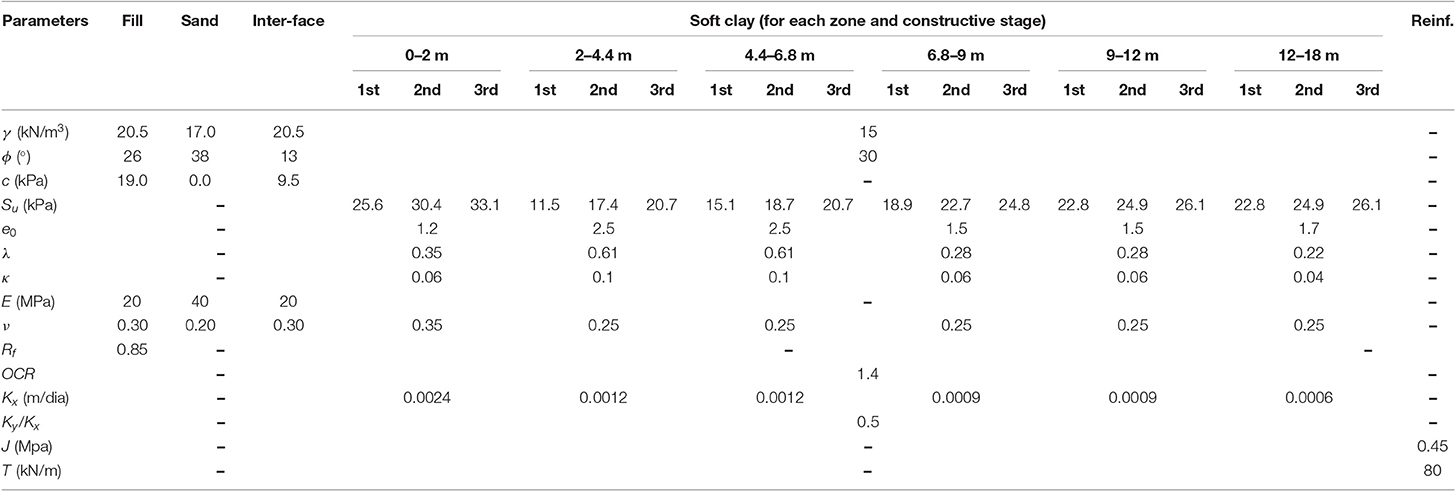
Table 2. Input parameters of the models.
Well-known commercial geotechnical software, such as GeoStudio (SIGMA/W and SLOPE/W) and RocScience (SLIDE3), were used in order to perform the modeling. On the one hand, for the GeoStudio analyses, the stability verification was performed by stress-strain analyses. The SIGMA/W obtained the stress-strain state and then passed it on to SLOPE/W in order to carry out the stability analysis. On the other hand, RocScience performed the stability verification by using the limit equilibrium method (LEM), Morgenstern-Price precisely, but only to the final stage configuration. At this moment, only one configuration is assumed to enable the probabilistic analysis because this evaluation process, of the three-dimensional model, increases the data amount involved in the modeling, then high computational processing is required.
Table 3 presents the constitutive models assumed for each material. Circular and elliptical slip surfaces were assumed for models performed in GeoStudio and RocScience, respectively.
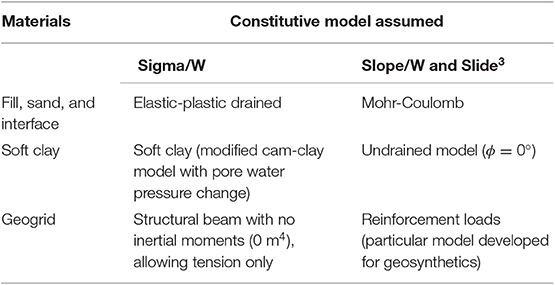
Table 3. Materials and constitutive models assumed for each.
The soft clay layer was divided into horizontal parts. This division allowed the model to take into account the gain of resistance of foundation material due to the increasing vertical effective stress (Δσv′). Δσv′ results from the embankment filling and the dissipation of excess pore water pressure over time. Besides, the layer division was also applied to the vertical direction that allows the model to consider the increase in resistance with depth. Table 2 shows the calculated and assumed values for each zone (split parts) of the foundation.
Among the parameters, specific weight (γ), cohesion (c), undrained shear strength (Su), friction angle (ϕ), Young modulus (E), overconsolidation ratio (OCR), initial void ratio (e0), lambda and kappa (λ and κ, parameters related to the soil compression, inputs of Cam-Clay constitutive model), hydraulic conductivity (K), and stiffness modulus (J), and tensile strength (T) of the reinforcing material were assumed as random variables. The number of random variables for each analysis was limited by the analysis complexity.
Based on the literature, Table 4 presents statistical information about some geotechnical parameters. The distribution types and statistical moments related to these distributions are the main pieces of information collected.
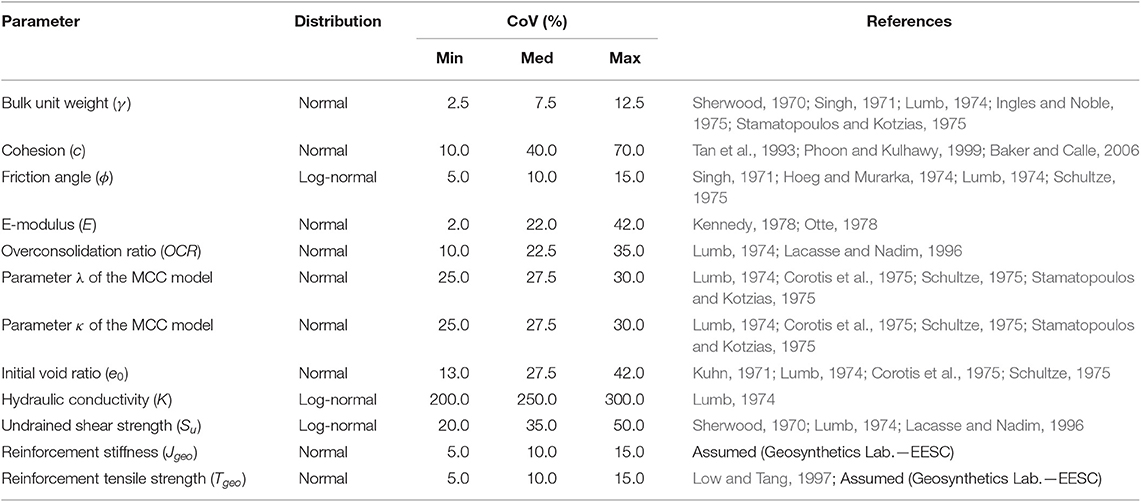
Table 4. Distribution and CoV of parameters assumed as random variables.
The correlation between variable pairs is another piece of relevant statistical information that has to be taken into account when performing probabilistic analyses. Table 5 shows the assumed correlation matrix for the problem. The matrix is based on applications and studies performed by Azzouz et al. (1976) and Low and Tang (1997). Since the LEM analysis needs a lower number of parameters when compared to stress-strain analysis, the correlation matrix may be reduced to the combination of highlighted terms of the basis matrix (Table 5).
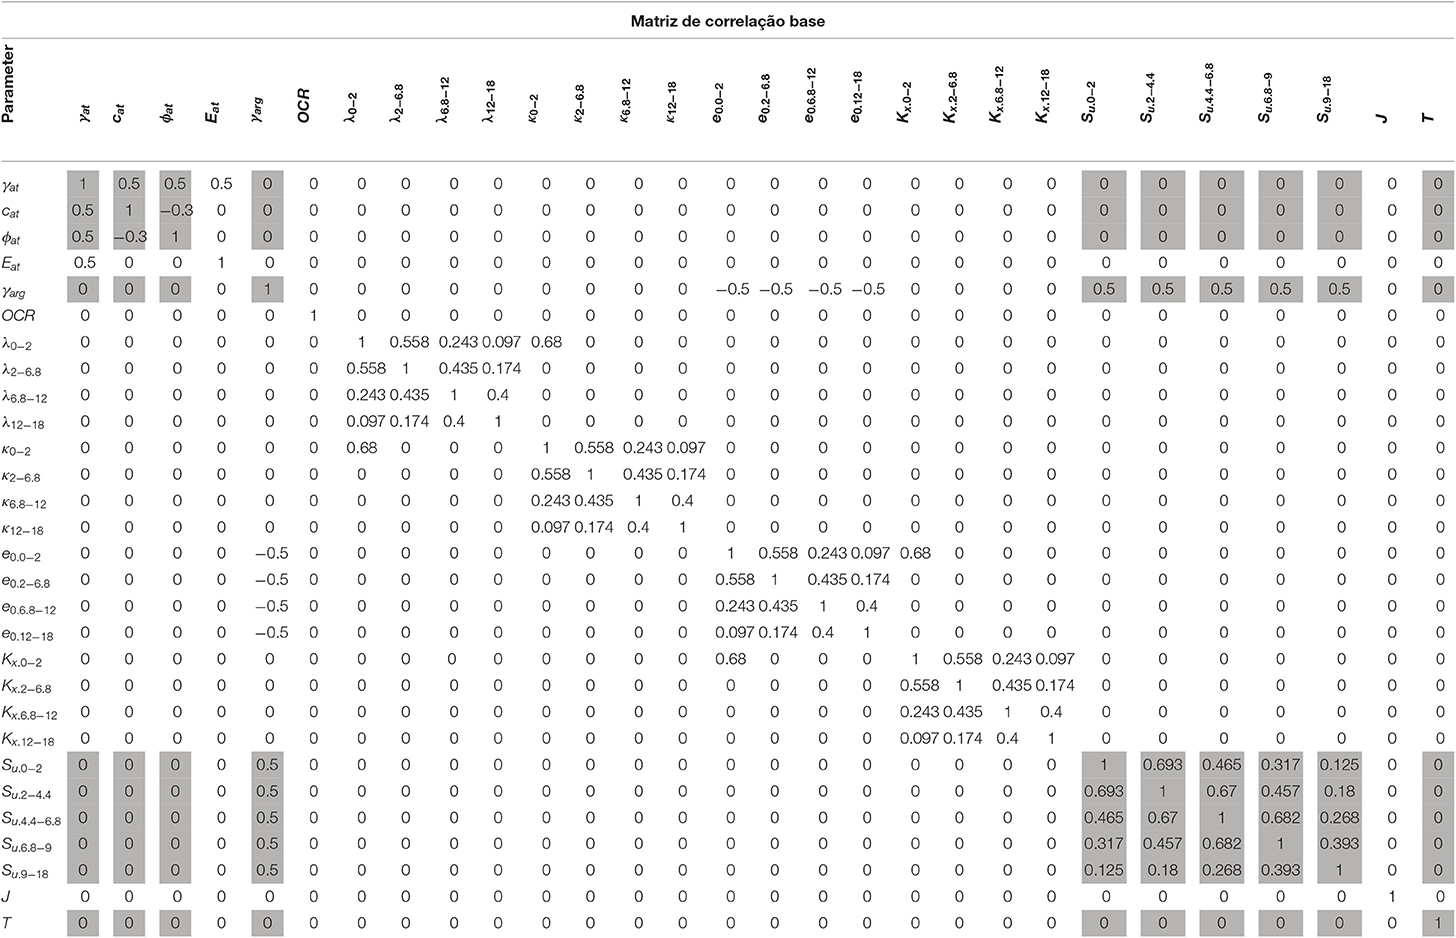
Table 5. Basis correlation matrix for reliability analyses of the models.
The spatial correlation assumed for random variables, in the horizontal and vertical directions, was calculated by performing the exponential model, Equation 1, as applied by Low and Tang (1997).
Results and Discussions
Model Validation
Initially, deterministic analyses were performed in order to validate the model. The calculated excess pore water pressures and factors of safety were compared with Chai and Bergado (1993) published values. These comparisons are presented as follows.
Excess Pore Water Pressure
Figure 2 presents a comparison between excess pore water pressures. It is worth mentioning that, according to Chai and Bergado (1993), the reference values are associated with another similar embankment that has the same foundation profile, and therefore, obtained very similar responses. Therefore, the variations in results are most significant in the analysis of the intermediate stage, which may be explained by associating these variations to the difference in the embankments' height at this moment (5.70 < 6.07 meters). Yet, the results were satisfactory, validating the model, and thus enabling us to proceed with the analyses.
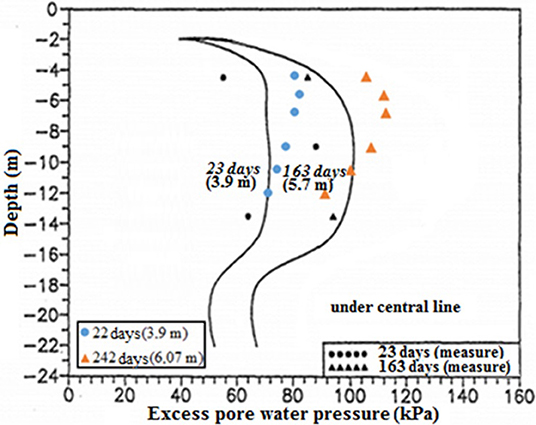
Figure 2. Comparison between results of excess pore water pressure (adapted from Chai and Bergado, 1993, with permission from Bergado).
Deterministic Results
Figure 3 shows the factors of safety obtained by deterministic stability analyses. In the reference study, the authors affirm that the reinforcement insertion was implemented in order to achieve factors of safety around 1.3 for constructive stages. By considering the obtained results, note that the acquired factors were <1.3 and the target was beaten only once when analyzing the final period of the first consolidation stage. In the final configuration, the acquired factor was very close to that reported by Chai and Bergado (1993), both around 1.22.
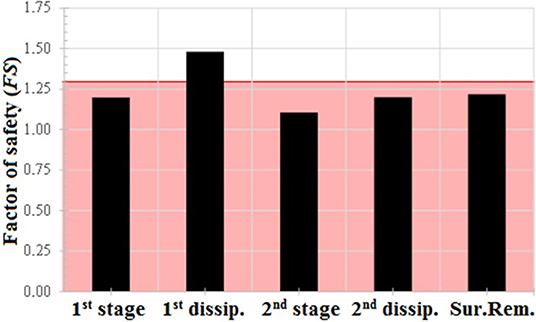
Figure 3. The factor of safety (FS) vs. stages (SIGMA/W + SLOPE/W).
Reliability Indexes
In the literature, Low and Tang (1997) also carried out a probabilistic analysis of this same case study (Chai and Bergado, 1993). However, the values of the coefficients of variation assumed for the problem were lower than the minimum values applied here, based on a literature review. Hence, in addition to the performed analyses, analyses assuming the CoV values adopted by Low and Tang (1997) were also carried out in order to compare these results. Table 6 presents these CoV values.
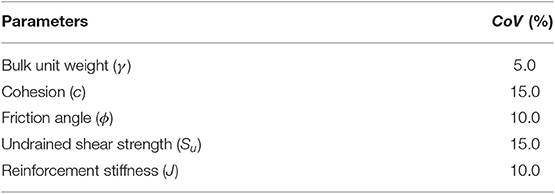
Table 6. Parameters and CoV assumed by Chowdhury and Tang (1987).
Thus, Figure 4 allows the comparison between both assumed configurations. First, the model considers the medium CoV values and all random values assumed (complete correlation matrix). Second, the model considers the CoV values adopted by Low and Tang (1997) and a reduced number of random variables, in order to comply with the authors' assumption (gray values of the basis correlation matrix). Note that the β behavior with stages was very similar for both configurations. For the Low and Tang (1997) configuration, the achieved indexes were significantly higher than others, which was coherent with the assumption of low CoV. Low and Tang (1997) analyzed only the final stage configuration, assuming a β value of 1.84, which was similar to that acquired in this study, around 1.77. This small difference may be associated with the assumed calculation methods or models, even with some geometry simplifications assumed by both the authors and Low and Tang (1997).
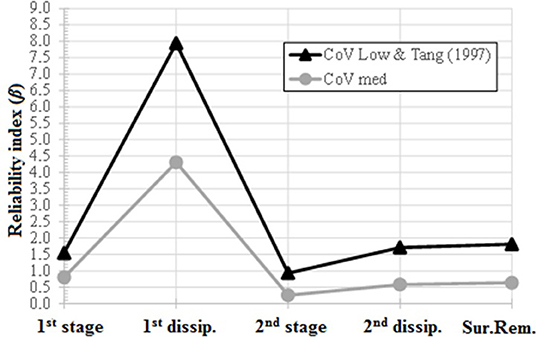
Figure 4. Reliability indexes vs. stages, considering both medium and Low and Tang (1997) CoV levels (SIGMA/W + SLOPE/W).
Note that either assuming medium values or Low and Tang (1997) values for CoV, unsatisfactory safety conditions were reached (β < 2.5 during construction, and β < 3 at final stage), except for the first dissipation stage.
Influence of Uncertainty Level
Analyses considering four levels of CoV values (Low and Tang, 1997; minimum; medium; and maximum) were performed in order to evaluate their influence (uncertainty level) into probabilistic analyses. Figure 5 shows the results.
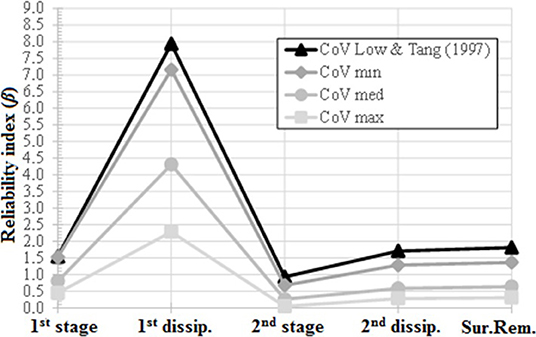
Figure 5. Reliability indexes vs. stages, evaluation of uncertainty level influence (SIGMA/W + SLOPE/W).
In spite of the fact that different levels result in discrepant values of β, the overall behavior of this index was very similar in stages for each assumed uncertainty level. In addition, as expected, low uncertainty levels drove to high β, or safety levels. Note that the highest variation of the index was associated with the first dissipation stage, which varied from β = 2.29 (CoV maximum), considered with a safety level below average (USACE, 1997), to β = 8.01 (CoV assumed by Low and Tang, 1997), considered above the high safety level specified by USACE (1997).
Sensitivity Analysis
The sensitivity analysis is important to identify which random variables, or parameters, are more influencers to the structural safety in a probabilistic analysis condition. Therefore, the sensitivity analysis was performed by considering two conditions. First, a probabilistic analysis assuming all the random variables (contained in the basis correlation matrix) with medium CoV level. Second, a probabilistic analysis assuming only the random variables adopted by Low and Tang (1997), as well as the adopted CoV. Figure 6 shows the results.
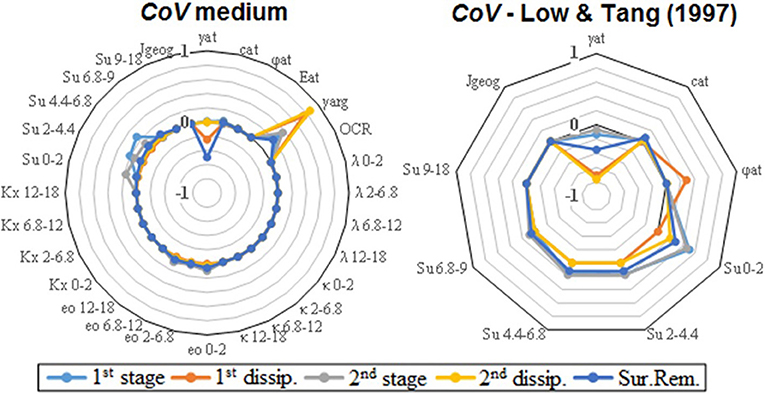
Figure 6. Sensitivity analysis of the random variables of the model, considering both medium and Low and Tang (1997) CoV levels (SIGMA/W+SLOPE/W).
On the one hand, note that most of the assumed random variables are not influencers, which may be treated as deterministic variables. On the other hand, random variables that are significantly more sensitive were similar for both configurations (γfill and Su, for different layer zones). Besides, there is a significant sensitivity associated with γclay for the analysis that assumed more random variables, which was a parameter not considered by Low and Tang (1997).
Finally, note also that the parameters associated with the initial void ratios (e0) of each layer exhibited a slight sensitivity, which also may be assumed as deterministic. However, it should be interesting to assume these parameters as random variables, even not showing high sensitivities, in order to approximate the real probability of the failure condition.
Three-Dimensional Analysis—Final Configuration
As mentioned, a three-dimensional analysis was carried out using the SLIDE3, belonging to the RocScience pack. Table 3 presents the constitutive models assumed for each material. The stability analysis was carried out by assuming elliptical slip surfaces for this three-dimensional model. Besides, for the probabilistic performance, the medium CoV level was assumed.
Figure 7 presents the acquired results for both deterministic and probabilistic analyses. Note that both FS and β values were coherent and close to the previous results, evaluated via two-dimensional analysis (FS = 1.28, and β = 1.55). Therefore, a two-dimensional analysis may be sufficient for the proposal of this analysis. This condition would change just in case of considerate the spatial variability over the three coordinate axes into the analysis.
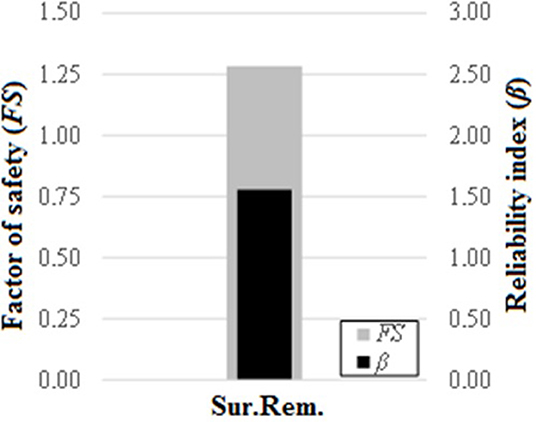
Figure 7. Deterministic and probabilistic results for the three-dimensional analysis (SLIDE3).
Conclusions
This paper aimed to present a reliability analysis to consider statistical information in a safety analysis of reinforced embankments. The analysis was used in a case study of a controlled stage-constructed embankment on soft ground, reported by Chai and Bergado (1993). The conclusions about this analysis are as follows:
• Deterministically, the embankment was satisfactorily modeled, reaching the same FS published by Chai and Bergado (1993), for the final configuration (around 1.22). Besides, the excess pore water pressures acquired by the model agrees with the field-measured values. However, the reached FS values for all stages were below the predefined acceptance level.
• Probabilistically, the structure also assumed low safety levels, which were more a matter of concern than deterministic results (β < 1, or Pf > 16%, for 4 out of all five stages, assuming medium CoV).
• The β obtained by this paper for the final structure configuration (around 1.77) was compared with the index presented by Low and Tang (1997) (1.84), which was very similar. This slight difference was associated with some alterations and simplifications made to the model geometry, when compared with those presented by Chai and Bergado.
• The uncertainty level assumed for random variables in the analysis proved to be quite significant for the evaluations, greatly influencing the β values.
• The sensitivity analysis showed that the main sensitivity variables for the problem evaluation were Su, γclay, and γfill. This result was acquired for both medium CoV and CoV, adopted by Low and Tang (1997) analysis.
• A three-dimensional analysis was carried out for the final configuration of the structure. The FS and β values were very coherent with results obtained via a two-dimensional analysis. This result demonstrates that a two-dimensional analysis may be sufficient for this proposal, requiring lower computational costs than three-dimensional evaluations.
Data Availability Statement
All datasets generated for this study are included in the article/supplementary material.
Author Contributions
All authors listed have made a substantial, direct and intellectual contribution to the work, and approved it for publication.
Conflict of Interest
The authors declare that the research was conducted in the absence of any commercial or financial relationships that could be construed as a potential conflict of interest.
Acknowledgments
The authors would like to thank the financial support from CAPES and the Laboratory of Geosynthetics at the Department of Geotechnical Engineering and the Department of Structural Engineering at the University of São Paulo (USP) that provided the GeoStudio, RocScience, and StRAnD software for this study.
References
Ariyarathne, P., and Liyanapathirana, D. S. (2015). Review of existing design methods for geosynthetic-reinforced pile-supported embankments. Soils Found. 55, 17–34. doi: 10.1016/j.sandf.2014.12.002
Azzouz, A. S., Krizek, R. J., and Corotis, R. B. (1976). Regression analysis of soil compressibility. Soils Found. 16, 19–29. doi: 10.3208/sandf1972.16.2_19
Baker, J., and Calle, E. (2006). Joint Committee on Structural Safety Probabilistic Model Code, Section 3.7: Soil Properties, Updated Version. Technical Report, Joint Committee on Structural Safety (JCSS).
Benoît, C. (1924). Note sur une méthode de résolution des équations normales provenant de l'application de la méthode des moindres carrés à un système d'équations linéaires en nombre inférieur à celui des inconnues (Procédé de Commandant Cholesky). Bull. Géodetic Sci. 2, 67–77. doi: 10.1007/BF03031308
Chai, J., and Bergado, D. T. (1993). Performance of reinforced embankment on Muar Clay deposit. Soils Found. 33, 1–17. doi: 10.3208/sandf1972.33.4_1
Chalermyanont, T., and Benson, C. H. (2005). Reliability-based design for external stability of mechanically stabilized earth walls. Int. J. Geomech. 5, 196–205. doi: 10.1061/(ASCE)1532-3641(2005)5:3(196)
Chowdhury, R. N., and Tang, W. H. (1987). “Comparison of risk models for slopes,” in Proceedings of the 5th International Conference on Application of Statistics and Probability in Soil and Structural Engineering (Vancouver, BC), 863–869.
Cornell, C. A. (1971). “First order uncertainty analysis of soils deformations and stability,” in Proceedings of the 1st International Conference on Application of Statistics and Probability in Soil and Structural Engineering (Hong Kong: Hong Kong University Press), 129–144.
Corotis, R. B., Azzouz, A. S., and Krizek, R. (1975). “Statistical evaluation of soil index properties and constrained modulus,” in Proceedings of the 2nd International Conference on Application of Statistics and Probability in Soil and Structural Engineering (Aachen), 273–294.
Elias, V., Christopher, B. R., and Berg, R. R. (2001). Mechanically Stabilized Earth Walls and Reinforced Soil Slopes – Design and Construction Guidelines, Federal Hwy. Administration Rep. No. FHWA-NH1–00-43. U.S. Department of Transportation, Federal Highway Administration, National Highway Institute, Washington, DC.
Fattah, M. Y., Mohammed, H. A., and Hassan, H. A. (2016a). Load transfer and arching analysis in reinforced embankment. Proc. Inst. Civil Eng. Struct. Build. 169, 797–808. doi: 10.1680/jstbu.15.00046
Fattah, M. Y., Zabar, B. S., and Hassan, H. A. (2015). Soil arching analysis in embankments on soft clays reinforced by stone columns. Struct. Eng. Mech. 56, 507–534. doi: 10.12989/sem.2015.56.4.507
Fattah, M. Y., Zabar, B. S., and Hassan, H. A. (2016b). Experimental analysis of embankment on ordinary and encased stone columns. Int. J. Geomech. 16:04015102. doi: 10.1061/(ASCE)GM.1943-5622.0000579
Ferreira, F. B., Topa Gomes, A., Vieira, C. S., and Lopes, L. M. (2016). Reliability analysis of geosynthetic-reinforced steep slopes. Geosynth. Int. 23, 301–315. doi: 10.1680/jgein.15.00057
Fonseca, E., and Palmeira, E. M. (2018). An evaluation of the accuracy of design methods for geosynthetic reinforced piled embankments. Can. Geotech. J. 56, 761–773. doi: 10.1139/cgj-2018-0071
Genevois, R., and Romeo, R. W. (2003). Probability of failure occurrence and recurrence in rock slopes stability analysis. Int. J. Geomech. 3, 34–42. doi: 10.1061/(ASCE)1532-3641(2003)3:1(34)
Hasofer, A. M., and Lind, N. C. (1974). Exact and invariant second-moment code format. J. Eng. Mech. 100, 111–121.
Hoeg, K., and Murarka, R. P. (1974). Probabilistic analysis of a retaining wall. J. Geotech. Eng. 100, 349–370.
Ingles, O. G., and Noble, C. S. (1975). “The evaluation of base course materials,” in Proceedings of the Soil Mechanics-Recent Developments, eds S. Valliappan, S. J. Hain, and I. K. Lee (Sydney, NSW: Unisearch Ltd.), 399–410.
Kennedy, T. W. (1978). “Practical use of the indirect tensile test for the characterization of pavement materials,” Proceedings of the 9th Australian Road Research Board Conference (Brisbane, QLD), 36–45.
Kuhn, S. H. (1971). “Quality control in highway construction,” in Proceedings of the 1st International Conference on Applications of Statistics and Probability in Soil and Structural Engineering (Hong Kong: Hong Kong University Press), 287–312.
Lacasse, S., and Nadim, F. (1996). “Uncertainties in characterizing soil properties,” Proceedings of the Uncertainty 96', Uncertainty in the Geologic Environment: From Theory to Practice, eds C. D. Shackelford, P. P. Nelson, and M. J. S. Roth (Madison, WI: ASCE), 49–75.
Li, K. S., and Lumb, P. (1987). Probabilistic design slopes. Can. Geotech. J. 24, 520–535. doi: 10.1139/t87-068
Low, B. K. (2014). FORM, SORM, and spatial modeling in geotechnical engineering. Struct. Saf. 46, 56–64. doi: 10.1016/j.strusafe.2013.08.008
Low, B. K., and Tang, W. H. (1997). Reliability analysis of reinforced embankments on soft ground. Can. Geotech. J. 34, 672–685. doi: 10.1139/t97-032
Lumb, P. (1974). “Application of statistics in soil mechanics,” in Proceedings of the Soil Mechanics: New Horizons, ed I. K. Lee (Newnes-Butterworth: ASCE), 44–112, 221–239.
Luo, N., and Bathurst, R. J. (2017). Probabilistic analysis of reinforced slopes using RFEM and considering spatial variability of frictional soil properties due to compaction. Georisk Assess. Manag. Risk Eng. Syst. Geohazards 12, 87–108. doi: 10.1080/17499518.2017.1362443
McGuffey, V., Grivas, D., Iori, J., and Kyfor, Z. (1982). Conventional and probabilistic embankment design. J. Geotech. Eng. 108, 1246–1254.
Melchers, R. E., and Beck, A. T. (2017). Structural Reliability Analysis and Prediction, 3rd Edn. New York, NY: Wiley.
Nataf, A. (1962). Détermination des distribution dont les marges sont donées. C. R. Acad. Sci. 225, 42–43.
Otte, E. (1978). A structural design procedure for cement-treated layers in pavements (doctoral thesis). Faculty of Engineering, University of Pretoria, Pretoria, South Africa.
Phoon, K. K., and Kulhawy, F. H. (1999). Characterization of geotechnical variability. Can. Geotech. J. 36, 612–624. doi: 10.1139/t99-038
Salgado, R., and Kim, D. (2014). Reliability analysis of load and resistance factor design of slopes. J. Geotech. Geoenviron. Eng. 140, 57–73. doi: 10.1061/(ASCE)GT.1943-5606.0000978
Schultze, E. (1975). “Some aspects concerning the application of statistics and probability to foundation structures,” in Proceedings of the 2nd International Conference on Application of Statistics and Probability in Soil and Structural Engineering (Aachen), 457–494.
Sherwood, P. T. (1970). Reproducibility of Results of Soil Classification and Compaction Tests. Report LR 339, Road Research Laboratory, Crowthorne.
Singh, A. (1971). “How reliable is the factor of safety in foundation engineering?” in Proceedings of the 1st International Conference on Applications of Statistics and Probability in Soil and Structural Engineering (Hong Kong: Hong Kong University Press), 389–424.
Stamatopoulos, A. C., and Kotzias, P. C. (1975). “The relative value of increasing number of observations,” in Proceedings of the 2nd International Conference on Application of Statistics and Probability in Soil and Structural Engineering (Aachen), 495–510.
Tan, C. P., Donald, I. B., and Melchers, R. E. (1993). “Probabilistic slip circle analysis of earth and rockfill dams,” in Proceedings Probabilistic Methods in Geotechnical Engineering (Canberra), 281–288.
Tang, W., Yucemen, M., and Ang, A. (1976). Probability-based short-term design of soil slopes. Can. Geotech. J. 13, 210–215. doi: 10.1139/t76-024
USACE (1997). Engineering and Design Introduction to Probability and Reliability Methods for Use in Geotechnical Engineering. CECW-EG – ETL 1110–2-547. Washington, DC.
Wang, F., Li, H., and Zhang, Q.-L. (2017). Response-surface-based embankment reliability under incomplete probability information. Int. J. Geomech. 17:06017021. doi: 10.1061/(ASCE)GM.1943-5622.0001017
Xia, Y., Mahmoodian, M., Li, C.-Q., and Zhou, A. (2017). Stochastic method for predicting risk of slope failure subjected to unsaturated infiltration flow. Int. J. Geomech. 17:04017037. doi: 10.1061/(ASCE)GM.1943-5622.0000908
Keywords: reliability, geosynthetics, embankment, soft ground, sensitivity
Citation: Belo JLP and Lins da Silva J (2020) Reliability Analysis of a Controlled Stage-Constructed and Reinforced Embankment on Soft Ground Using 2D and 3D Models. Front. Built Environ. 5:150. doi: 10.3389/fbuil.2019.00150
Received: 17 August 2019; Accepted: 20 December 2019;
Published: 15 January 2020.
Edited by:
Sujit Kumar Dash, Indian Institute of Technology Kharagpur, IndiaReviewed by:
Anna Granà, University of Palermo, ItalyMohammed Y. Fattah, University of Technology, Iraq
Copyright © 2020 Belo and Lins da Silva. This is an open-access article distributed under the terms of the Creative Commons Attribution License (CC BY). The use, distribution or reproduction in other forums is permitted, provided the original author(s) and the copyright owner(s) are credited and that the original publication in this journal is cited, in accordance with accepted academic practice. No use, distribution or reproduction is permitted which does not comply with these terms.
*Correspondence: Jean Lucas dos Passos Belo, YmVsby5qZWFubHVjYXNAZ21haWwuY29t