 Faisal Ahmed
 Said M. Easa
- Department of Civil Engineering, Ryerson University, Toronto, ON, Canada
The percent time-spent following (PTSF) is a key measure for estimating the level-of-service for two-lane highways. However, PTSF is currently estimated indirectly using various measured field data. This study proposes two alternative direct models for estimating PTSF: (1) a general linear regression model using typically-used input variables and (2) a non-linear form using only the follower density. Both models are based on data generated from the corridor micro-simulation (CORSIM) software. Comparison of the proposed models with the new directional PTSF analytical model of the Highway Capacity Manual shows that the proposed models are capable of predicting simulation-generated PTSF quite closely with absolute mean error <3% using two different sets of validation datasets. The results of this research would be useful for a convenient and direct estimation of directional PTSF of two-lane highways.
Introduction
Traffic flow on two-lane highways is characterized by some complex interactions among many contributing operational and geometric variables. The operational variables include directional distribution of traffic flow levels, vehicular traffic mix with slow-moving heavy vehicles or recreational vehicles, free-flow speed of the highway segment, and driver's aggressiveness factors. The geometric variables include available passing opportunities in terms of percent passing zones, dedicated traffic lanes, passing sight distance, and horizontal and vertical alignments. All these interactions ultimately lead to the formation of platoons of fast-moving vehicles behind slow-moving vehicles, subject to a time headway threshold.
In turn, the percent time-spent following (PTSF) emerged as the most important and widely used traffic measure of performance among traffic practitioners for determining the level of service (LOS) of two-lane highways (Al-Kaisy et al., 2008; Al-Kaisy and Freedman, 2010). The Highway Capacity Manual (HCM) has defined PTSF as the average percentage of travel time that vehicles must spent traveling in platoons behind slower vehicles due to the inability to pass (Transportation Research Board, 2000, 2010). PTSF is not directly measurable with simple instrumentations in the field since by definition it is a spatial measure over a long highway segment. The surrogate 3-s criterion for defining a following platoon is typically based on spot measurements assuming that they are applicable over the entire segment.
In HCM, the LOS of two-lane highways is determined based on the combination of PTSF and average travel speed (ATS) for Class I highways only, where ATS is estimated based on free-flow speed. For Class II highways, ATS is not used for determining LOS. Apparently, the assumption is that PTSF is not significantly and directly affected by the level of free-flow speed for both highway classes. The HCM-2010 method also generalizes the estimation of PTSF without considering specified free-flow speed levels for both highway classes. For estimating PTSF, both HCM versions (Transportation Research Board, 2000, 2010) also do not provide guidance on the procedure for selecting the measurement location and duration of observation period (Romana and Pérez, 2006). A recent study also showed somFe significant effect of the length of passing zone on the passing rate (Mwesige et al., 2017).
The motivation for the present study is based on the following hypotheses: (a) the percent passing zones significantly affects PTSF under varying traffic, geometric, and driver behavior conditions, but the impact of no-passing zones is relatively low under different flow levels and directional splits, as reported in HCM (2010), (b) adjustment of PTSF for free-flow speed conditions and hourly traffic-flow levels may be needed, and (c) PTSF can be estimated from an easily obtainable spot-based traffic measure, such as follower density. Based on these hypotheses, the purpose of this paper is to develop alternative direct models for estimating PTSF. Specifically, the two models are: (a) a generalized relationship that combines all input variables (traffic flow levels, percent passing zones, percent heavy vehicles, free-flow speeds, and driver sensitivity indicator) into a single relationship and (b) a model that involves a mobility indicator (follower density) that can be easily measured in the field.
The next sections present a review of existing methods, including the HCM procedures and alternative approaches. The following sections present the proposed methodology, including experimental setup, developed direct models, and discussion, followed by the conclusions.
Review of Existing Methods
The directional percent time-spent following is defined by HCM (2010) as:
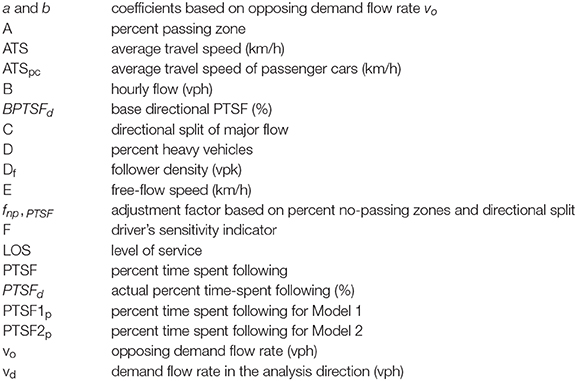
where PTSFd = actual percent time-spent following (%), BPTSFd = base directional PTSF (%), vo = opposing demand flow rate (vph), vd = demand flow rate in the analysis direction (vph), a and b = coefficients based on opposing demand flow rate vo, and fnp, PTSF = adjustment factor based on percent no-passing zones and directional split.
The HCM procedures for estimating PTSF have drawn a significant number of disagreements among researchers. Several researchers noted that the procedures produce inconsistent results with the surrogate 3-s criterion and overestimate PTSF and in some cases, the range of the average difference was 20–40% (Luttinen, 2001; Dixon et al., 2002; Harwood et al., 2003; Al-Kaisy and Durbin, 2007; Cohen and Polus, 2011). The plausible reason for this could be site-specific driver behavior that varies from one place to another. Some studies in the United States also revealed the same concerns when the HCM results were compared with field observations (Li, 2012). Polus and Cohen (2009) and Cohen and Polus (2011) showed that the PTSF of the HCM-2000 was most likely overestimated when tested in Israel. The correction term in the adjustment part of Equation (1) was not there in the HCM 2000 PTSF estimation, and this apparently yielded even higher adjusted values for PTSF of HCM (2000).
Subsequently, other approaches for estimating PTSF have emerged. Durbin (2006) proposed weighted-average and probabilistic approaches. The weighted-average approach assumes that the proportion of passenger cars traveling involuntarily in platoons is virtually identical to PTSF. The probabilistic approach estimates PTSF from the probabilities of a vehicle: (a) being part of a vehicular platoon and (b) traveling involuntarily in a platoon at a speed lower than the desired speed. Cohen and Polus (2011) proposed an M/M/1 queue-based PTSF estimation using headway counts. Yu and Washburn (2009) developed a percent delay formulation using a facility-based evaluation for two-lane highways, though it is for urban highways.
Bessa et al. (2017) tested several analytical PTSF models in Brazil: (a) shockwave-based model using percent of vehicle-hours in the platoon in a section (Pursula, 1995), (b) kinetic wave theory of moving bottlenecks-based model using a free speed, capacity, and a shockwave speed (Laval, 2006), and (c) queuing theory-based model using average number of headways observed within and outside the platoon (Cohen and Polus, 2011). However, the results showed that none of these models produced reliable estimates of PTSF as the mean normalized error was about 35%.
Estimating PTSF using the HCM-2010 method is also computationally time-consuming as it involves using both (Equations 1 and 2) along with interpolated data for the adjustment factor. Thus, a direct relationship of PTSF based on all significant input variables would be convenient for use by traffic engineers and practitioners. A few mathematical forms of such a direct relationship are available, but most models are primarily based on hourly traffic flow only.
Alternative measures to PTSF have emerged for determining the LOS of two-lane highways, including average travel speed of passenger cars (Brilon and Weiser, 2006; Romana and Pérez, 2006) and combined measures of traffic density, percentage followers, and follower density (Li, 2012). Van As (2006) identified follower density as the most suitable measure in a South African environment because it included the combined measures of percentage followers, traffic flow, and average travel speed. This measure also fully reflected driver perception of LOS when traveling on a two-lane highway.
Simulation methods are typically used for estimating PTSF in the absence of direct PTSF measurements in the field, although such methods employ numerous simplifying assumptions about the complex driver behavior in performing overtaking decisions (Polus and Cohen, 2009). The popular micro-simulation software includes two-lane highway passing (TWOPAS) software (Leiman et al., 1998) and corridor simulation (CORSIM) software (McTrans, 2010). No upgrade of TWOPAS is available after it was last updated for the United States conditions in 1998. A Spanish study also calibrated and validated TWOPAS based on a Spanish passing field data (Moreno et al., 2016) to fine tune the HCM procedure for Spanish conditions. CORSIM employs the Pitt car-following model for two-lane highways (Li and Washburn, 2011). The software incorporates distance headway and speed differential between the lead and follower vehicles as two independent variables under the assumption that the follower vehicle will try to maintain a safe space headway. The use of CORSIM for two-lane highways has been recently evaluated by several researchers, including Washburn and Li (2010), Li and Washburn (2011, 2014), and Li (2012). In addition, CORSIM is currently being used by other researchers because of its updated decision-making logic for overtaking. Simulation methods represent a reasonable alternative for estimating PTSF after the calibration of site, traffic, and driver-specific parameters based on some relevant sample spot observations.
Data Preparation
The traffic software integrated system (TSIS) module of the CORSIM micro-simulation software, which is designed for two-lane highways, was used in this study. The module was used to generate both calibration and validation datasets. The datasets were extracted using relevant input variables based on specified low and high-range values of the variables.
Experimental Setup
A 10 km segment of two-lane highway with no restrictions on available sight distance and with a flat terrain was simulated in CORSIM as the test bed. The percent passing zones for both directions were placed alternatively after equal distance intervals on the highway segment (Figure 1). Some pre-selected relative high and low-range values of the two-way flow level, percent passing zone, directional split percentage of the major, and minor flow directions, free-flow speed of the segment, percent heavy vehicles, and drivers sensitivity indicator were specified (Table 1). CORSIM uses a driver sensitivity indicator in its car-following model, which refers to the sensitivity of the drivers' population in terms of perception and reaction time. It is termed as car-following sensitivity multiplier, where a lower value of this indicator is for lower reaction time. For example, for a vehicle entering a link and finding the sun in the driver's eyes, the driver's sensitivity indicator value 80 means that the average reaction time of the drivers on the associated link is 1.12 s, where the default value 100 is 1.40 s. The present study also incorporated this indicator as a driver's behavioral variable in the estimation of PTSF.
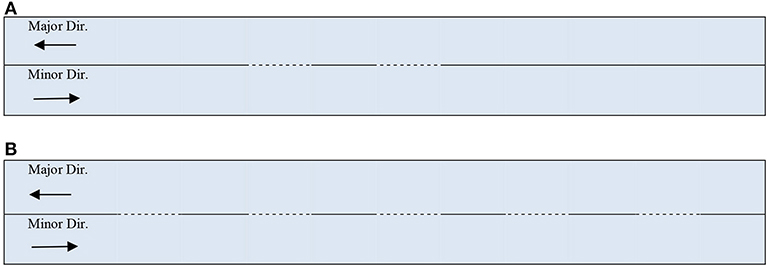
Figure 1. Schematic diagrams of examples of percentage passing zone (Dashed lines mean passing is allowed). (A) 20% Passing Zone. (B) 50% Passing Zone.
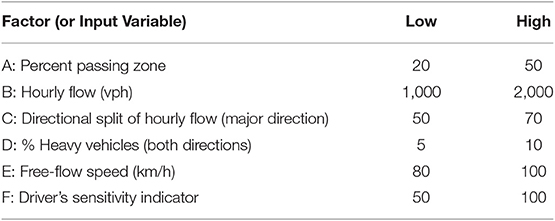
Table 1. Design of experiment set-up for the test.
Simulation Runs
The simulation outputs of PTSF and follower density were extracted from the CORSIM simulation runs by varying six input variables (Table 1) to develop the analytical models presented in this study. The PTSF and follower density in CORSIM are defined as follows:
(a) Percent Time-Spent Following: This measure indicates the average percent of travel time spent by the vehicles which are in the following mode. The adopted follower headway threshold is 3 s, which also follows the current HCM-2010 logic to approximate the PTSF.
(b) Follower Density: This measure indicates the average density of the vehicles in terms of vehicles per km per lane (vpkpl) which are in the following mode. CORSIM estimates this measure as the percentage of followers' traffic density. This is a surrogate measure for PTSF as the percent of headways <3 s between the leader and follower vehicles, and it can be detected by an automatic traffic recorder at a specific point on a two-lane highway.
An analysis of variance (ANOVA) was first conducted to determine the effect and significance of each of the input variables on PTSF. Then, a regression analysis was conducted to establish a generalized relationship between PTSF and the input variables. Finally, the calibrated models were tested against two validation datasets.
A total of 64 simulation points were tested for calibration, and another 64 simulation points with different percent of passing zones were tested for validation. Each simulation point was run with 10 iterations and with different random seeds for 1 h, and the average output of these iterations was considered since the variability of the standard deviations of all iterations was not that significant. Default values were adopted for passing in the oncoming lane and a no-passing lane was assumed. Table 2 shows a sample of the input variable settings and the outputs for model calibration.
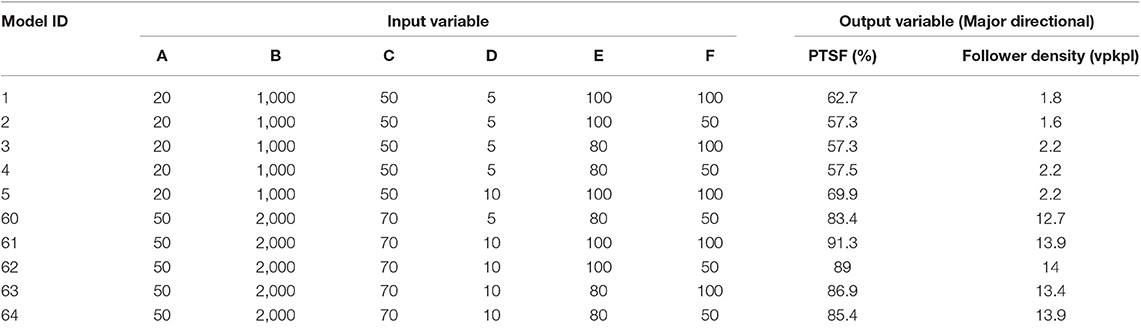
Table 2. Sample input and output of micro-simulation models.
Proposed Direct Models
The vast majority of studies have used either a logarithmic or a negative exponential relationship of PTSF with directional traffic flow, but this study strives to develop two direct models: (a) a general linear model using all input variables and (b) a best fit non-linear model using only the follower density.
Model 1: PTSF as Function of All Relevant Variables
An analysis of variance using F-test was conducted to determine the main and interaction effects of all input variables on the directional PTSF. The variations in the mean PTSF provided a very quick indication of the overall central tendency of the PTSF because of individual and coupled interaction factors. Figure 2 displays the main effects plot in terms of the mean values of PTSF using the calibration dataset. The following observations are noted:
▪ The two-way hourly flow impacts the mean PTSF with high sensitivity. Then, directional split has also a significant impact on the mean PTSF.
▪ The free-flow speed has a significant impact on the mean PTSF. On the other hand, the percent passing zone, percent heavy vehicle, and driver's sensitivity indicator all have relatively milder influences on the mean PTSF.
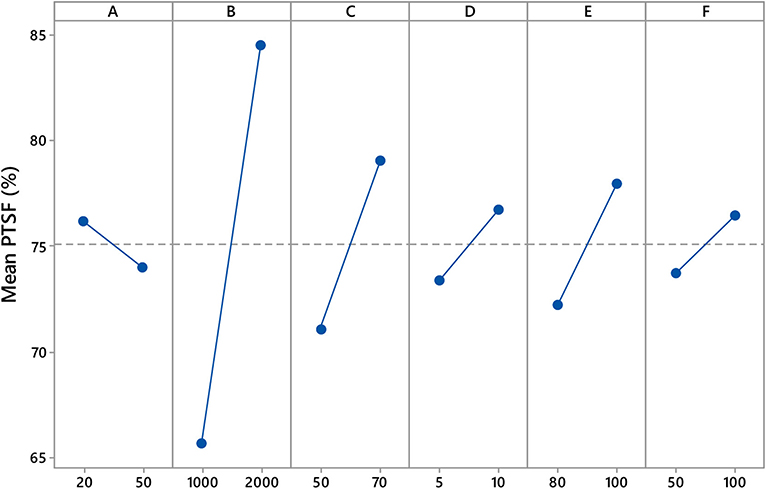
Figure 2. Main effects on percent time-spent following.
Thus, all factors showed somehow significant influence on the mean PTSF, which indicated a possibility for a strong relationship with PTSF.
Figure 3 shows the interaction plot of the mean PTSF (major direction) for the coupled factors. The following observations are noted:
▪ The percent passing zone's interaction with the hourly flow has the greatest impact on the mean PTSF as noted from the steeper slopes from the low to the high range inputs. Also, the variation in the percent passing zone itself does not influence the mean PTSF as the mean values lie within a range of 10 (between 70 and 80), indicating a very mild influence of the percent passing zone when it interacts as a couple with other input variables.
▪ For a specific hourly flow rate, the mean PTSF does not vary significantly since the values vary within a range of 10 when interacting with all input variables, except percent passing zone. However, the mean PTSF varies significantly because of the variation in the hourly flow rate at a specific set of other input variables.
▪ For all the remaining two-way interactions, the mean PTSF does not vary significantly as it varies mostly with a range of 5.
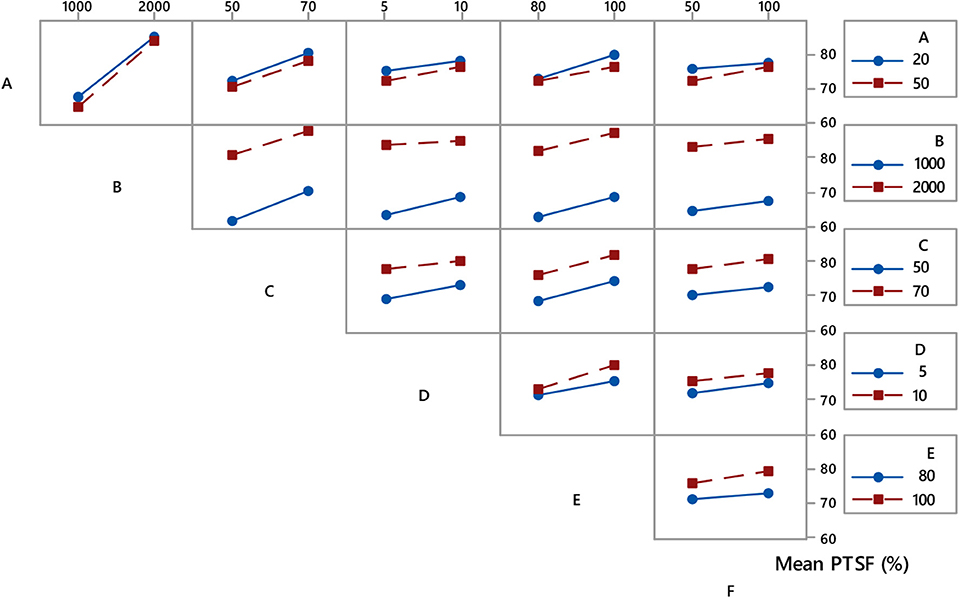
Figure 3. Interaction for percent time-spent following in the major direction (Model 1) with (A) percent passing zone, (B) hourly flow (vph), (C) directional split of hourly flow (major direction), (D) % heavy vehicles (both directions), (E) free flow speed (km/h), and (F) driver's sensitivity indicator.
The preceding observations are in line with all PTSF models in the literature that are primarily based on hourly flow levels only. An adjustment of the base PTSF models follows to account for the effects of the percent passing zone, percent heavy vehicles, and other relevant factors. Thus, the above-mentioned behavior for the central tendency of the PTSF data shows a possibility of direct linear relationship with all input variables either individually or combined in pairs, which is explored next.
After exploring different models for PTSF for different levels of interactions among all input variables, a refined PTSF model with simplified input variables was developed, as follows
PTSF1p = predicted time-spent following for Model 1 (%). The R2 for Equation (3) was 0.95 and the p-values of all inputs are below 0.05 which indicates that the input variables are significant to different extents with 95% confidence interval.
In comparison with the HCM-2010 models, the directional base PTSF model of Equation (3), called herein the base PTSF model, was applied to predict PTSF under the following sample cases: (a) no-passing zone = 60% and directional split = 50:50, (b) no-passing zone = 0% and directional split = 80:20, and (c) no-passing zone = 100%, directional split = 60:40. In all cases, free-flow speed = 80 km/h, heavy vehicles (both directions) = 10%, and driver sensitivity indicator = 100.
Since the HCM-2010 PTSF models are not specified for any particular level of free-flow speed, it was assumed that (Equations 1 and 2) of the HCM are valid for a free-flow speed of 80 km/h. Figure 4 show the comparative performances of various models when tested under the sample cases. In the figure, Simulation PTSF refers to the PTSF obtained directly from simulation, Base PTSF refers to the predictive model PTSF1p using (Equation 3), HCM-2010 BPTSF refers to the base PTSF model without adjustment for percent no-passing zone using (Equation 2), and HCM-2010 PTSF refers to the final PTSF model after adjustment for percent no-passing zone using (Equation 1).
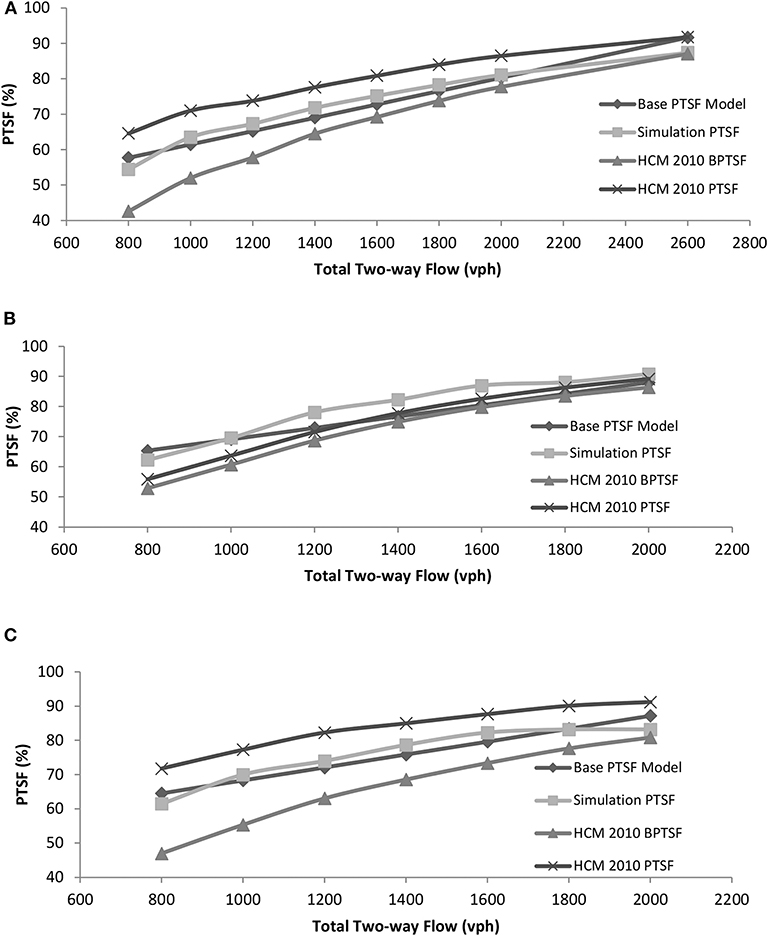
Figure 4. Performance of the proposed PTSF model (Model 1). (A) No-passing zone = 60% and directional split 50:50. (B) No-passing zone = 0% and directional Split 80:20. (C) No-passing zone = 0% and directional Split 80:20.
Although the base PTSF model of Equation (3) was calibrated for only two different flow levels in the experimental setup (Table 1), the model was able to predict PTSF quite closely to the simulation results under different hourly flow levels (Figure 4). On the other hand, HCM-2010 PTSF fared better than the HCM-2010 BPTSF in terms of the mean error and standard deviation of errors for the preselected flow levels for each sample case (Table 3). The outcomes of the HCM-2010 PTSF results are not surprising given the observations of other studies on the overestimation of PTSF by the HCM-2000 method.
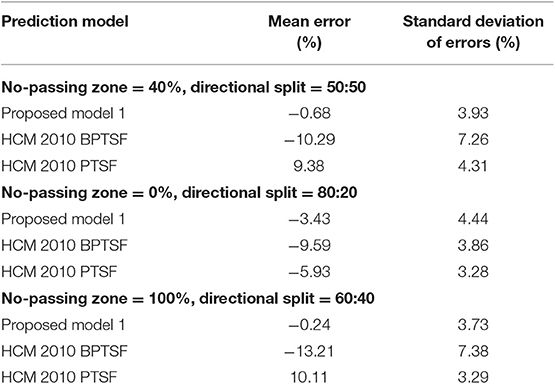
Table 3. Performance of proposed model 1 and HCM models using first validation dataset.
The apparent large difference in the prediction of PTSF using the HCM-2010 model (Table 3) could stem from a number of reasons. For example, there is no specific guideline on the length of the two-way segment and no specific free-flow speed-based coefficients. Though from the main effect plot (Figure 2), it is noted that the increase in PTSF resulting from the decrease in the percent of passing zone with a medium level of the two-way traffic flow is not that significant. However, the adjustment factor in HCM-2010 for some percent no-passing zones is apparently still too high. To illustrate, for a two-way flow level of 1,000 pcu per hour, the adjustment factor for 60% no-passing zone and 50:50 directional split in HCM-2010 is 19.05 (it was 38.1 in HCM-2000). The base PTSF without adjustment is 51.98 and the final adjusted PTSF is 71.03, which does not match the PTSF value (63.5) obtained from simulation for the similar flow level, directional split, and percent passing zone.
Model 2: PTSF as Function of Follower Density
In the absence of all the previously mentioned input variables, it is possible that PTSF can be estimated from the follower density (vpkpl) only. This measure can be easily obtained using some point-based data collection system rather than collecting data from a spatial extent over a segment of highway that was the basis for PTSF. The follower density can be obtained using traffic density and percent of followers. Hence, in reality, the traffic density can be measured either using the surrogate occupancy measure or the average distance or time headway of observed vehicles. The percent followers can also be measured using the follower headway threshold of 3 s between vehicles under the observation time interval.
Hence, a best-fit curve (Figure 5) was developed to establish the relationship between PTSF [of Equation (4)] and follower density using the calibration dataset. The proposed relationship is as follows,
where PTSF2p = predicted time-spent following for Model 2 (%) and Df = follower density (vpkpl). The R2 for Equation (4) was 0.90, which is quite satisfactory. The upper bound value of the predicted PTSF from Equation (4) can be limited by a reasonable pre-selected maximum value (say 92% here) for the extreme high hourly flow conditions obtained from the calibration dataset.
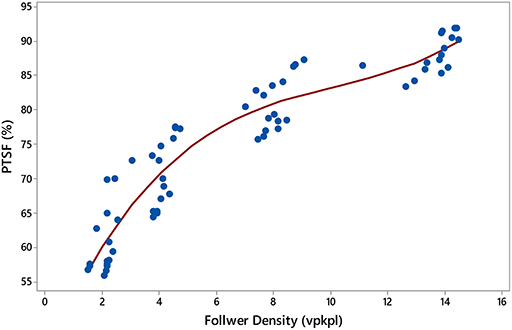
Figure 5. Relationship between PTSF and follower density (Model 2).
Validation of Models
Two different validation datasets were used to test the effectiveness of the proposed PTSF models. The first dataset (with 64 simulation points) is similar to the experimental setups of Table 1, except that the percentages of passing zones were different, where the low is 30% and the high is 40%. Therefore, the PTSF values were extracted from these points. The second dataset consists of completely eight random simulation points with different random input variables (Table 4). These input data are quite far away from the input specific data used for calibration and those used in the first validation dataset.
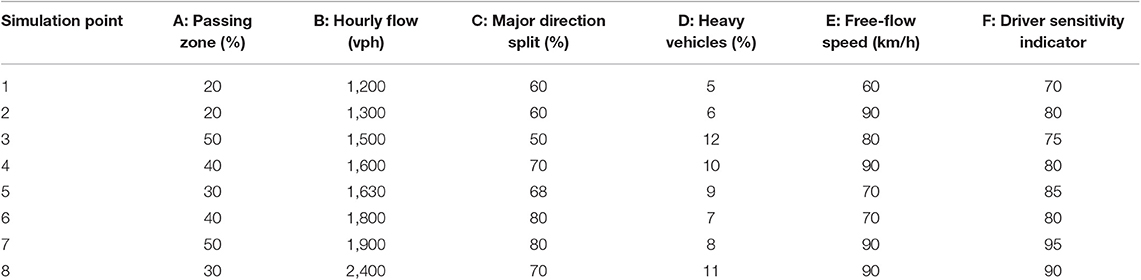
Table 4. Input variables of the second validation dataset.
Table 5 shows the relative performance of all models against the simulated PTSF in terms of mean error and standard deviation of errors for both the first and second validation datasets. As noted, both proposed models (base PTSF model and PTSF model from follower density) produced minimal errors with reasonable standard deviations for both validation datasets. However, the HCM-2010 BPTSF underestimated the PTSF and the HCM-2010 PTSF overestimated the PTSF with relatively higher error margins. This can also be seen graphically in Figure 6 for the second validation dataset, where random values of the other significant input variables were used.
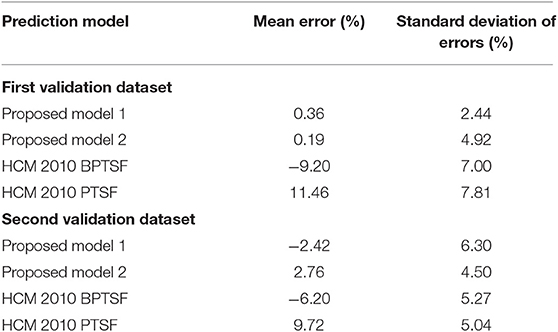
Table 5. Performance of the proposed and HCM models using the first and second validation datasets.
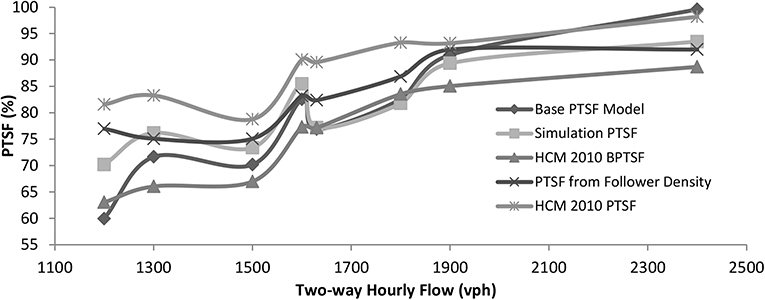
Figure 6. Performance of the models for the second validation dataset.
Conclusions
This paper has presented two regression models for the direct estimation of the directional PTSF. In the first proposed model, all significant input variables that affect PTSF are used in a single relationship that can be used conveniently. This form eliminates the necessary additional computational efforts for adjusting the base PTSF in HCM 2010. However, the model includes several input variables similar to the HCM methodology. It was found that the PTSF value is also affected by the free-flow speed, where the HCM-2010 PTSF estimation considers free-flow speed as another measure for Class I highways only to determine the overall LOS of the segment. The second proposed model of PTSF is a function of only the follower density which can be easily measured from the field. Both PTSF models showed better performance in estimating the simulated PTSF compared with the HCM methods. Although the proposed models were based on micro-simulation, the models can be calibrated and validated with local conditions. It was observed that even though the correction term used in HCM-2010 for the adjustment part along with the BPTSF, both analytical equations still produce high mean errors. Based on this research, the following comments are offered:
1. The analysis shows that factors such as free-flow speed and drivers' sensitivity indicator do also affect PTSF in addition to the typical input variables of hourly flow, directional split, percent of heavy vehicles, and percent passing zones.
2. Both proposed models for PTSF estimation are promising to be used generally after calibration of the coefficients using real-site specific data. Also, calibration of the internal car-following and passing decision parameters using field data, if available, would make the proposed models more useful instead of using the default internal values used in the CORSIM software.
3. Overestimation and underestimation of PTSF by HCM-2010 do exists, but with a lower margin of mean errors than those reported in the literature.
4. Further research could test the proposed formulas by incorporating the variations in horizontal and vertical alignments of the simulated highway segment and passing opportunities for both sides at the same location if a significant impact on PTSF is expected.
Data Availability Statement
The datasets generated for this study are available on request to the corresponding author.
Author Contributions
FA developed the simulation models, data analysis, and model development. SE had developed the primary idea, reviewed the manuscript, suggested methodology revision, and reviewed the final draft also.
Funding
The authors are grateful to the financial support of this study through a discovery grant by the Natural Sciences and Engineering Research Council of Canada (NSERC).
Conflict of Interest
The authors declare that the research was conducted in the absence of any commercial or financial relationships that could be construed as a potential conflict of interest.
References
Al-Kaisy, A., and Durbin, C. (2007). “Estimating percent time spent following on two-lane highways: field evaluation of new methodologies,” in Transportation Research Board 86th Annual Meeting (CD-ROM) (Washington DC).
Al-Kaisy, A., and Freedman, Z. (2010). Estimating performance on two lane highways: case study validation of a new methodology. Transp. Res. Rec. 2173, 72–79. doi: 10.3141/2173-09
Al-Kaisy, A., Jafari, A., Washburn, S., Luttinen, T., and Dowling, R. (2008). Performance measures on two-lane highways: survey of practice. Res. Transp. Econ. 71, 61–67. doi: 10.1016/j.retrec.2018.07.001
Bessa, J. E. Jr., Setti, J. R., and Washburn, S. S. (2017). Evaluation of models to estimate percent time spent following on two-lane highways. J. Transp. Eng. A 143. doi: 10.1061/JTEPBS.0000032
Brilon, W., and Weiser, F. (2006). Two-lane rural highways: the german experience. Transp. Res. Rec. 1988, 38–47. doi: 10.1177/0361198106198800105
Cohen, M., and Polus, A. (2011). Estimating percent-time-spent-following on two-lane rural highways. Transp. Res. C 19, 1319–1325. doi: 10.1016/j.trc.2011.03.001
Dixon, M. P., Sarepali, S. S. K., and Young, K. A. (2002). Field evaluation of highway capacity manual 2000 analysis procedures for two-lane highways. Transp. Res. Rec. 1802, 125–132. doi: 10.3141/1802-15
Durbin, C. T. (2006). Traffic performance on two-lane, two-way highways: examination of new analytical approaches (Master Thesis). Montana State University, Bozeman, United States.
Harwood, D., Potts, I., Bauer, K., Bonneson, J., and Elefteriadou, L. (2003). Two-Lane Road Analysis Methodology in The Highway Capacity Manual. Final Rep. NCHRP Project 20-7(160). Kansas City, MO: Midwest Research Institute.
Laval, J. A. (2006). A macroscopic theory of two-lane rural roads. Transp. Res. B 40, 937–944. doi: 10.1016/j.trb.2006.03.002
Leiman, L., Archilla, A. R., and May, D. A. (1998). Capacity and Quality of Service of Two-Lane Highways: Twopas Model Improvements. NCHRP Project 3-55(3). Washington, DC: Transportation Research Board; National Research Council.
Li, J. (2012). Two-Lane Highway Simulation and Analysis (PhD Dissertation). University of Florida, Gainesville, United States.
Li, J., and Washburn, S. S. (2011). Implementing two-lane highway simulation modeling into CORSIM. Procedia Soc. Behav. Sci. 16, 293–305. doi: 10.1016/j.sbspro.2011.04.451
Li, J., and Washburn, S. S. (2014). Improved operational performance assessment for two-lane highway facilities. J. Transp. Eng. 140:04014017. doi: 10.1061/(ASCE)TE.1943-5436.0000666
Luttinen, R. (2001). Percent time-spent-following as performance measure for two-lane highways. Transp. Res. Rec. 1776, 52–59. doi: 10.3141/1776-07
McTrans (2010). Traffic Software Integrated System (TSIS-CORSIM) Version 6.2. Gainesville, FL: McTrans; University of Florida.
Moreno, A. T., Llorca, C., Washburn, S. S., Bessa, J. E., Hale, D. K., and Garcia, A. (2016). Modification of the highway capacity manual two-lane highway analysis procedure for spanish conditions. J. Adv. Transp. 50, 1650–1665. doi: 10.1002/atr.1421
Mwesige, G., Farah, H., Bagampadde, U., and Koutsopoulos, H. N. (2017). Effect of passing zone length on operation and safety of two-lane rural highways in uganda. IATSS Res. 41, 38–46. doi: 10.1016/j.iatssr.2016.09.001
Polus, A., and Cohen, M. (2009). Theoretical and empirical relationships for the quality of flow and for a new level of service on two-lane highways. J. Transp. Eng. 135, 380–385. doi: 10.1061/(ASCE)0733-947X(2009)135:6(380)
Pursula, M. (1995). Approximation of percentage time delay with local measurements. Transp. Res. Rec. 1484, 58–65.
Romana, G. M., and Pérez, I. (2006). Measures of effectiveness for level-of-service assessment of two-lane roads: an alternative proposal using a threshold speed. Transp. Res. Rec. 1988, 56–62. doi: 10.1177/0361198106198800107
Transportation Research Board (2000). Highway Capacity Manual 2000. Washington, DC: National Academy of Sciences.
Transportation Research Board (2010). Highway Capacity Manual 2010. Washington, DC: National Academy of Sciences.
Van As, C. (2006). The Development of An Analysis Method for The Determination of Level of Service of Two-Lane Undivided Highways in South Africa. Pretoria: South African National Roads Agency Limited.
Washburn, S. S., and Li, J. (2010). Development of A Simulation Program For Two-Lane Highway Analysis. Gainesville: University of Florida; Transportation Research Center.
Yu, Q., and Washburn, S. (2009). Operational performance assessment for two-lane highway facilities. J. Transp. Eng. 135, 197–205. doi: 10.1061/(ASCE)0733-947X(2009)135:4(197)
Notation
Keywords: two-lane highways, percent time-spent following, follower density, level of service, CORSIM
Citation: Ahmed F and Easa SM (2020) Development of Direct Models for Percent Time-Spent Following on Two-Lane Highways. Front. Built Environ. 6:1. doi: 10.3389/fbuil.2020.00001
Received: 10 October 2019; Accepted: 08 January 2020;
Published: 29 January 2020.
Edited by:
Sakdirat Kaewunruen, University of Birmingham, United KingdomReviewed by:
Anna Granà, University of Palermo, ItalyAmpol Karoonsoontawong, King Mongkut's University of Technology Thonburi, Thailand
Copyright © 2020 Ahmed and Easa. This is an open-access article distributed under the terms of the Creative Commons Attribution License (CC BY). The use, distribution or reproduction in other forums is permitted, provided the original author(s) and the copyright owner(s) are credited and that the original publication in this journal is cited, in accordance with accepted academic practice. No use, distribution or reproduction is permitted which does not comply with these terms.
*Correspondence: Faisal Ahmed, ZmFpc2FsLmFobWVkQHlvcmsuY2E=