 Changda Feng
 Arindam Gan Chowdhury
 Amal Elawady
 Dejiang Chen
 Ziad Azzi
 Krishna Sai Vutukuru
- 1International Hurricane Research Center, Florida International University, Miami, FL, United States
- 2Department of Civil and Environmental Engineering, Florida International University, Miami, FL, United States
Wind hazards are one of the most disastrous events that frequently occur in the United States. Hurricane Irma, which hit the southeast coast in 2017, left a majority of damage concentrated on low-rise buildings and wooden construction in its wake. As revealed by recent hurricane damage reconnaissance, hardware-type roof-to-wall connections are especially vulnerable to high wind suction. There is only limited research on the assessment of wind loads on these roof-to-wall connections, which are important components of the wind load path. Hence, it is essential to have realistic estimates of wind effects on these connections to ensure a safe design. To fill this fundamental knowledge gap, an extensive large-scale aerodynamic testing study has been recently conducted at the NSF-Natural Hazard Engineering Research Infrastructure (NHERI) Wall of Wind (WOW) Experimental Facility (EF) to investigate wind actions resulting from simulated hurricane force winds. A wooden gable roof building of a large length scale of 1:4 was adopted for this study. Seven trusses were used to construct the roof and were connected to the top plate of the side walls. Load cells were mounted at the roof-to-wall connection (RTWC) level to measure the effective net wind-induced forces. The model was tested under different wind directions varying from 0 to 360° with an increment of 5° under varying wind speeds. In addition, three different configurations, i.e., one enclosed and two partially enclosed, were considered to assess different internal pressure scenarios that affect the net loading on the roof-to-wall connections and the overall roof system. The RTWC force coefficients distribution along the entire roof was obtained. The results were compared to force coefficients recommended by ASCE 7-16 version for the cases of Main Wind-Force Resisting System (MWFRS) and Component and Cladding (C&C). The experimental results were in between MWFRS and C&C values based on the ASCE provisions in general. However, for partially enclosed case, some values slightly exceeded those based on the ASCE C&C provisions. Also, the overall uplift on the roof was found to be dependent on the location of the opening (i.e., opening on long side vs. short side of the building).
Introduction
The U.S. East and Gulf Coasts have become increasingly vulnerable to tropical cyclone activity during the Atlantic hurricane season. The average annual economic losses from these events increased from $1.3 billion between 1949 and 1989 to $10.1 billion from 1990 to 1995 (NSB, 2007; Ahmed et al., 2011). In 2005, hurricanes Katrina and Rita set a record with annual losses of over $100 billion (Ahmed et al., 2011). In 2017, Hurricane Irma's impact on Florida and the Southeastern U.S. resulted in excess of $50 billion USD in total economic insured losses (Cangialosi et al., 2018). Most recently, total insured losses in Florida due to Hurricane Michael in 2018 have exceeded $6.6 billion USD with at least 20% of the claims still open as of June 2019 (Evans, 2019).
Wood-frame construction accounts for ~90% of all residential buildings in the U.S., including many coastal communities. Due to the susceptibility of many East Coast and Gulf Coast communities to tropical cyclone threats, the structural performance of wood-frame buildings to withstand risks from extreme wind, wind-driven rain, and storm surge is of great concern (Riley and Sadek, 2003; Ahmed et al., 2011; Chowdhury et al., 2013). High-intensity wind events such as hurricanes generate vortices-induced fluid-structure interaction that are typically associated with high suction pressures leading to strong uplift forces exerted on the roof (Holmes, 2015). Building codes were significantly improved following the shocking losses that resulted from Hurricane Andrew in 1992 due to the insufficient performance of infrastructure, especially low-rise buildings (Cook and Soltani, 1994). Although the performance of low-rise residential buildings in hurricane prone areas is significantly improved (Reinhold, 2006), low-rise structures are still the most vulnerable construction against strong windstorms. According to recent reconnaissance reports (Blake and Zelinsky, 2018; Pinelli et al., 2018) pertaining to the damage observation resulting from the latest hurricane season including the devastating hurricanes Irma and Harvey, roof uplift-induced failures significantly contributed to the total failures concentrated in the residential communities with low-rise buildings. This agrees well with the observations reported by Sparks (1991) for past hurricane-induced damages. This underlines the need for more sophisticated research studies that yield to substantial improvements in the current codes with focus on the performance of low-rise wooden buildings.
Roof-to-wall connections (RTWCs) play a critical role to withstand extreme wind loads and roof uplift forces (Reed et al., 1997; Rosowsky et al., 1998; Chowdhury et al., 2013). In typical wood-frame construction, the roof structure is joined to the wall structural members by connecting the roof rafters or bottom truss chords to the top plate members on the side walls. Past research and hurricane damage reconnaissance studies have revealed that “toe-nail” connections are vulnerable to wind suction pressures experienced by low-rise building roofs (Canino et al., 2011). Furthermore, metal connectors were found to be vulnerable to failure under tri-axial load tests, which more accurately reflected the in situ loading experienced by the clips under extreme wind conditions (Canino et al., 2011; Chowdhury et al., 2017). Failures of such connections may lead to a breach in the building envelope, resulting in serious building safety and serviceability problems.
Prior research on the assessment of RTWC wind loading has been limited. The large number of factors that controls the RTWC uplift forces during windstorms significantly increases the uncertainties inherent inaccurate estimation of these forces and hence hinders achieving safer low-rise residential communities. These control parameters include, among several others, (i) external pressure dominant parameters: roof shape, roof pitch, eave shape, building geometry, presence of canopy or parapet, and the surrounding buildings (He et al., 2017); (ii) internal pressure dominant parameters: building opening(s) (size and location, number of openings) (Kopp et al., 2008), and the overall flexibility of the structure (Sharma and Richards, 2003; Guha et al., 2011); (iii) wind field control parameters: terrain exposure, wind speed and direction, etc. For instance, Habte et al. (2017) indicated that the location of the opening relative to the position of the frames supporting a structure influences the internal pressure exerted on that frame. This study showed that internal pressure caused a 65 and 45% increase in net response for single openings and multiple openings, respectively. Riley and Sadek (2003) performed tests with simultaneous uplift and in-plane lateral loads on two types of RTWCs in wood frame houses. However, these tests lacked realistic aerodynamic data linking both uplift and lateral loads together. Ahmed et al. (2011) evaluated the uplift capacity of multiple connectors in wood framing residential buildings. Results showed that current design practices overestimate the capacity of RTWCs, which can be the cause of many failures in extreme-wind events. Morrison et al. (2012) applied realistic fluctuating wind loads to a full-scale two-story wood frame house by using pressure loading actuators, where wind pressure distributions are obtained from a 1:50 scale model. The results showed that the uplift capacity of the roof is significantly higher than that predicted using the individual connection results attributing to significant load sharing between adjacent connections. Chowdhury et al. (2013) investigated the wind loading effects on RTWCs of wooden residential buildings by conducting tri-axial load testing and wind testing experiments. Comparing the wind testing results to those obtained from the tri-axial load testing, the authors concluded that the magnitude of the force components in all three axes depends on the RTWC location, wind direction and building enclosure condition.
There are two ways to test the RTWCs due to wind loads. The first way is to mount load cells under roof trusses to directly measure the RTWCs loads during the wind tunnel testing. The other way is based on the pressure measurement on the roof from the wind tunnel testing. The influence function needs to be measured by applying a unit load on the roof structure or finite element model to calculate the influence coefficient of RTWCs. The RTWCs due to wind loads can be obtained by combining the roof wind pressure measurement results and RTWCs influence coefficients (e.g., Mensah et al., 2011; Feng and Chen, 2018). In this test, the first approach is adopted.
The large-scale wind tunnel testing (e.g., 1:4–1:30) is preferred because of (1) adequate instrumentation, (2) accurately modeling of the finer details to capture local aerodynamics and (3) simulating high enough Reynolds number Re to avoid scaling effects that make the test results no longer fully representative of full-scale. The problem with using large model scales is that there are difficulties in simulating the full wind turbulence spectrum. The high-frequency of the turbulence spectra well-simulated, but the low-frequency of the turbulence spectrum is missing compared with full-scale counterpart due to the limitation of the size of wind tunnels. To correct for the missing low-frequency component in the simulated flow turbulence, the Partial Turbulence Simulation (PTS) approach is applied to correct peak pressures from WOW (Mooneghi et al., 2016; Moravej, 2018). The efficacy and accuracy of the PTS method were previously validated by comparing predicted local peak pressure coefficients from tests on large-scale models from WOW and the corresponding full-scale measurement of Texas Tech University (TTU) building (Mooneghi et al., 2016; Moravej, 2018). For rigid structures (without the dynamic effect due to wind loads), the PTS approach can be extended to RTWCs for low-rise buildings.
The goal of this paper is to better understand the wind load distribution on RTWCs of a typical low-rise gable roof building using realistic wind loading simulation. To minimize scaling effects, the study adopted a large-scale model of a 1:4 residential building with a roof slope of 3:12. The model was tested in the NHERI Wall of Wind (WOW) open-jet experimental facility at Florida International University (FIU) in an open-terrain with varying wind angles ranging between 0 and 360° at 5° increments. The building model has seven supporting trusses that were instrumented using 14 load cells to measure the aerodynamic RTWC forces under each truss ends. The building opening effect on RTWCs loading was considered with three different building configurations, i.e., enclosed configuration and two partially enclosed buildings (two openings on the long wall side and one opening on the short wall side). The performance of RTWCs under wind loads is first discussed. The overall uplifting force on the entire roof is calculated by the summation of all the loads measured by each load cell and compared with buildings with different openings. The peak and mean RTWC force coefficients were obtained and then compared with the values based on the ASCE 7-16 building standard.
Experimental Setup
Wall of Wind Experimental Facility
The Wall of Wind (WOW) experimental facility (EF), located at the Florida International University (FIU) Engineering Campus, is capable of testing full- and large-scale structures under different wind conditions and up to Category 5 hurricane wind speeds, as defined by the Saffir-Simpson Scale. The WOW apparatus is a system of 12 electric fans arranged in a 2 × 6 array as shown in Figure 1. The WOW facility can generate a 20 ft (6.1 m) wide and 14 ft (4.3 m) high wind field. A flow management region is located between the fans and the experimental test section. The flow management region is designed to generate atmospheric boundary layer (ABL) profiles and turbulence characteristics for different terrain roughness lengths and exposure categories. ABL and turbulence simulations are achieved by three triangular spires used in conjunction with an automated roughness system (Figure 2).
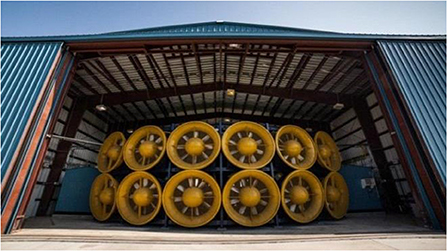
Figure 1. Intake of 12-fan Wall of Wind system.
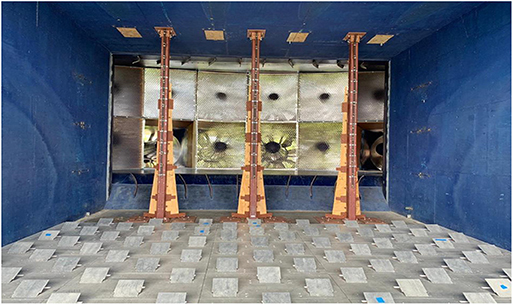
Figure 2. Spires and floor roughness elements in the WOW flow management section.
The spires and floor roughness elements were adjusted to simulate an open-terrain exposure. The opening angles for roughness elements and spires were 25 and 45°, respectively (Figure 2). Freestream wind speed measurements were recorded simultaneously by five Turbulent Flow Instrumentation cobra probes located at the center of the turntable at heights of 43.9, 47.4, 64.2, 76.2, and 88.2 inches (1.1, 1.2, 1.6, 1.9, and 2.2 m), whereas the reference height located at mean roof height of the test model (zref = 1.1 m). Wind speed data was sampled for 180 s at a sampling frequency of 2,500 Hz. Figure 3 shows the WOW generated mean wind speed and turbulence intensity profiles and fluctuating turbulence power spectrum density functions (PSDs) at reference height, compared with those produced using ESDU item 85020 (ESDU, 2001) with a roughness height z0 of 0.085 m, which falls within the range of open-terrain exposure. The profiles are normalized at the mean roof height and reference wind speed Uref of 61.5 mph (27.5 m/s), and the PSD of longitudinal turbulence is normalized using the mean wind speed at mean roof height. It is evident that the WOW generated turbulence intensity lower than the full scale based on ESDU. Figure 3C displays the high frequency part of the PSD which agrees well with ESDU at roughness height of z0 of 0.085 m. However, there is a noticeable deficiency in the low-frequency part of PSD from the WOW simulation, which results in the lower turbulence intensity in WOW compared with ESDU. The high-frequency part of the PSD mainly affects the details of flow separation and reattachment around the building whereas the low-frequency component can be approximately treated similarly to changes in the mean flow velocity. The effects of the missing low-frequency part of the turbulence PSD are accounted for analytically in the post-test analysis using quasi-steady assumptions by the PTS approach (Mooneghi et al., 2016; Moravej, 2018). The generated turbulence intensity in WOW largely improved after accounting the missing low-frequency turbulence based on the PTS approach as Figure 3B shown.
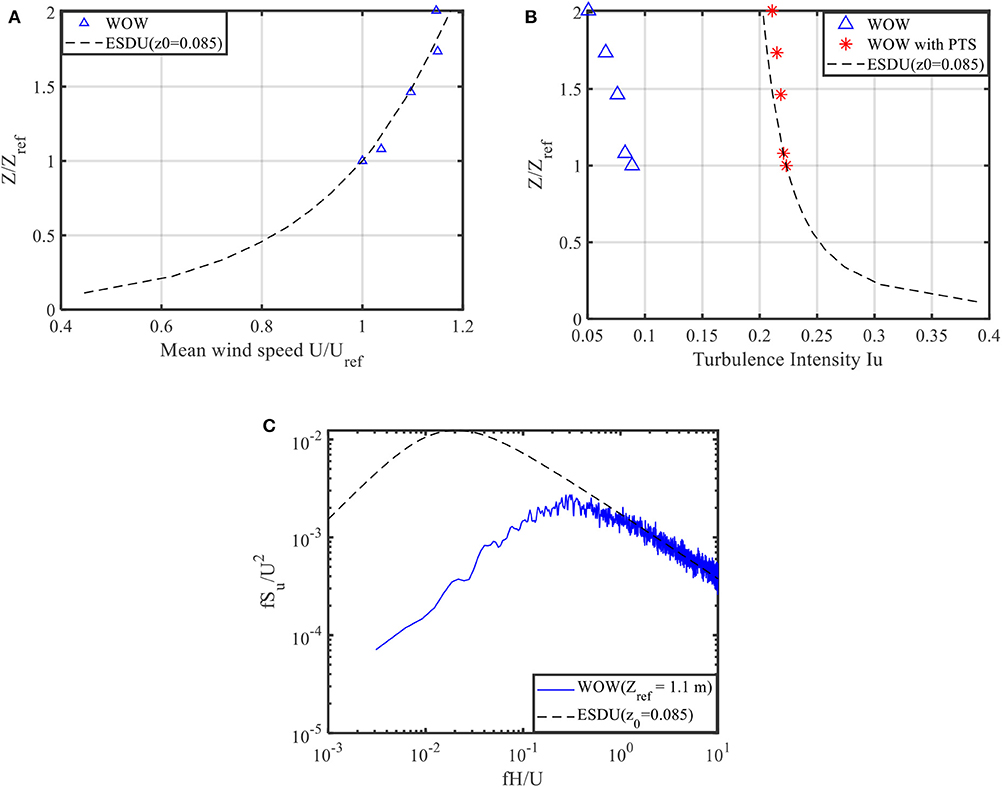
Figure 3. Comparison between WOW and ESDU. (A) Mean wind speed profile. (B) Turbulence intensity profile (C) Power spectral density function.
Building Model
The testing was conducted on a large-scale building model representing a typical rectangular residential structure with a gable-type roof. An isometric drawing of the reduced scale model is shown in Figure 4. Figure 5 shows the reduced scale model placed on the WOW turntable during the experiments. The large-scale building model had the following base dimensions (L × W × H): 11.6 × 7.5 × 4.1 ft (3.5 × 2.3 × 1.2 m). The length scale adopted was 1:4 which gives the full-scale prototype building the following dimensions (L × W × H): 46.4 × 30.0 × 16.4 ft (14 × 9.2 × 4.8 m). The roof pitch angle was 3:12. The building was designed and constructed with 3-inch (8 cm) square profile aluminum slotted framing members for the wall studs and top plate. Transparent 3/8-inch (1 cm) thick polycarbonate sheets were bolted to the aluminum members to act as wall sheathing.
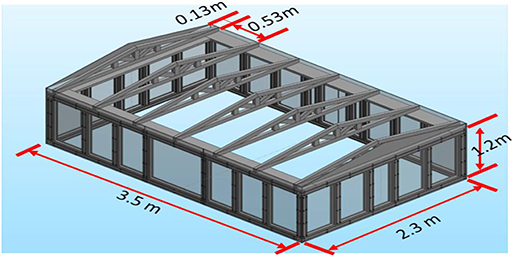
Figure 4. Isometric view of building model.
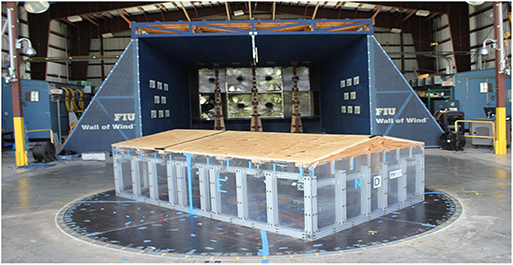
Figure 5. 1:4 scale building model.
The roof structure consisted of seven wooden trusses spaced at 21.0 in (0.53 m) center-to-center. The two gable end trusses were located 5.0 in (0.13 m) inward from the edge to allow clearance for the load cell instrumentation between the gable end trusses and the gable walls. The roof structure was built by the certified constructor. Custom roof trusses were constructed from #2-grade pine lumber stock with nominal 2 × 3 dimensions. This lumber dimension was chosen for convenience as it would keep the roof sheathing flush with the walls once the trusses were installed on the force sensors. The roof sheathing was constructed from a layer of 23/32 in (0.018 m) thick plywood sheets cut to size. The plywood sheets were secured to the roof trusses with 1–5/8 in long exterior grade wood screws spaced ~6 in (0.15 m) apart for edges and seams, and 12 in (0.30 m) apart for field screws. Prior to installation of the sheathing on the trusses, a layer of foam weather stripping was installed underneath the sheathing around the perimeter of the building model to seal any gaps between the roof and the walls. Figure 6 shows the truss numbers from 1 to 4, where truss #1 is nearest to the gable end and truss #4 is located in the middle of the roof. It should be noted that the structural properties were not scaled. It was assumed that the roof-surface wind load was transferred to the connections through rigid trusses. The different construction specifications of the roof system could impact the load sharing of the wind loads on the roof, which further affects the loads on the RTWCs. This simplified assumption may only partly address the complex load transfer mechanisms where the structural stiffness of members will affect load sharing and load transfer. More research delving into those complex mechanisms will be carried out in the future through proper scaling of stiffness and other important structural parameters (e.g., Datin and Prevatt, 2013).
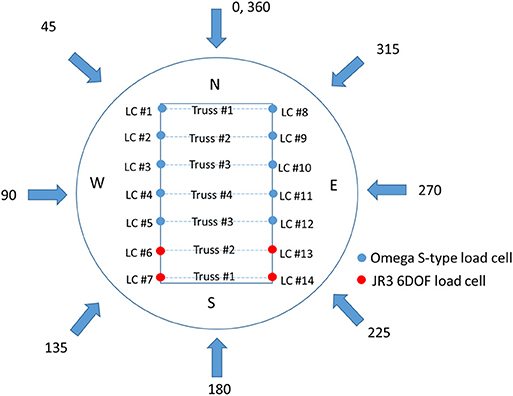
Figure 6. The convention for wind directions, location of load cells and truss numbers.
Instrumentation
Seven roof trusses on the aerodynamic building model yielded 14 connection points between the roof structure and the wall top plates. Load cells were installed at each of these RTWC locations to measure the wind-induced uplift load distribution across the entire roof. A rigid base model was desirable to install force sensors between the wall top plates and the roof structural members. The 14 load cells were numbered from LC #1 to LC #14, as illustrated in Figure 6. Four JR3 6-DOF load cells were installed underneath trusses # 1 and #2 and 10 Omega S-type uniaxial load cells were installed below the remaining trusses. Figure 7 shows the installed JR3 6-DOF and Omega S-type uniaxial load cells. Aluminum adapter plates allowed the JR3 6-DOF load cells to be mounted to the wall top plate. The upper connection between the 6-DOF load cell and the roof truss was accomplished with an aluminum adapter plate, a wooden 2 × 8 and metal clips. For mental clips between the 6-DOF load cell and the roof truss, one hurricane tie (Simpson Strong Tie H1Z ZMAX Galvanized 18-Gauge Hurricane Tie) was used at the inner side, and two angles (Simpson Strong Tie A21Z ZMAX Coated 18-Gauge 2-inch by 1-1/2-inch Angle) were used on the top plate shown in Figure 7A. Each 6-DOF load cell used 17 screws (#9 × 1–1/2 in. External Hex Flange Hex-Head Structural-Connector Screw) for fastening the connection between the 6-DOF load cell and the roof truss. The S-type load cells were attached to the wall using T-slot compatible gusset plates and ½ in diameter bolts. Another ½ in diameter bolt, attached to a strut channel U-bracket provided a connection method for the roof trusses to the S-type load cells. Small sections of additional 2 × 3 wood blocking had to be added to the ends of the trusses installed on the S-type load cells to lag screw the U-brackets into the wood. All the load cells were adjusted to the same horizontal level to make sure wind loads were transferred from each truss evenly. The maximum uplift capacity of the JR3 6-DOF load cells was about 300 lbs (1,350 N) whereas that of the Omega S-type load cells was about 750 lbs (3,350 N). It should be noted that the JR3 6-DOF load cell has a high response frequency, which is capable of measuring both the peak and fluctuating responses of RTWC wind loads, while the Omega S-type load cell has a low response frequency, which is adequate for collecting the mean component of wind loads only. It should also be noted that the JR3 6-DOF load cells are able to be more accurately reflected the real loading experienced (Canino et al., 2011; Chowdhury et al., 2017). Cost limitation prohibited the usage of JR3 sensors for all trusses supporting the roof.
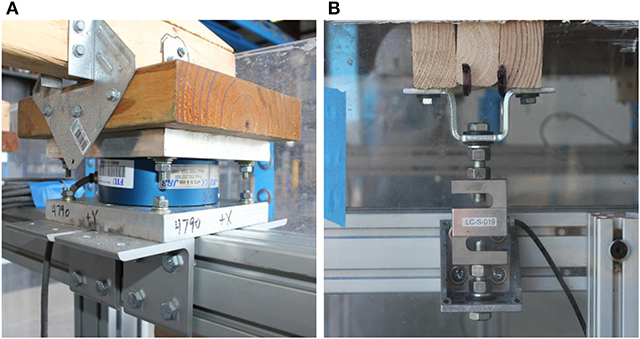
Figure 7. Load cell installation. (A) JR3 6-DOF load cell. (B) Omega S-type uniaxial load cell.
Testing Protocol
In this test, three different configurations were considered to investigate the effect of wall openings on the uplift loads experienced by RTWCs: (i) fully enclosed building (noted as Enclosed), (ii) partially enclosed building with two openings on the west (long) wall (noted as Partially Enclosed West Wall) and (iii) partially enclosed building with one opening on the south (short) gable wall (noted as Partially Enclosed South Wall). All three configurations are portrayed in Figure 8. Each opening size was 10 × 12 in (0.25 × 0.30 m), which meets the requirements of ASCE 7-16 (ASCE 7, 2016) for buildings classified as partially enclosed.
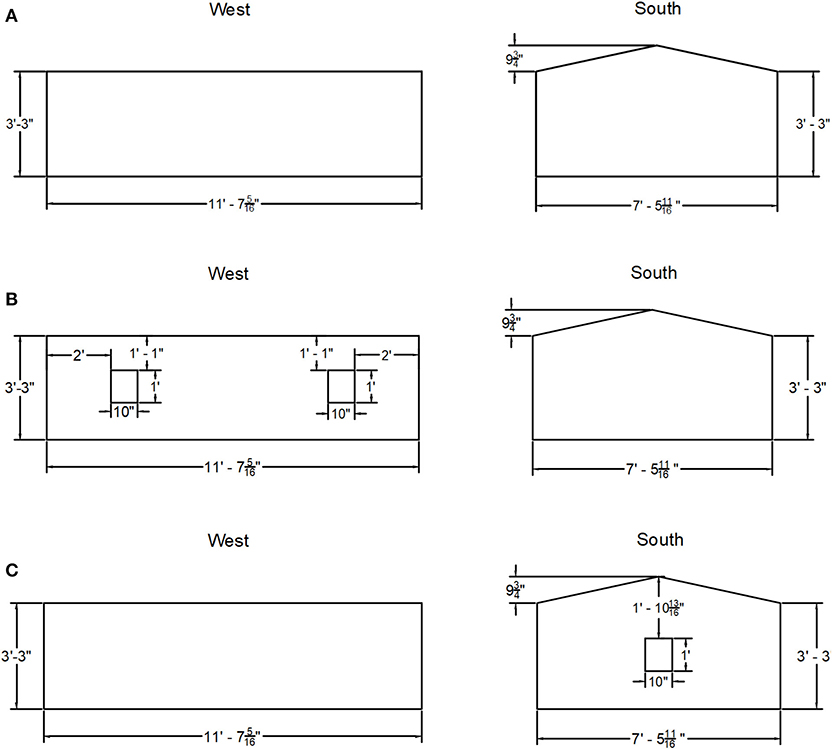
Figure 8. Building configurations. (A) Fully enclosed building. (B) Partially enclosed building with two openings on the west wall. (C) Partially enclosed building with one opening on the south gable wall.
The experiments were conducted using the WOW open-terrain exposure as discussed earlier. The instrumented building model was tested at 50% throttle of the full wind speed capacity at the WOW. This corresponds to a 27.5 m/s mean wind speed at mean roof height (1.1 m). The model was placed on the WOW turntable, allowing its rotation for testing at various wind directions. The convention for wind directions is shown in Figure 6, where 0° is wind normal to the north wall and wind angle of attack increases counter-clockwise. The fully enclosed building model was rotated for wind directions ranging from 0 to 360° at 5° increments. The partially enclosed building models were tested for fewer angles, limiting the wind directions to angles that would produce the highest wind loading on the RTWCs, i.e., angles in which the wind direction was oriented such that the openings were located on the windward wall. The wind angles varied between 45 and 135° at 5° increments in the case of Partially Enclosed West Wall building, whereas the wind angles varied between 135 and 225° at 5° increments in the Partially Enclosed South Wall building case. The uplift force time histories were recorded for a duration of 60 s at a sampling rate of 100 Hz for each tested wind direction. Baseline force measurements were taken before and after each wind direction to obtain the desired wind-induced uplift load at each RTWC location.
Data Analysis Approach
The normalized RTWC force coefficient time history CFz,i(t) for each load cell is defined as:
where Fz,i(t) is the time history of measured force on each load cell, ρ is the density of air, UH is the mean wind speed at mean roof height of the building model, and Li and Bi are the tributary length and width of each load cell, respectively. The positive values of force coefficients indicate upward wind loads and the negative values indicate downward wind loads. The statistical moments and observed peak force coefficients can be directly calculated from the time histories of CFz,i(t).
The time history of total uplifting force on the roof Fz(t) and the corresponding time history of total uplift force coefficient CFz(t) are defined as:
where n is the total number of load cells, L and B are the total building length and width, respectively.
The PTS approach is used to correct the peak force coefficients for each RTWC to correct for the missing low-frequency component in the simulated flow turbulence, as shown in Figure 3C. The PTS technique focuses on obtaining a good match of the high-frequency part of the turbulence spectrum of RTWC, while the effect of the missing low-frequency part of the spectrum for large-scale models is compensated in the post-test analysis process through a quasi-steady approach. It should be mentioned that the efficacy and accuracy of the PTS method were previously validated by comparing predicted local peak pressure coefficients from tests on large-scale models from WOW with various scale models of the Silsoe cube and full-scale measurements of the Texas Tech University building (Mooneghi et al., 2016; Moravej, 2018). For rigid structures without the dynamic effect due to wind loads, the PTS approach can be extended to RTWCs for low-rise buildings.
Results and Discussion
General Characteristics of Dynamic RTWC Force Coefficients
The RTWCs of two trusses near one gable end wall, i.e., trusses #1 and #2 and loads measured by LC #6, #7, #13, and #14 (Figure 6) are selected to represent the characteristics of RTWCs wind loads. These loads are measured by JR3 6-DOF load cells which have the capacity to capture the dynamic wind loads. The fully enclosed building is first discussed in this section. The time histories, CFz,i(t), at 0, 90, and 180° wind directions are shown in Figure 9. When wind is parallel to the roof ridge (0 or 180° wind angle), the uplift wind loads are almost zero at the trusses near the leeward wall, as shown in Figure 9A, while the uplift wind loads are large at the trusses closest to the windward edge walls shown in Figure 9B. When wind is normal to the roof ridge (90° wind angle), the RTWCs wind loading at the windward wall are almost the same, as shown in Figure 9C, while the RTWCs located at the leeward corners of the building experienced a reduction in wind loading compared to other leeward RTWCs located toward the center of the roof, as pictured in Figure 9D. This is due to the 3D flow effect of the wind flow around the building model.
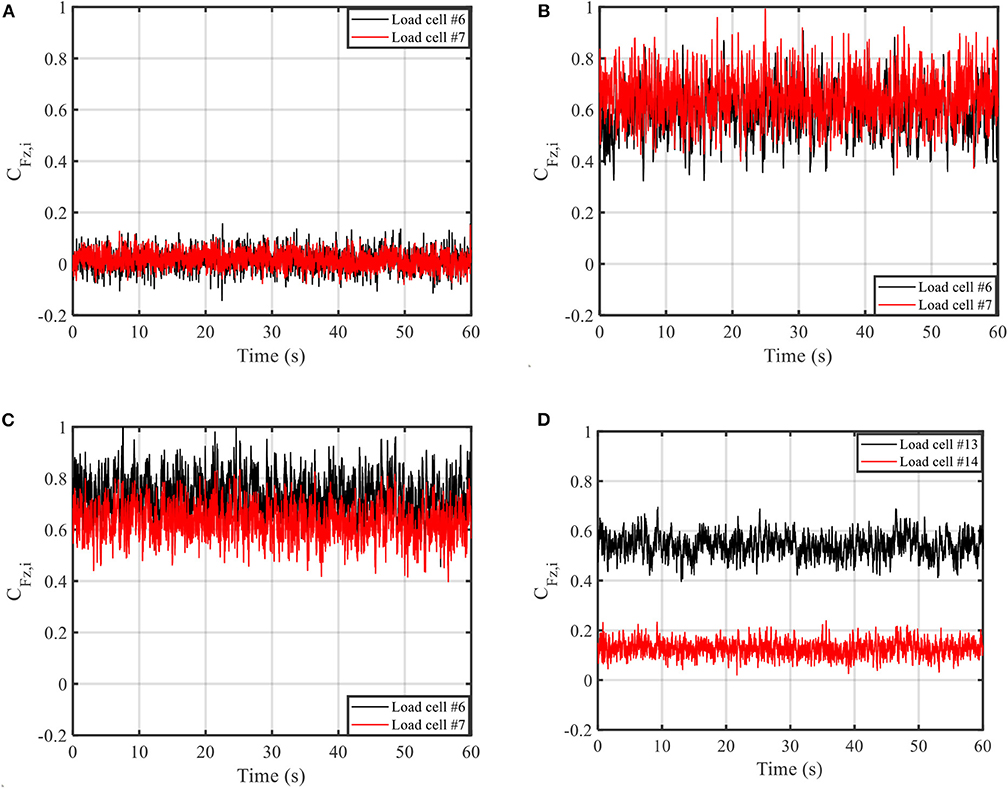
Figure 9. Time history samples of RTWC force coefficients (fully enclosed building). (A) 0°, windward direction. (B) 180°, windward direction. (C) 90°, windward wall. (D) 90°, leeward wall.
Figure 10 shows the first four statistical moments of RTWCs at LCs #6 and #7 as a function of the wind angles, which are mean, standard deviation (STD), skewness and kurtosis. Figure 10A shows that the maximum of mean force coefficients of LCs #6 and #7 is observed at around 90 and 160°, respectively. Figure 10B shows that the standard deviation (STD) of force coefficients for both LCs #6 and #7 reach their maximum at 180°, which is due to the strong flow separation at the roof close to the south gable end wall of the building. Figures 10C,D show that the skewness and kurtosis are around zero and three, respectively, for both LCs #6 and #7 at all the wind angles. This means that the RTWCs force coefficients follow a Gaussian distribution. It is well-known that the roof pressures experience a strong non-Gaussian distribution at the flow separation zones, but that is not the same for RTWC forces. Because of the central limit theorem, the summation of several non-Gaussian pressures leads to the RTWC forces follow a Gaussian distribution at the separation zones.
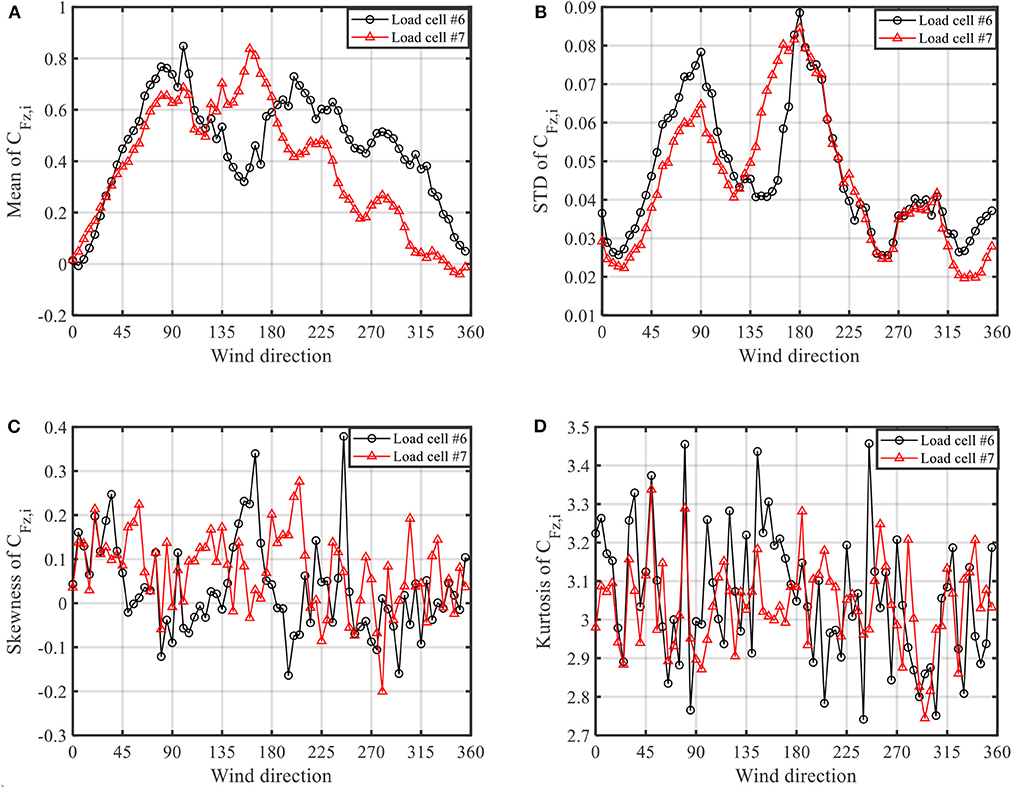
Figure 10. Statistical moments of RTWC force coefficients (fully enclosed building). (A) Mean. (B) STD. (C) Skewness. (D) Kurtosis.
Figure 11 shows the peak RTWC force coefficients of LCs #6 and #7 as a function of wind directions. The observed peaks are obtained from the 1-min time histories of RTWC force coefficients. The results show that the observed 1-min peak of the RTWC force coefficient of Truss #1 (truss closest to the gable south wall) is 1.18 and the observed peak force coefficient is around 1.
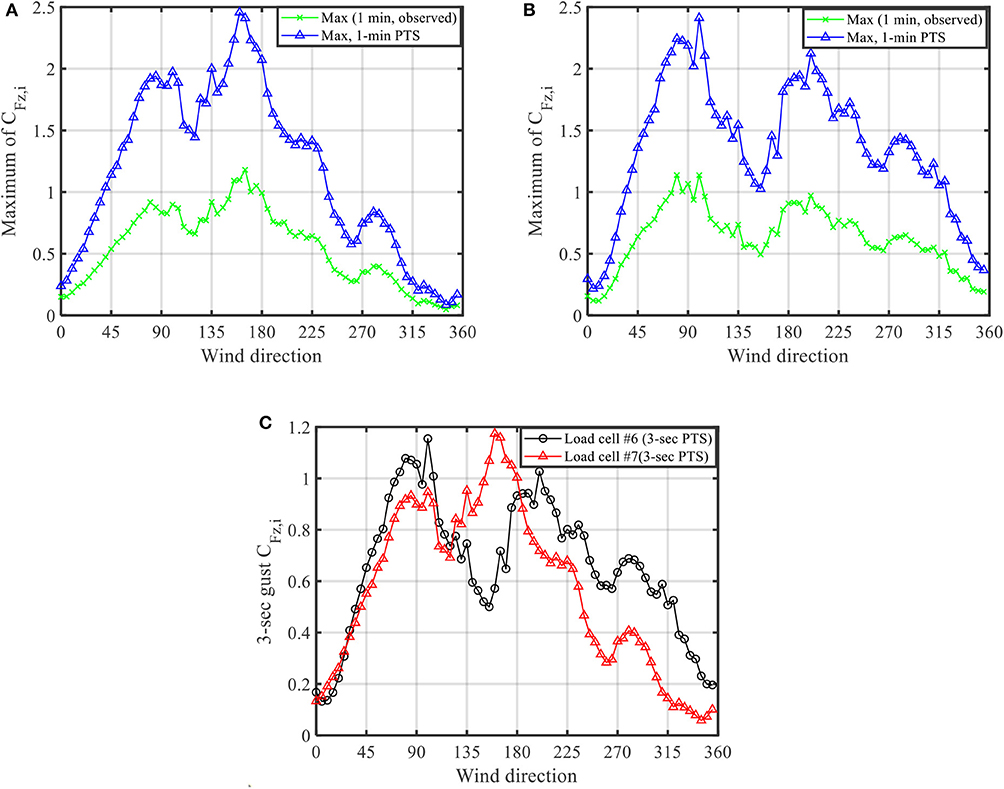
Figure 11. Peak force coefficients CFz, i (fully enclosed building). (A) Load cell #7 (corner). (B) Load cell #6. (C) Observed 3 s gust after PTS approach.
To consider the effect of the missing low-frequency component from the simulated wind flow, the PTS approach is used to re-estimate the peak force coefficients. In the PTS approach, the missing low-frequency turbulence intensity at reference height (zref = 1.1 m) is , which is calculated from ESDU based on the turbulence intensity of the prototype model and the measured turbulence intensity from WOW shown in Figure 3B. The same amount of mission low-frequency turbulence is added at all heights and the turbulence intensity profile generated by WOW is largely improved compared with full scale as shown in Figure 3B. The cumulative distribution function (CDF) of extreme value distribution of force coefficients is modified by the missing low-frequency turbulence intensity IuL (Mooneghi et al., 2016). Eighty sub-intervals (N = 80) are used for fitting the parameters in extreme value distribution (Fisher Tippet Type I distribution). The estimated peak value during the target time interval from PTS is determined by the probability of exceedance per subinterval , where Ptar = 0.78 is usually used in wind tunnel studies and 1/N′ is the ratio of time interval of each sub-intervals over the target time. In the case of 1-min time interval with N = 80, the value of , which gives G = 0.0031. Figure 11 compares the 1-min observed peaks from the measured time history samples and the corrected 1-min peaks using the PTS approach. The significant increase of peak force coefficients is observed when the missing low-frequency component from the simulated wind flow is included.
In order to compare with ASCE 7-16 (ASCE 7, 2016) in the following section, the 3 s gust force coefficients Ĉp,3 sec are converted from hourly peak force coefficients. The hourly peak with the number of sub-intervals N = 80 can be similarly calculated based on CDF of extreme value distribution of force coefficient modified by PTS approach with the probability of exceedance per subinterval G = 5.18 × 10⁻⁵. The 3 s gust force coefficients can be calculated from , where the ratio Û3 sec/Uhourly can be approximated as Û3 sec/Uhourly ≈ 1 + 3Iu, ESDU = 1.67 (ASCE 7, 2016). The 3 s gust of force coefficients of LCs #6 and #7 from WOW after PTS modification is displayed in Figure 11C.
Mean Load Distribution
The measured mean of RTWC wind load distributions is displayed in Figure 12 for wind directions of 90, 135, 160 and 180°, where 90 and 180° are corresponding to wind directions perpendicular and parallel to the ridge, respectively. Other wind angles have similar load distributions thus are not shown here. At a wind angle of 90°, the wind loads tend to be evenly distributed on the windward and leeward sides of the roof, with the windward RTWCs exhibiting larger force coefficients than their leeward counterparts. As noted earlier, the leeward corners experienced reduced force coefficients especially when the wind was acting perpendicular to the roof ridge, due to the 3D flow effects of the flow in these leeward corner regions. For wind angles from 135 to 180°, it is observed that the wind-induced loads decrease along the roof length as the distance from the windward side of the building increases. For most of the cases, as the wind angle increases from 90 to 180°, it was noticed that the wind loads increased for RTWCs close to the windward wall whereas they decreased for RTWCs farther away from the windward wall. At a wind angle of 160°, the mean uplifting force experienced by LC #7 reaches its peak value.
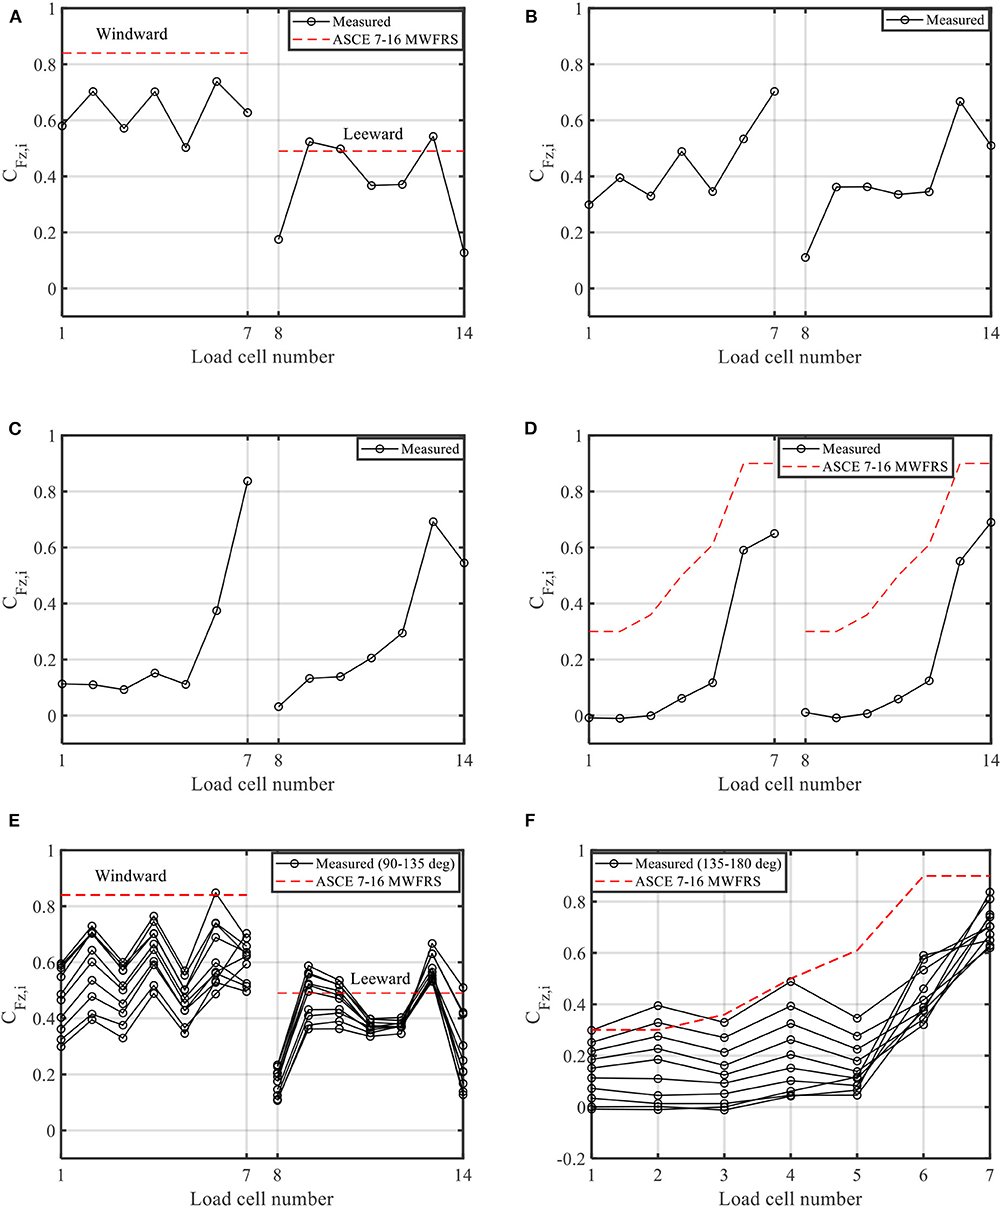
Figure 12. Mean force coefficient distributions for enclosed building. (A) 90° wind angle, normal to ridge. (B) 135° wind angle. (C) 160° wind angle. (D) 180° wind angle, parallel to ridge. (E) Multiple wind angles (90–135°). (F) Multiple wind angles (135–180°).
The measured mean load distributions are compared with ASCE 7-16 (ASCE 7, 2016) MWFRS described in Chapter 27, where the provisions provide the mean wind load distribution for two wind directions only: one normal to the ridge and the other one parallel to the ridge. It is observed that the ASCE 7-16 MWFRS values have a similar trend as the measured loads at the WOW but show higher values in general. It should be noted that, in the case of wind normal to the ridge (wind angle of 90° in this paper), ASCE 7-16 does not consider the load reduction at RTWCs located on the leeward corners. When wind is parallel to the ridge, the ASCE 7-16 wind loads present higher values of RTWC force coefficients compared to the ones measured at WOW at 180°. Figures 12E,F portray the mean force coefficient distributions in multiple angles from 90 to 135° and from 135 to 180°, their envelopes compared with ASCE 7-16 for wind normal and parallel to the ridge, respectively. The results show that the envelopes of measured mean force coefficient from different wind angles agree better with force coefficients given in ASCE 7-16.
Effect of Openings
The effect of openings in the building envelope is discussed in this subsection. The presence of an opening changes the building classification from fully enclosed to partially enclosed, and the openings allow internal pressurization of the building. This has a significant effect on the net forces exerted on the building structural components including RTWCs. For the partially enclosed test cases, experiments were confined to the most unfavorable wind angles, i.e., when the openings were located on the windward side of the building model. Figure 13 compares the mean total uplift force coefficients acting on the entire roof for the fully enclosed building with the partially enclosed cases on the west wall (long side of the building) and the south wall (gable end wall). The results clearly demonstrate that the total uplift force on the roof is significantly increased due to the presence of the openings. In the case of the two openings located on the west wall (long side of the building), the 90° wind direction produces the largest uplift force coefficient with an increase of 0.41 in the total mean force coefficient compared with the fully enclosed building at 90°. For the partially enclosed condition with one opening on the south wall (gable end wall), the maximum total uplift force is located at a wind angle of 180°. The total mean force coefficient increased by 0.45 compared with the case of the fully enclosed building at 180°. It is clearly shown that the increase in the mean total uplift force coefficients at the most unfavorable wind angles is almost the same for both opening configurations. In addition, the results show that the opening location significantly affects the maximum of the total uplifting force on the roof. This resulted in maximum total uplift force coefficients of 0.92 and 0.65 for the case of opening on the west wall and south wall, respectively. This is due to the fully enclosed building having the largest total uplifting force when the wind is acting on the long side of the building (e.g., wind angle of 90°), which leads to the most unfavorable case for the partially enclosed building is having the opening on the long side of the building.
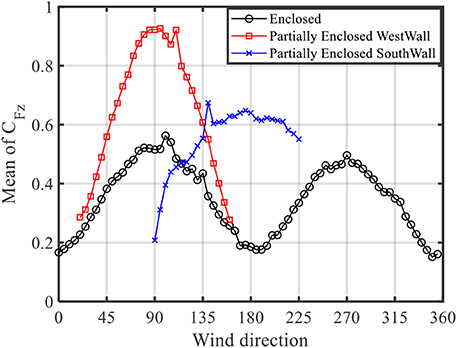
Figure 13. Effect of openings on mean of total uplift force coefficients.
Figure 14 portrays the 3 s gust force coefficients measured by the JR3 load cells after correcting the peaks with the PTS technique. The results show that the maximum 3 s gust force coefficients occur at around 90° for the case of the openings on the west wall. The maximum 3 s gust RTWC force coefficients are 1.7 and 2.1 for trusses #1 and #2, respectively. Similarly, for the case of the opening on the south wall at 180°, the maximum 3 s gust RTWC force coefficients are 1.8 and 2.1 for trusses #1 and #2, respectively. As we can see, for individual RTWCs at trusses close to the gable end wall (i.e., trusses #1 and #2), the opening location does not significantly affect the force coefficient value. This is because the individual RTWC force coefficients at trusses close to the gable end wall, for the case of the fully enclosed building, do not vary significantly at 90 and 180°, as shown in Figure 11. However, the opening locations may significantly affect the individual RTWC force coefficients for the middle span trusses.
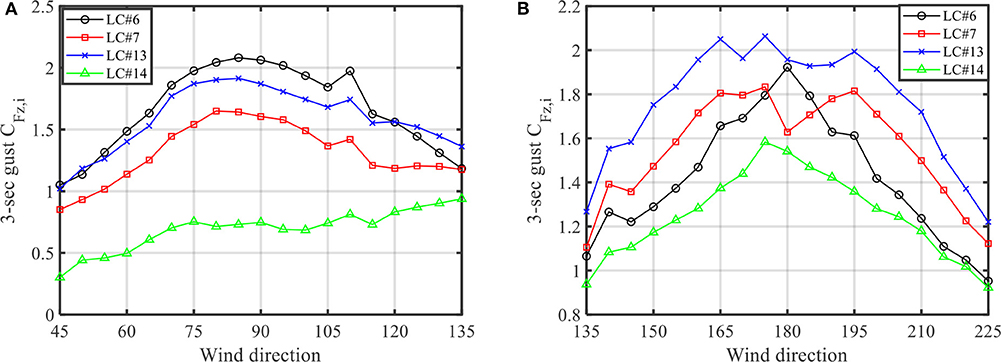
Figure 14. 3-sec gust force coefficients corrected with PTS. (A) Partially enclosed west wall building. (B) Partially enclosed south wall building.
Comparison With ASCE 7-16
A comparison between the results of WOW measurements and the ASCE 7-16 (ASCE 7, 2016) values for both Main Wind Force Resisting System (MWFRS) and Components and Cladding (C&C) for both fully and partially enclosed buildings is shown in Figure 15. The maximum 3 s gust force coefficients after applying the PTS technique at the most unfavorable wind angles for trusses #1 and #2 are plotted. Generally, the results show that the measured data agree well with ASCE 7-16 MWFRS force coefficients, with the latter one exhibiting lower values.
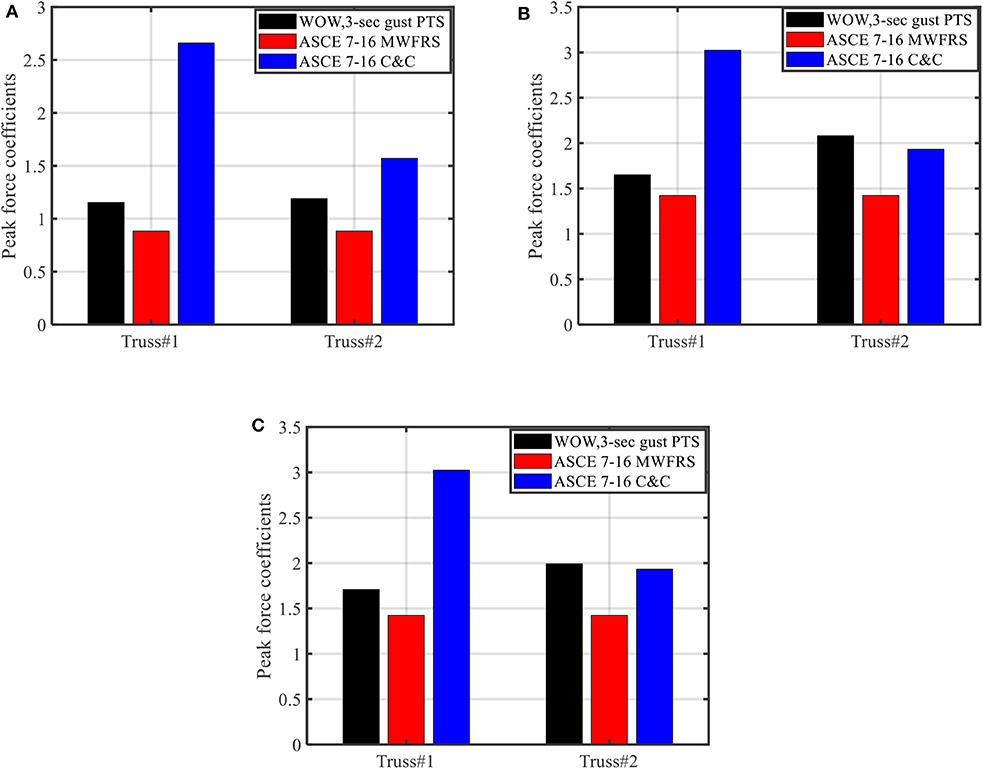
Figure 15. Maximum uplift force coefficient from all wind directions, compared with ASCE 7–16. (A) Enclosed building. (B) Partially enclosed building (west wall). (C) Partially enclosed building (south wall).
Figure 15 shows that the ASCE 7 (2016) C&C provides an over-estimation of the RTWC force coefficients for gable end truss (truss #1), and provides a good estimation for the first adjacent truss (truss #2) of the partially enclosed building configuration. On the other hand, the ASCE 7-16 C&C provides a decrease of RTWC force coefficients from trusses #1 to #2, while the measured data shows that similar quantities for the enclosed building configuration and slightly increase of RTWC force coefficients from trusses #1 to #2 for the partially enclosed building configurations.
The discrepancies observed in the measured data compared with ASCE 7-16 MWFRS and C&C may be attributed to the wind loads and the load path from the roof to trusses. The ASCE calculation in this study is based on the traditional tributary-area-based load path approach. The limitation of this approach is shown in the previous studies. It showed that the load sharing to the RTWCs highly depends on the structural property of the roof system and the discrepancy exists compared with RTWCs loads based on the Databased-Assisted Design approach and that from ASCE (Mensah et al., 2011; Morrison et al., 2012; Datin and Prevatt, 2013). Unlike the traditional tributary-area-based load path approach, the Databased-Assisted Design approach needs the information of influence function at each pressure tap location on the roof. The future study needs to investigate the load path from the roof to RTWCs by experimental measuring or finite element modeling the influence function of the roof system used in this study. To be better compare the RTWC loads from measurement and ASCE, the influence function need to be applied to the ASCE 7-16 wind pressure to estimate the wind loads on RTWCs. It should be noted again that the load path is highly influenced by relative stiffness of the roof framing, stiffness of sheathing members and fastener, etc. Thus, the wind loads on RTWCs in this study may be different from other roof structural systems.
Conclusions
A 1:4 large-scale model of a low-rise gabled roof residential wooden building was tested at the Wall of Wind (WOW) facility at Florida International University (FIU). Fourteen load cells were mounted at the roof-to-wall connections (RTWCs) level, underneath seven roof trusses, to measure the net wind forces experienced by the roof for various wind directions. The opening effects on RTWCs were considered by conducting the testing for one enclosed building and two partially enclosed building configurations. The RTWC wind loads were corrected by using a partial turbulence simulation (PTS) technique to compensate for the missing low-frequency turbulence for large-scale testing. General characteristics of RTWC force coefficients were discussed and the measured RTWC loads were compared with ASCE 7-16 provisions.
The results of this study show that the RTWC wind loads follow Gaussian distribution for the ones located in the separation zone. For most of the cases, the wind loads experienced by RTWCs are larger when the connections are closer to the windward wall. The leeward corners experienced reduced force coefficients especially when the wind was acting perpendicular to the roof ridge, due to the 3D flow effects.
The total mean uplift force on the roof is significantly increased due to the presence of the openings when the openings were located on the windward side of the building model. The location of the opening has a significant effect on the total maximum uplifting force on the roof, but less effect on the individual maximum RTWC force coefficients under trusses located near the gable end walls. The most unfavorable case pertaining to the overall roof maximum uplift is for the partially enclosed configuration when the opening is located on the long side of the building.
In comparison to the building code, the experimental results are in between C&C and MWFRS values based on the ASCE 7-16 provisions. However, for the partially enclosed configuration, some force coefficient values slightly exceeded those suggested in the ASCE 7-16 C&C provisions. A difference in trends of the force coefficients for the two trusses near gable end wall was observed compared with testing and ASCE 7-16 provisions.
Data Availability Statement
The datasets generated for this study are available on request to the corresponding author.
Author Contributions
CF was a research specialist at the WOW. CF carried out most of the data analysis along with AE (Assistant Professor in CEE, FIU) and AG (Prof. in CEE, FIU). CF has written most sections of this paper in collaboration with the co-authors. DC was another research specialist at the WOW. He has designed the experiment. Graduate students ZA and KV drafted the introduction and experiment methodology parts, respectively. DC and KV helped with the ASCE 7 calculations. AE and AG have reviewed the results and revised the manuscript.
Funding
The authors would like to acknowledge the financial contributions of the State of Florida Division of Emergency Management, USA. The authors would like to also acknowledge the financial support from the National Science Foundation (NSF Award No. 1520853) to the Wall of Wind facility that was used for the tests.
Conflict of Interest
The authors declare that the research was conducted in the absence of any commercial or financial relationships that could be construed as a potential conflict of interest.
Acknowledgments
The authors greatly acknowledge the help offered by Jimmy Erwin, Roy Liu-Marques, and Research Experiences for Undergraduates (REU) student Karen Vazquez to build the model and conduct the experiments at FIU Wall of Wind. Dr. Peter Irwin's advice on the research is greatly acknowledged.
References
Ahmed, S. S., Canino, I., Chowdhury, A. G., Mirmiran, A. and Suksawang, N. (2011). Study of the capability of multiple mechanical fasteners in roof-to-wall connections of timber residential buildings. Pract. Period. Struct. Design Constr. 16, 2–9. doi: 10.1061/(ASCE)SC.1943-5576.0000064
Blake, E. S., and Zelinsky, D. A. (2018). National Hurricane Center Tropical Cyclone Report. Hurricane Harvey 2018, 1–77.
Cangialosi, J. P., Latto, A. S., and Berg, R. (2018). National Hurricane Center Tropical Cyclone Report: Hurricane Irma. Miami, FL: National Oceanic and Atmospheric Administration.
Canino, I., Chowdhury, A. G., Mirmiran, A. and Suksawang, N. (2011). Triaxial load testing of metal and FRP roof-to-wall connectors. J. Archit. Eng. 17, 112–120. doi: 10.1061/(ASCE)AE.1943-5568.0000039
Chowdhury, A. G., Canino, I., Mirmiran, A., Suksawang, N., and Baheru, T. (2013). Wind-loading effects on roof-to-wall connections of timber residential buildings. J. Eng. Mech. 139, 386–395. doi: 10.1061/(ASCE)EM.1943-7889.0000512
Chowdhury, A. G., Zisis, I., Irwin, P., Bitsuamlak, G., Pinelli, J.-P., Hajra, B., et al. (2017). Large-scale experimentation using the 12-fan wall of wind to assess and mitigate hurricane wind and rain impacts on buildings and infrastructure systems. J. Struct. Eng. 143, 1–16. doi: 10.1061/(ASCE)ST.1943-541X.0001785
Cook, R. A., and Soltani, M. (1994). “Hurricanes of 1992: lessons learned and implications for the future,” in Proceedings of a Symposium Organized by the American Society of Civil Engineers (Miami, FL).
Datin, P. L., and Prevatt, D. O. (2013). Using instrumented small-scale models to study structural load paths in wood-framed buildings. Eng. Struct. 54, 47–56. doi: 10.1016/j.engstruct.2013.03.039
ESDU (2001). “Characteristics of atmospheric turbulence near the ground. Part II single point data for strong winds (neutral atmosphere),” in Engineering Sciences Data Unit (ESDU) (London).
Evans, S. (2019). Hurricane Michael Loss in Florida Creeps Above $6.61bn: Regulator. Available online at: https://www.artemis.bm/news/hurricane-michael-loss-in-florida-creeps-above-6--61bn-regulator (accessed October 15, 2019).
Feng, C., and Chen, X. (2018). Characterization of translating tornado-induced pressures and responses of a low-rise building frame based on measurement data. Eng. Struct. 174, 495–508. doi: 10.1016/j.engstruct.2018.07.082
Guha, T. K., Sharma, R. N., and Richards, P. J. (2011). Internal pressure dynamics of a leaky building with a dominant opening. J. Wind. Eng. Ind. Aerodyn. 99, 1151–1161. doi: 10.1016/j.jweia.2011.09.002
Habte, F., Chowdhury, A. G., and Zisis, I. (2017). Effect of wind-induced internal pressure on local frame forces of low-rise buildings. Eng. Struct. 143, 455–468. doi: 10.1016/j.engstruct.2017.04.039
He, J., Pan, F., and Cai, C. S. (2017). A review of wood-frame low-rise building performance study under hurricane winds. Eng. Struct. 141, 512–529. doi: 10.1016/j.engstruct.2017.03.036
Kopp, G. A., Oh, J. H., and Inculet, D. R. (2008). Wind-induced internal pressures in houses. J. Struct. Eng. 134, 1129–1138. doi: 10.1061/(ASCE)0733-9445(2008)134:7(1129)
Mensah, A. F., Datin, P. L., Prevatt, D. O., Gupta, R., and Van de Lindt, J. W. (2011). Database-assisted design methodology to predict wind-induced structural behavior of a light-framed wood building. Eng. Struct. 33, 674–684. doi: 10.1016/j.engstruct.2010.11.028
Mooneghi, M. A., Irwin, P., and Chowdhury, A. G. (2016). Partial turbulence simulation method for predicting peak wind loads on small structures and building appurtenances. J. Wind. Eng. Ind. Aerodyn. 157, 47–62. doi: 10.1016/j.jweia.2016.08.003
Moravej, M. (2018). Investigating Scale Effects on Analytical Methods of Predicting Peak Wind Loads on Buildings. FIU Electronic Theses and Dissertations.
Morrison, M. J., Henderson, D. J., and Kopp, G. A. (2012). The response of a wood-frame, gable roof to fluctuating wind loads. Eng. Struct. 41, 498–509. doi: 10.1016/j.engstruct.2012.04.002
NSB (2007). Hurricane Warning: The Critical Need for a National Hurricane Research Initiative. Arlington, VA: National Science Board; National Science Foundation.
Pinelli, J.-P, Roueche, D., Kijewski-Correa, T., Plaz, F., Prevatt, D., Zisis, I., et al. (2018). Overview of damage observed in regional construction during the passage of Hurricane Irma over the State of Florida. Forensic Eng. 18, 1028–1038. doi: 10.1061/9780784482018.099
Reed, T. D., Rosowsky, D. V., and Schiff, S. D. (1997). Uplift capacity of light-frame rafter to top plate connections. J. Archit. Eng. 3, 156–163. doi: 10.1061/(ASCE)1076-0431(1997)3:4(156)
Reinhold, T. A. (2006). Wind loads and anchorage requirements for rooftop equipment. ASHRAE 48, 36–43.
Riley, M. A., and Sadek, F. (2003). Experimental Testing of Roof to Wall Connections in Wood Frame Houses. Building and Fire Research Laboratory, NISTIR 6938. Gaithersburg, MD: National Institute of Standards and Technology (NIST).
Rosowsky, D. V., Reed, T. D., and Tyner, K. G. (1998). Establishing uplift design values for metal connectors in light-frame construction. J. Test. Eval. 26, 426–433. doi: 10.1520/JTE12024J
Sharma, R. N., and Richards, P. J. (2003). The influence of Helmholtz resonance on internal pressures in a low-rise building. J. Wind. Eng. Ind. Aerodyn. 91, 807–828. doi: 10.1016/S0167-6105(03)00005-9
Keywords: roof to wall connection, wind loads, wind tunnel testing, wall of wind, openings, partial turbulence simulation, building code
Citation: Feng C, Gan Chowdhury A, Elawady A, Chen D, Azzi Z and Vutukuru KS (2020) Experimental Assessment of Wind Loads on Roof-to-Wall Connections for Residential Buildings. Front. Built Environ. 6:10. doi: 10.3389/fbuil.2020.00010
Received: 06 October 2019; Accepted: 21 January 2020;
Published: 07 February 2020.
Edited by:
Weichiang Pang, Clemson University, United StatesReviewed by:
Pedro L. Fernández-Cabán, Clarkson University, United StatesDavid Brett Roueche, Auburn University, United States
Copyright © 2020 Feng, Gan Chowdhury, Elawady, Chen, Azzi and Vutukuru. This is an open-access article distributed under the terms of the Creative Commons Attribution License (CC BY). The use, distribution or reproduction in other forums is permitted, provided the original author(s) and the copyright owner(s) are credited and that the original publication in this journal is cited, in accordance with accepted academic practice. No use, distribution or reproduction is permitted which does not comply with these terms.
*Correspondence: Amal Elawady, YWVsYXdhZHlAZml1LmVkdQ==