 Amarnath M. Hegde
 Prasad S. Palsule
- 1Department of Civil and Environmental Engineering, Indian Institute of Technology Patna, Patna, India
- 2Research Scholar, Department of Civil and Environmental Engineering, Indian Institute of Technology Patna, Patna, India
Use of the geosynthetics to strengthen the soil is one of the highly desirable techniques under static and dynamic loads. The present study describes the experimental and numerical studies performed on the geosynthetic reinforced subgrade subjected to repeated vehicle loads. The cyclic plate load tests were conducted on the sand subgrade reinforced with planar and 3D geosynthetic reinforcements. The vehicle load was simulated by applying a repeated load of magnitude 275 kPa with 1 Hz frequency on the reinforced subgrade. Results of the experimental investigations revealed that the performance of the subgrade soil improved significantly in the presence of reinforcements. The estimated parameters illustrated the three-fold reduction in settlement of the subgrade in the presence of reinforcement. Further, the heaving of the subgrade soil was found completely arrested with the use of geosynthetic reinforcement. The three-dimensional geocell reinforcement performed effectively as compared to planar geogrids under dynamic load. The measured pressure values at different depth demonstrated a significant reduction in the pressure in the presence of reinforcements. Besides, numerical simulations were performed using PLAXIS2D to understand pressure and settlement distribution patterns in the reinforced subgrade. In overall, a good agreement was observed between numerical and experimental results.
Introduction
The modern geotechnical design practices ensure that the structures should be founded on soils which can perform satisfactorily under different kind of loads. These loads are of static as well as dynamic in nature in case of highways, railways, runways, machine foundations, and live loads for storage tanks, etc. The dynamic effects are generally considered as a fraction of static loads but act repetitively. Repetitive load application causes large settlements in substructure, which ultimately causes failure in the structure. Reinforcing weak soils with geosynthetics and metallic strips are very much acceptable in current construction practices (Gabr and Han, 2005; El Sawwaf and Nazir, 2010; Chen and Abu-Farsakh, 2015; Abu-Farsakh et al., 2016; Sahu et al., 2018). Planar geotextiles (woven and non-woven), geogrids, and three-dimensional geocell reinforcements are used to strengthen the weak subgrades. These are extensible inclusions and impart strength with increased interface friction and confinement of soil. It also helps in distributing stresses uniformly over a broader area. The geosynthetic reinforcements reduce the settlements and increase the load-carrying capacity of the subgrade soils.
The depression of the roadway surface is commonly known as the rut. The rut formation is observed in flexible pavements due to deformation of the subgrade layer. This deformation of subgrade layer generally caused due to the wheel load. Many researchers have highlighted the beneficial effects of geosynthetic reinforcements in foundation applications under static and dynamic loadings (Tafreshi and Dawson, 2010; Asakereh et al., 2013; Hegde and Sitharam, 2013; Abu-Farsakh et al., 2013; Elsaied et al., 2015; Chen and Abu-Farsakh, 2015; Saride et al., 2015; Abu-Farsakh et al., 2016; Hegde and Sitharam, 2016; Suku et al., 2016; Elleboudy et al., 2017; Sahu et al., 2018). However, the behavior of reinforced pavement sections under repeated wheel loads was studied by very few researchers. The dynamic loadings with varying amplitudes and frequency cause permanent deformations in subgrades (Leng and Gabr, 2002; Saride et al., 2015; Abu-Farsakh et al., 2016; Suku et al., 2016; Elleboudy et al., 2017). Thus, the subgrade soils should be tested under cyclic loads before construction of pavement. Tafreshi and Dawson (2010) compared the improvement in the performance of the pavement reinforced with different types of geosynthetics under repeated loading. Geocell reinforced subgrade showed better performance as compared to geogrid reinforced subgrade. Asakereh et al. (2013) analyzed strip footing placed over a void in sand bed under static and cyclic loadings. The study was performed by varying void depth, number of reinforcement layers and loading magnitude. It was observed that the maximum footing settlement was increased by three times for cyclic loading in comparison to static load. It was concluded that both depth of the void and number of geogrid layers have significant influence on footing behavior. Tafreshi et al. (2015) performed cyclic plate load tests on the pavement section reinforced with two layers of geocell. It was concluded that the optimum depth of top layer and intra-layer spacing of geocell layers should be 0.2 times width of the loading plate. The use of geocell mattress as a reinforcement decreased the accumulation of plastic strain in subgrade. Abu-Farsakh et al. (2016) conducted model tests on reinforced pavement sections using triaxial geogrid and woven geotextile under repeated loading. The study showed that the use of geosynthetic at base-subgrade interface increased the traffic benefit ratio (TBR) beyond 1.5. The accumulated permanent deformation was found reduced due to wider and uniform stress distribution in reinforced sections.
Elleboudy et al. (2017) assessed the effectiveness of geogrid layer at the interface of weak subgrade and gravel sub-base. The vertical deformation was reduced by 18–54% in the presence of geogrid reinforcement. The most effective location for geogrid reinforcement was found to be at the top quarter of the base layer. Suku et al. (2016) studied the geocell reinforced granular base under repeated loading for unpaved roads. The study showed that the resilient modulus increases due to the provision of reinforcement. Thakur et al. (2017) studied the influence of factors such as geocell reinforcement, subgrade strength on the deformations of the recycled asphalt pavement bases. The study highlighted a significant reduction of the permanent deformations of the subgrade in the presence of reinforcement. Mamatha and Dinesh (2019) evaluated the rutting behavior of geocell reinforced model pavement sections under repeated loading. The introduction of geocell reinforcement at the interface of subgrade and base reduced the rutting by 13–71%.
Sahu et al. (2018) conducted model footing tests on reinforced foundations incorporating human hair fibers and PET/HDPE geogrid. The free vibration tests showed that the natural frequency and damping properties were improved for reinforced sand. Pokharel et al. (2018) conducted repeated loading tests on reinforced bases with “Novel Polymeric Alloy” geocell filled using poorly graded river sand and quarry waste. The improvement in the working life of pavement was quantified with the help of the traffic benefit ratio. The TBR was observed in the range of 8–12 in the presence of geocell reinforcement. Saride et al. (2015) conducted a series of tests on sand subgrade sections under repeated application of equivalent single axle wheel load. The optimum geocell mattress size was determined for the reduced rut depth of the pavement section. The geocell mattress of height equal to the diameter of the loading plate and width equal to 4.33 times the loading plate diameter was determined as the optimum geometry of reinforcement.
In overall, a very limited literature is available related to comparison of the performance of planar and geocell reinforced subgrade under dynamic loads in pavement applications. In the present study, cyclic plate load tests have been carried out to compare the performance of sand subgrades reinforced with a single geogrid layer, geocell mattress, and geocell with a basal geogrid layer. In addition, numerical simulations have been performed using PLAXIS2D to complement the experimental findings.
Materials and Methods
Natural sand with specific gravity (Gs) of 2.59 and effective grain size (D10) of 0.2 mm was used in the present study. It was characterized as poorly graded sand (SP) as per the Unified Soil Classification System. The coefficient of uniformity (Cu) and coefficient of curvature (Cc) values were obtained as 2.65 and 1.74, respectively. The grain size distribution of soil is shown in Figure 1A. The shear strength parameters were determined by the direct shear test as per IS 2720-13 (1986) part. The angle of internal friction of sand was determined as 34°. The relative density test was carried out as per IS 2720-14 (1983) part. The sand has a minimum void ratio (emin) of 0.405 and a maximum void ratio (emax) of 0.66. The two types of geosynthetics, namely geocell and geogrid were used. The biaxial geogrid with a square aperture opening of 35 mm was used. The tensile strength test was carried out on geogrid and geocell material as per ASTM D6637 (2011) and ASTM D6693 (2015), respectively. The results obtained are shown in Figure 1B. The properties of reinforcement materials are summarized in Table 1.
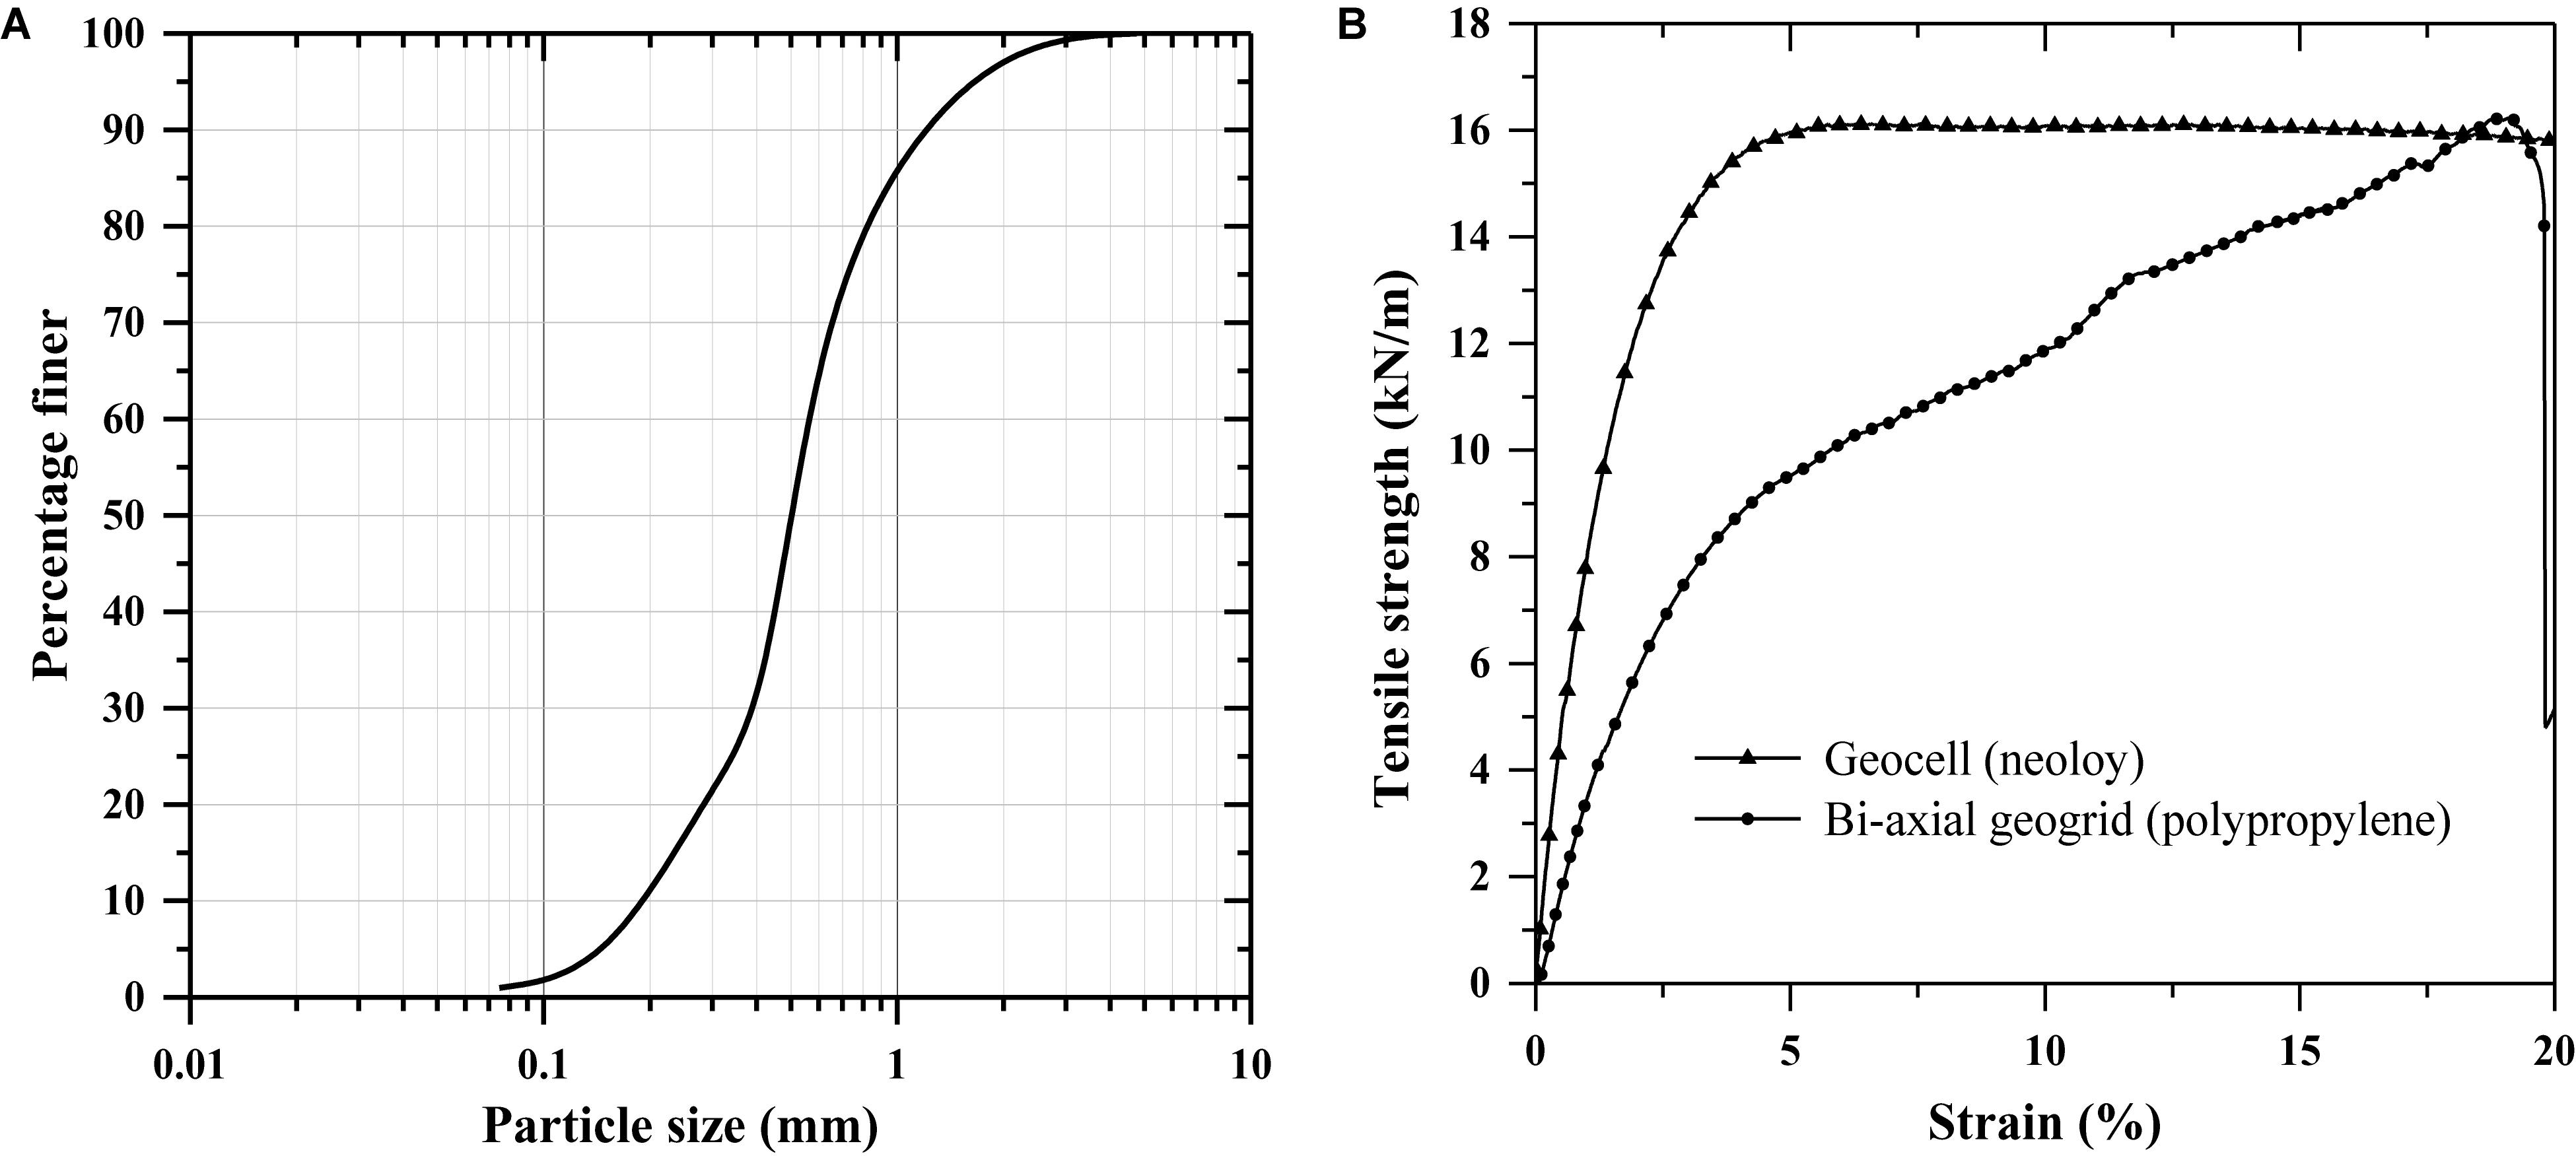
Figure 1. Material properties: (A) grain size distribution of sand; (B) tensile strength of geocell and geogrid.
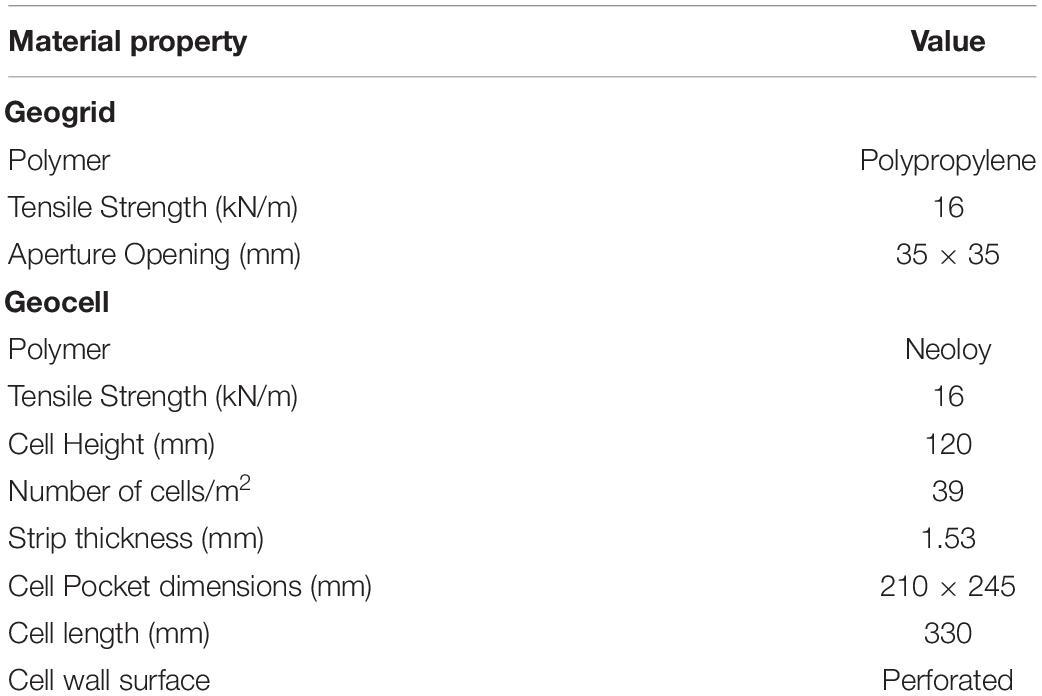
Table 1. Mechanical and physical properties of geosynthetics.
Test Setup
The equipment used in the study was designed to test the soil subgrade under static and dynamic loading. The schematic view of the testing apparatus is shown in Figure 2. The whole system consists of three components, namely a test tank, loading assembly, and data acquisition system. The test tank with the dimensions of 1000 × 1000 × 1000 mm was used. The three sides of the tank were made up of rigid steel walls. Plexiglas was used on one side for visual observations. The internal faces of tank walls were smoothened to reduce friction between backfill material and wall surface. The loading assembly mainly consisted of reaction frame, hydraulic system with an actuator, and control module. The actuator can produce monotonic as well as harmonic loading with a frequency of 1 Hz. The load cell of 50 kN capacity along with LVDT having a measuring range of 0–150 mm was attached to the actuator. The rigid steel plate of diameter 150 mm and thickness of 25 mm was used to apply load on the subgrade. The loading plate dimensions are in accordance of the guidelines of ASTM D1195/1195M (2015). A plunger was connected between an actuator and the loading plate to apply the load vertically. The control module can be operated either manually or through software.
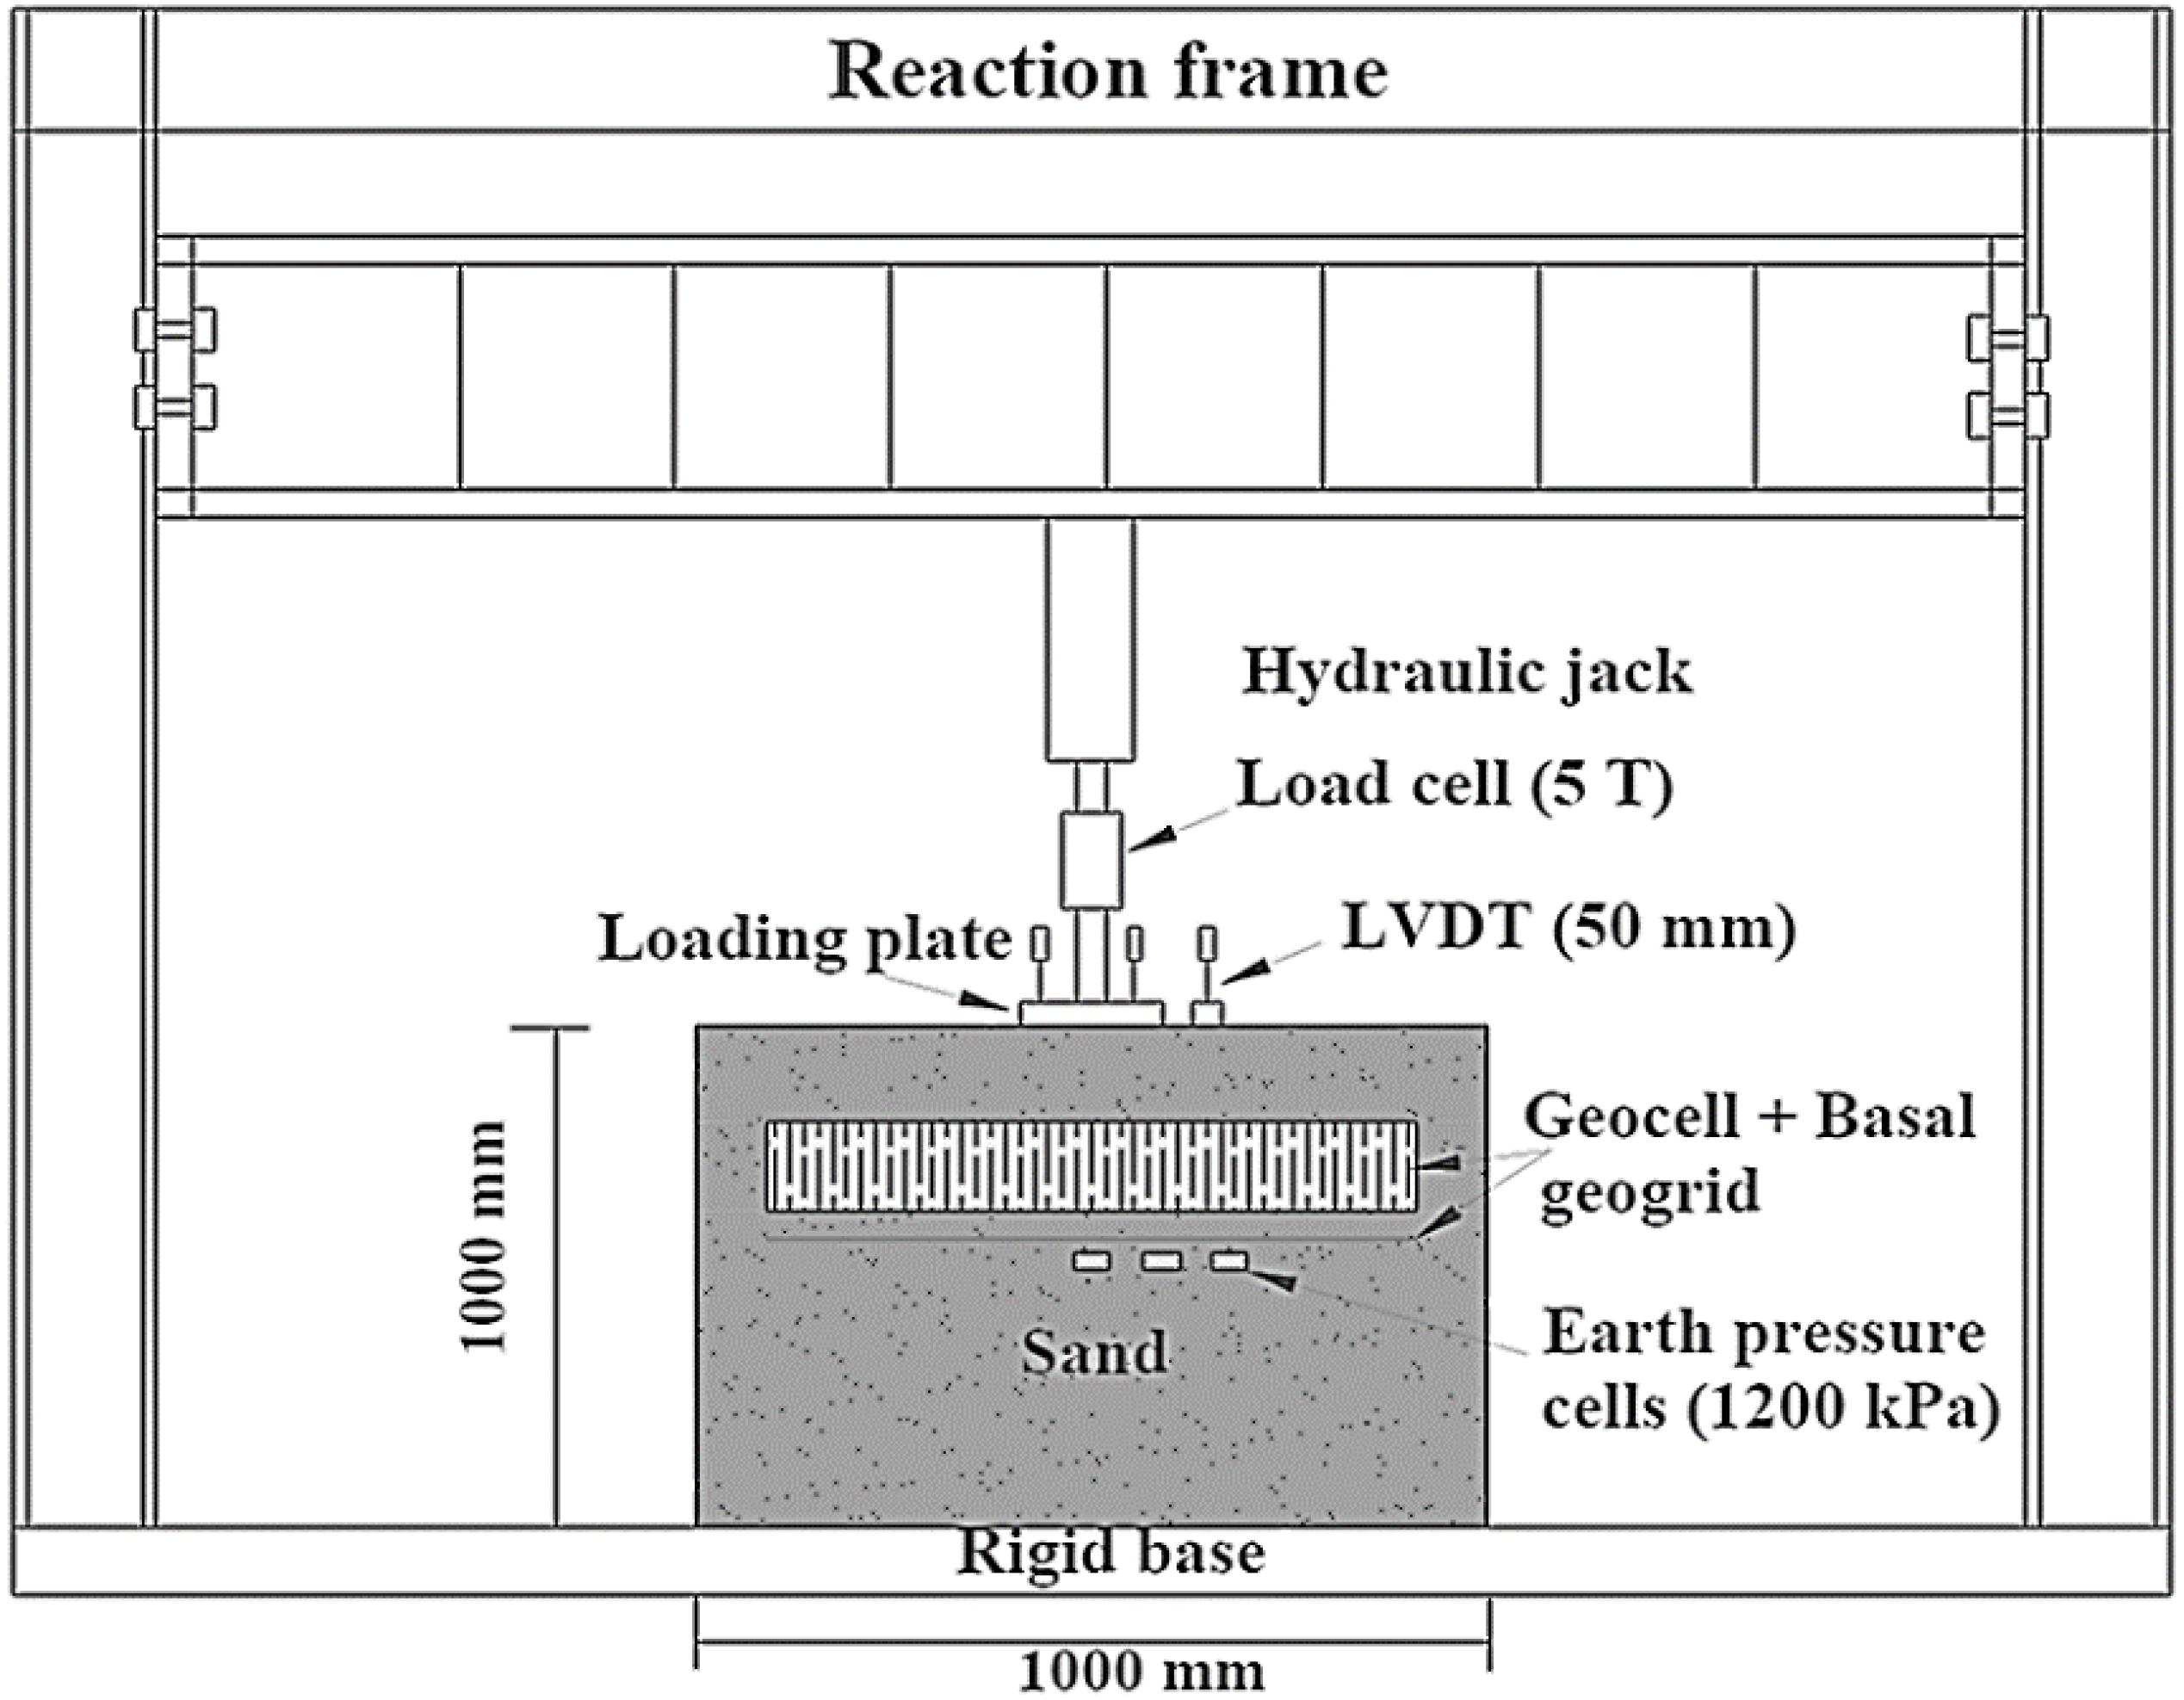
Figure 2. Schematic view of test setup.
The data acquisition box was connected to a control module to collect data transmitted from instrumentation. The data was transferred to a computer for further processing and visual output. In total, five numbers of LVDTs were connected to measure the settlement of the loading plate and soil surface. Two LVDTs having a measuring range of 0–50 mm were placed vertically on either side of the loading plate. While two more LVDTs were placed perpendicular to each other at a radial distance of 120 mm from the center of bed. The plastic base plates were used to rest the LVDT tip. The LVDT with measuring range of 0–100 mm was placed on the loading plate to define failure criteria. The loading plate settlement of 50 mm was considered as a failure of subgrade system in the present study. Once the failure settlement value was reached, the mechanism was designed to stop the cyclic loading automatically. Three earth pressure cells with capacity ranges between 0 and 1000 kPa and having least count of 1 kPa were placed at a depth of 150 mm from the surface of the sand bed. The earth pressure cells were placed at a distance of r/D equal to 0, 0.5, and 1 (where r is the radial distance of pressure cell location from the center of the loading plate). The pressure cells were used to measure the transferred pressures to subgrade at different dynamic time intervals.
Preparation of Test Bed and Procedure
The sand bed with 630 mm thickness and a relative density of 72% was prepared using the pluviation technique. To formulate the height of fall required for each layer, a number of trial tests were performed. The depth of the reinforcement was decided based on recommendations given by previous researchers (Tafreshi and Dawson, 2010; Hegde and Sitharam, 2013; Tafreshi et al., 2015). The four test series, namely C0, C1, C2, and C3, were conducted, and corresponding details are presented in Table 2. For test series C1 and C2, the geogrid and geocell layer were placed at the depth equal to 0.3D and 0.1D, respectively, where D was the diameter of the loading plate. In the test series “C3,” the geogrid layer was placed just below the geocell reinforcement. The b/D ratio for geogrid layer and geocell reinforcement was 5.8 and 3.7, respectively. The loading plate was placed at the center of sand bed. The LVDTs were arranged to measure average settlement of loading plate and soil surface settlement as discussed in the previous section. Figure 3 shows the geometry details of test arrangement. Each measurement was represented in terms of diameter of the loading plate, D. These dimensionless parameters are helpful in correlating the test results with large scale experiments.
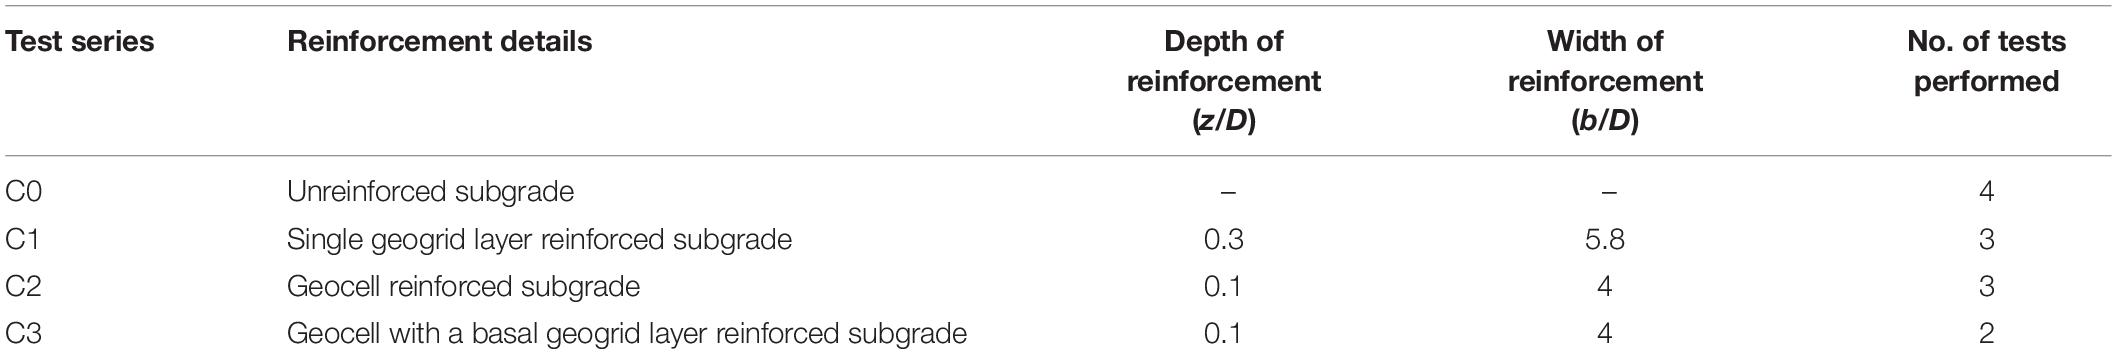
Table 2. Test series for different reinforced subgrades.
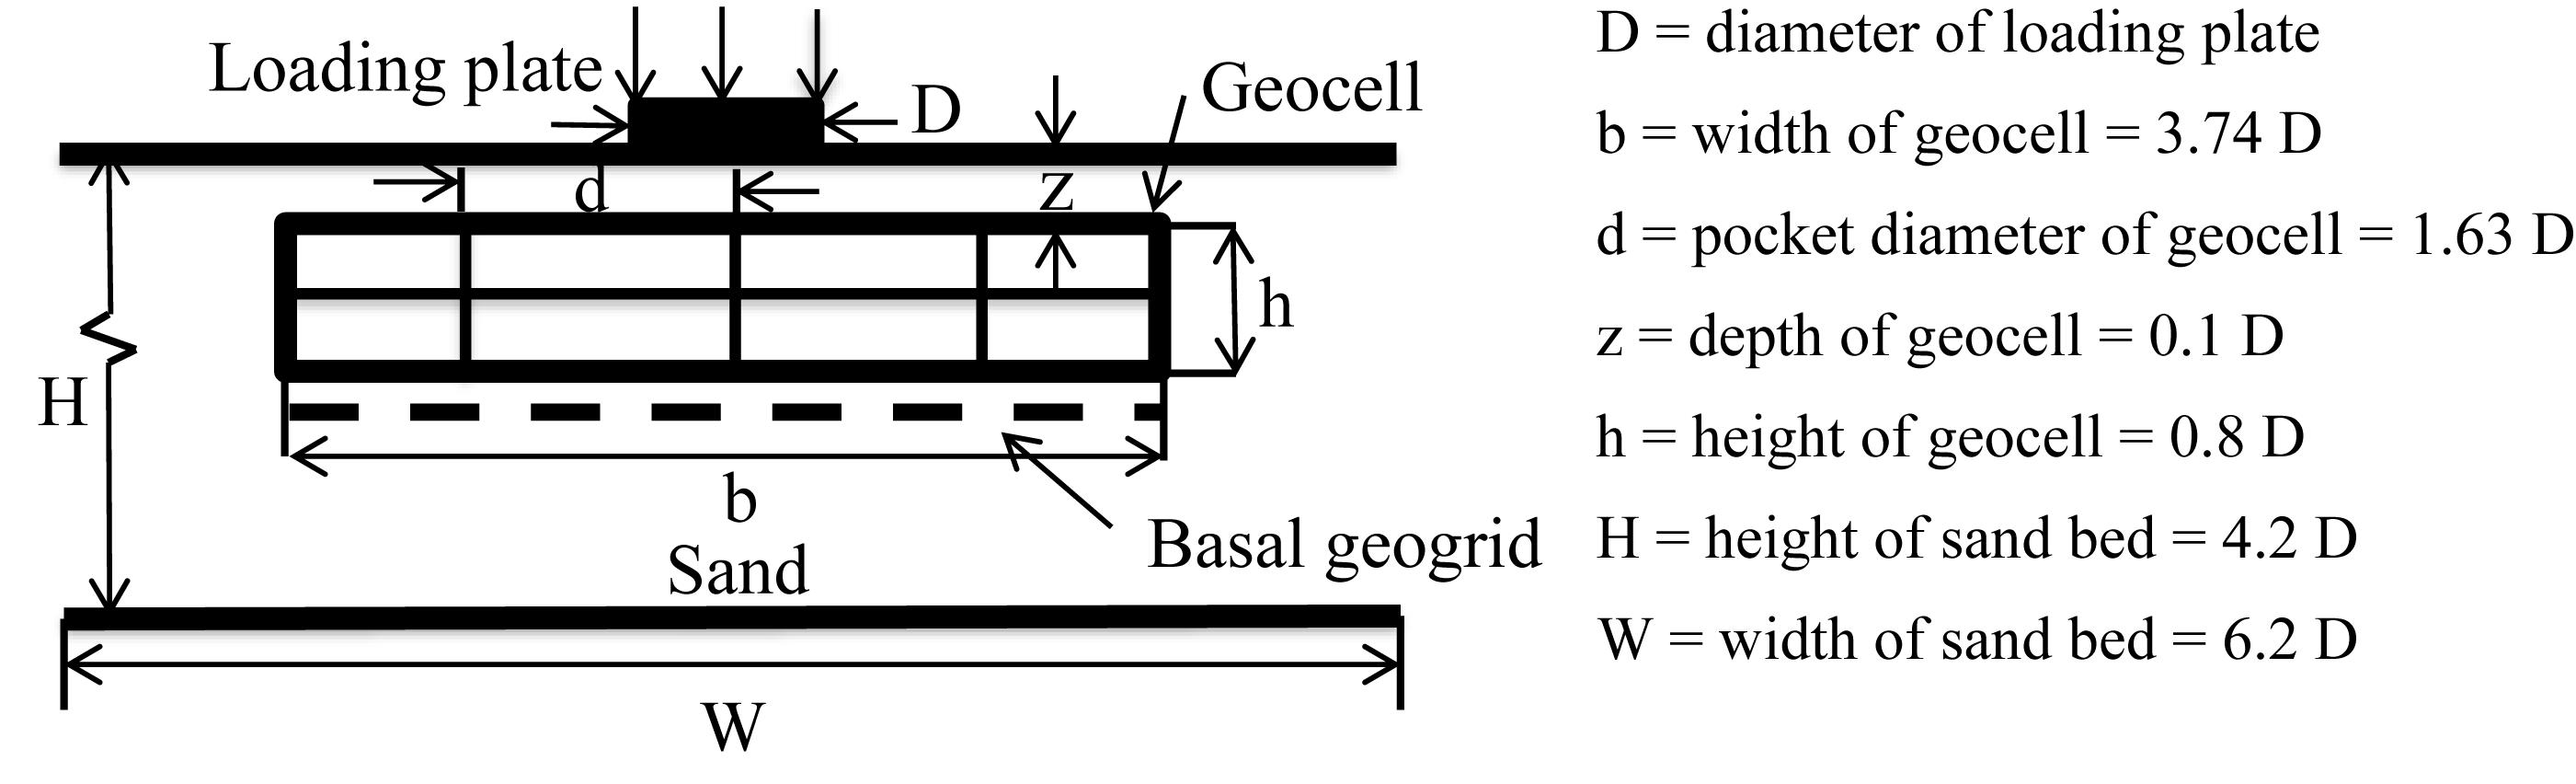
Figure 3. Detailed sectional view of reinforced test bed.
The prepared sand bed was leveled without disturbing its density to prevent eccentric load application. In the present study, the dynamic loads originating from traffic movement are mainly considered as a driving force to cause failures. A load amplitude of 400 kPa was considered as an equivalent truck load at the surface (Brito et al., 2009). A thin asphalt layer was assumed at the top of the pavement. Considering the load dispersion effect, reduced single wheel load on the subgrade was calculated as 275 kPa using KENPAVE analysis. A similar load amplitude was also reported by Huang (1993). The harmonic loading of amplitude 275 kPa was applied with a frequency of 1 Hz. The load amplitude value was supported by previous studies. Most of the researchers used single wheel load between 108 kPa to 800 kPa with frequency ranging from 0.33 Hz to 2 Hz to simulate traffic loading (Faragher et al., 2000; Tafreshi and Khalaj, 2008; Tafreshi and Dawson, 2010; Cao et al., 2016; Abu-Farsakh et al., 2016; Khalaj et al., 2017; Wang et al., 2018). To apply the load uniformly, the ball-socket arrangement was used. The load was continued until the failure criteria achieved. For every test series, multiple tests were performed for the repeatability check.
Results and Discussion
The settlement ratio (s/D) is calculated as the ratio of settlement to the diameter of the loading plate. Figure 4 shows the typical variation of settlement ratio with applied pressure for the geocell with a basal geogrid. The settlement ratio was increased sharply for the first few cycles. The rate of increment in the settlement ratio decreased with increasing loading cycles. This decreased incremental rate attributed to the densification of soil below the loading plate.
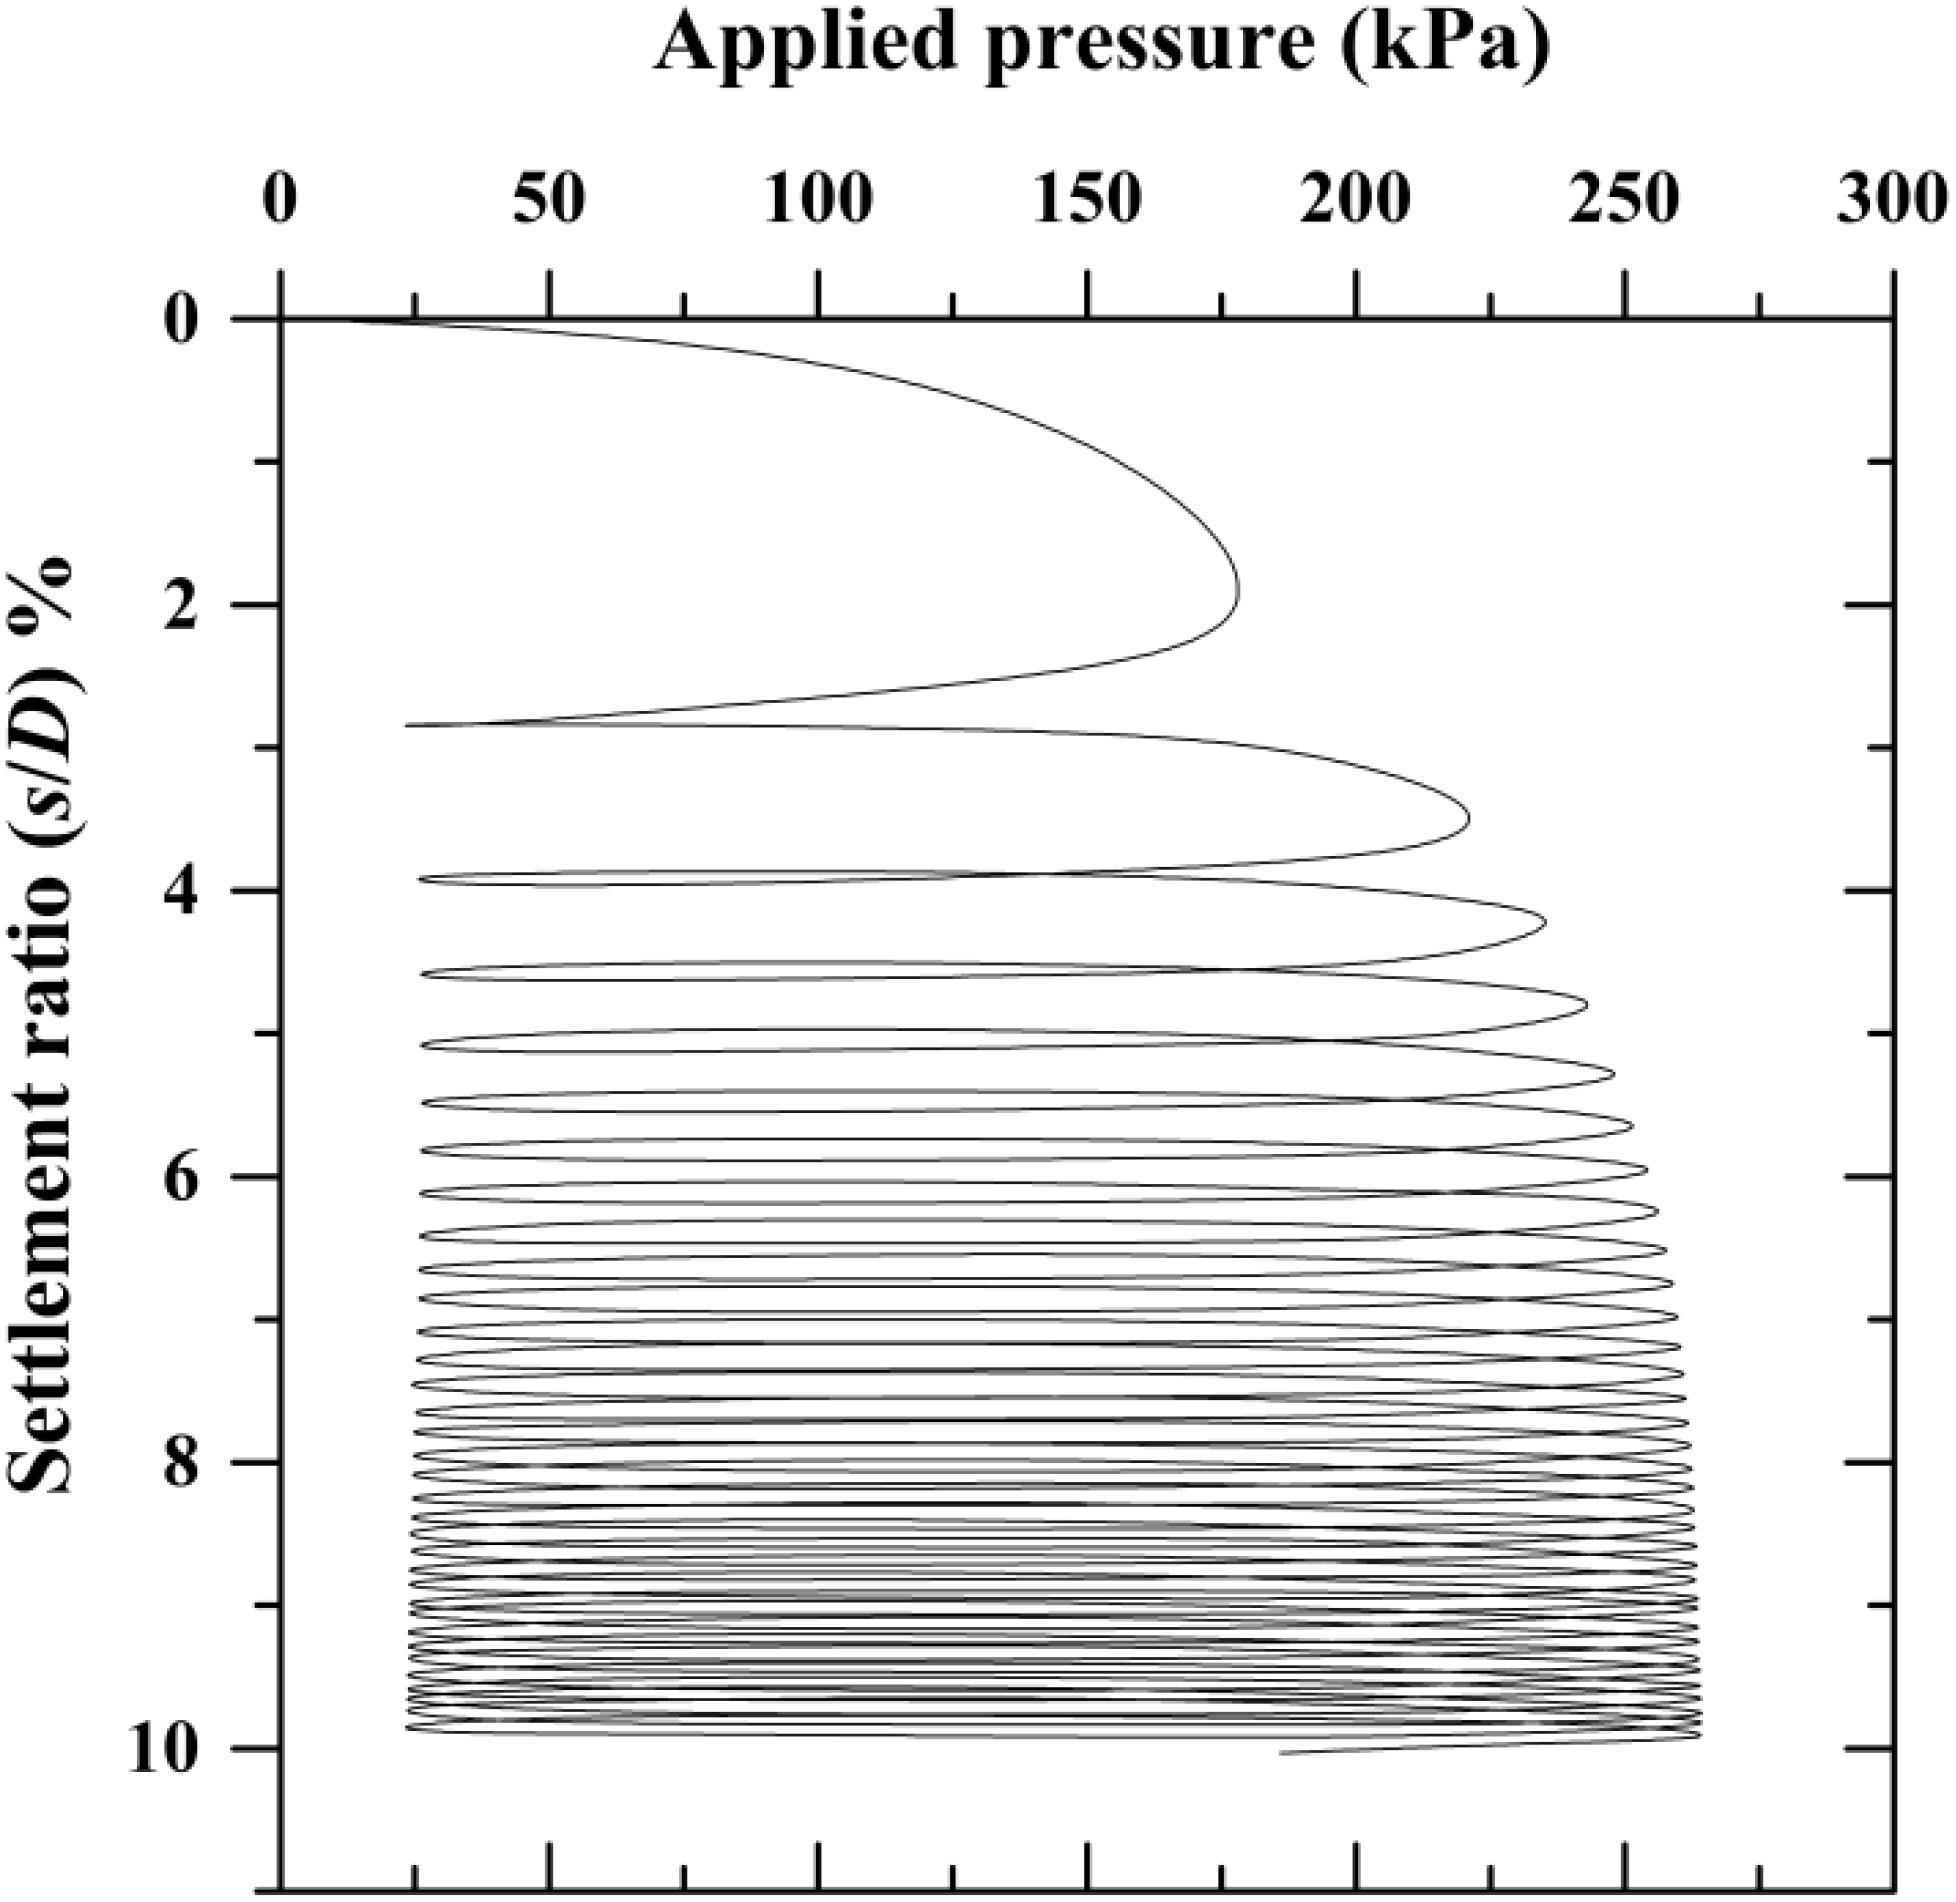
Figure 4. Typical variation of settlement ratio with applied pressure.
The effectiveness of reinforcement in reducing the settlement was calculated using the percentage reduction in settlement (PRS). Mathematically, it is defined as,
where S0 is the settlement of unreinforced case; Sr is the settlement of reinforced pavement section of equal thickness for an equal number of loading cycles. The percentage reduction in settlement (PRS) was determined for all the reinforced cases. Figure 5 shows the reduction in settlement for reinforced test series. The PRSfor each case was compared at the end of 75 numbers of loading cycles. The maximum PRS value of 57% was observed for the case of geocell with basal geogrid.
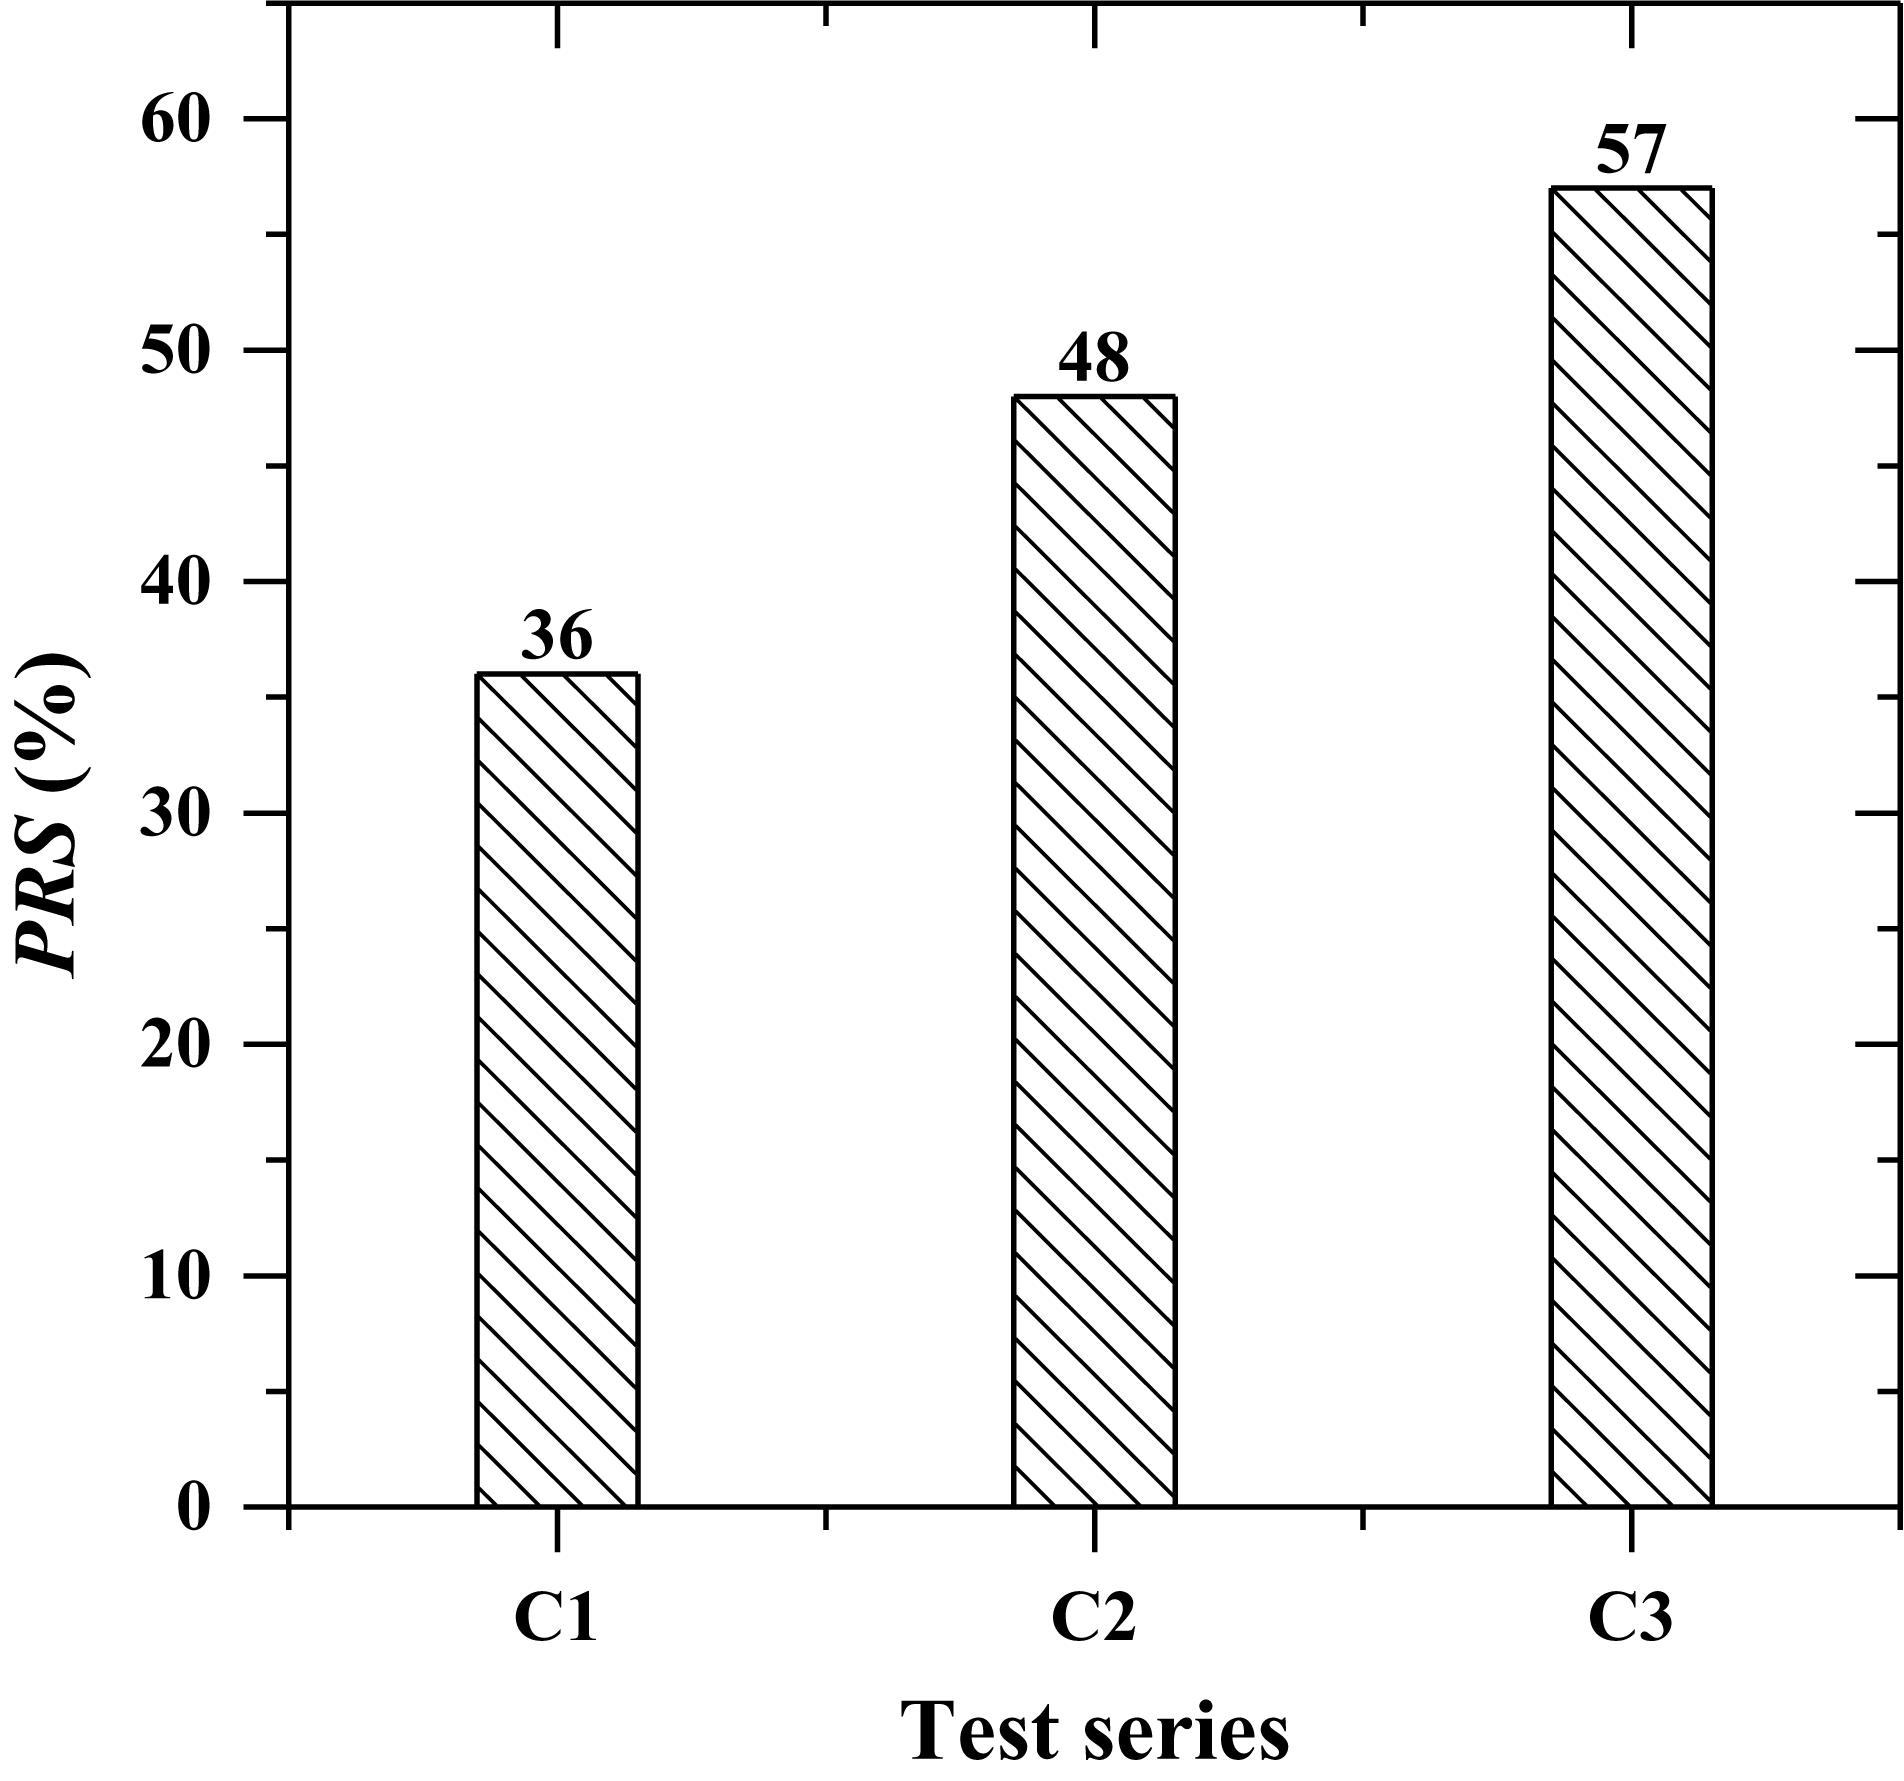
Figure 5. Percentage reduction in settlement for different reinforced subgrades.
Figure 6A shows the variation of settlement ratio with the number of cycles for unreinforced and reinforced sand subgrades. The failure criterion was set equal to 50 mm for loading plate settlement. The maximum number of loading cycles counted for reinforced subgrade section until failure. As compared to the unreinforced pavement section, significant improvement was observed in reinforced pavements to undergo equal deformation with prolonged loading cycles. The number of loading cycles was increased by 11, 17, and 30 times, respectively, due to the provision of geogrid, geocell, and geocell with basal geogrid reinforcements. Similar observations were also reported by Asakereh et al. (2013).
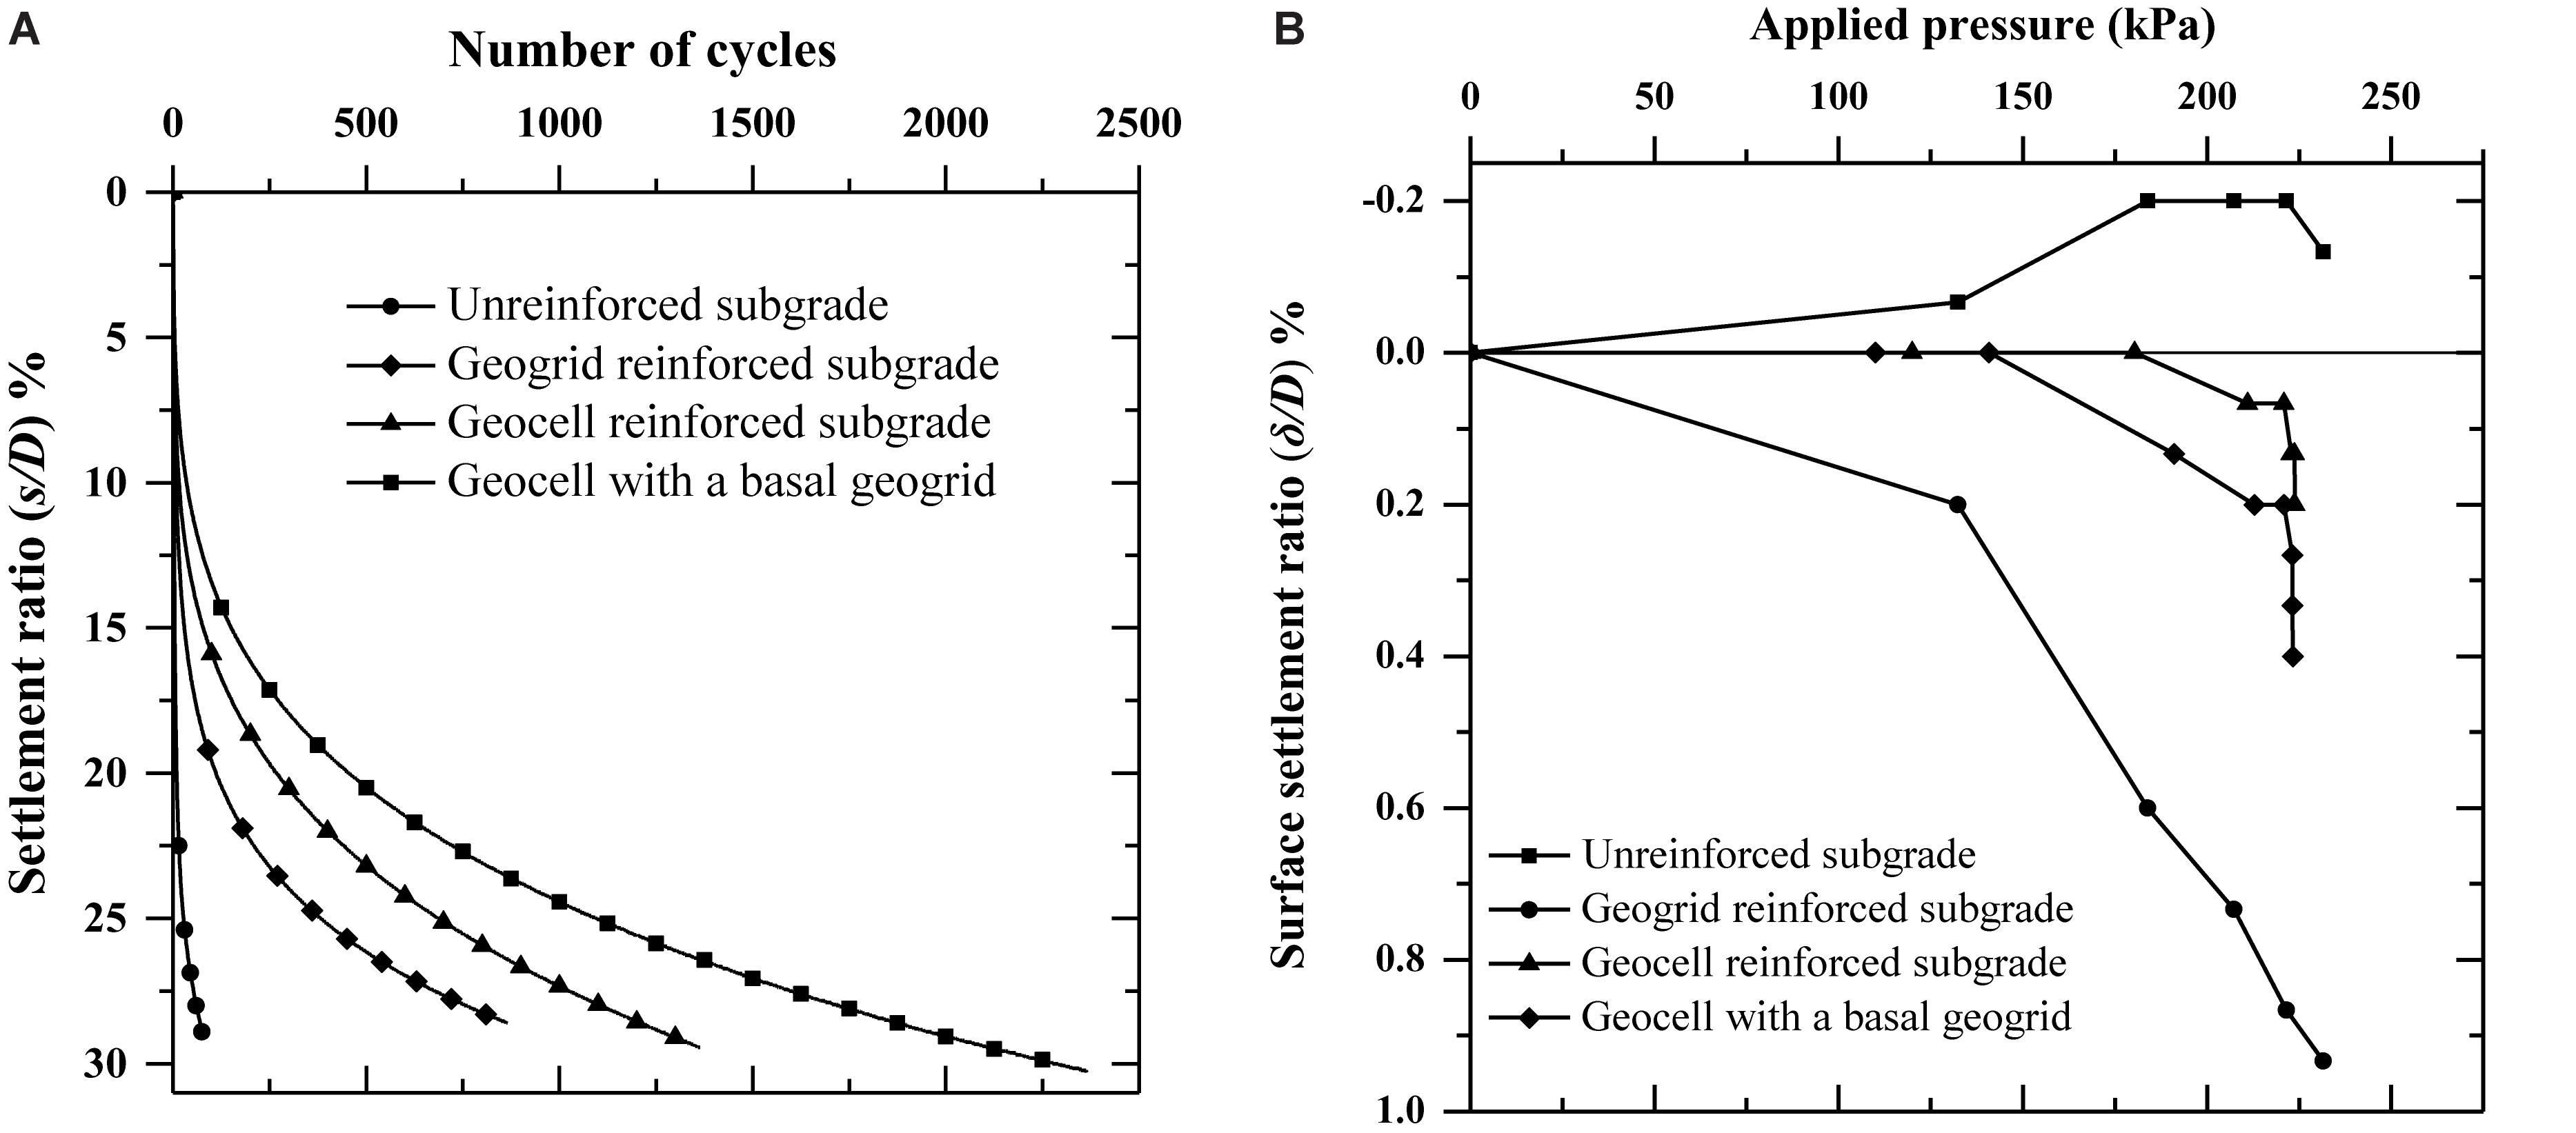
Figure 6. Test results: (A) variation of settlement ratio with the number of cycles; (B) variation of soil surface settlement with applied pressure.
Figure 6B shows the variation of the surface settlement ratio (δ/D) with applied pressure. For the unreinforced case, heaving was observed at the surface of the subgrade. It could lead to undulations in the road surface, which will cause discomfort to traffic. The reinforced subgrades C1, C2, and C3 showed no heaving in the soil surface. Irrespective of the type of reinforcement provided, the heaving was completely arrested. The reduced surface heaving suggested the uniform distribution of applied pressure over the pavement surface. The soil surface depression reduced by about 65% in case of geocell reinforcement as compared to a single geogrid layer reinforced subgrade. The settlement contours were plotted at different radial distances from the center of the load application. Figures 7A–D shows the settlement contours for different cases with the increasing number of loading cycles. In most of the cases, the loading plate was subjected to a differential settlement with the increase in the number of loading cycles. The calculated settlement ratio was less than 5% at a radial distance of 120 mm for all test series irrespective of the type of reinforcement provided.
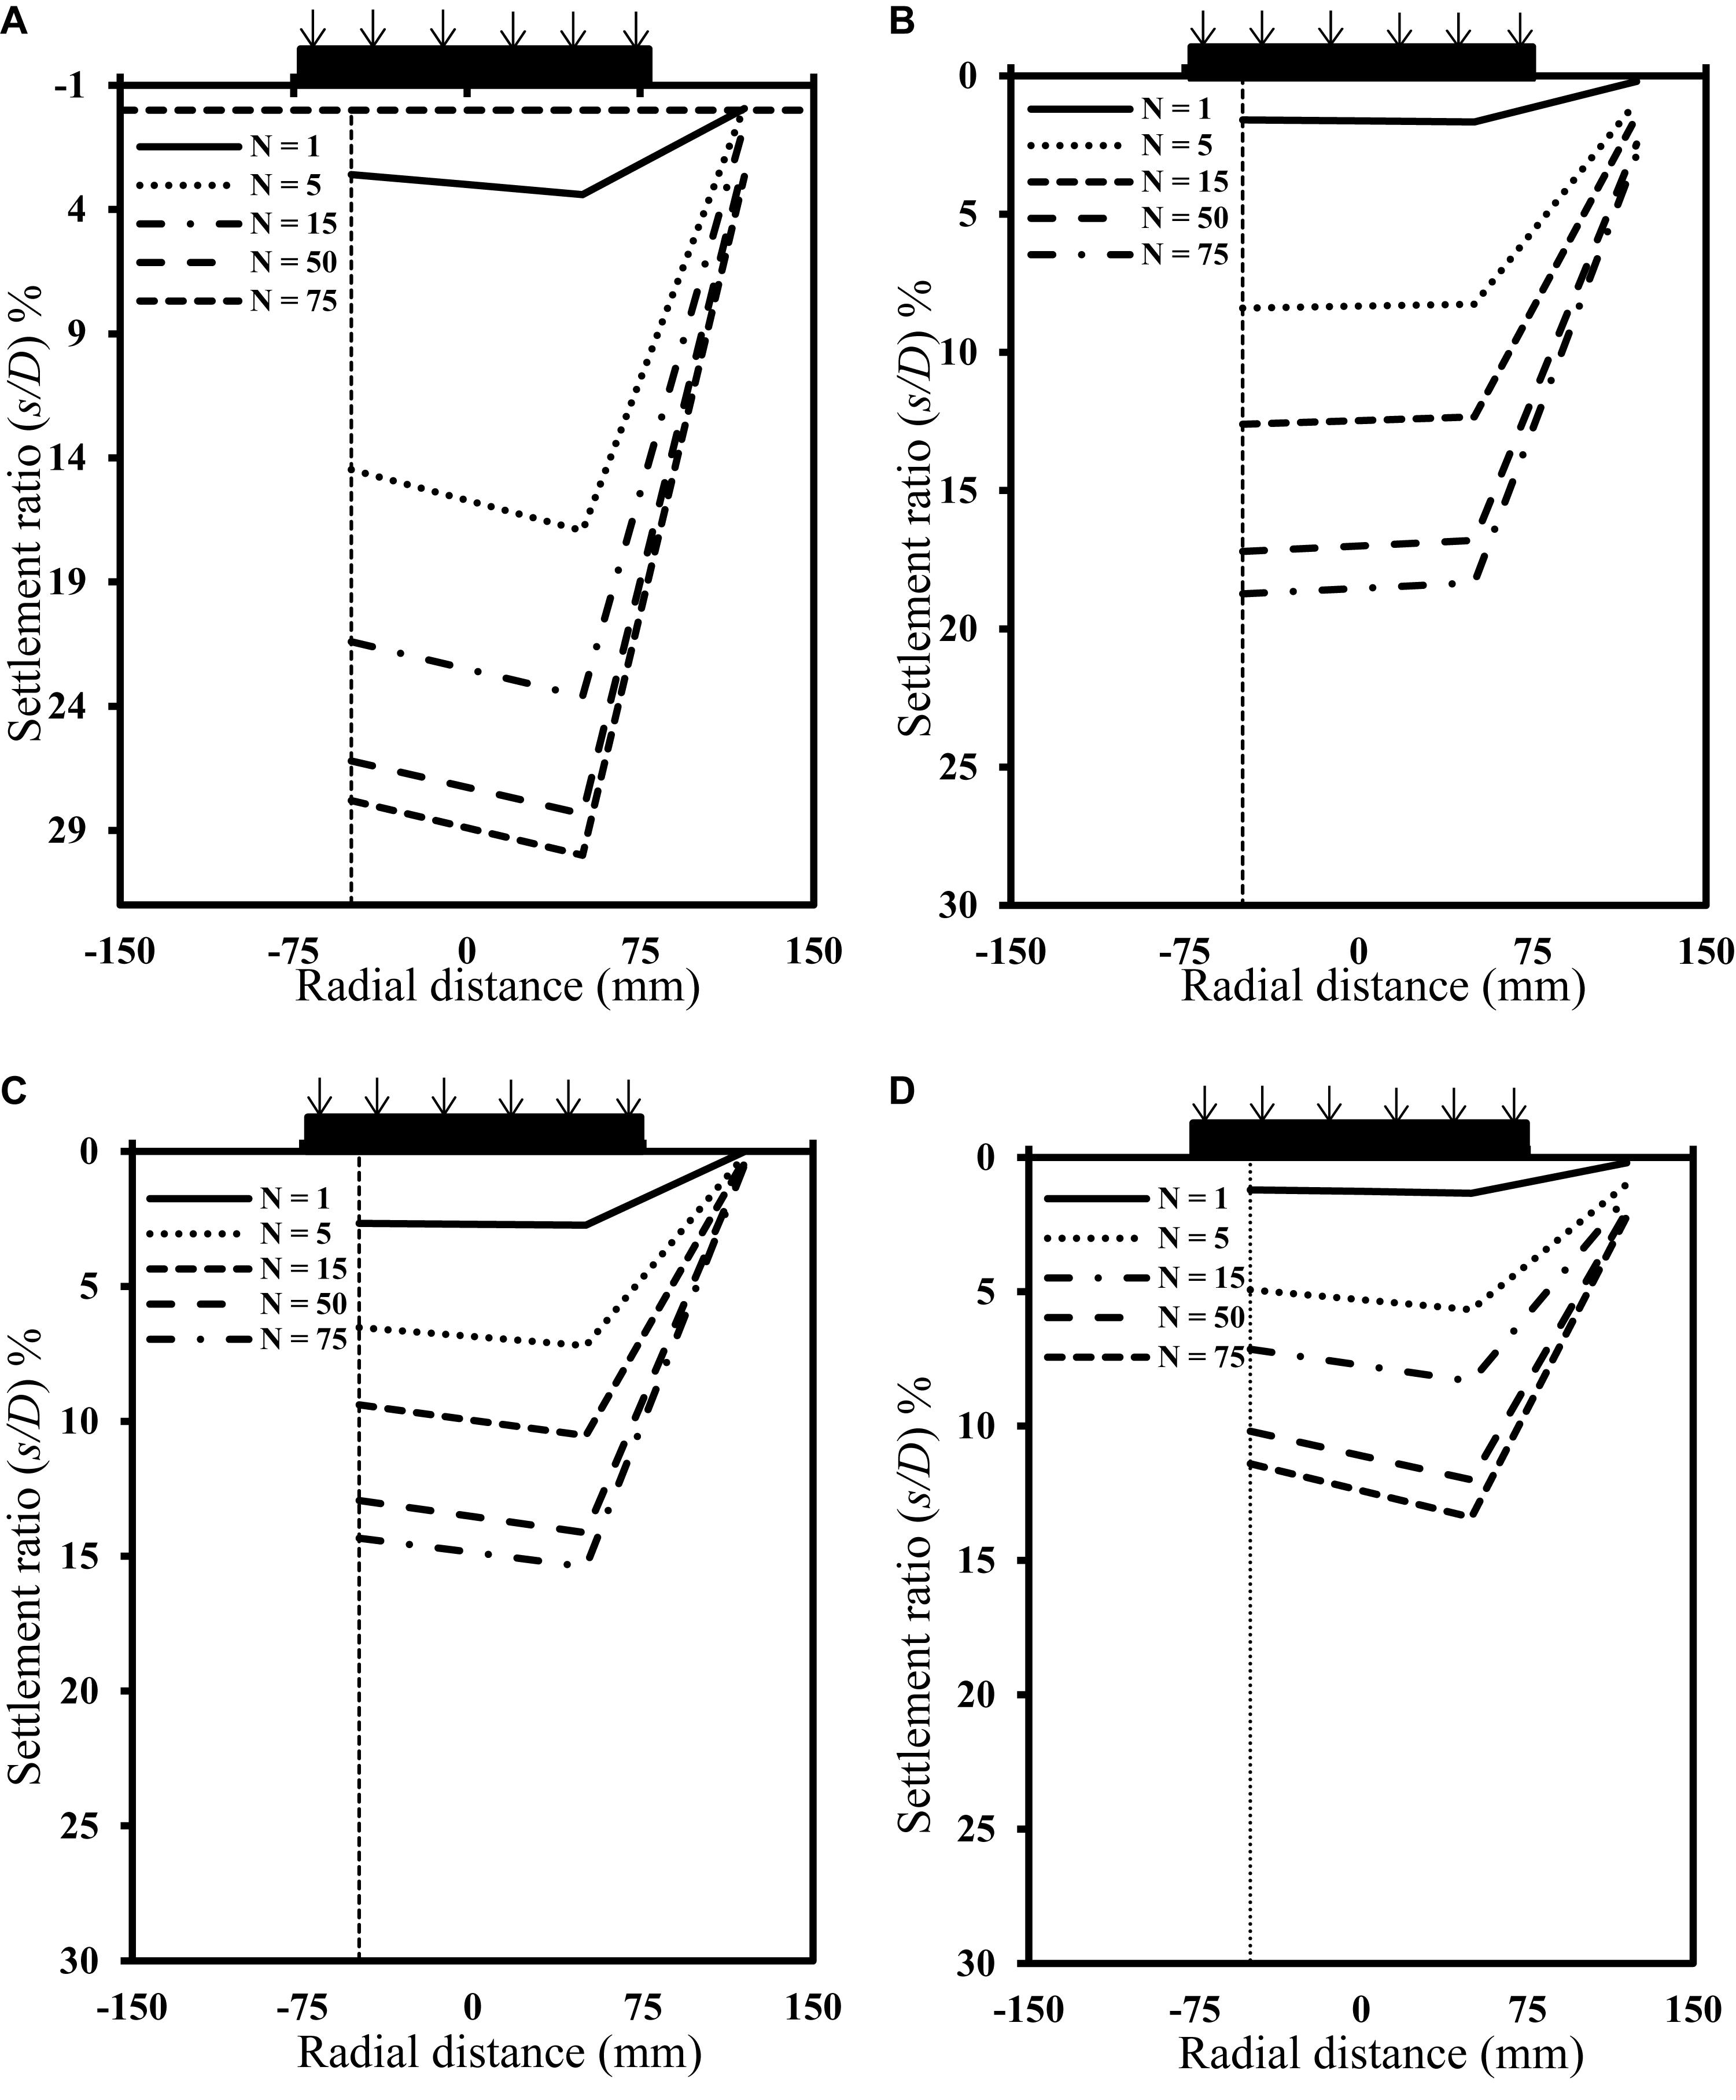
Figure 7. Settlement contours: (A) unreinforced subgrade; (B) geogrid reinforced subgrade; (C) geocell reinforced subgrade; (D) geocell with a basal geogrid reinforced subgrade.
The subgrade rutting is generally caused due to heavy loads, consolidation or dislocation of soil particles in the subgrade. The rut depth can be measured by calculating the permanent deformation of the pavement section. The cumulative permanent deformation (CPD) was calculated for a specific number of loading cycles. It was measured by adding plastic deformation of the subgrade section cumulatively and expressed as percentage of loading plate diameter. The unreinforced pavement section was found to attain the failure criteria at 75 numbers of loading cycles. Thus the CPD was compared for the first 75 numbers of loading cycles for all reinforced cases. Figure 8 shows the percentage CPD calculated for planar, and geocell reinforced subgrade sections of equal thickness. Reduction in plastic deformation of about 35% was observed for geocell reinforced pavement section as compared to unreinforced case.
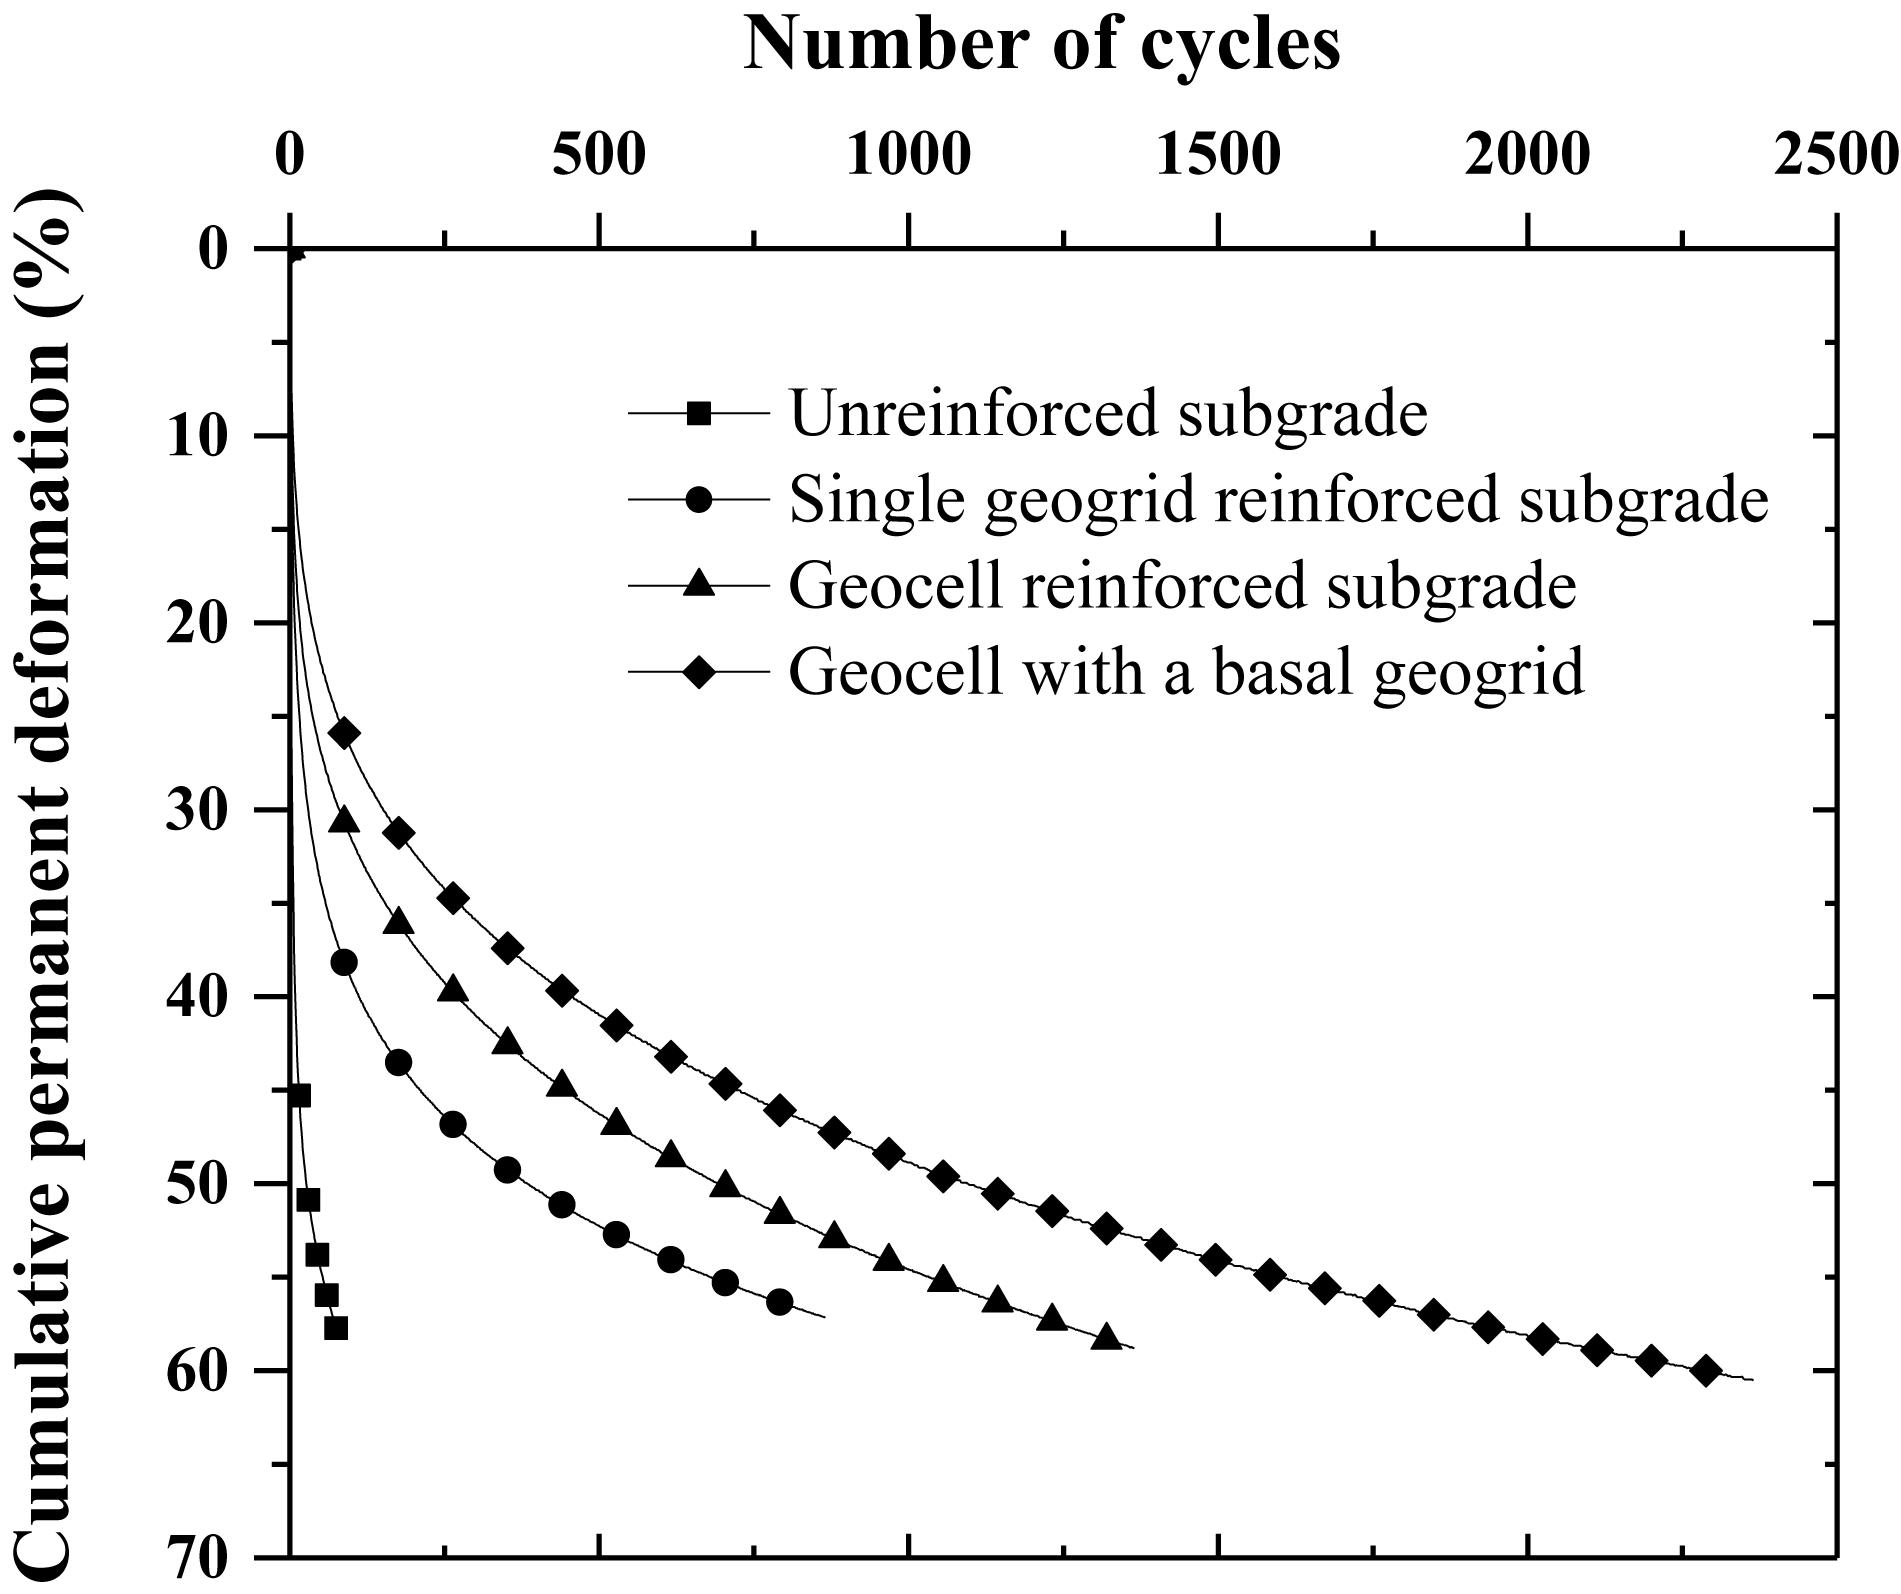
Figure 8. Variation of cumulative permanent deformation with number of cycles.
Table 3 shows the values of rut depth reduction (RDR) for various reinforced cases with an increasing number of loading cycles. Saride et al. (2015) defined the term RDR as the ratio of the difference between cumulative permanent deformation of the unreinforced subgrade and reinforced subgrade to that of the unreinforced subgrade for a particular number of loading cycle. The RDR can be calculated as the equation given below.
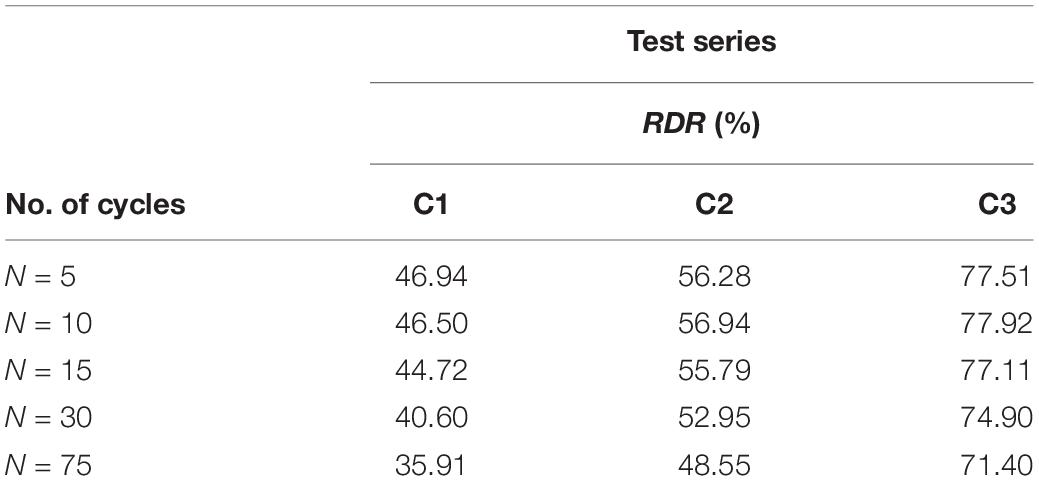
Table 3. Rut depth reduction (RDR) for different reinforcement cases.
where CPDr and CPDu are cumulative permanent deformations for reinforced and unreinforced sand subgrade, respectively. The reduction in percentage RDR was observed with the increase in loading cycles. The maximum RDR was achieved for geocell with a basal geogrid reinforced subgrade.
Pokharel et al. (2018) defined traffic benefit ratio (TBR) as the ratio of the number of cycles necessary to reach a given rut depth. It is useful for quantifying the benefit of extended pavement life or reduced thickness of pavement. TBR was calculated for different reinforced cases as per the equation is given below.
where Nr and Nu are the number of load cycles corresponding to ith settlement ratio for reinforced and unreinforced cases, respectively. Figure 9 shows the variation of TBR for different reinforcement combinations. The TBR was found to increase with the increase in the settlement ratio. The densification of the subgrade could be the reason for this behavior. The maximum TBR value of 32 was observed at 12% settlement ratio for the geocell with a basal geogrid reinforced subgrade. Saride et al. (2015) reported a similar TBR variation for the specific height and width of geocell.
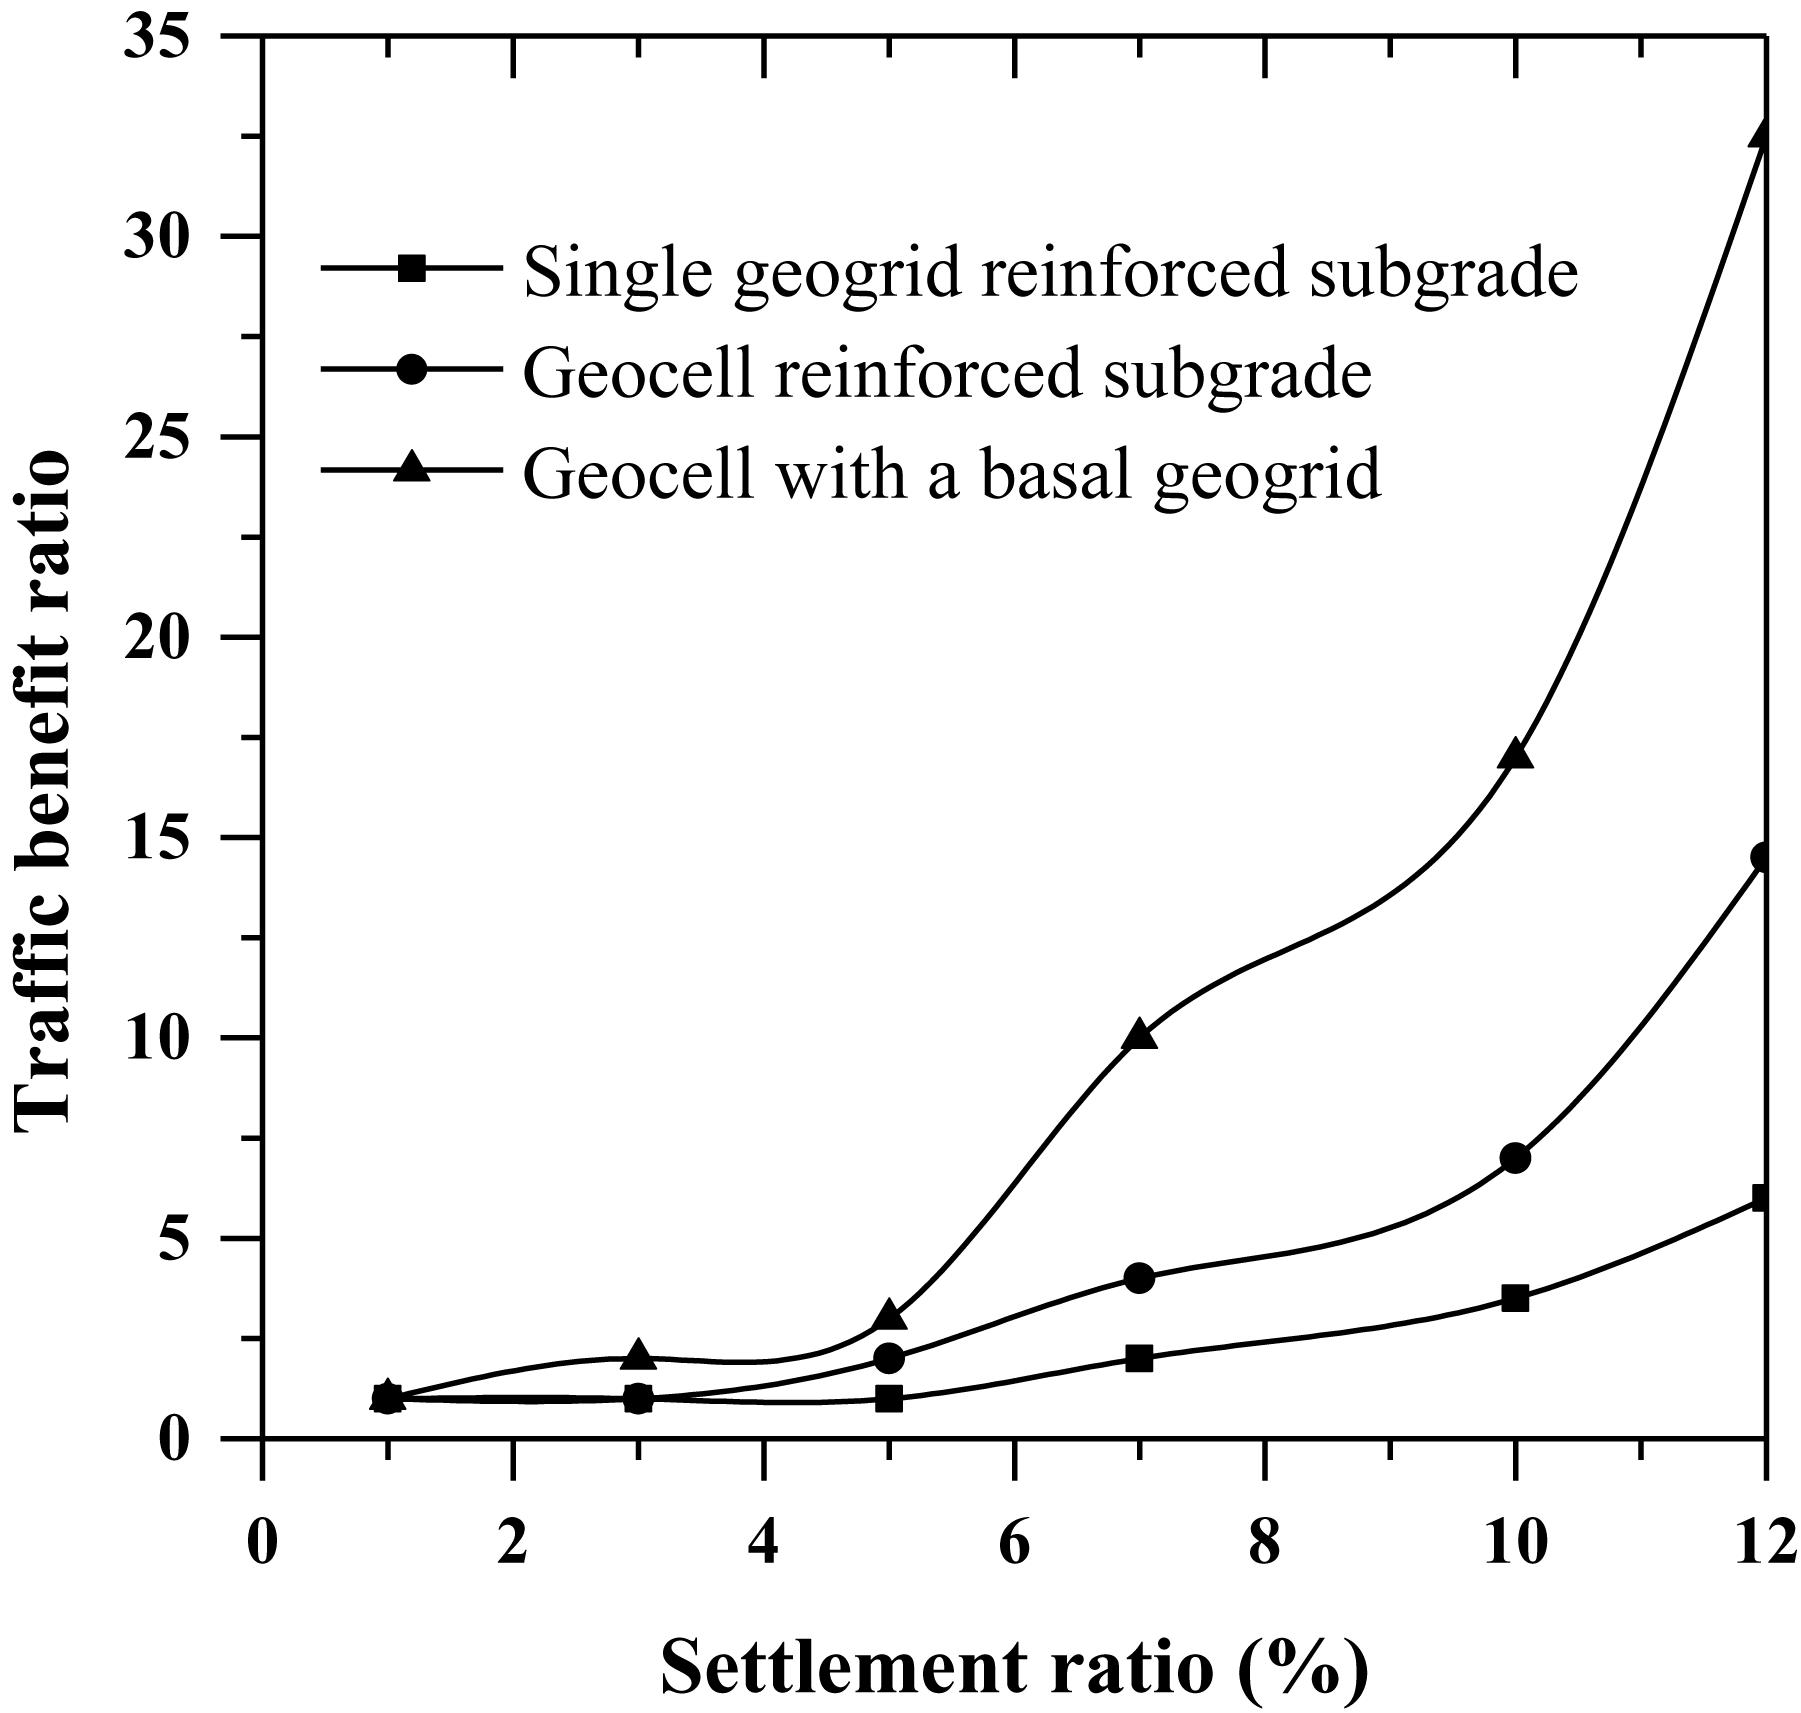
Figure 9. Variation of traffic benefit ratio with settlement ratio.
Numerical Analysis
The PLAXIS2D was chosen for numerical analysis considering its ability to solve various geotechnical problems. It uses a finite element solution scheme to solve initial and boundary value problems. The axisymmetric model was developed in PLAXIS2D with equal dimensions of model used in laboratory studies. The dynamic analysis was performed for the first 75 cycles to reduce the numerical efforts and time constraints associated with the calculation phase. Further, the unreinforced subgrade failed after 75 loading cycles during experiment. Therefore, the comparison with the reinforced subgrade can be made only up to 75 numbers of loading cycles. In the numerical simulation, the Mohr-Coulomb (drained) model was used to simulate sand fill. The damping characteristics of soil were considered by defining Rayleigh coefficients. The Rayleigh parameters α and β represent the influence of mass and stiffness in the damping of the system, with the values 0.1049 and 0.02383, respectively.
The soil properties were assigned similar to the experimental investigations. The stiffness parameters, like modulus of elasticity (E) and Poisson’s ratio (μ), were borrowed from Hegde and Sitharam (2015). The initial void ratio was obtained from the relationship between dry unit weight, specific gravity, and void ratio. The geocell reinforced sand layer was modeled as Geocell-soil composite layer with improved stiffness and strength parameters (Rajagopal et al., 1999; Dash et al., 2003; Venkateswarlu et al., 2018; Ujjawal et al., 2019). The properties of the geocell composite layer were calculated using the equivalent composite approach (ECA), as suggested by Latha et al. (2009). Additional confining stress (σh) on the soil due to the provision of geocell was calculated using the equation given by Henkel and Gilbert (1952).
The increased apparent cohesion (Cr) is the function of σh,
The total apparent cohesion of geocell-soil composite mass (C′) is given by,
where σh is the horizontal stress increment; M is the secant modulus of geocell material at an axial strain (εa) of 2%; d0 is the equivalent geocell pocket diameter; Cr is the increased apparent cohesion and kp is the passive earth pressure coefficient. C′ is the total apparent cohesion of the geocell composite layer, and C is the cohesion of unreinforced sand. The modulus of elasticity of the geogrid and geocell was calculated from tensile strength test results. Material properties used in the numerical analysis are listed in Table 4.
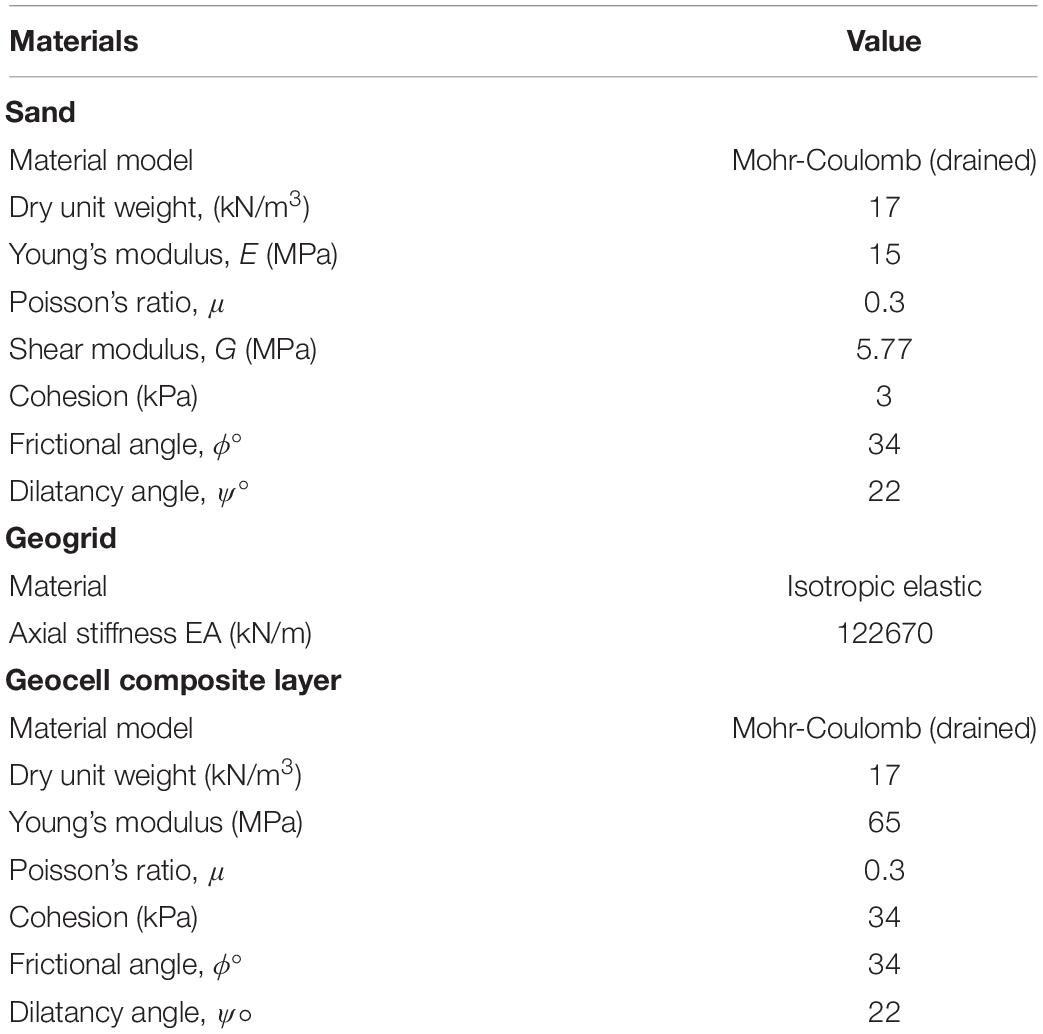
Table 4. Materials properties used in PLAXIS2D.
The dynamic loading was applied as a line load above the loading plate. The isotropic, elastic beam element was used to define the loading plate with a thickness and a specific weight (w) of 25 mm and 4.85 kN/m/m, respectively. The dynamic loading similar to the experiment was applied. The positive and negative interfaces were provided at all contacts between structural elements and the sand. The interface properties were considered same as that of sand. Figure 10 represents the axisymmetric model for test series “C3.” The static and dynamic boundary conditions were provided for the proposed model. The vertical rigid walls of tanks were restricted to move horizontally with fixities in x-direction. The base of the test tank was fully fixed, and the top surface of the pavement boundary was kept free.
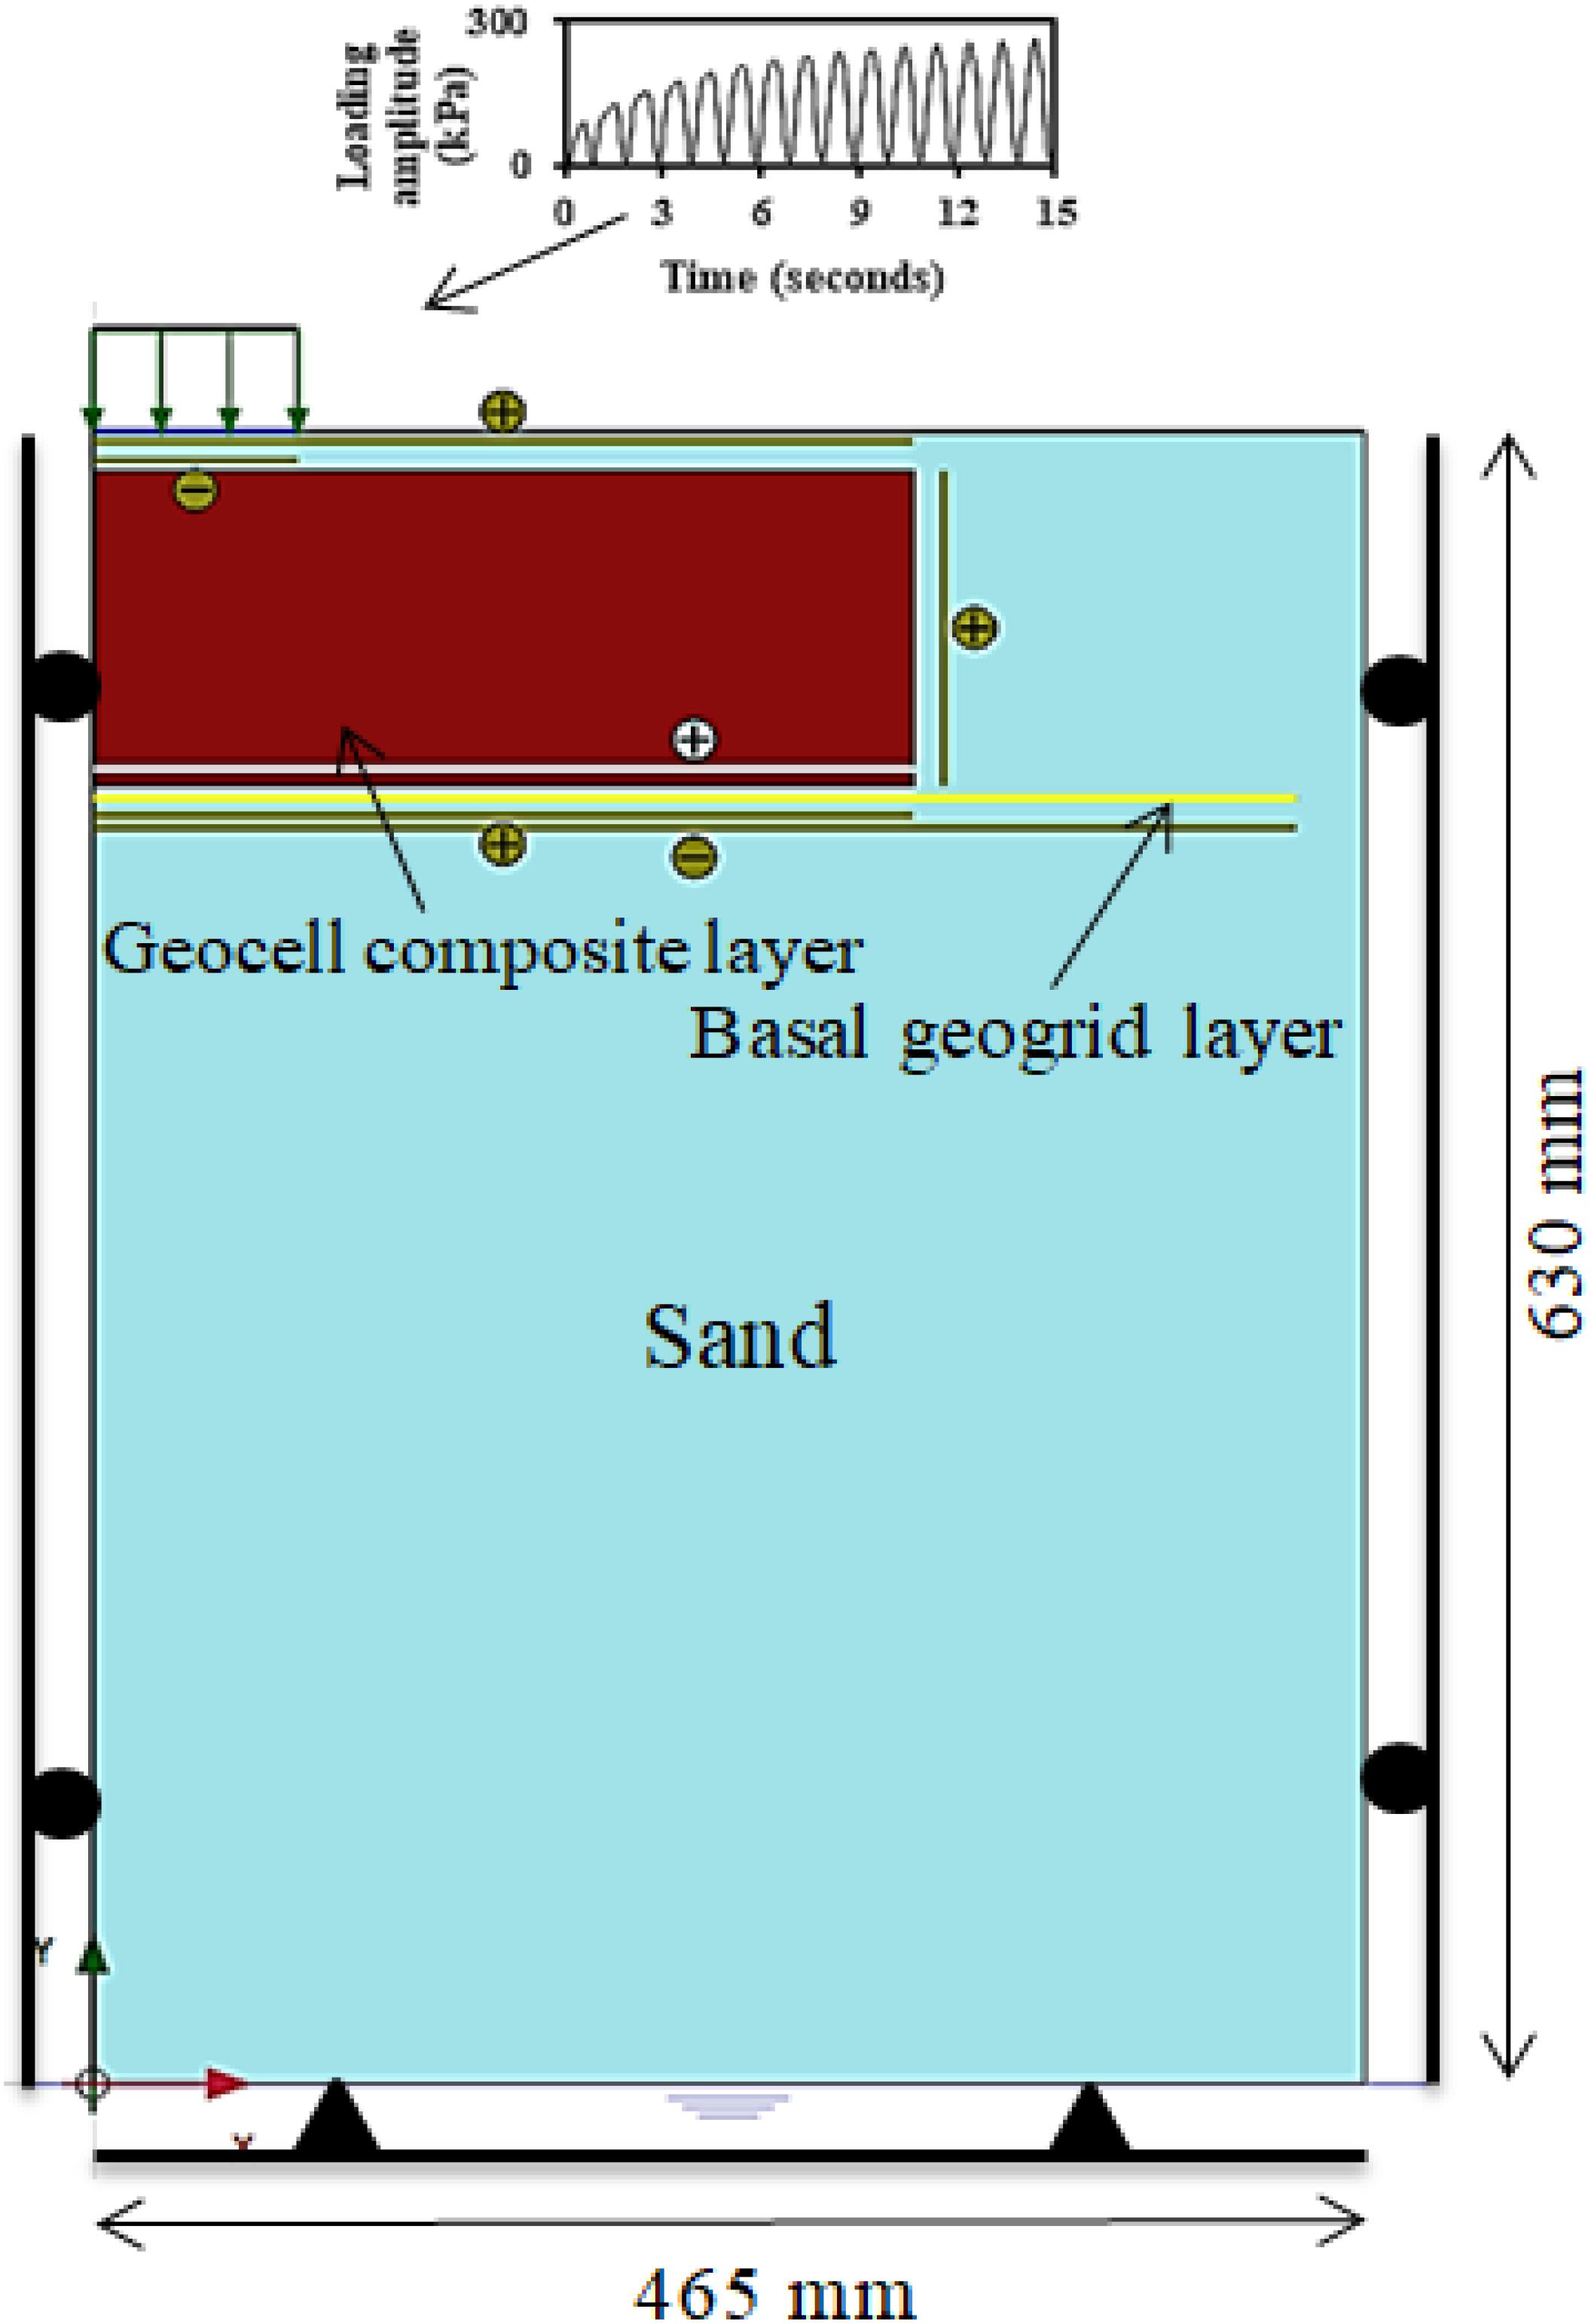
Figure 10. Numerical model of the geocell reinforced subgrade with a basal geogrid layer.
The experimental and numerical results for pressure measurements at r/D ratios 0, 0.5, and 1 were compared for the first 75 loading cycles in Figures 11A,B. A good agreement was observed with experimental results in the pressure readings for both unreinforced and reinforced cases at all r/D ratios. In unreinforced conditions, the initial reduction in pressure (38 kPa to 35 kPa) was observed below the center of loading plate, which was due to the rearrangement of loosely packed sand particles. Further, the stress distribution in the zone below the loading plate suggested the transfer of stress to deeper depths in case of unreinforced subgrade. However, in presence of reinforcement, the stress contour was confined to shallow depth. The reduction in pressure suggests that the pavement of lesser thickness can be constructed by reinforcing the subgrade with geosynthetics. Overall, the provision of reinforcement helps to reduce the material and maintenance associated with pavements.
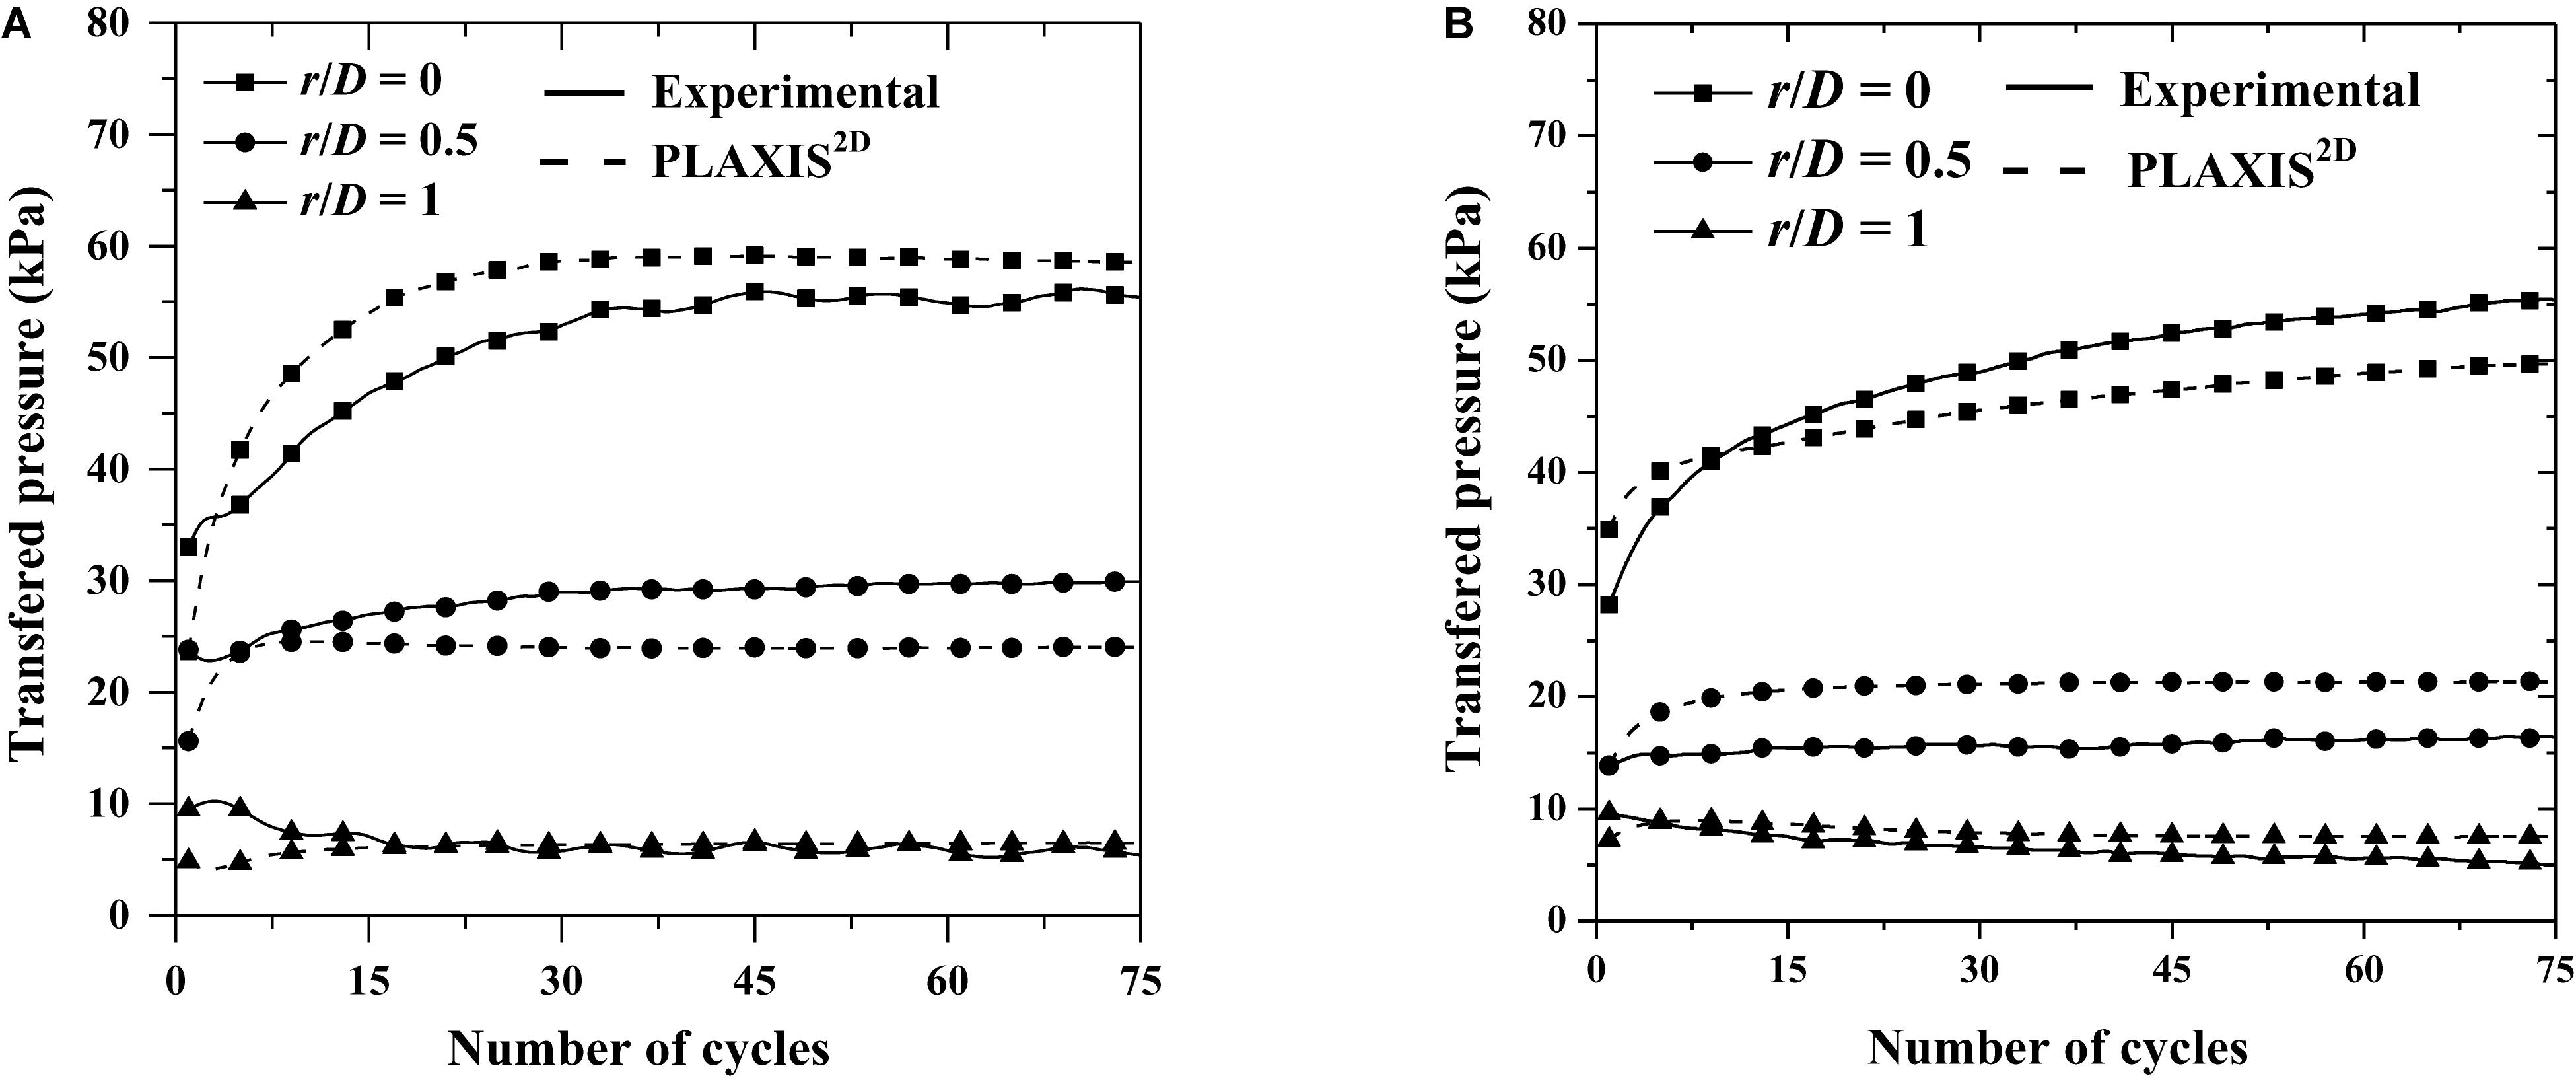
Figure 11. Comparison of experimental and numerical transferred pressures: (A) unreinforced subgrade; (B) geocell with a basal geogrid reinforced subgrade.
Conclusion
The present study highlighted the efficacy of planar and three-dimensional geosynthetic reinforcement in improving the performance of subgrade under dynamic loads. The following conclusions were drawn from the study:
• Both the planar geogrid as well as 3-dimensional geocell reinforcement yielded a significant improvement compared to the unreinforced subgrade performance. However, 3-dimensional geocell reinforcement proved to be more effective than the planar geogrid layer.
• The subgrade settlement reduced significantly under dynamic load for all reinforced cases. The heaving at the soil surface was completely arrested for all reinforced subgrade conditions. The geocell reinforced pavement showed lesser surface settlements compared to the geogrid reinforced pavement section.
• In comparison to unreinforced condition, the loading cycle count increased by 11, 17, and 30 times for geogrid, geocell and geocell with basal geogrid reinforcement, respectively. The increased number of loading cycles indicates the increase in the service life period of the pavement.
• In the presence of reinforcement, the cumulative permanent deformation, CPD of subgrade decreased in a significant way. Subgrade reinforced with geocell and the basal geogrid showed more than 70% reduction in rut depth (RDR) compared to the unreinforced case. The improved resistance to the subgrade rutting provides stability to upper pavement layers such as sub-base, base, and top asphalt layer.
• Geocell with basal geogrid reinforcement provides a significant improvement in TBR and reduction in rut depth under repeated load. The TBR was increased to 32 for geocell with basal geogrid reinforcement as compared to unreinforced subgrade. It indicates that the increase in the working life of pavement.
• The numerical analysis showed good agreement with experimental results. The pressure was found to reduce drastically due to the presence of reinforcement.
• The study has certain limitations. The results are prone to scale effects due to the reduced model sizes used in the study. To predict the actual prototype response, either large scale field experiments or centrifuge model studies need to be conducted. The careful consideration of scaling laws as suggested by Butterfield (1999), the results of small-scale model test can be extrapolated to the full-scale cases.
Data Availability Statement
All datasets generated for this study are included in the article/supplementary material.
Author Contributions
AH elaborated the manuscript guidelines and corrected the manuscript. PP prepared the manuscript draft.
Funding
This work was funded by the Indian Institute of Technology Patna.
Conflict of Interest
The authors declare that this study received geocell support from PRS Geo-Technologies, Israel. The agency was not involved in the study design, collection, analysis, interpretation of data, the writing of this article or the decision to submit it for publication.
Acknowledgments
The authors would like to express their sincere appreciation to the PRS Geo-Technologies, Israel for providing the geocells for the research work. The PP is thankful to Md. Nurul Hasan, Junior Technical Superintendent, for his help throughout the experimental work.
Abbreviations
B, width of geocell mattress (mm); C, cohesion of unreinforced sand (kPa); Cc, coefficient of curvature (dimensionless); Cr, increased apparent cohesion (kPa); Cu, uniformity coefficient (dimensionless); C ′, total apparent cohesion (kPa); d0, equivalent geocell pocket diameter (mm); D, width of loading plate (mm); D10, effective particle size (mm); δ, soil surface settlement (mm); emin, minimum void ratio (dimensionless); emax, maximum void ratio (dimensionless); E, young’s modulus of elasticity (kPa); εa, axial strain (dimensionless); G, shear modulus (kPa); Gs, specific gravity of sand (dimensionless); γd, dry unit weight (kN/m3); h, height of geocell (mm); H, height of sand bed (mm); kp, coefficient of passive earth pressure (dimensionless); M, secant modulus of geocell material (kPa); Nr, number of loading cycles for reinforced case (dimensionless); Nu, number of loading cycles for unreinforced case (dimensionless); r, radial distance from the center of loading plate (mm); S0, settlement of unreinforced subgrade (mm); Sr, settlement of reinforced subgrade (mm); σn, horizontal stress increment (kPa); σ’yy, vertical effective stress (kPa); w, specific weight (kN/m/m); W, width of the sand bed (mm); μ, poisson’s ratio (dimensionless); z, depth of geocell (mm); α / β, rayleigh damping parameters (dimensionless); ϕ, angle of internal friction (degrees); ψ, dilatancy angle (degrees).
References
Abu-Farsakh, M., Chen, Q., and Sharma, R. (2013). An experimental evaluation of the behavior of footings on geosynthetic-reinforced sand. Soils Found. 53, 335–348. doi: 10.1016/j.sandf.2013.01.001
Abu-Farsakh, M., Hanandeh, S., Mohammad, L., and Chen, Q. (2016). Performance of geosynthetic reinforced/stabilized paved roads built over soft soil under cyclic plate loads. Geotextiles Geomembranes 44, 845–853. doi: 10.1016/j.geotexmem.2016.06.009
Asakereh, A., Ghazavi, M., and Tafreshi, S. M. (2013). Cyclic response of footing on geogrid-reinforced sand with void. Soils Found. 53, 363–374. doi: 10.1016/j.sandf.2013.02.008
ASTM D1195/1195M (2015). Standard Test Method For Repetitive Static Plate Load Tests of Soils and Flexible Pavement Components, for Use in Evaluation and Design of Airport and Highway Pavements. West Conshohocken, PA: ASTM International.
ASTM D6637 (2011). Standard Test Method for Determining the Tensile Properties of Geogrid by the Single or Multi-Rib Tensile Method. West Conshohocken, PA: ASTM International.
ASTM D6693 (2015). Standard Test Method for determining tensile properties of nonreinforced polyethylene and nonreinforced flexible polypropylene geomembranes. West Conshohocken, PA: ASTM International.
Brito, L. A. T., Dawson, A. R., and Kolisoja, P. J. (2009). “Analytical evaluation of unbound granular layers in regard to permanent deformation,” in Proceedings of the 8th International on the Bearing Capacity of Roads, Railways, and Airfields (BCR2A’09) (Champaign IL: Unversity of Illinois at Urbana Illinois), 187–196. doi: 10.1201/9780203865286.ch21
Butterfield, R. (1999). Dimensional analysis for geotechnical engineers. Geotechnique 49, 357–366. doi: 10.1680/geot.1999.49.3.357
Cao, Z., Han, J., Xu, C., Khatri, D. K., Corey, R., and Cai, Y. (2016). Road surface permanent deformations with a shallowly buried steel-reinforced high-density polyethylene pipe under cyclic loading. Geotextiles Geomembranes 44, 28–38. doi: 10.1016/j.geotexmem.2015.06.009
Chen, Q., and Abu-Farsakh, M. (2015). Ultimate bearing capacity analysis of strip footings on reinforced soil foundation. Soils Found. 55, 74–85. doi: 10.1016/j.sandf.2014.12.006
Dash, S. K., Sireesh, S., and Sitharam, T. G. (2003). Model studies on circular footing supported on geocell reinforced sand underlain by soft clay. Geotextiles Geomembranes 21, 197–219. doi: 10.1016/S0266-1144(03)00017-7
El Sawwaf, M., and Nazir, A. K. (2010). Behavior of repeatedly loaded rectangular footings resting on reinforced sand. Alex. Eng. J. 49, 349–356. doi: 10.1016/j.aej.2010.07.002
Elleboudy, A. M., Saleh, N. M., and Salama, A. G. (2017). Assessment of geogrids in gravel roads under cyclic loading. Alex. Eng. J. 56, 319–326. doi: 10.1016/j.aej.2016.09.023
Elsaied, A. E., Saleh, N. M., and Elmashad, M. E. (2015). Behavior of circular footing resting on laterally confined granular reinforced soil. HBRC J. 11, 240–245. doi: 10.1016/j.hbrcj.2014.03.011
Faragher, E., Fleming, P. R., and Rogers, C. D. F. (2000). Analysis of repeated-load field testing of buried plastic pipes. J. Transp. Eng. 126, 271–277. doi: 10.1061/(ASCE)0733-947X2000126:3(271)
Gabr, M., and Han, J. (2005). Geosynthetic reinforcement for soft foundations: US perspectives. Int. Perspect. Soil Reinforc. Appl. 1–17. doi: 10.1061/40788(167)5
Hegde, A., and Sitharam, T. G. (2013). Experimental and numerical studies on footings supported on geocell reinforced sand and clay beds. Int J. Geotech. Eng. 7, 346–354. doi: 10.1179/1938636213Z.00000000043
Hegde, A., and Sitharam, T. G. (2016). Behaviour of geocell reinforced soft clay bed subjected to incremental cyclic loading. Geomech. Eng. 10, 405–422. doi: 10.12989/gae.2016.10.4.405
Hegde, A. M., and Sitharam, T. G. (2015). Experimental and numerical studies on protection of buried pipelines and underground utilities using geocells. Geotextiles Geomembranes 43, 372–381. doi: 10.1016/j.geotexmem.2015.04.010
Henkel, D. J., and Gilbert, G. D. (1952). The effect measured of the rubber membrane on the triaxial compression strength of clay samples. Geotechnique 3, 20–29. doi: 10.1680/geot.1952.3.1.20
IS 2720-13 (1986). Methods of Test for Soils- Part XIII: direct Shear Test. Delhi: Prabhat Offset Press.
IS 2720-14 (1983). Methods of Test for Soils- Part XIV: Determination of Density Index (Relative Density) of Cohesionless Soils. Delhi: Prabhat Offset Press.
Khalaj, O., Darabi, N. J., Tafreshi, S. M., and Mašek, B. (2017). “Protection of Buried Pipe under Repeated Loading by Geocell Reinforcement,” in Proceedings of the IOP Conference Series: Earth and Environmental Science, Vol. 95 (Bristol: IOP Publishing). doi: 10.1088/1755-1315/95/2/022030
Latha, G. M., Dash, S. K., and Rajagopal, K. (2009). Numerical simulation of the behavior of geocell reinforced sand in foundations. Int. J. Geomech. 9, 143–152. doi: 10.1061/(ASCE)1532-364120099:4(143)
Leng, J., and Gabr, M. A. (2002). Characteristics of geogrid-reinforced aggregate under cyclic load. Transp. Res. Rec. 1786, 29–35. doi: 10.3141/1786-04
Mamatha, K. H., and Dinesh, S. V. (2019). Performance evaluation of geocell-reinforced pavements. Int. J. Geotech. Eng. 13, 277–286. doi: 10.1080/19386362.2017.1343988
Pokharel, S. K., Han, J., Leshchinsky, D., and Parsons, R. L. (2018). Experimental evaluation of geocell-reinforced bases under repeated loading. Int. J. Pavement Res. Technol. 11, 114–127. doi: 10.1016/j.ijprt.2017.03.007
Rajagopal, K., Krishnaswamy, N. R., and Latha, G. M. (1999). Behaviour of sand confined with single and multiple geocells. Geotextiles Geomembranes 17, 171–184. doi: 10.1016/s0266-1144(98)00034-x
Sahu, R., Ayothiraman, R., and Ramana, G. V. (2018). Dynamic Response of Model Footing on Reinforced Sand. Geotech. Earthquake Eng. Soil Dyn. V 199–207. doi: 10.1061/9780784481486.021
Saride, S., Rayabharapu, V. K., and Vedpathak, S. (2015). Evaluation of rutting behaviour of geocell reinforced sand subgrades under repeated loading. Indian Geotech. J. 45, 378–388. doi: 10.1007/s40098-014-0120-8
Suku, L., Prabhu, S. S., Ramesh, P., and Babu, G. S. (2016). Behavior of geocell-reinforced granular base under repeated loading. Transp. Geotech. 9, 17–30. doi: 10.1061/41023(337)52
Tafreshi, S. M., and Dawson, A. R. (2010). Behaviour of footings on reinforced sand subjected to repeated loading–Comparing use of 3D and planar geotextile. Geotextiles Geomembranes 28, 434–447. doi: 10.1016/j.geotexmem.2009.12.007
Tafreshi, S. M., and Khalaj, O. (2008). Laboratory tests of small-diameter HDPE pipes buried in reinforced sand under repeated-load. Geotextiles Geomembranes 26, 145–163. doi: 10.1016/j.geotexmem.2007.06.002
Tafreshi, S. M., Khalaj, O., Dawson, A. R., and Mašek, B. (2015). Repeated load response of soil reinforced by two layers of geocell. Procedia Earth Planet. Sci. 15, 99–104. doi: 10.1016/j.proeps.2015.08.026
Thakur, J. K., Han, J., and Parsons, R. L. (2017). Factors influencing deformations of geocell-reinforced recycled asphalt pavement bases under cyclic loading. J. Mater. Civil Eng. 29:04016240. doi: 10.1061/(ASCE)MT.1943-5533.0001760
Ujjawal, K. N., Venkateswarlu, H., and Hegde, A. (2019). Vibration isolation using 3D cellular confinement system: a numerical investigation. Soil Dyn. Earthquake Eng. 119, 220–234. doi: 10.1016/j.soildyn.2018.12.021
Venkateswarlu, H., Ujjawal, K. N., and Hegde, A. (2018). Laboratory and numerical investigation of machine foundations reinforced with geogrids and geocells. Geotextiles Geomembranes 46, 882–896. doi: 10.1016/j.geotexmem.2018.08.006
Keywords: geosynthetics, bearing pressure, settlement, PLAXIS, vehicle, repeated loads
Citation: Hegde AM and Palsule PS (2020) Performance of Geosynthetics Reinforced Subgrade Subjected to Repeated Vehicle Loads: Experimental and Numerical Studies. Front. Built Environ. 6:15. doi: 10.3389/fbuil.2020.00015
Received: 19 October 2019; Accepted: 05 February 2020;
Published: 21 February 2020.
Edited by:
Sujit Kumar Dash, Indian Institute of Technology Kharagpur, IndiaReviewed by:
Dinesh S. V., Siddaganga Institute of Technology, Tumakuru, IndiaArghadeep Biswas, Jalpaiguri Government Engineering College, India
Copyright © 2020 Hegde and Palsule. This is an open-access article distributed under the terms of the Creative Commons Attribution License (CC BY). The use, distribution or reproduction in other forums is permitted, provided the original author(s) and the copyright owner(s) are credited and that the original publication in this journal is cited, in accordance with accepted academic practice. No use, distribution or reproduction is permitted which does not comply with these terms.
*Correspondence: Amarnath M. Hegde, YWhlZ2RlQGlpdHAuYWMuaW4=