 Syed Khaja Karimullah Hussaini
 Kumari Sweta
- Railway Engineering, Department of Civil and Environmental Engineering, Indian Institute of Technology Patna, Patna, India
Large-scale direct shear tests were conducted to assess the performance of geogrid-reinforced ballast-sub-ballast interface followed by triaxial tests to explore the deformation and degradation response of geogrid-reinforced ballast under cyclic loading. While the direct shear testing was performed at applied normal stresses (σn) ranging from 20 to 100 kPa and rate of shearing (Sr) from 2.5 to 10.0 mm/min, the cyclic triaxial tests were performed to capture the role of loading frequency (f) ranging from 10 to 40 Hz. Fresh granite ballast and sub-ballast with mean particle size (D50) of 42 and 3.5 mm, and five geogrids having different aperture shapes and sizes (A) were used in this study. The tests results indicated that the behavior of ballast-sub-ballast interface is highly influenced by σn and Sr. The friction (φ) and dilation angles (ψ) of unreinforced and geogrid-reinforced ballast-sub-ballast interface is found to reduce from 67.96 to 47.82° and 14.56 to 3.34° with the increase in σn and Sr. Marsal's Breakage (Bg: an index to quantify the breakage of ballast) of unreinforced ballast was found to increase from 2.84 to 6.69% with the increase in σn and Sr. However, the inclusion of geogrids significantly enhanced the friction angle (φ), reduced the extent of dilation angle (ψ), and minimized Bg. The interface efficiency factor (α) and Bg were found to be a function of A/D50 ratio. Accordingly, a model is developed using multiple linear regression analysis to predict the values of φ, ψ, and Bg in terms of the input parameters σn, Sr, and A/D50 ratio. The results from triaxial tests indicate the deformation and degradation behavior of ballast under cyclic loading conditions to be influenced by the loading frequency (f). The extent of ld and Sv of unreinforced ballast increases from 5.48 to 28.32 mm and 20.13 to 45.40 mm with the increase in f. The value of Bg increased from 4.3 to 11.69% when the value of f was increased from 10 to 40 Hz. Similarly, the extent of lateral and vertical deformation of ballast was found to be a function of A/D50 ratio.
Introduction
Railways are one of the most economical modes of transportation for moving freight as well as passengers from one place to another. With the rapid increase in population and the associated traffic congestion on highways, the demand for high-speed railway lines is on rise. However, the inherent effect of the introduction of high-speed trains is to induce additional cyclic stresses on the substructure of a railway track that comprises mainly of ballast and sub-ballast layers. Ballast distributes the applied train load to the sub-ballast layer at an acceptable level while maintaining the track alignment and allowing the quick drainage of water. On the other hand, the sub-ballast reduces the extent of stress being transferred to the soil beneath and also acts as a filter medium thereby preventing the upward migration of subgrade soil into the ballast layer. However, due to continuous passage of trains, ballast being unbound in nature undergoes a significant amount of lateral deformation and particle degradation which directly contributes to track settlement. The excessive deformation and degradation of ballast leads to track misalignment that calls for either the imposition of speed restrictions or the conduction of costly track maintenance operations. In this view, the railway organizations around the world have recently started using the geogrids for stabilizing the railway tracks. In practice, the geogrids are generally placed at the bottom of ballast layer (i.e., at ballast-sub-ballast interface) so that the same will not obstruct the track maintenance process. Once in place, geogrids generates non-displacement boundary condition that limits the lateral movement of ballast that subsequently reduces vertical settlement and deformation of ballast.
Realizing the importance of geogrids in rail track application, several researchers have studied the role of geogrids on coarse granular medium under direct shear conditions (Lee and Manjunath, 2000; Liu et al., 2009; Palmeira, 2009; Anubhav and Basudhar, 2010, 2013; Hussaini et al., 2012; Indraratna et al., 2012; Moraci et al., 2014; Sayeed et al., 2014; Biabani and Indraratna, 2015; Liu and Martinez, 2015; Vieira et al., 2015; Choudhary and Krishna, 2016; Liu F.-Y. et al., 2016; Liu S. et al., 2016; Afzali-Nejad et al., 2017; Guler and Khosrowshahi, 2017; Mvelase et al., 2017; Chen et al., 2018; Sweta and Hussaini, 2018, 2019a; Mirzaalimohammadi et al., 2019). Liu et al. (2009) have determined the shear behavior of granular soils stabilized with PET-yarn geogrids. On the other hand, Makkar et al. (2017) have evaluated the behavior of sand when reinforced with geogrid in three dimensional forms. Biabani and Indraratna (2015) have investigated the behavior of sub-ballast when stabilized with geogrids and geomembranes. Indraratna et al. (2012) and Hussaini et al. (2012) have explored the shear behavior of various ballast-geogrid interfaces at constant shearing rate of 2.5 mm/min. Sweta and Hussaini (2018, 2019a) have evaluated the shear behavior of ballast at different applied normal stresses and rates of shearing when stabilized with various geogrids. Similarly, several studies have highlighted the benefits of geogrids in stabilizing ballast under cyclic loading conditions (Bathurst and Raymond, 1987; Matharu, 1994; Brown et al., 2007; Indraratna et al., 2007, 2013, 2015; Mishra et al., 2014; Hussaini et al., 2015a,b, 2016; Biabani et al., 2016; Nimbalkar and Indraratna, 2016). Shin et al. (2002) highlighted the beneficial effect of reinforcement in reducing settlement when a layer of geogrid and geotextiles was placed at the interface of the subgrade and sub-ballast layer. Moreover, Nimbalkar and Indraratna (2016) have evaluated the benefits of inclusion of geosynthetics and rubber shock mats in the critical section of track through a field trial. Indraratna et al. (2015) and Biabani et al. (2016) have investigated the behavior of geocell-reinforced sub-ballast at different frequencies under cyclic loading conditions. Navaratnarajah and Indraratna (2017) have assessed the use of rubber mats in improving the deformation and degradation behavior ballast at different frequencies and axle load. Indraratna et al. (2013) and Hussaini et al. (2015b) are the only studies that have captured the influence of geogrid aperture size (A) in stabilizing the railway ballast under cyclic loading conditions at a constant loading frequency (f) of 20 Hz. In addition, there are several studies that have shown the effect of loading frequency (f) on the behavior of unreinforced ballast under various cyclic loading conditions (Indraratna et al., 2010; Thakur et al., 2013; Sun et al., 2014, 2019). However, the role of geogrids in stabilizing railway ballast at different loading frequencies (f) has not been yet studied. Similarly, there are very limited studies that describe the influence of applied normal stress (σn) and rates of shearing (Sr) on various ballast-geogrid-sub-ballast interfaces under direct shear conditions. Moreover, a rail track under operating conditions may be subjected to different shearing rates depending upon the magnitude of cyclic stress and the train speed. In this context, a series of large-scale direct shear tests were carried out to study the influence of σn and Sr on ballast-geogrid-sub-ballast interface followed by large-scale cubical triaxial tests to determine the effect of loading frequency (f) on ballast with and without geogrids.
Materials and Testing Procedures
Materials
Fresh granite particles and a mixture of sand and crushed granite were used as ballast and sub-ballast, respectively. The particle size distributions (PSD) of ballast and sub-ballast used in the present study were as per the standards specified by Indian railways (IRSGE, 2004; RDSOGE, 2007; Figure 1). The particle size characteristics of ballast and sub-ballast are presented in Table 1. The maximum (Dmax) and mean diameters (D50) of sub-ballast were 20 and 3.5 mm and that of ballast were 65 and 42 mm, respectively. Five types of geogrids were used in the current study to stabilize the rail road ballast. These geogrids have different aperture shapes and sizes. The physical characteristics and technical specifications of geogrids (labeled G1 to G5) used in the present study are described in Table 2.
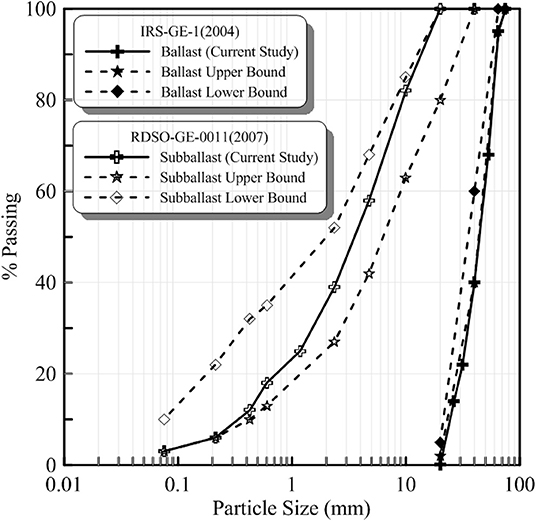
Figure 1. Particle size distributions of ballast and sub-ballast used in this study.
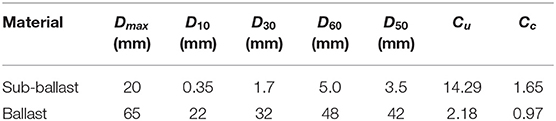
Table 1. Grain size characteristics of ballast and sub-ballast.
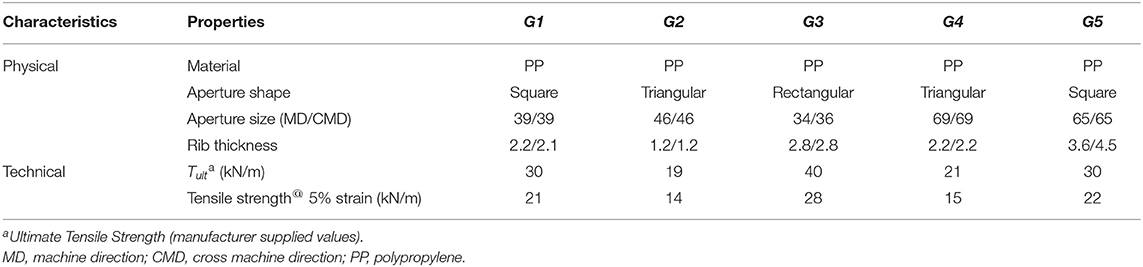
Table 2. Physical characteristics and technical characteristics of geogrid used in the current study.
Direct Shear Tests
A series of shear tests were performed using large-scale direct shear apparatus, having plan dimension of 450 × 450 mm and overall depth of 300 mm. The apparatus consists of two square boxes; the lower box is fixed in position while the upper box is allowed to move. The apparatus can allow application of normal stress and can capture the shear stresses up to 300 kN/m2 and can allow shear displacements up to 100 mm. The dimensions of the apparatus and the capacity of load cells have been suitably selected to explicitly test coarse granular materials like railway ballast at high normal loading and strain rates. Figure 2A shows the schematic illustration of large-scale direct shear apparatus.
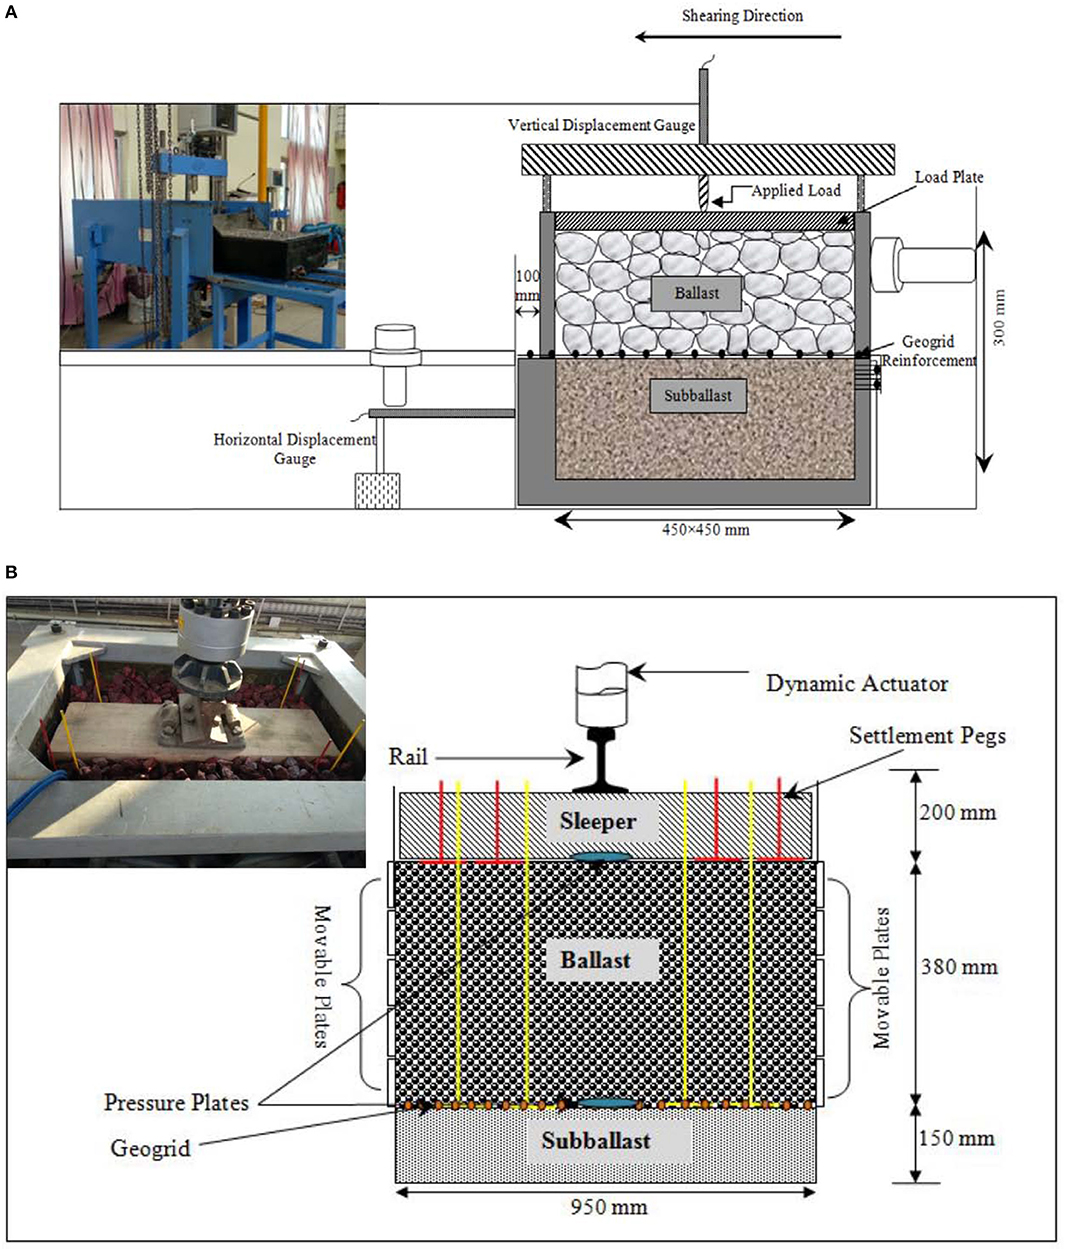
Figure 2. Schematic illustrations of (A) direct shear apparatus and (B) process simulation test (PST) apparatus.
The specimen preparation involves the mixing of sieved ballast and sub-ballast separately in a required proportion conforming to the PSDs as specified in Figure 1. The lower box of shear apparatus was filled with a predetermined quantity of sub-ballast and then compacted in two layers with the help of a vibrating plate to attain a required density (γsb) of 2,000 kg/m3 which is the representative of typical field conditions. Then, the ballast is filled in the upper shear box and compacted in two layers with same vibrating plate to attain a field density (γb) of 1,470 kg/m3. In case of reinforced samples, a layer of geogrid is installed at the interface of two shear boxes and fixed with the clamping screws after the compaction of sub-ballast in lower shear box. To reduce the extent of particle breakage during vibration, a 7 mm thick rubber pad was placed beneath the vibrating plate. Tests were conducted at different applied normal stresses (σn) ranging from 20 to 100 kPa which is representative of typical track conditions under low confinement and shearing rates (Sr) ranging from 2.5 to 10.0 mm/min. The tests were carried out up to the horizontal displacement of 67.5 mm that represents a horizontal strain of 15%.
Triaxial Tests Using Process Simulation Test (PST) Apparatus
A series of triaxial tests were carried out using large-scale process simulation test (PST) apparatus, consisting of a box of 950 mm length, 650 mm width, and 730 mm overall depth. The plan dimension of 950 mm represents the effective sleeper length that transfers the applied wheel load to the ballast beneath, as defined by Jeffs and Tew (1991) and Atalar et al. (2001). On the other hand, 650 mm represents the center-center spacing between the sleepers in the direction of rail. The mid portion of the two side walls parallel to rails (i.e., along the direction of passage of train) consists of five independent movable plates each measuring 650 mm in width and 75 mm in height. A small gap of 1 mm was provided to allow the free movement of plates in lateral direction. The maximum allowable lateral displacement of each plate is 100 mm that corresponds to a lateral strain (ε3) of 10.52%. The apparatus used in the current study is similar to that used by Hussaini (2013) and Indraratna et al. (2013) but with five independently movable side walls on both the sides. The apparatus can be used to apply a vertical dynamic load of 200 kN at frequencies of up to 50 Hz. Figure 2B illustrates the schematic diagram of process simulation test apparatus.
The specimen preparation involved the placement of sub-ballast (150 mm thick), comprising of crushed granite-sand mixture, in two layers of 75 mm each and their compaction with the help of a vibrating plate to attain a required density (γsb) of 2,000 kg/m3. This was overlain by a ballast layer of 380 mm that was placed in three equal layers and compacted to achieve a target field density (γb) of 1,520 kg/m3. It is to be mentioned here that in both the series of tests the ballast particles were painted with bright yellow spray paint in order to clearly distinguish the broken pieces of ballast from underlying sub-ballast. A rail-sleeper assembly (wooden sleeper: 900 × 250 × 150 mm) was then placed over the compacted ballast and the spaces around the sleeper were filled with crib ballast. The rail section used was MR-52 section, as used by the Indian Railways on most of the broad gauge tracks. In case of reinforced samples, a layer of geogrid was placed at the ballast-sub-ballast interface as done in case of direct shear test samples.
A cyclic vertical stress of 300 kPa was applied onto the test specimen with the help of vertical dynamic actuator, and a confining pressure of 10 kPa was applied onto the two side walls having five movable plates. It is well-known that the tendency of unbound ballast is to move laterally in outward direction (parallel to sleeper) under track operating conditions. Therefore, the shorter walls were allowed to move laterally and the other two longitudinal walls were kept fixed to mimic the plane strain conditions (ε2 = 0) in the direction parallel to rails (i.e., along the direction of passage of train), as was also adapted earlier by Hussaini (2013) and Indraratna et al. (2013). Two earth pressure cells were placed at sleeper-ballast and ballast-sub-ballast interface to measure the vertical stresses during the test. The pressure cells used in the current study had the diameter of 230 mm and the thickness of 12 mm.
Tests were conducted at loading frequencies of 10, 20, 30, and 40 Hz which is representative of higher train speeds (~73–292 km/h, for an axle spacing of 2.02 m) and up to 250,000 load cycles (N). During the test, the lateral displacement of the movable plates and the vertical settlement of ballast were continuously recorded by the data acquisition system. The extent of vertical settlement was also recorded by placing four settlement plates at sleeper-ballast and ballast-sub-ballast interface. The test was halted at specific number of cycles to record the vertical settlement of ballast and sub-ballast layers. The ballast specimen was retrieved carefully and sieved after each test to evaluate the change in gradation and to quantify the breakage of particles owing to cyclic loading. Figure 2B shows the final arrangement of the test specimen ready for testing.
Results and Discussion
Friction Angle (φ) of Ballast-Sub-Ballast Interface
Figure 3A shows the variation of friction angle (φ) with applied normal stress (σn) for unreinforced ballast-sub-ballast interface and that reinforced with various geogrids at Sr = 5.0 mm/min. It is seen that the φ of unreinforced ballast-sub-ballast interface reduces from 61.82 to 48.95° as σn increases from 20 to 100 kPa. The decrease in φ with the increase in σn is primarily due to the suppression of dilation and also because of the enhanced breakage of particles (as will be described in the latter sections of the paper) at higher normal stresses. Similar to the behavior of unreinforced interface, the apparent friction angle (δ) of ballast-sub-ballast interface when reinforced with geogrids G1 and G2 decreases from 66.02 to 50.97° and 65.76 to 50.22°, respectively, as σn increases from 20 to 100 kPa. A similar reduction in δ with the increase in σn is observed for other rates of shearing (Sr) but is not shown here for the sake of brevity. It is further observed that δ of all reinforced ballast-sub-ballast interfaces is greater than that of unreinforced interfaces (Figure 3A). For example, the insertion of geogrids G4 and G5 at ballast-sub-ballast interface increases the values of φ from 61.82 to 64.79° and 62.56°, respectively.
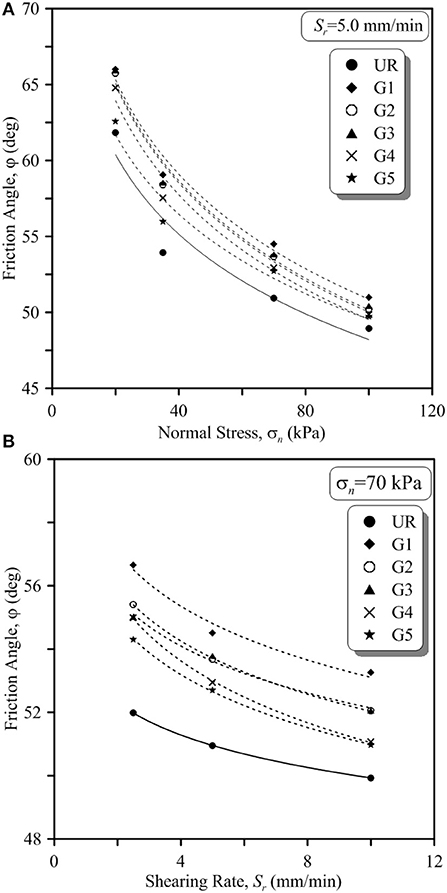
Figure 3. Variation of friction angle of unreinforced and geogrid-reinforced ballast-sub-ballast with (A) applied normal stress at Sr = 5.0 mm/min and (B) shearing rates at σn = 70 kPa.
Figure 3B depicts the variation of friction angle (φ) with shearing rate (Sr) of unreinforced ballast-sub-ballast interface and that reinforced with various geogrids at σn = 70 kPa. The value of φ of unreinforced ballast-sub-ballast interface decreases from 51.98 to 49.93° as Sr is increased from 2.5 to 10.0 mm/min. The increasing rates of shearing have a similar effect on the friction angle of ballast-geogrid-sub-ballast interfaces. For example, the apparent friction angle (δ) of ballast-sub-ballast reinforced with geogrid G4 and G5 reduced from 54.98 to 51.53° and 54.3 to 51° as Sr increased from 2.5 to 10.0 mm/min. The observation with respect to the variation of φ with Sr is in accordance with the studies conducted for ballast (Sweta and Hussaini, 2018) and sub-ballast (Biabani and Indraratna, 2015). In a practical sense, the reduced values of friction angles with the increase in shearing rates indicate the reduction in ballast performance with the increase in train speeds. However, it is seen that the geogrids enhance the friction angle of ballast-sub-ballast interface for all the applied shearing rates (Figure 3B), thereby highlighting their effectiveness in enhancing the ballast performance at higher train speeds. For instance, φ of unreinforced ballast-sub-ballast interface increased from 51.98 to 56.66° and 55.41° when stabilized with geogrid G1 and G2, respectively.
Dilation Angle (ψ) of Ballast-Sub-Ballast Interface
The dilation angle (ψ) of ballast-sub-ballast is mainly associated with the rate of dilation and is computed as the ratio of change in vertical displacement (dv) to the change in horizontal displacement (dh) (Equation 1; Bolton, 1986; Simoni and Houlsby, 2006) and can be expressed as
Where ψ is the dilation angle, d(dv) is the change in vertical displacement, d(dh) is the change in horizontal displacement.
Figure 4 shows the variation of peak dilation angle (ψ) with peak friction angle (φ) of unreinforced ballast-sub-ballast interface and that stabilized with geogrids for different values of Sr. As expected, dilation angle (ψ) of both unreinforced and reinforced ballast-sub-ballast interface decreases with increasing values of σn. For example, the value of ψ in case of unreinforced ballast-sub-ballast interface and that reinforced with G1 is found to decrease from 14.56 to 8.51° and 11.03 to 4.13° as σn increases from 20 to 100 kPa (Sr = 2.5 mm/min). Likewise, for Sr = 5.0 and 10.0 mm/min, the value of ψ decreases from 12.89 to 7.74° & 10.38 to 3.89° and 11.89 to 5.23° & 9.16 to 4.78°, respectively. It is further revealed that dilation angle (ψ) of both unreinforced and reinforced interface decreases with the increase in Sr. The value of ψ of unreinforced ballast-sub-ballast and that reinforced with G1 decreases from 14.56 to 11.89° and 10.38 to 9.16° as Sr increases from 2.5 to 10.0 mm/min (σn = 20 kPa). Likewise, for other normal stresses of 35, 70, and 100 kPa, ψ decreases from 12.78 to 8.95° & 9.24 to 8.00°, 9.73 to 7.42 & 6.78 to 6.34°, and 8.51 to 5.23° & 4.13 to 3.35°, respectively. Figure 5 also establishes the role of geogrids in diminishing the extent of dilation. For instance, reinforcement of ballast-sub-ballast interface with geogrid G1 reduces the dilation angle (ψ) from 14.56 to 11.03° (σn = 20 kPa; Sr = 2.5 mm/min).
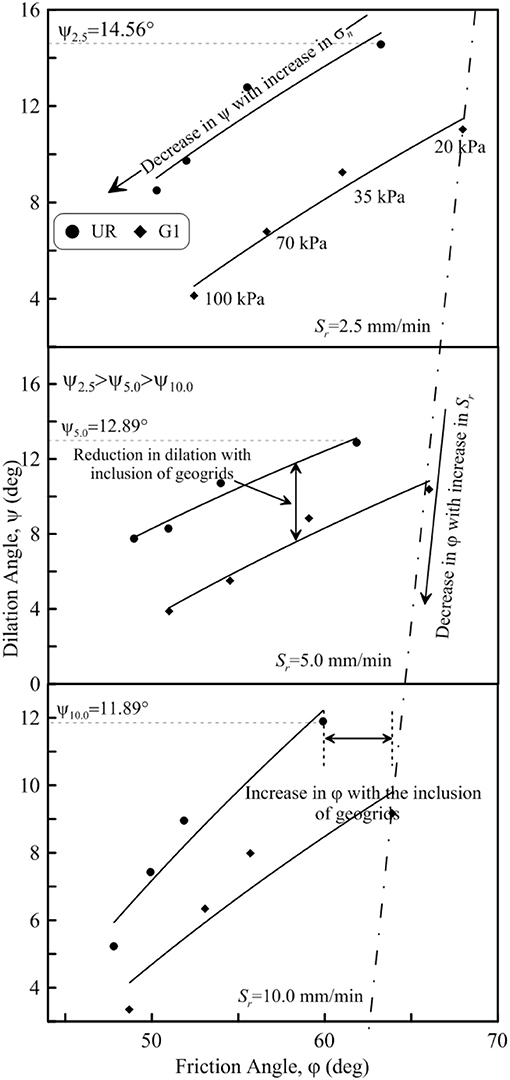
Figure 4. Variation of dilation angle (ψ) with peak friction angle (φ) of unreinforced and geogrid-reinforced ballast-sub-ballast interface.
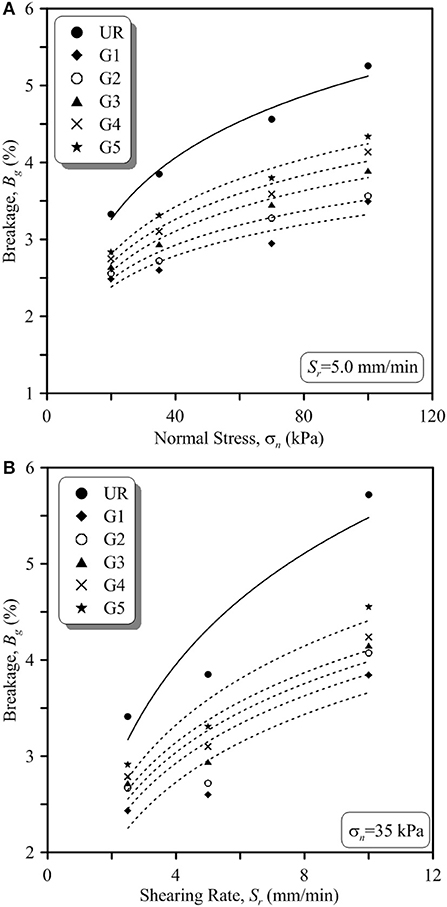
Figure 5. Variation of breakage of unreinforced and geogrid-reinforced ballast with (A) applied normal stress at Sr = 5.0 mm/min and (B) shearing rates at σn = 35 kPa.
Breakage of Ballast (Bg) Under Shearing Conditions
The influence of applied normal stress (σn) and shearing rate (Sr) on the breakage of ballast for both unreinforced and reinforced ballast-sub-ballast interface is shown in Figure 5. It is revealed that Bg increases with the increase in σn and Sr. For example, Bg of unreinforced ballast increased from 3.33 to 5.26% as σn increased from 20 to 100 kPa. Furthermore, the value of Bg of unreinforced ballast increased from 3.41 to 5.72% as Sr enhanced from 2.5 to 10.0 mm/min (σn = 35 kPa; Figure 5A). A similar increase in Bg is observed for geogrid-reinforced ballast-sub-ballast interface. For instance, the ballast-sub-ballast interface when reinforced with geogrid G1 and G2, the value of Bg increases from 2.49 to 3.49% and 2.56 to 3.56% as σn increases from 20 to 100 kPa. Furthermore, for the applied normal stress of 35 kPa, the value of Bg of ballast-sub-ballast interface reinforced with geogrid G1 increases from 2.43 to 3.84% as Sr increases from 2.5 to 10.0 mm/min. It is evident from Figure 5B that insertion of geogrids at ballast-sub-ballast interface diminishes the extent of Bg in ballast. For example, in case of ballast reinforced with geogrid G4 and G5, the value of Bg reduced from 3.85 to 3.10% and 3.31%, respectively (σn = 35 kPa; Sr = 5.0 mm/min).
Regression Models to Determine of Friction (φ), Dilation Angles (ψ), and Breakage (Bg) of Ballast
To emphasize the role of geogrid aperture size (A) in enhancing the shear strength of ballast, the variation of interface efficiency factor (α) and ballast breakage (Bg) with A/D50 ratio for different rates of shearing (Sr) are shown in Figure 6. It is revealed from Figure 6 that as the value of α increases, the extent of Bg decreases. For instance, α attains the maximum value of 1.22 and Bg attains the minimum value of 2.75% at A/D50 = 0.93 (G1) and then α decreases to 1.10 and Bg increases to 3.15% at A/D50 = 1.54 (G5) (Sr: 2.5 mm/min). Similarly, for Sr = 5.0 and 10.0 mm/min, geogrid G1 with an A/D50 of 0.93 exhibits the maximum value of α of 1.19 and 1.15 which in turn exhibits the minimum breakage of 2.88 and 3.93%, respectively. This signifies that by suitably selecting the geogrids, the value of α could be enhanced significantly and breakage of ballast particles could be minimized.
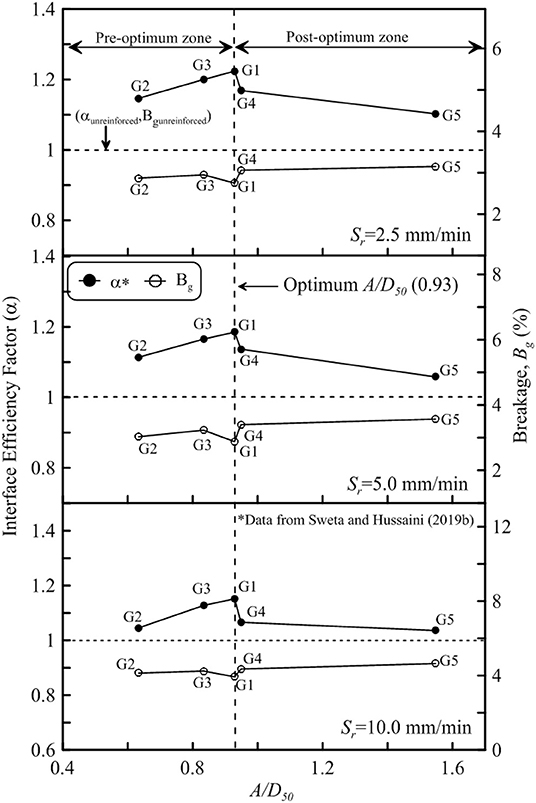
Figure 6. Variation of interface efficiency factor (α) and breakage (Bg) with A/D50.
It is well-known that the behavior of ballast under track operating conditions is governed by axle load, confining pressure and the train speed. In a real rail track environment, axle load is transferred through the wheels of the trains while the confining pressure is generated due to particle-particle interaction, sleeper resistance, compaction stresses and overburden pressure. Moreover, a track under operating conditions will be often subjected to varying train speeds. Therefore, the field conditions are replicated in the laboratory, by suitably considering the values of applied normal stress and the rate of shearing (Sweta and Hussaini, 2019a). Moreover, the performance of a reinforced railway track depends upon the ratio of aperture size (A) of geogrids and the mean particle sizes, A/D50 ratio (Indraratna et al., 2012; Sweta and Hussaini, 2018, 2019a,b). In this context, regression models are developed to determine the values of friction angle (φ), dilation angle (ψ) and breakage of ballast (Bg) in terms of the input parameters σn, Sr, and A/D50 (Equations 2–7). Based on the variation of α, the A/D50 is classified into two zones (i.e., pre-optimum and post-optimum zone) as shown in Figure 6. The pre-optimum zone lies in the range of 0.63 ≤ A/D50 ≤ 0.93 while the post-optimum zone lies in the range of 0.93 ≤ A/D50 ≤ 1.54. The R2 values for the models presented here vary from 0.88 to 0.90.
For 0.63 ≤ A/D50 ≤ 0.93:
For 0.93 ≤ A/D50 ≤ 1.54
Where φ = friction angle, ψ = dilation angle, Bg = breakage, σn = applied normal stress, Sr = rate of shearing.
The models presented here will help the rail practitioners to predict the values of φ, ψ, and Bg for ballast under both unreinforced and reinforced conditions once the values of input parameters (σn, Sr, and A/D50) are known.
Lateral Displacement (ld) and Vertical Settlement (Sv) of Ballast During Cyclic Loading
The evolution of lateral displacement (ld) and vertical settlement (Sv) with number of load cycles (N) in case of unreinforced and geogrid-reinforced ballast at f = 30 Hz is shown in Figure 7. It is observed that the extent of ld and Sv increases rapidly during the initial load applications (i.e., for values of N up to 50,000 cycles), and thereafter the displacements remain mostly the same. However, the extent of ld and Sv of ballast reduces with the inclusion of geogrids. For example, insertion of geogrids G1 and G3 reduces the amount of ld and Sv by 41 & 30% and 33 & 24%, respectively, in comparison to unreinforced ballast. On the other hand, the geogrid G5 reduces the values of ld and Sv by 8% only. This is because the aperture sizes of geogrids G1 and G3 are nearer to the average particle size of ballast (D50: 42 mm) that ensures effective interlocking of particles thus reducing both ld and Sv. On the other hand, geogrid G5 having larger apertures facilitates the free movement of particles within the aperture of the geogrids. The almost constant values of ld and Sv for N > 50,000 in case of reinforced samples (Figure 7) indicate that the effectiveness of ballast-geogrid interlock remains unaffected upon repeated load applications. In a practical sense, this implies that once the required ballast-geogrid interlock is accomplished, the geogrid continues to perform its intended purpose of arresting the lateral displacement and thus reducing the vertical settlement of ballast even at 250,000 load cycles. However, the results indicated that the extent of ld and Sv increases with the increase in loading frequency but the same are not shown here for the sake of brevity.

Figure 7. Variation of (A) vertical settlement (Sv) and (B) lateral displacement (ld) of unreinforced and geogrid-reinforced ballast with load cycles (N).
Role of Geogrid Aperture Size on the Deformation of Ballast
To highlight the role of geogrid aperture size, the variation of final lateral displacement (ld) and vertical settlement (Sv) is plotted against A/D50, the ratio of geogrid aperture size to the average particle size of ballast (Figure 8). Figure 8A shows the variation of ld of ballast along the depth of ballast layer as measured at levels of five movable plates with A/D50 for f = 30 Hz. It is revealed that the placement of geogrids at the ballast-sub-ballast interface has shown negligible effect in arresting the lateral displacements at the level of top three plates. However, inclusion of geogrids shows a remarkable effect in reducing the lateral displacements of the bottom two plates. These observations establish beyond doubt the diminishing role of geogrid in arresting particle movements away from its placement position. The role of A/D50 is thus evident in the near vicinity of geogrid placement position (i.e., for the bottom two plates). In case of the bottom most plate, the value of ld decreases from 14.65 to 9.99 mm as A/D50 increases from 0.63 to 0.93 which again increases to 15.68 mm at A/D50 of 1.54. An increase in lateral displacement at A/D50 of 1.54 subsequent to the minimum lateral displacement at A/D50 of 0.93 is mainly due to free movement of the particles within the aperture of geogrids.
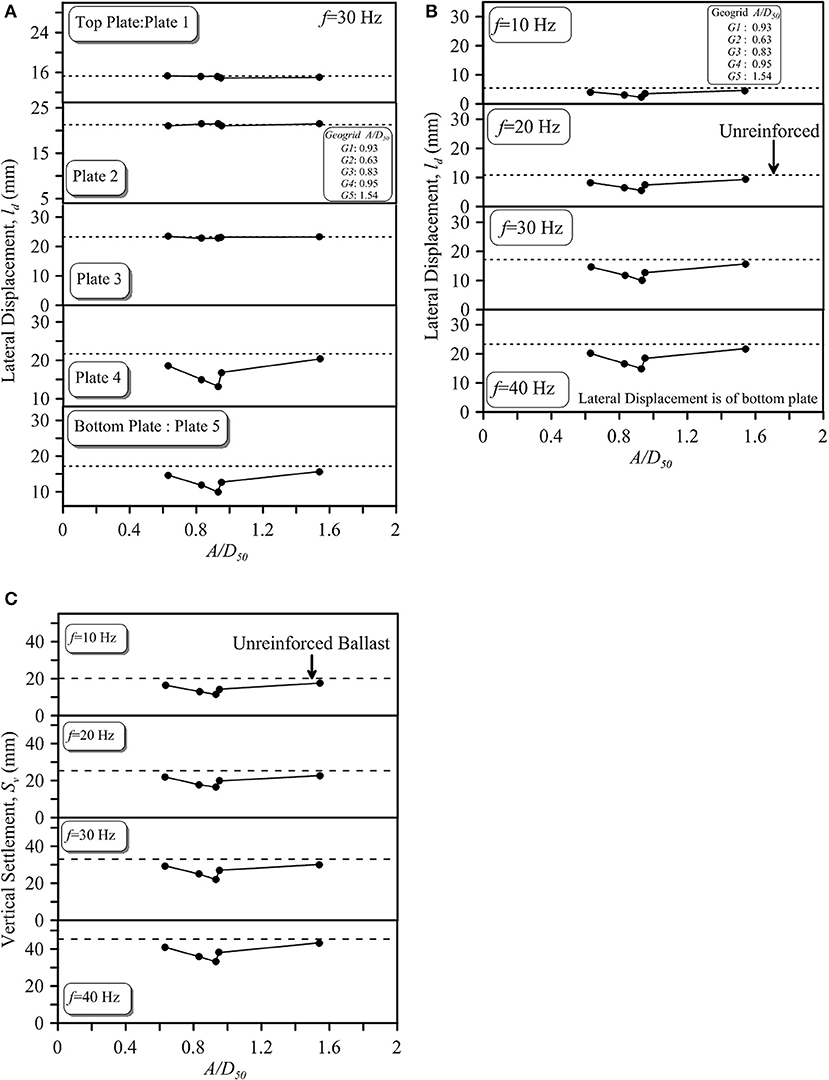
Figure 8. Variation of (A) lateral displacement (ld) of geogrid-reinforced ballast with A/D50 at f = 30 Hz, (B) lateral displacement (ld) with A/D50 at different frequencies, and (C) vertical settlement with A/D50 at different frequencies.
Figures 8B,C depicts the variation of lateral displacement (ld) and vertical settlement (Sv) of ballast with A/D50 for various loading frequencies. It is observed from Figure 8B that the value of ld decreases from 4.14 to 2.25 mm as A/D50 increases from 0.63 to 0.93 which then increases to 4.64 mm at A/D50 of 1.54 (f = 10 Hz). Similarly, the value of Sv decreases from 16.50 to 11.41 mm as A/D50 increases from 0.63 to 0.93 and then increases to 17.59 mm at A/D50 of 1.54 (f = 10 Hz; Figure 8C). It is further seen that the variation of ld and Sv with A/D50 remain similar with the increase in loading frequencies albeit with reduced efficiency of geogrids (Figures 8B,C). The variation of ld and Sv with A/D50 observed here follows a similar trend as that of variation of interface efficiency factor with A/D50 obtained in case of ballast-sub-ballast interface by Sweta and Hussaini (2019b) under direct shear conditions.
Ballast Breakage Under Cyclic Loading Conditions
To highlight the effect of geogrids in reducing the extent of particle breakage, the initial and final PSDs of unreinforced ballast and that reinforced with geogrids G1 and G5 at f = 30 Hz are compared (Figure 9A). The final PSD of the unreinforced ballast lie far away from its initial PSD followed by the final PSD when reinforced with G5 and G1. Although this highlights the role of geogrids in reducing the overall ballast breakage, but its effect on specific particle sizes is seen clearly from Figure 9B that shows the variation of difference in percentage retained before and after the test (ΔWk) at f = 30 Hz. It is evident that bigger particles (>40 mm), due to the presence of natural flaws in them and their tendency to take up higher proportions of applied load, are more susceptible to breakage in comparison to the smaller particles. Further, the effect of various geogrids (G1 to G5) in reducing the extent of breakage in bigger particles is also clearly evident from Figure 9B, thus justifying their use for stabilizing the rail tracks.
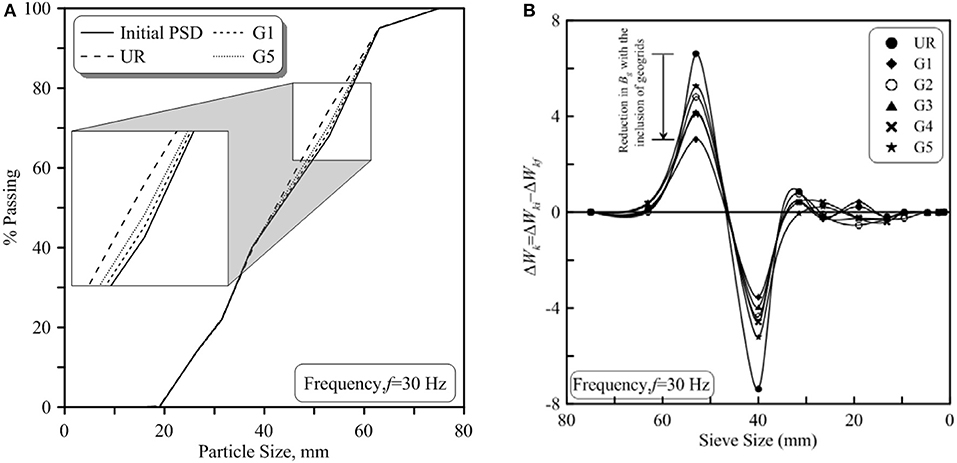
Figure 9. (A) Change in PSD of ballast during cycling loading and (B) variation of particle distribution with sieve size for unreinforced and geogrid-reinforced ballast.
Conclusions
The current study investigated the shear behavior of geogrid-reinforced ballast-sub-ballast interface and also the deformation and degradation behavior of geogrid-reinforced ballast under cyclic loading conditions. It was revealed that friction (φ) and dilation angles (ψ) of unreinforced ballast-sub-ballast interface reduces from 63.24 to 47.82° and 14.56 to 5.23° with the increase in σn and Sr, respectively. The breakage of ballast (Bg) occurred during shearing was quantified in terms of Marsal's Breakage (Bg). The Bg of unreinforced ballast increases from 2.84 to 6.69% with the increase of σn & Sr. The tests results further revealed that inclusion of geogrids enhanced the shear strength of ballast-sub-ballast interface. For example, φ of unreinforced ballast-sub-ballast interface increased from 61.82 to 66.02° and ψ decreased from 12.89 to 10.38° when the ballast-sub-ballast interface was reinforced with geogrid G1 (σn = 20 kPa; Sr = 5.0 mm/min). Moreover, the extent of Bg in case of direct shear test decreases from 3.33 to 2.49 and 2.56% when stabilized with geogrid G1 and G2, respectively (σn = 20 kPa Sr = 5.0 mm/min). The interface efficiency factor (α) and Bg were found to be function of A/D50 ratio. For the set of geogrids tested in the current study, geogrid G1 with an optimum A/D50 of 0.93 exhibits the maximum value of α and minimum value of Bg. Moreover, regression model is developed using multiple linear regression analysis to predict the values of φ, ψ, and Bg in terms of the input parameters σn, Sr, and A/D50 ratio.
The results from the cubical triaxial tests revealed that the deformation and degradation behavior of ballast under cyclic loading conditions was highly influenced by the loading frequency (f). It is shown that the extent of lateral displacement (ld) and vertical settlement (Sv) increases rapidly during the initial number of load cycles and thereafter it remains constant. The extent of ld and Sv of unreinforced ballast increases from 5.48 to 28.32 mm and 20.13 to 45.40 mm with the increase in f from 10 to 40 Hz. The value of Bg increased from 4.3 to 11.69% when the value of f was increased from 10 to 40 Hz. It is further revealed that the inclusion of geogrids reduced the extent of ld and Sv of ballast and minimized the extent the particle breakage during cyclic loading. For instance, insertion of geogrid G1 reduces the extent of ld and Sv by 42 and 33%, respectively. The current study showed the benefits of geogrids in enhancing the shear strength and also in reducing the deformation and degradation of ballast particles.
Data Availability Statement
All datasets generated for this study are included in the article/supplementary material.
Author Contributions
SH and KS have contributed in the preparation of this manuscript.
Conflict of Interest
The authors declare that the research was conducted in the absence of any commercial or financial relationships that could be construed as a potential conflict of interest.
References
Afzali-Nejad, A., Lashkari, A., and Shourijeh, P. T. (2017). Influence of particle shape on the shear strength and dilation of sand-woven geotextile interfaces. Geotext. Geomembr. 45, 54–66. doi: 10.1016/j.geotexmem.2016.07.005
Anubhav and Basudhar, P. K. (2010). Modeling of soil-woven geotextile interface behavior from direct shear test results. Geotext. Geomembr. 28, 403–408. doi: 10.1016/j.geotexmem.2009.12.005
Anubhav and Basudhar, P. K. (2013). Interface behavior of woven geotextile with rounded and angular particle sand. J. Mater. Civ. Eng. 25, 1970–1974. doi: 10.1061/(ASCE)MT.1943-5533.0000774
Atalar, C., Das, B. M., Shin, E. C., and Kim, D. H. (2001). “Settlement of geogrid-reinforced railroad bed due to cyclic load,” in Proceedings of 15th International Conference on Soil Mechanics and Geotechnical Engineering (Istanbul), 2045–2048.
Bathurst, R. J., and Raymond, G. P. (1987). Geogrid reinforcement of ballasted track. Transport. Res. Rec. 1153, 8–14.
Biabani, M. M., and Indraratna, B. (2015). An evaluation of the interface behavior of rail sub-ballast stabilized with geogrids and geomembranes. Geotext. Geomembr. 43, 240–249. doi: 10.1016/j.geotexmem.2015.04.002
Biabani, M. M., Indraratna, B., and Ngo, N. T. (2016). Modelling of geocell-reinforced sub-ballast subjected to cyclic loading. Geotext. Geomembr. 44, 489–503. doi: 10.1016/j.geotexmem.2016.02.001
Bolton, M. D. (1986). The strength and dilatancy of sands. Geotechnique 36, 65–78. doi: 10.1680/geot.1986.36.1.65
Brown, S. F., Kwan, J., and Thom, N. H. (2007). Identifying the key parameters that influence geogrid reinforcement of railway ballast. Geotext.Geomembr. 25, 326–335. doi: 10.1016/j.geotexmem.2007.06.003
Chen, X., Jia, Y., and Zhang, J. (2018). Stress-strain response and dilation of geogrid reinforced coarse grained soils in large scale direct shear tests. Geotech. Test. J. 41, 1–10. doi: 10.1520/GTJ20160089
Choudhary, A. K., and Krishna, A. M. (2016). Experimental investigation of interface behaviour of different types of granular soil/geosynthetics. Int. J. Geosynth. Ground Eng. 2, 1–11. doi: 10.1007/s40891-016-0044-8
Guler, E., and Khosrowshahi, S. K. (2017). Evaluation of geosynthetic reinforcement on railroad subgrade. Proc. Eng. 189, 721–728. doi: 10.1016/j.proeng.2017.05.114
Hussaini, S. K. K. (2013). An experimental study on the deformation Behavior of geosynthetically reinforced ballast (Ph.D. thesis). Wollongong: University of Wollongong, Australia.
Hussaini, S. K. K., Indraratna, B., and Vinod, J. S. (2012). “Performance of geosynthetically reinforced rail ballast in direct shear conditions,” in 11th Australia New Zealand Conference on Geomechanics: Ground Engineering in a Changing World, eds G.A. Narsilo, A. Arulrajah, and J. Kodikara (Melbourne, VIC: Engineers Australia), 1268–1273.
Hussaini, S. K. K., Indraratna, B., and Vinod, J. S. (2015a). Application of optical fiber bragg grating sensors in monitoring the rail track deformations. Geotech. Test J. 38, 387–396. doi: 10.1520/GTJ20140123
Hussaini, S. K. K., Indraratna, B., and Vinod, J. S. (2015b). Performance assessment of geogrid reinforced rail road ballast during cyclic loading. Transport. Geotech. 2, 99–107. doi: 10.1016/j.trgeo.2014.11.002
Hussaini, S. K. K., Indraratna, B., and Vinod, J. S. (2016). A laboratory investigation to assess the functioning of railway ballast with and without geogrids. Transport. Geotech. 6, 45–54. doi: 10.1016/j.trgeo.2016.02.001
Indraratna, B., Biabani, M. M., and Nimbalkar, S. (2015). Behavior of geocell-reinforced sub-ballast subjected to cyclic loading in plane-strain condition. J. Geotech. Geoenviron. Eng. 141:04014081. doi: 10.1061/(ASCE)GT.1943-5606.0001199
Indraratna, B., Hussaini, S. K. K., and Vinod, J. S. (2012). On the shear behavior of ballast-geosynthetic interfaces. Geotech. Test. J. 35, 305–312. doi: 10.1520/GTJ103317
Indraratna, B., Hussaini, S. K. K., and Vinod, J. S. (2013). The lateral displacement response of geogrid-reinforced ballast under cyclic loading. Geotext. Geomembr. 39, 20–29. doi: 10.1016/j.geotexmem.2013.07.007
Indraratna, B., Shanin, M. A., and Salim, W. (2007). Stabilisation of granular media and formation soil using geosynthetics with special reference to railway engineering. Proc. Inst. Civ. Eng. Ground Improv. 11, 27–43. doi: 10.1680/grim.2007.11.1.27
Indraratna, B., Thakur, P. K., and Vinod, J. S. (2010). Experimental and numerical study of railway ballast behavior under cyclic loading. Int. J. Geomech. 10, 136–144. doi: 10.1061/(ASCE)GM.1943-5622.0000055
IRSGE (2004). Specifications for Track Ballast. Research Design and Standard Organisation (RDSO), Ministry of Railways, India.
Jeffs, T., and Tew, G. P. (1991). A Review of Track Design Procedures: Sleepers and Ballast, Vol. 2. Melbourne, VIC: Railways of Australia.
Lee, K. M., and Manjunath, V. R. (2000). Soil-geotextile interface friction by direct shear tests. Can. Geotech. J. 37, 238–252. doi: 10.1139/t99-124
Liu, C. N., Ho, Y. H., and Huang, J. W. (2009). Large-scale direct shear tests of soil/PET yarn geogrid interfaces. Geotext. Geomembr. 27, 19–30. doi: 10.1016/j.geotexmem.2008.03.002
Liu, F.-Y., Wang, P., Geng, X., Wang, J., and Lin, X. (2016). Cyclic and post-cyclic behavior from sand-geogrid interface large-scale direct shear tests. Geosynth. Int. 23, 129–139. doi: 10.1680/jgein.15.00037
Liu, H., and Martinez, J. (2015). Creep behavior of sand-geomembrane interfaces. Geosynth. Int. 21, 83–88. doi: 10.1680/gein.13.00036
Liu, S., Huang, H., Qiu, T., and Kwon, J. (2016). Effect of geogrid on railroad ballast particle movement. Transport. Geotech. 9, 110–122. doi: 10.1016/j.trgeo.2016.08.003
Makkar, F. M., Chandrakaran, S., and Sankar, S. (2017). Performance of 3-D geogrid reinforced sand under direct shear mode. Int. J. Geotech. Eng. 13, 227–235. doi: 10.1080/19386362.2017.1336297
Matharu, M. S. (1994). Geogrid cut ballast settlement rate on soft substructures. Railway Gazette Int. 150, 165–166.
Mirzaalimohammadi, A., Ghazavi, M., Roustaei, M., and Lajewardi, S. H. (2019). Pullout response of strengthened geosynthetic interacting with fine sand. Geotext. Geomembr. 47, 530–541. doi: 10.1016/j.geotexmem.2019.02.006
Mishra, D., Qian, Y., Kazmee, H., and Tutumluer, E. (2014). Investigation of geogrid-reinforced railroad ballast behavior using large-scale triaxial testing and discrete element modeling. Transport. Res. Board. 2462, 98–108. doi: 10.3141/2462-12
Moraci, N., Cardile, G., Gioffrè, D., Mandaglio, M. C., Calvarano, S. M., and Carbone, L. (2014). Soil geosynthetic interaction: design parameters from experimental and theoretical analysis. Transport. Infrastr. Geotech. 1, 165–227. doi: 10.1007/s40515-014-0007-2
Mvelase, M. G., Grabe, P. J., and Anochie-Boateng, J. K. (2017). The use of laser technology to investigate the effect of railway ballast roundness on shear strength. Transport. Geotech. 11, 97–106. doi: 10.1016/j.trgeo.2017.05.003
Navaratnarajah, S. K., and Indraratna, B. (2017). Use of rubber mats to improve the deformation and degradation behavior of rail ballast under cyclic loading. J. Geotech. Geoenviron. Eng. 143:04017015 doi: 10.1061/(ASCE)GT.1943-5606.0001669
Nimbalkar, S., and Indraratna, B. (2016). Improved performance of ballasted rail track using geosynthetics and rubber shock mats. J. Geootech. Geoenviron. Eng. 142:04016031. doi: 10.1061/(ASCE)GT.1943-5606.0001491
Palmeira, E. M. (2009). Soil-geosynthetic interaction: modeling and analysis. Geotext. Geomembr. 27, 368–390. doi: 10.1016/j.geotexmem.2009.03.003
RDSOGE (2007). Guidelines for Blanket Layer Provision on Track Formation. Research Design and Standard Organisation (RDSO), Ministry of Railways, India.
Sayeed, M. M. A., Ramaiah, B. J., and Rawal, A. (2014). Interface shear characteristics of jute/polypropylene hybrid nonwoven geotextiles and sand using large size direct shear test. Geotext. Geomembr. 42, 63–68. doi: 10.1016/j.geotexmem.2013.12.001
Shin, E. C., Kim, D. H., and Das, B. M. (2002). Geogrid-reinforced railroad bed settlement due to cyclic load. Geotech. Geol. Eng. 20, 261–271. doi: 10.1023/A:1016040414725
Simoni, A., and Houlsby, G. T. (2006). The direct shear strength and dilatancy of sand-gravel mixtures. Geotech. Geol. Eng. 24, 523–549. doi: 10.1007/s10706-004-5832-6
Sun, Q., Indraratna, B., and Ngo, N. T. (2019). Effect of increase in load and frequency on the resilience of railway ballast. Geotechnique 69, 833–840. doi: 10.1680/jgeot.17.P.302
Sun, Q., Indraratna, B., and Nimbalkar, S. (2014). Effect of cyclic loading frequency on the permanent deformation and degradation of railway ballast. Geotechnique 64, 746–751. doi: 10.1680/geot.14.T.015
Sweta, K., and Hussaini, S. K. K. (2018). Effect of shearing rate on the behavior of geogrid-reinforced railroad ballast under direct shear conditions. Geotext. Geomembr. 46, 251–256. doi: 10.1016/j.geotexmem.2017.12.001
Sweta, K., and Hussaini, S. K. K. (2019a). Performance of geogrid-reinforced railroad ballast in direct shear mode. Proc. Inst. Civ. Eng. Ground Improv. 172, 244–256 doi: 10.1680/jgrim.18.00107
Sweta, K., and Hussaini, S. K. K. (2019b). Behavior evaluation of geogrid-reinforced ballast-sub-ballast under shear conditions. Geotext. Geomembr. 47, 23–31. doi: 10.1016/j.geotexmem.2018.09.002
Thakur, P. K., Vinod, J. S., and Indraratna, B. (2013). Effect of confining pressure and frequency on the deformation of ballast. Geotechnique 63, 786–790. doi: 10.1680/geot.12.T.001
Vieira, C. S., Lopes, M. L., and Caldeira, L. M. (2015). Sand-geotextile interface characterization through monotonic and cyclic direct shear tests. Geosynth. Int. 20, 26–38. doi: 10.1680/gein.12.00037
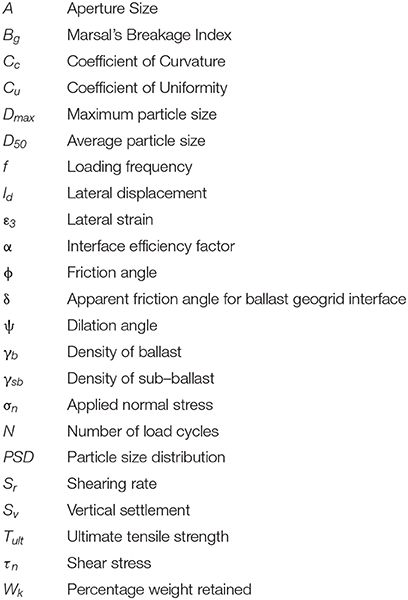
Nomenclature
Keywords: geosynthetics, ballast-sub-ballast interface, direct shear test, cyclic loading, friction angle (φ), settlement (Sv), loading frequency (f), process simulation test (PST) apparatus
Citation: Hussaini SKK and Sweta K (2020) Application of Geogrids in Stabilizing Rail Track Substructure. Front. Built Environ. 6:20. doi: 10.3389/fbuil.2020.00020
Received: 21 August 2019; Accepted: 11 February 2020;
Published: 25 February 2020.
Edited by:
Eduardo Cabrita Fortunato, National Laboratory for Civil Engineering, PortugalReviewed by:
Ruilin You, China Academy of Railway Sciences, ChinaSujit Kumar Dash, Indian Institute of Technology Kharagpur, India
Copyright © 2020 Hussaini and Sweta. This is an open-access article distributed under the terms of the Creative Commons Attribution License (CC BY). The use, distribution or reproduction in other forums is permitted, provided the original author(s) and the copyright owner(s) are credited and that the original publication in this journal is cited, in accordance with accepted academic practice. No use, distribution or reproduction is permitted which does not comply with these terms.
*Correspondence: Syed Khaja Karimullah Hussaini, aHVzc2FpbmlAaWl0cC5hYy5pbg==