 Fernando Moreu
 Dilendra Maharjan
 Can Zhu
 Elijah Wyckoff
- 1Department of Civil, Construction and Environmental Engineering, University of New Mexico, Albuquerque, NM, United States
- 2Department of Electrical and Computer Engineering, University of New Mexico, Albuquerque, NM, United States
- 3Department of Mechanical Engineering, University of New Mexico, Albuquerque, NM, United States
- 4Department of Civil Engineering, Yangzhou University, Yangzhou, China
- 5Department of Mechanical Engineering, School for the Engineering of Matter, Transport, and Energy, Arizona State University, Tempe, AZ, United States
Human induced dynamic forces on structures are of interest in the area of human-environment interfaces. The research community is interested in characterizing human decisions and providing information on the consequences of human actions to control those human forces more effectively. Dynamic structures can vibrate under human motion. In the context of human–structure interactions (HSI), dance induced vibrations can be quantified with sensors. This data can provide a unique opportunity for dancers to understand the quality of their dance with objective metrics. Previous work in capturing dance moves required wearable sensors attached to the dancer’s body. Often an intrusive process, this method is not scalable if dancers are not familiar with technology and it limits their participation without access to special studios or facilities. If simple, deployable technology could be available to dancers, they could monitor their dance without engineers. This research integrates dancers’ interest in qualifying dance motion and engineering curiosity to study human induced vibrations. As a part of the framework, researchers used two indexes to differentiate between a well synchronized group dance from asynchronous moves. The two indexes are the Harmony Index and the Coordination Index, respectively, and are validated against the Visual Index, a qualitative index obtained from an expert who judged dance moves based on one video capture. The indexes were derived from measurements of the movement of the structure dynamically excited by the dancers, hence quantifying dance coordination. These two indexes are based on time history data obtained from sensors installed on a wooden bridge where dancers performed at different levels of proficiency. The results of this research show that the two indexes sort effectively the quality of the dancers, when validated with the Visual Index. As a result, this research proposes using Low-cost efficient wireless intelligent sensor (LEWIS) to objectively sort different levels of dance quality which could be expanded to study the HSI for design and assessment of the structural systems used for dancing, such as performance halls and ballrooms.
Introduction
Engineers study structural vibrations induced by human activities (International building code [IBC], 2009; ASCE, 2013). Previous studies have structures as mass-damper systems interacting with motions induced by humans (Ellingwood and Tallin, 1984; Ellis et al., 1997; Ji et al., 1997) in various structures such as footbridges (Bocian et al., 2016; Shahabpoor et al., 2016; Vasilatou et al., 2017), stairways (Kerr and Bishop, 2001), stadiums (Vasilatou et al., 2017) and long-span floors (Reynolds, 2014; Gheitasi et al., 2016). However, the emphasis of their studies is on understanding structural dynamics and how to design structures better under those dynamic loads. As the engineering field advances “smart” structures and the area of human–structure interaction (HSI), technology allows for structures to inform of occupants’ associated patterns (Fuhr et al., 1992; Pan et al., 2014; Poston et al., 2015). HSI is a two-way phenomenon where the human and the structure are interrelated: if the humans could understand quantitively the structural responses due to their action, they could also better control their interaction with the structure. This paper focuses on sensing dance performances that quantitatively assess the quality of dancers on one bridge.
Using technology to quantify an artistic aspect of human motion is a research area of interest for both engineers and artists (Paradiso and Sparacino, 1997; Paj et al., 2017). A common approach to study the motion of the dancers is to attach wireless sensors to their bodies (Lynch et al., 2005). However, wearable sensors restrict dancers’ movements. Researchers use multiple red green blue (RGB) color sensors and depth sensors to capture a high complexity of dynamic movements (Kim et al., 2017). Similarly, scientists use instrumented rooms to capture dancers’ motions using video cameras and motion tracking sensors (Mayagoitia et al., 2002; Poppe, 2010; Dania et al., 2011). Wearable insole pressure sensors are also used to capture motion sonically (Großhauser et al., 2012). However, these processes can be easily disrupted. In summary, dancers note that their artistic way of performing is compromised by complex experimental setups and sensors attached to their bodies, limiting their expression and creativity.
Dancers are interested in quantifying their performance without attaching sensors to their bodies nor transforming their dancing setups. There is also an interest in engineering for using structures as sensors to inform about human activity (Wang et al., 2003; Simon, 2004; Pan et al., 2015). This paper’s research uses technology and data processing approaches from the rich field of HSI to explore collaboration in the area of dancing and engineering, with the goal of quantifying the synchronization of humans. Following interest from both the engineering and dancing communities, researchers conducted a group dancing experiment on a footbridge. This experiment was designed to provide feedback to the dancer without the knowledge of dynamics of HSI. Furthermore, using non-intrusive sensing technology, researchers captured dance motion without inhibiting dancers’ ability to perform freely.
For this research, the human motion is quantified using low-cost efficient wireless intelligent sensors (LEWIS), a sensor that high school students can build and learn to use in less than 30 min. Investigators used 100 Hz sampling rate, low-cost, readily available off-the-shelf sensors. For non-technical users like dancers, these sensors are ideal to capture the human induced vibrations (Maharjan et al., 2019). These sensors were previously used for simplified sensing of structures (Gomez et al., 2017). In this paper, researchers present and validate the results obtained for the performed dances from the analysis of two sensors. Two indexes, Harmony Index and Coordination Index, reflect the coordination between dancers dancing together. The Visual Index is used as the ground truth to validate the two measured indexes. The Visual Index was obtained from experts who judged the dance moves, and by observing the dance quality they provided a score. The two indexes successfully sort the dances in terms of quality in a sequence similar to that of the Visual Index.
Methodology
Bridge Site
This sensor setup applies to any structure, including most floors, and is not limited to a bridge. The highly elastic behavior of a wood bridge is similar to the springy nature of wood stages commonly used in professional dance performances, thereby enhancing the generality of this study’s findings to other indoor and outdoor structures used for dance performances. This research demonstrates the portability of the sensors and the simple procedure for outdoor dancing experiments, without the need for additional power or laboratory equipment. Additionally, the dancing on the bridge has an artistic value that connects creativity with the harmony between the built environment, the water, and nature.
This research used an outdoor, five-span wooden footbridge located at the University of New Mexico (UNM). Figure 1 shows the elevation of the Duck Pond Bridge looking west. The bridge is made up of a wooden deck supported by concrete piers. This site enables dancers to dance outdoors and collect the vibration data on the bridge deck instrumented with sensors. A dance performance is generally conducted on stages with springy diaphragms, so the results of this research outdoors can also be used for indoor experiments with traditional dancing studios.
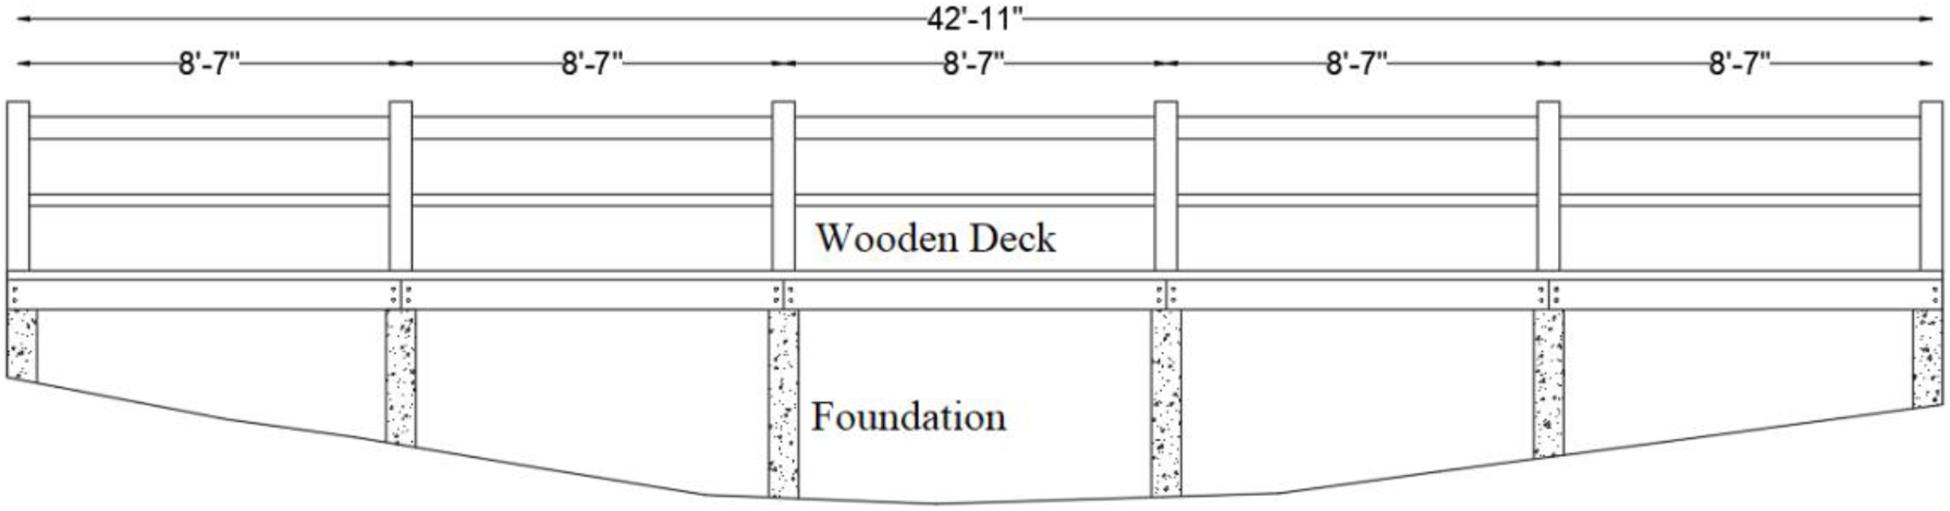
Figure 1. Duck Pond Bridge looking west.
Instrumentation
This research used off-the-shelf low-cost material to build LEWIS: an Arduino Uno microcontroller board as data acquisition (DAQ) system and an accelerometer sensor with 100 Hz sampling frequency. It is operated by a 5.5 Volt DC power supply which can be connected to USB or standalone power supply as a battery. The accelerometer is MMA84532Q, a capacitive accelerometer manufactured by NXP semiconductors. The sensitivity of this accelerometer is 1 mg/least significant bit (LSB) and can capture up to ± 8g. The programmable codes are open source codes based on C language. The market cost for the LEWIS sensor is below 50 USD which makes it easily accessible to general consumption. The quality of this sensor was verified in various experiments in the past to be similar to commercial sensors (Ozdagli et al., 2018). The most important feature of this sensor is its simplicity. The research team trained high schoolers to build these sensors in 30 min and to use them to collect outdoor data in the same morning, with no former experience (Moreu et al., 2018, 2019). A YouTube video shows how a high school dancer builds this sensor for her experiment (Moreu et al., 2018). Figure 2 shows the sensor used for this research that is shown in the video made with the dancer providing instructions to the community. Following this approach, dancers can create a hands-on sensor which is easy to use.
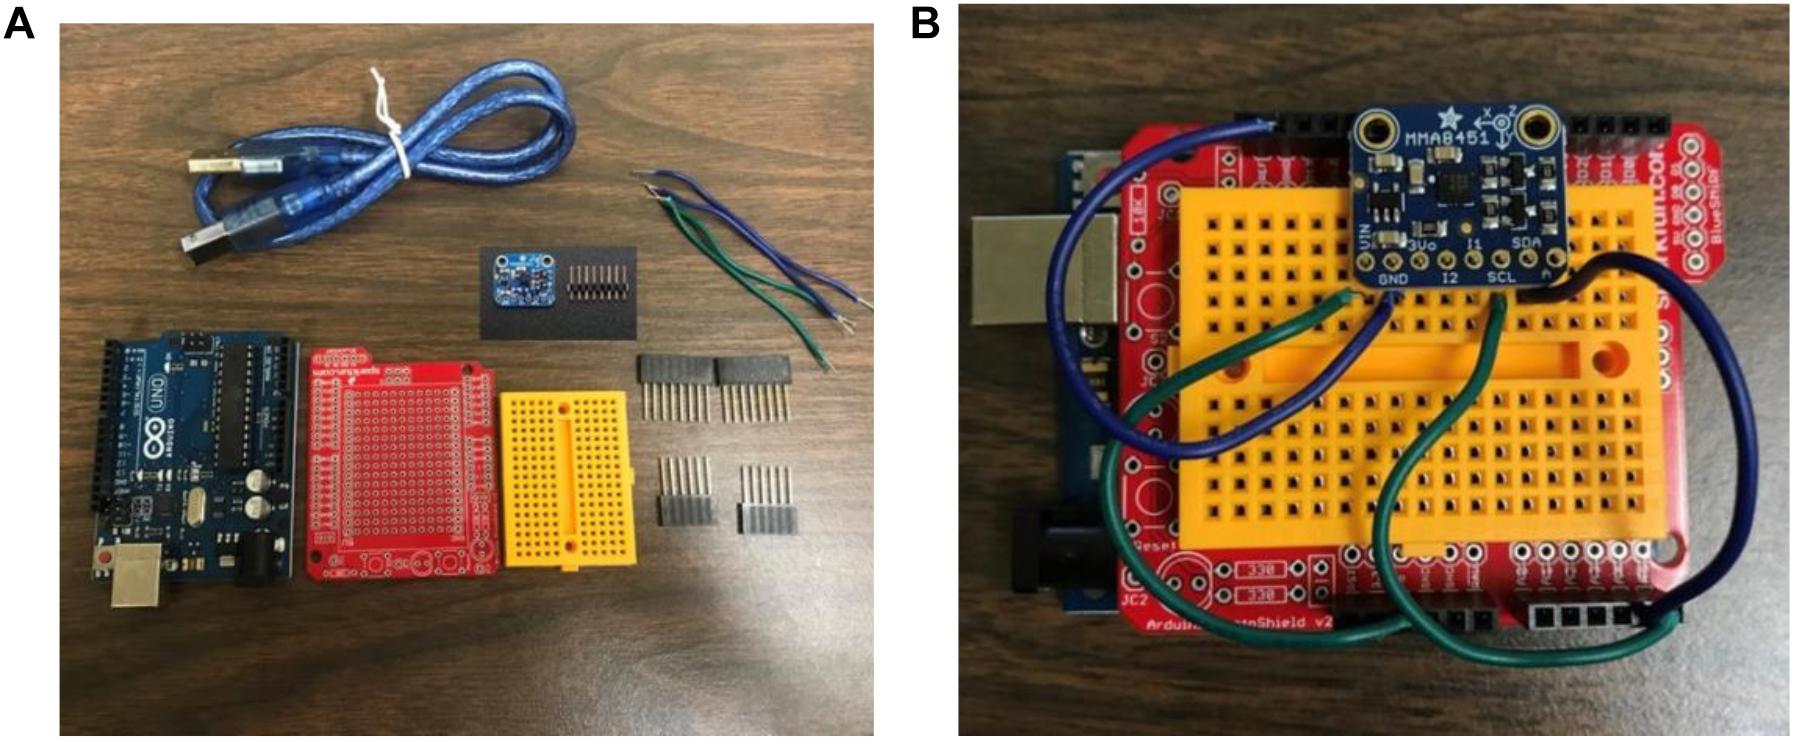
Figure 2. Low-cost efficient wireless intelligent sensor details: (A) parts provided to high school students to build their sensor. (B) Assembled sensor by high school student (Moreu et al., 2018).
Sensors Layout
The sensors were built by high school students as a summer project in collaboration with the School of Engineering at UNM. The group dance of sixteen high school students arranged in a grid pattern was performed on the footbridge. Figure 3 shows the plan view of the bridge with sixteen dancers, with each dancer’s head and shoulders shown from above facing east. The two sensors collected data only from the dancers on each of the spans. Sensor 1 captured acceleration data from just two dancers on span 1, and sensor 2 captured acceleration data from four dancers on span 2 (Figure 3). Data from sensor 1 was minimally affected by dancers near sensor 2 and vice versa. The deck wooden planks are not connected longitudinally except for the external beams where they rest, which are resting on the piles, so the dance activity was individually sensed by the mode shape of that bridge span. To effectively measure the dance activity of each bridge span, sensors were located at the midpoint, while the dancers were located between the sensor and the supports (Maharjan et al., 2019). The data from sensors 1 and 2 were collected asynchronously and were post-processed to capture the quality of each of the four dances separately.
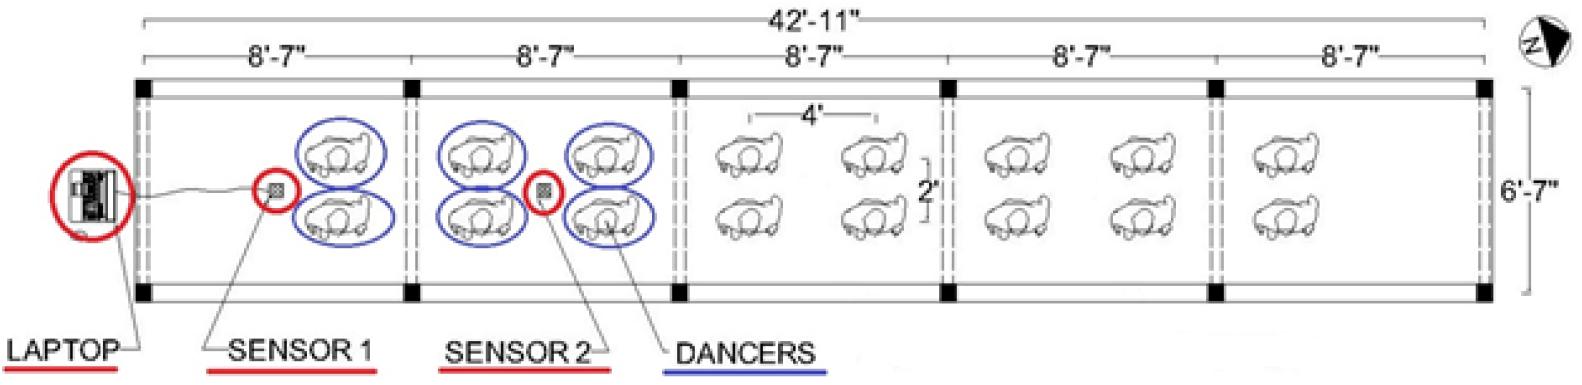
Figure 3. Footbridge plan view arrangement of dancers and sensors (dancers an shoulders of dancers are facing east from above).
Data Collection
Researchers collected the data from the sensors using two laptops. The Arduino IDE software was used as an interface to record and save the acceleration data. Two video cameras recorded the dances during the experiment. The first camera facing the northern side captured the side view of the dancers. The second camera facing the western side captured the front view of the dancers. The video clips from these two cameras were used to generate the Visual Index, which considers the synchronization of steps among group dancers as the main deciding factor to quantify the quality of each dance.
Dance Experiments
The participants in the experiments were given a short demonstration from an instructor before the start of each dance. Dancers performed after they learned the dance from the instructor. Participants were asked to perform each dance step four consecutive times, following the instructor’s tempo who was simultaneously performing in front of the participants. The dance type was a repetition of eight consecutive coordinated hops (or jumps) with equal intensity and frequency. This same dance was repeated a total of four times. The four dances are labeled A, B, C, and D, ordered in sequence of occurrence (i.e., A is the first dance trial and D is the fourth trial dance).
Dancers did not move from their location during the experiment. A designated area on the bridge was marked by white square boxes where each dancer could perform. This was done to maintain the locations of the dancers equidistant from the sensor location. Figure 4 shows the relative location of sensor 1 and sensor 2 during the dance experiment.
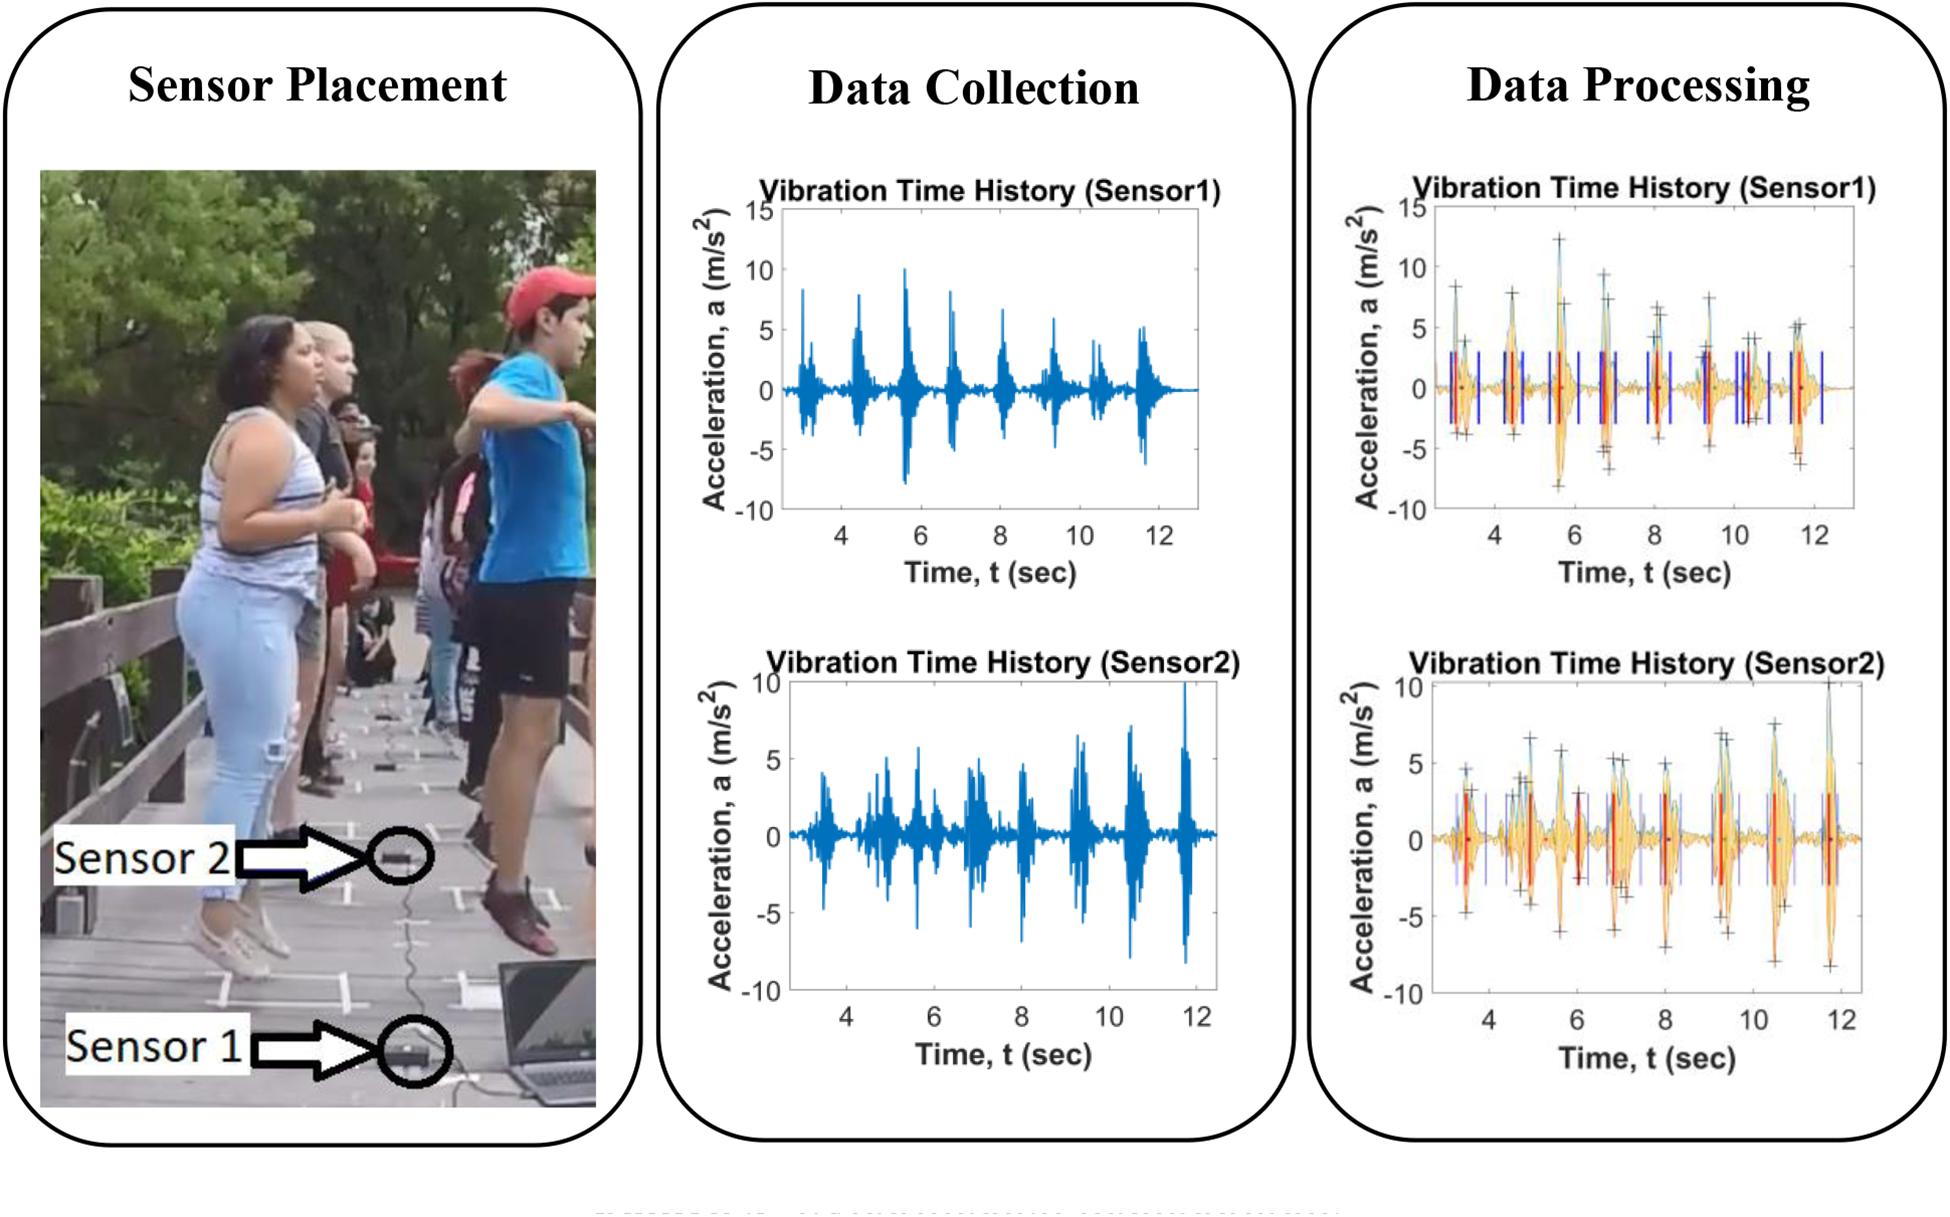
Figure 4. Experimental methodology.
The sixteen dancers were purposely given limited direction for their first dance (A), so they could have some mistakes in their first trial. After dance A was completed, the instructor encouraged the students to increase their attention and coordination so the experiment could be more successful. For the dances, B, C, and D the high schoolers paid attention and collaborated to try to enhance their coordination between experiments A (first dance) and D (forth dance).
For the four dances and the two sensors, data was recorded in four different files. After each dance, the acceleration data were saved in a unique file. For this experiment, only the vertical acceleration was used for post-processing. Researchers observed that dancers prefer to relate their dance performance with simple analytical information capturing coordination.
Analysis
Researchers quantified the dance quality using two indexes obtained from data post-processing from the sensors: Harmony and Coordination Index. Researchers compared the two quantitative indexes with the qualitative ranking from the Visual Index. The Visual Index was obtained using an expert’s rating based on their observation of the dance. The main objective of having two objective indexes was to check if data post-processing using low-cost sensors (Harmony and Coordination Index) can rank four different types of dance with the same level of success as an expert judge (Visual Index). The two indexes from datasets were computed automatically and the Visual Index was computed with human intervention. The following sections explain the calculation of the three indexes.
Harmony Index
The Harmony Index captures the standard deviation in harmony by each dancer relative to the mean dance, assuming there is an expected harmony. When the timing of two dancers jumping match, peaks tend to be near each other. This results in a low standard deviation and a low Harmony Index. For this experiment, a low value of Harmony Index implies a dance of high quality.
The Harmony Index captures the synchronization between different dancers in terms of the separation of acceleration data. The development of the Harmony Index follows the assumption that a dance with greater harmony between dancers is less spread out between acceleration peak values. Multiple acceleration peaks are observed when the sensor captures vibration from various dancers at different instances in time. When the dancers are synchronized, the acceleration peaks (when their heels or toes hit the deck) are less spread in time, resulting in low standard deviation. Researchers calculated the average standard deviation from all the dance steps of each dance type. The lower values imply a dance of higher quality.
Harmony Index Calculation
This section outlines how the Harmony Index was calculated. Figure 5 shows the rules to select peaks from each dance step. It was necessary to determine the start and end of a dance step by determining a threshold of acceleration data that counts for dancing activity. Since each step is discrete and the data is continuous, when the response falls to sensor noise floor it means that the dancers are not exciting the bridge, so ‘events’ are separated in various set of footfalls from dancers on a span. Both a high and a low envelope were generated by mapping peak acceleration values in the positive and the negative Y-axis, respectively. For each time step, researchers calculated the difference between high and low envelope values. If the difference between these values is less than 8% of the average of peak values, then both the start and the end location of the dance are determined. After the discrete peaks are selected from within each dance step, the distance between successive peaks is noted within that step.
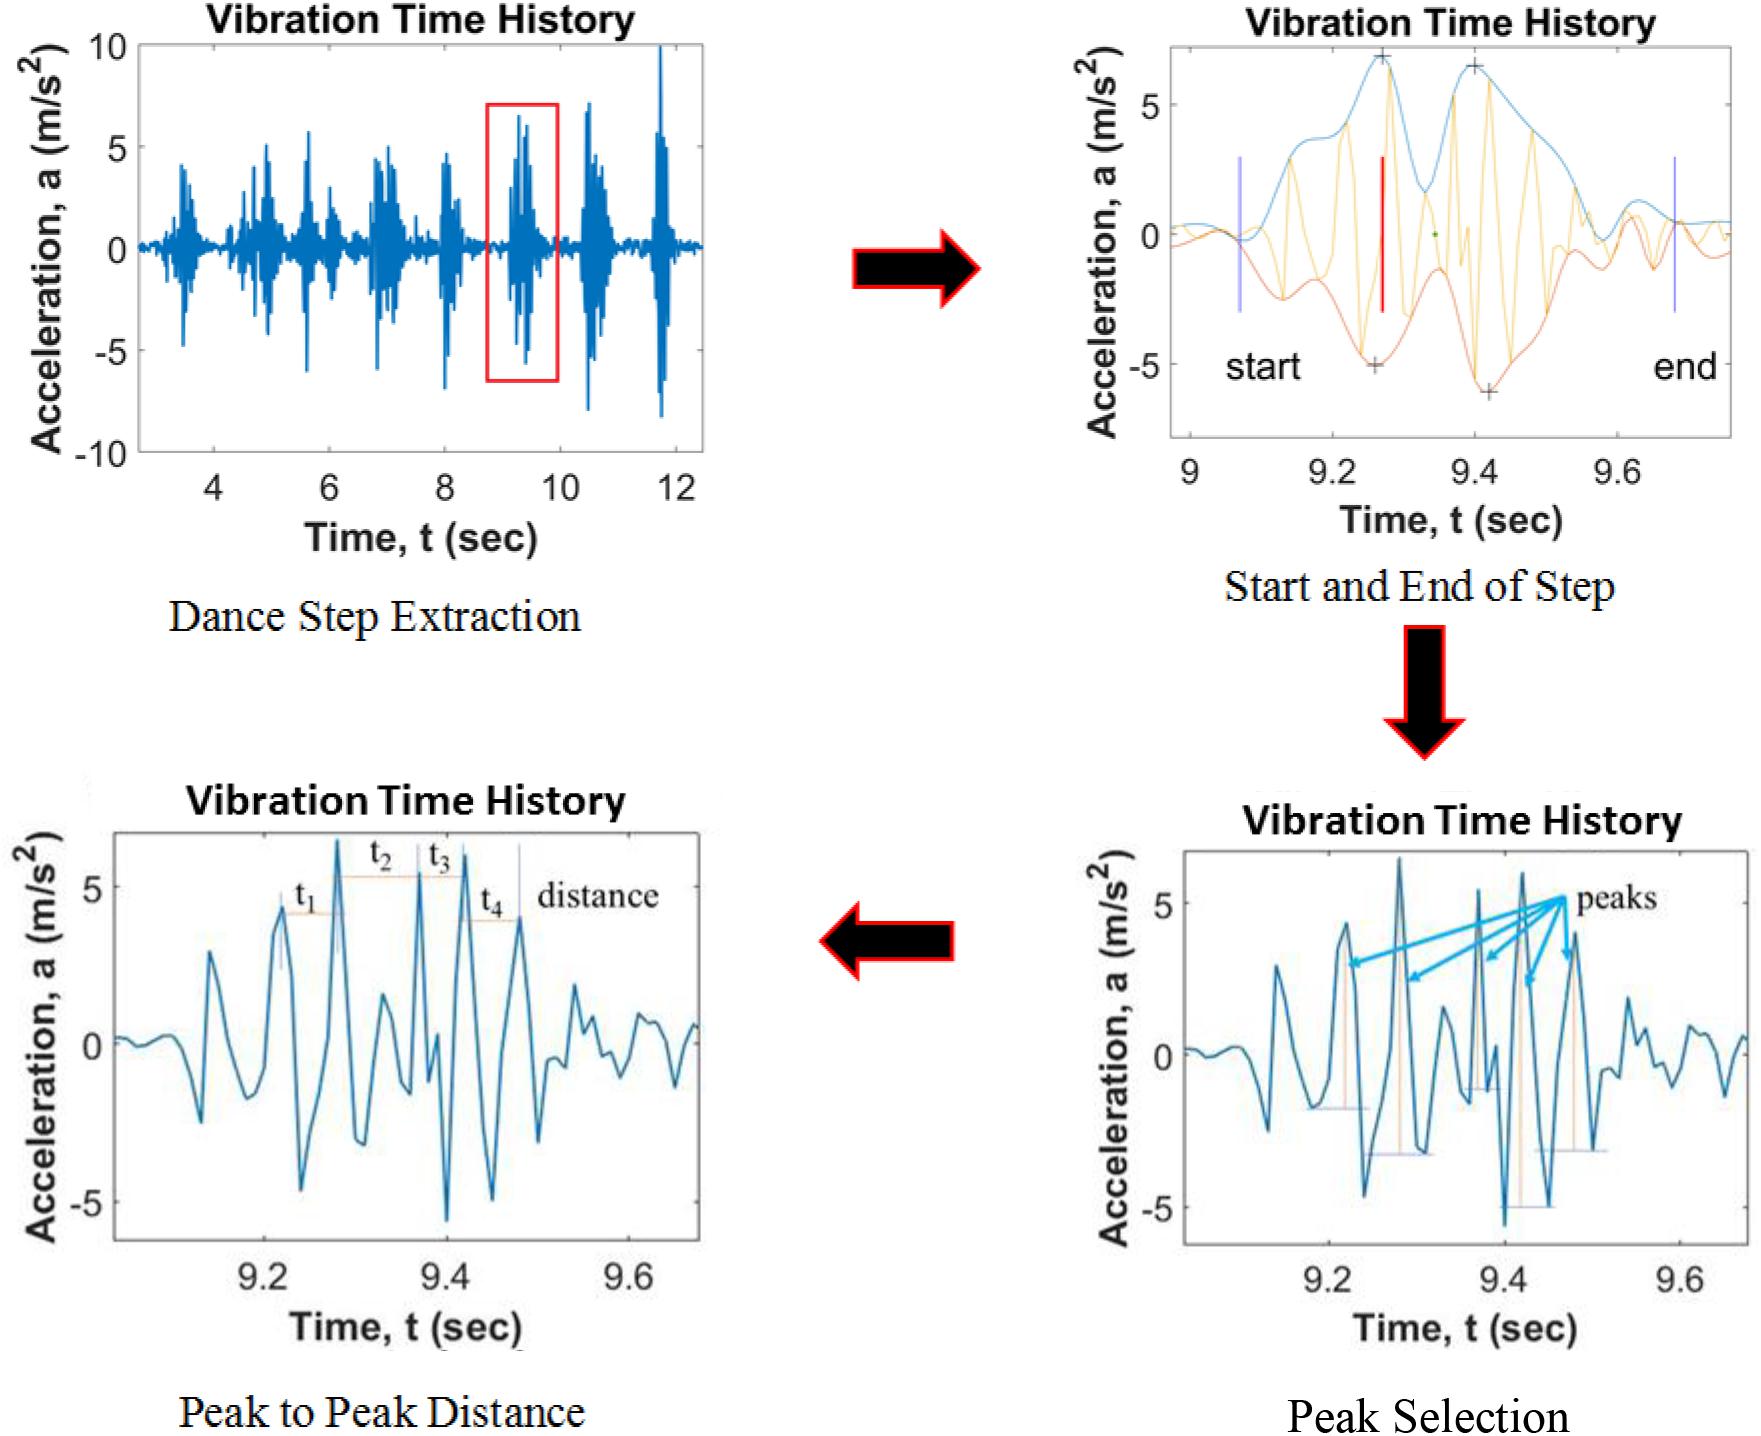
Figure 5. Harmony Index flowchart.
Considering X to be the vector representing the distance between successive peak, and Std to be the standard deviation of X in a dance step, then
where n is the peaks in a dance step, and
then the mean standard deviation for N steps in a dance is the Harmony Index, given by:
Coordination Index
The Coordination Index captures the lack of symmetry of the vibrations of one dance jump. It compares the temporal separation between the highest peak acceleration and the centroid of all the accelerations for each dance step. Lack of coordination between dancers results in a vibration response with multiple local peaks, and a large centroid offset with the highest peak of acceleration. On the contrary, one good dance step results in less separation between the highest acceleration peak and the centroid of acceleration peaks within that step. A low value on the Coordination Index corresponds to a dance of high quality. The next section explains the algorithm that measures the coordination of dancers for each sensor.
Coordination Index Calculation
This index captures how much the acceleration data is spread out relative to the highest peak of acceleration from the centroid, and it is called centroid offset. A coordinated dance step is one whose centroid offset is a small value, as much of the area is concentrated near the mean value. However, a group of dancers lacking coordination (or symmetry) results in a larger deviation generating a large centroid offset.
The linear distance between the centroid of the region and the location of the highest peak was computed to quantify the relative lack of symmetry of the dance jump. For example, a perfectly symmetric dance jump Coordination Index would be zero, as the highest peak would be at the centroid of that dance step.
As shown in Figure 6, the procedure to obtain peak values was the same as the previous section. After the start and endpoints for the dance vibration are determined, areas bounded by the high and low envelopes are computed using the trapezoidal area calculation. The distance between the area centroid and the location of the maximum peak is computed. This is termed “centroid offset.” For each dance step, one centroid step is computed. For each dance, the Coordination Index is computed as the mean of the centroid offsets.
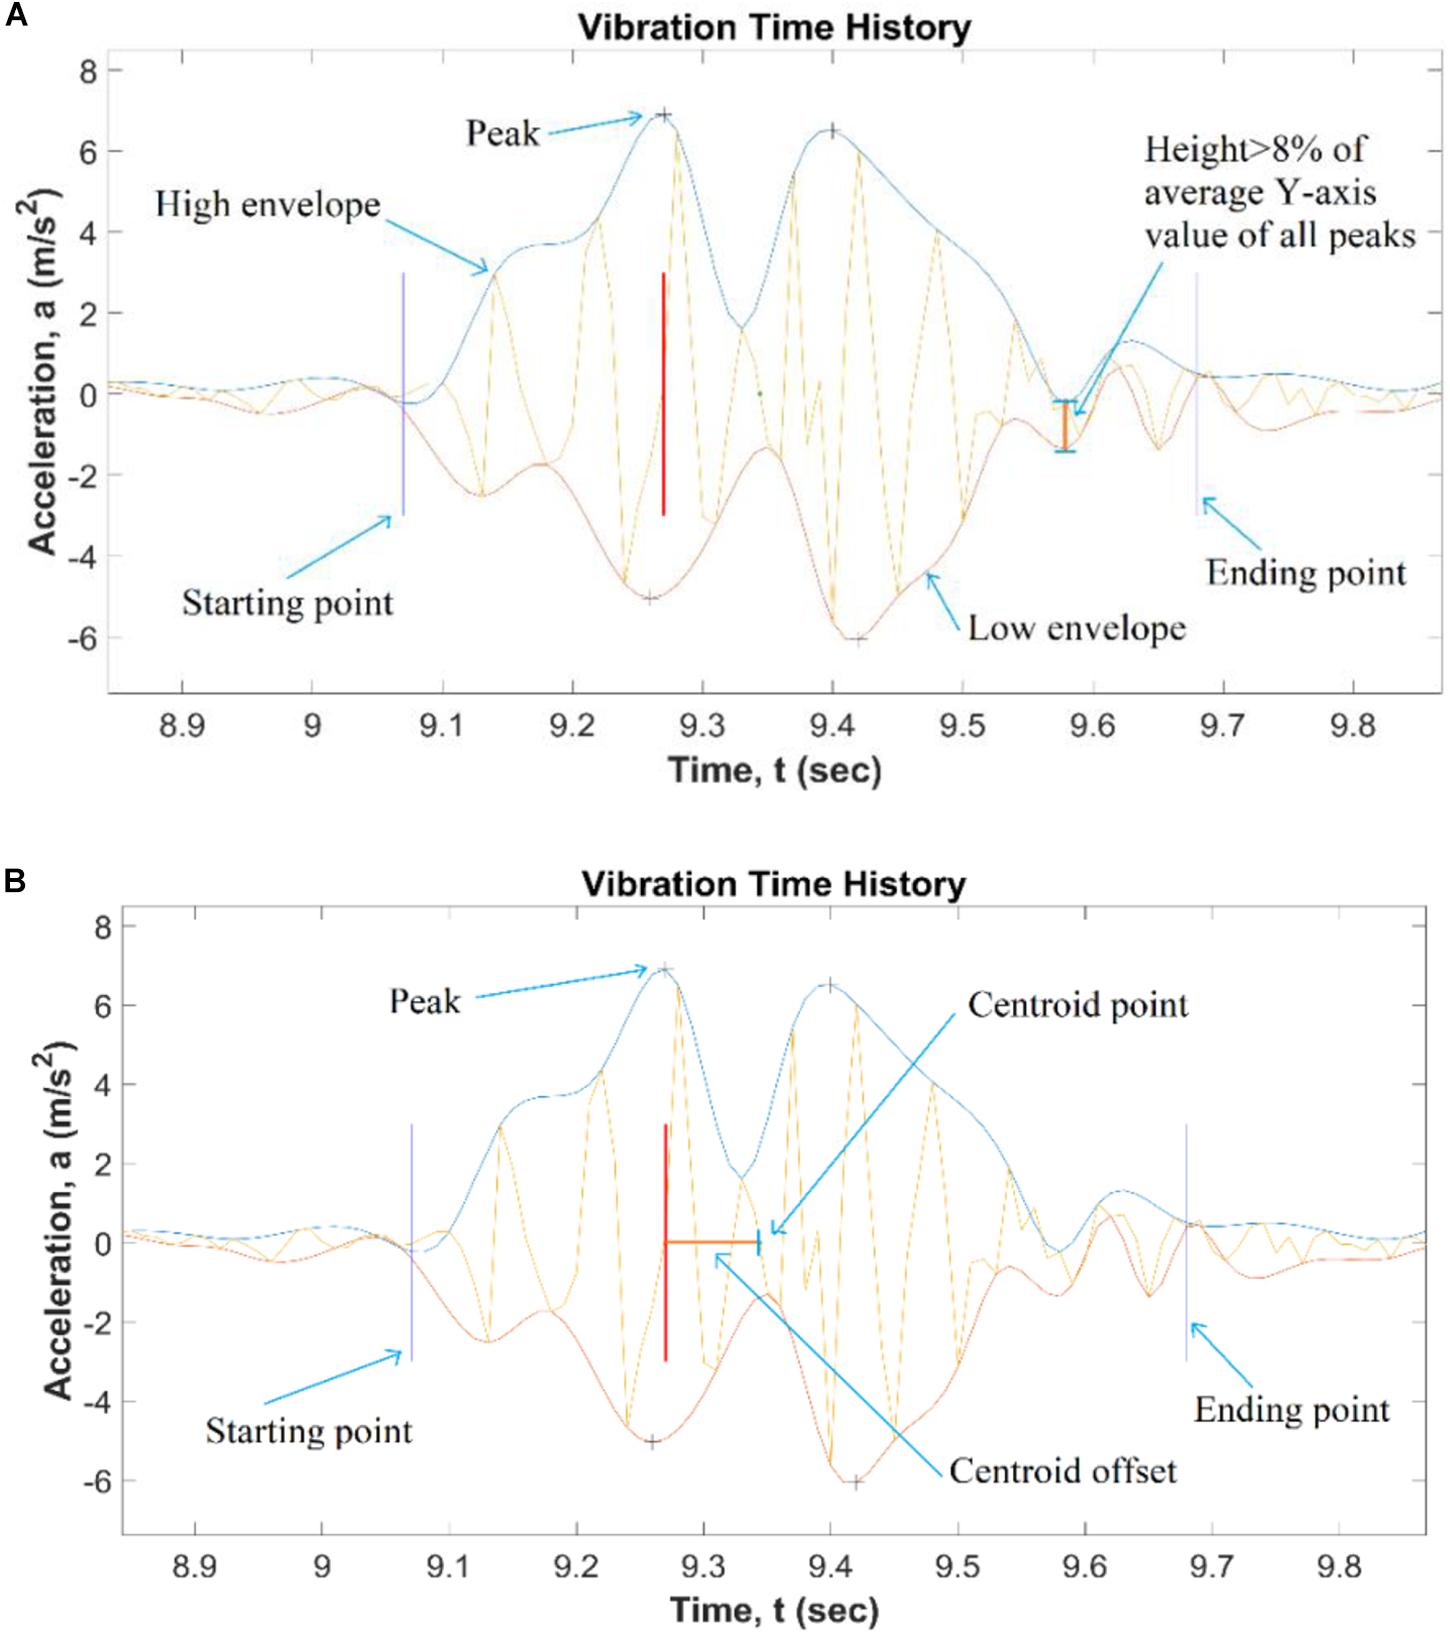
Figure 6. Coordination Index determination for one dance step: (A) starting point and Ending point; (B) centroid offset.
Consider there are n dance steps in a dance type, let Y represent the centroid offset for each dance step
Visual Index
The Visual Index quantifies the dance quality based on an expert judge’s observation. In this research, the ground truth is assumed to be the judgment of the expert dancer observing the video at slow-motion. Judges ranked the four dances in terms of synchronization.
Visual Index Calculation
The experts were asked to rate eight video clips in total: four clips from sensor 1 and four clips from sensor 2, for each of the four dances A, B, C, and D. Their rating is based on the ratio of unsynchronized steps to total steps in a dance. Each dance would get a rating that has a value between 0 and 1. 0 means that all steps are synchronized (no bad steps), whereas 1 means that no steps are synchronized. Low values imply a dance of higher quality.
Each video corresponds to the four dances A, B, C, and D for each sensor (8 total). A high-quality dance step is synchronized in the video images. The researchers asked for two possible scores from the judge while looking at the video: consistent (coordinated) and inconsistent (uncoordinated) dancing (Figure 7). When the dance is asynchronous or uncoordinated, the acceleration data is spread out between multiple peaks. When the steps are synchronous or coordinated, a clear single acceleration peak is followed by an exponential decay of acceleration signal.
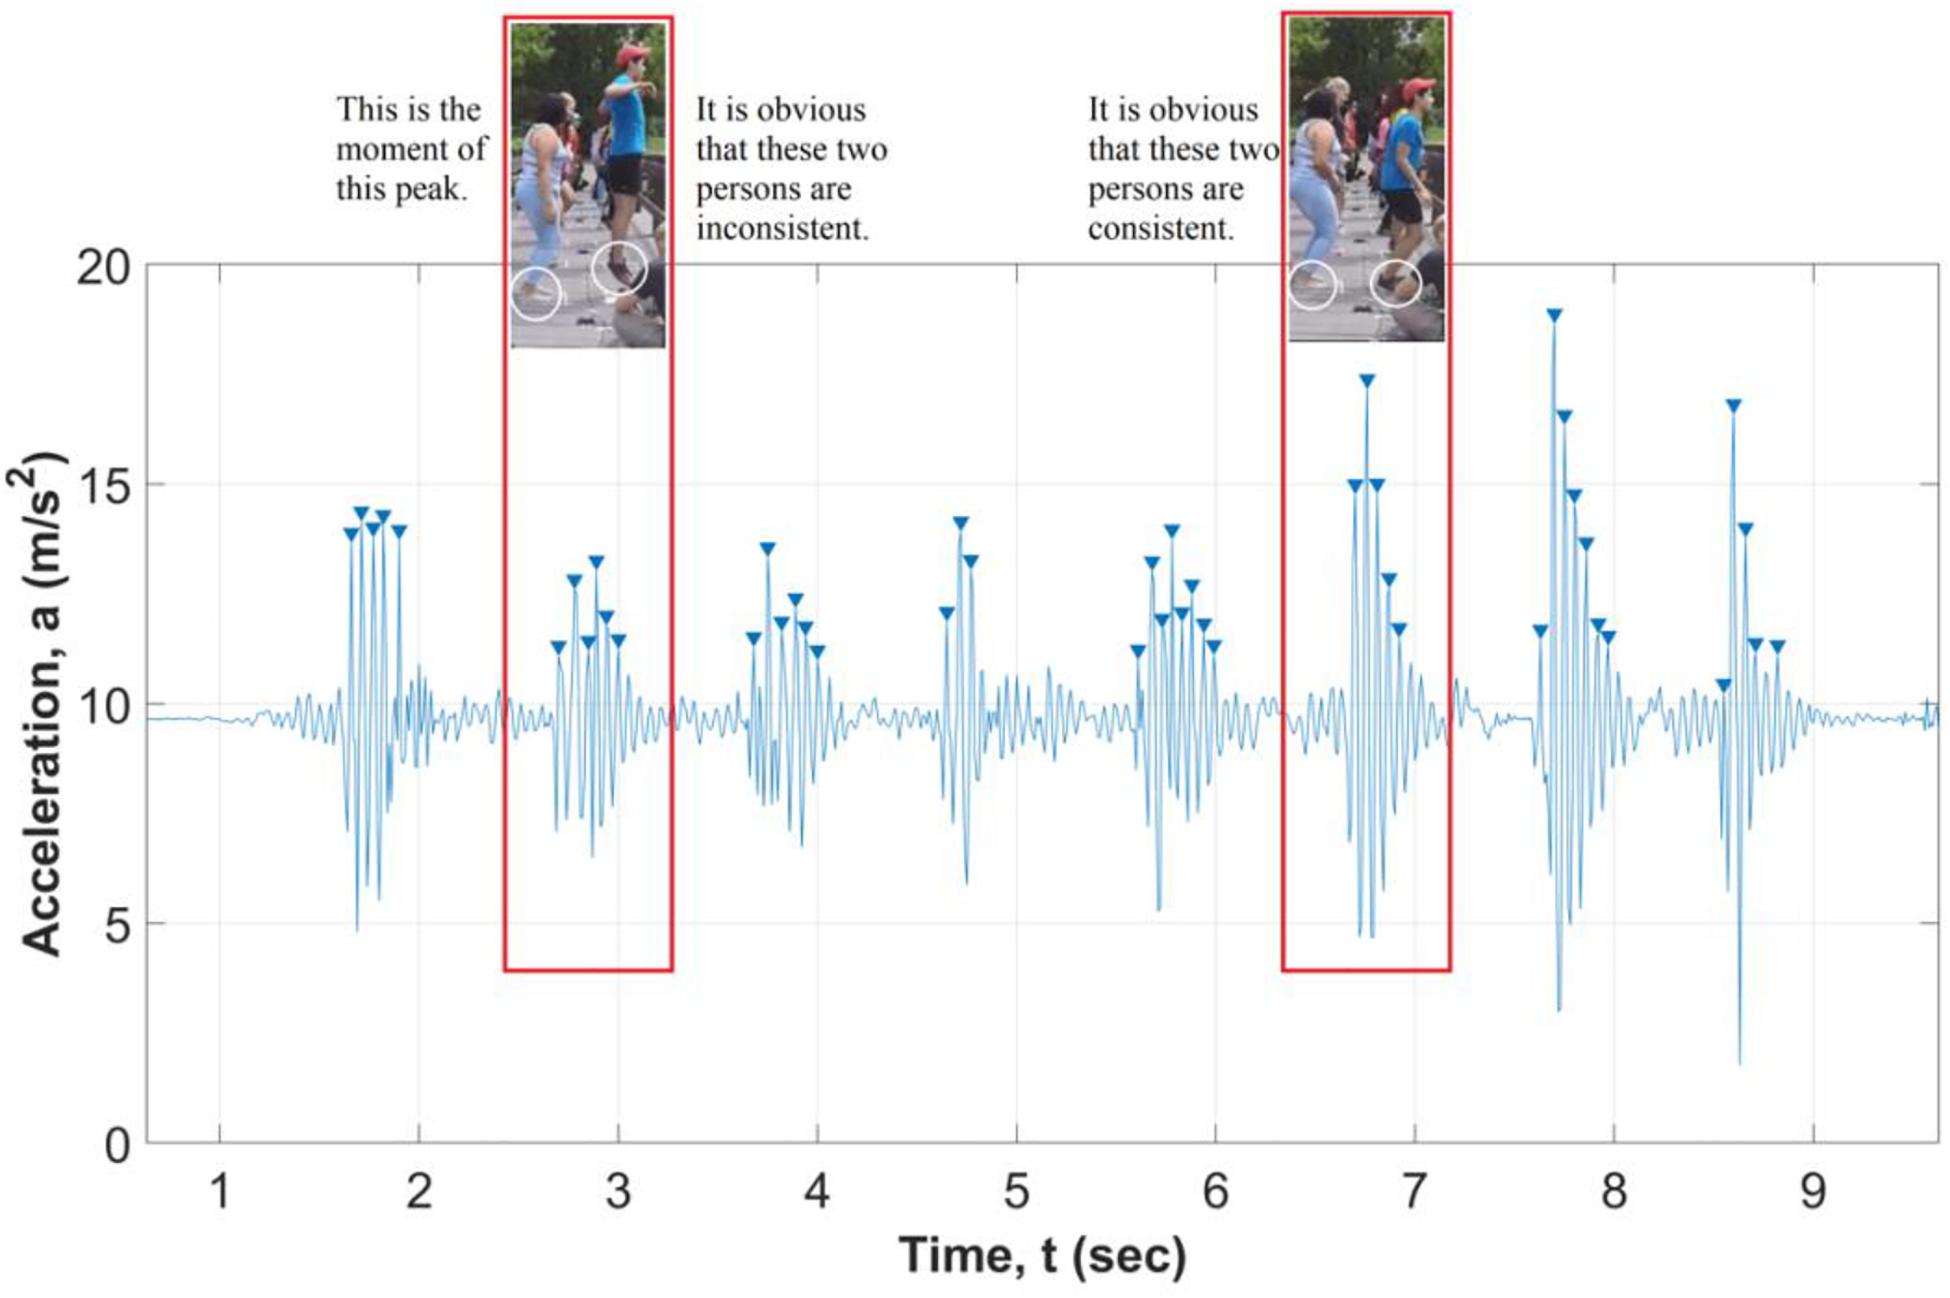
Figure 7. Comparison between video images and sensor captured data.
Results
This research presents results from a new approach that quantifies group dance coordination using sensors and validates it with dancing observations (Visual Index). Unlike a solo dancer performing, a group dance requires coordination between the dancers. Each dancer in a group needs to follow the tempo of the group itself. When some dancers lag behind the group, it is observed that they try to catch up with the group in subsequent trials. This phenomenon is captured by sensors in terms of asynchronous multiple peaks. The following two sections discuss the analysis of the three indexes and their ability to sort the quality of dance moves. The main objective of this study is to check if data post-processing using low-cost sensors (Harmony and Coordination Index) can rank four trials of dance with the same level of success as an expert judge (Visual Index). To compare the relative quality of the three dances using three different indexes, the results are normalized for each of them and ranked from lower (best dance) to higher (worst dance).
Analysis of Indexes
Table 1 summarizes the three indexes for sensors 1 and 2. The first column of Table 1 corresponds to the four trials of dance in order of occurrence: A, B, C, and D. The second, third, and fourth columns include the actual data computed from the algorithm without normalization. The last three columns list the normalized data. For each index, the data is normalized based on the worst dance. The worst dance gets a normalized value equal to 1, and all other data in that index is divided by this highest value. The worst dance from sensor 1 data is Dance A. This is confirmed by all three indexes as seen in the first row of the table. Similarly, the worst dance from sensor 2 data is Dance B. This is also confirmed by all three indexes as shown in the 6th row of Table 1. The fact that in both cases (sensor 1 and sensor 2), the worst dances (A and B, respectively) are unanimously found by the three Indexes indicates that the proposed approach can successfully sort the quality of dance moves. It is worthwhile to note that the data collected from sensor 1 was generated by two dancers while data collected from sensor 2 was generated by four dancers.
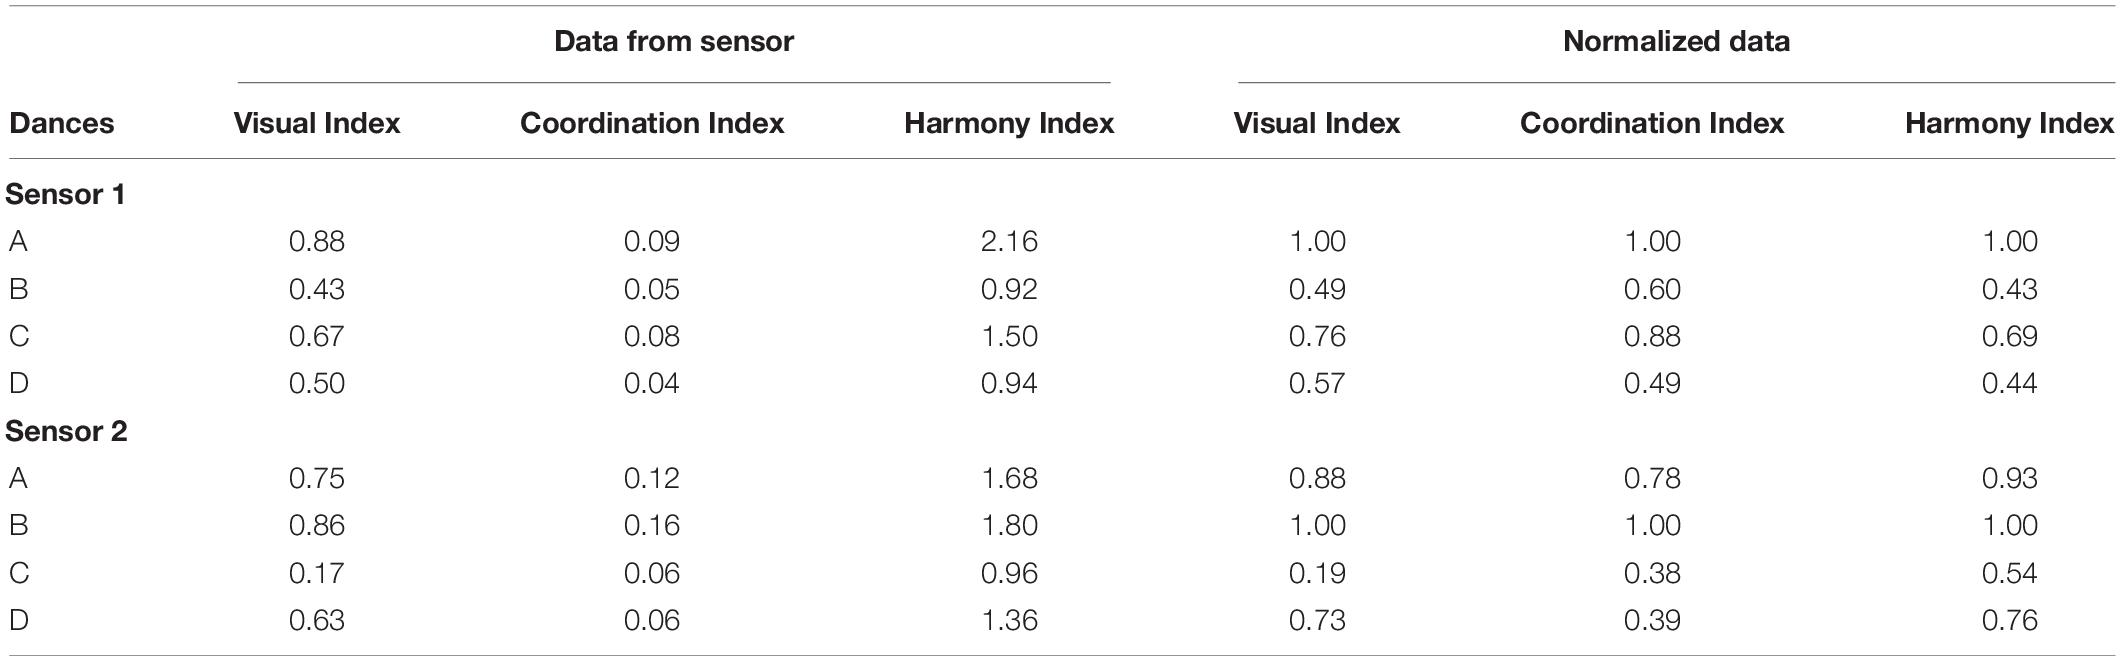
Table 1. Harmony Index, Coordination Index, and Visual Index from sensor 1 and sensor 2.
Sensing of Dance Quality
Figures 8, 9 summarize the scoring of all the dances using the three indexes. The dances are ordered in terms of dance quality. High values of Harmony and Coordination Index are associated with a dance of low quality. Figure 8 shows that both Harmony and Coordination Index are higher in Dance A and C compared to Dance B and D. Figure 9 shows that both Harmony and Coordination Index are higher in Dance A and B compared to Dance C and D. These results match the Visual Index for both sensor 1 and sensor 2, also included in both figures. For both sensors, the indexes of Harmony and Coordination (objective data) match that of visual observations (qualitative data).
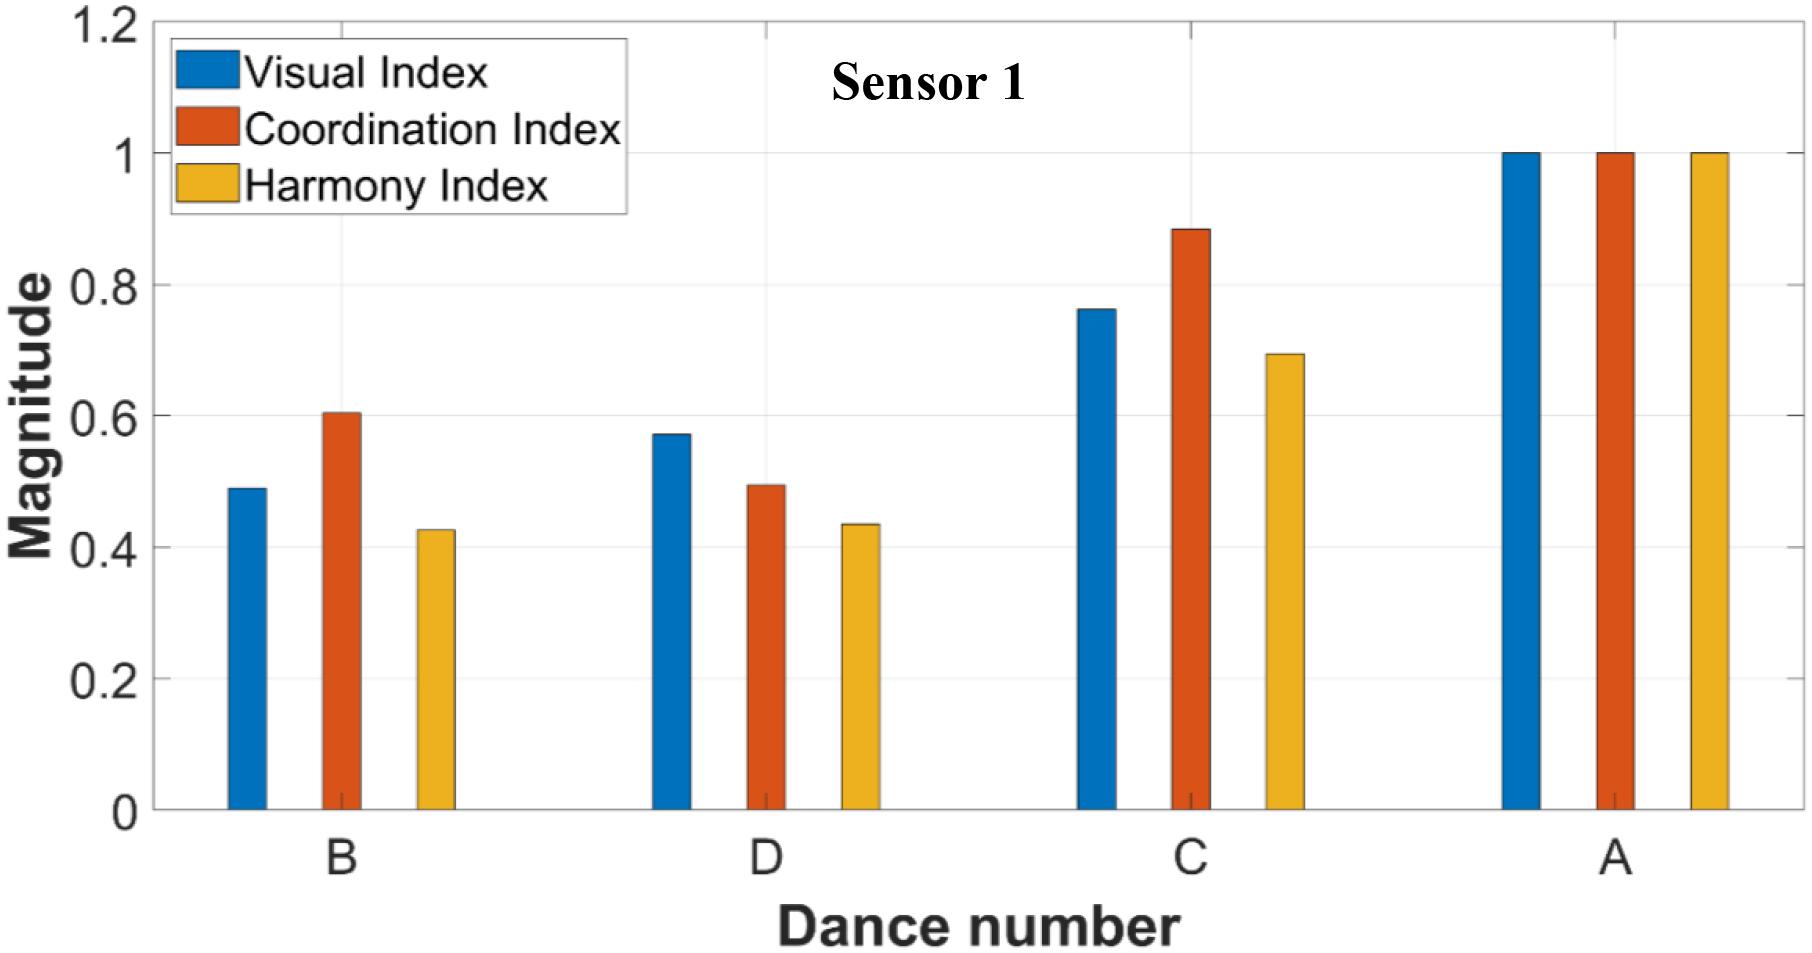
Figure 8. Visual Index, Coordination Index, and Harmony Index generated from sensor 1.
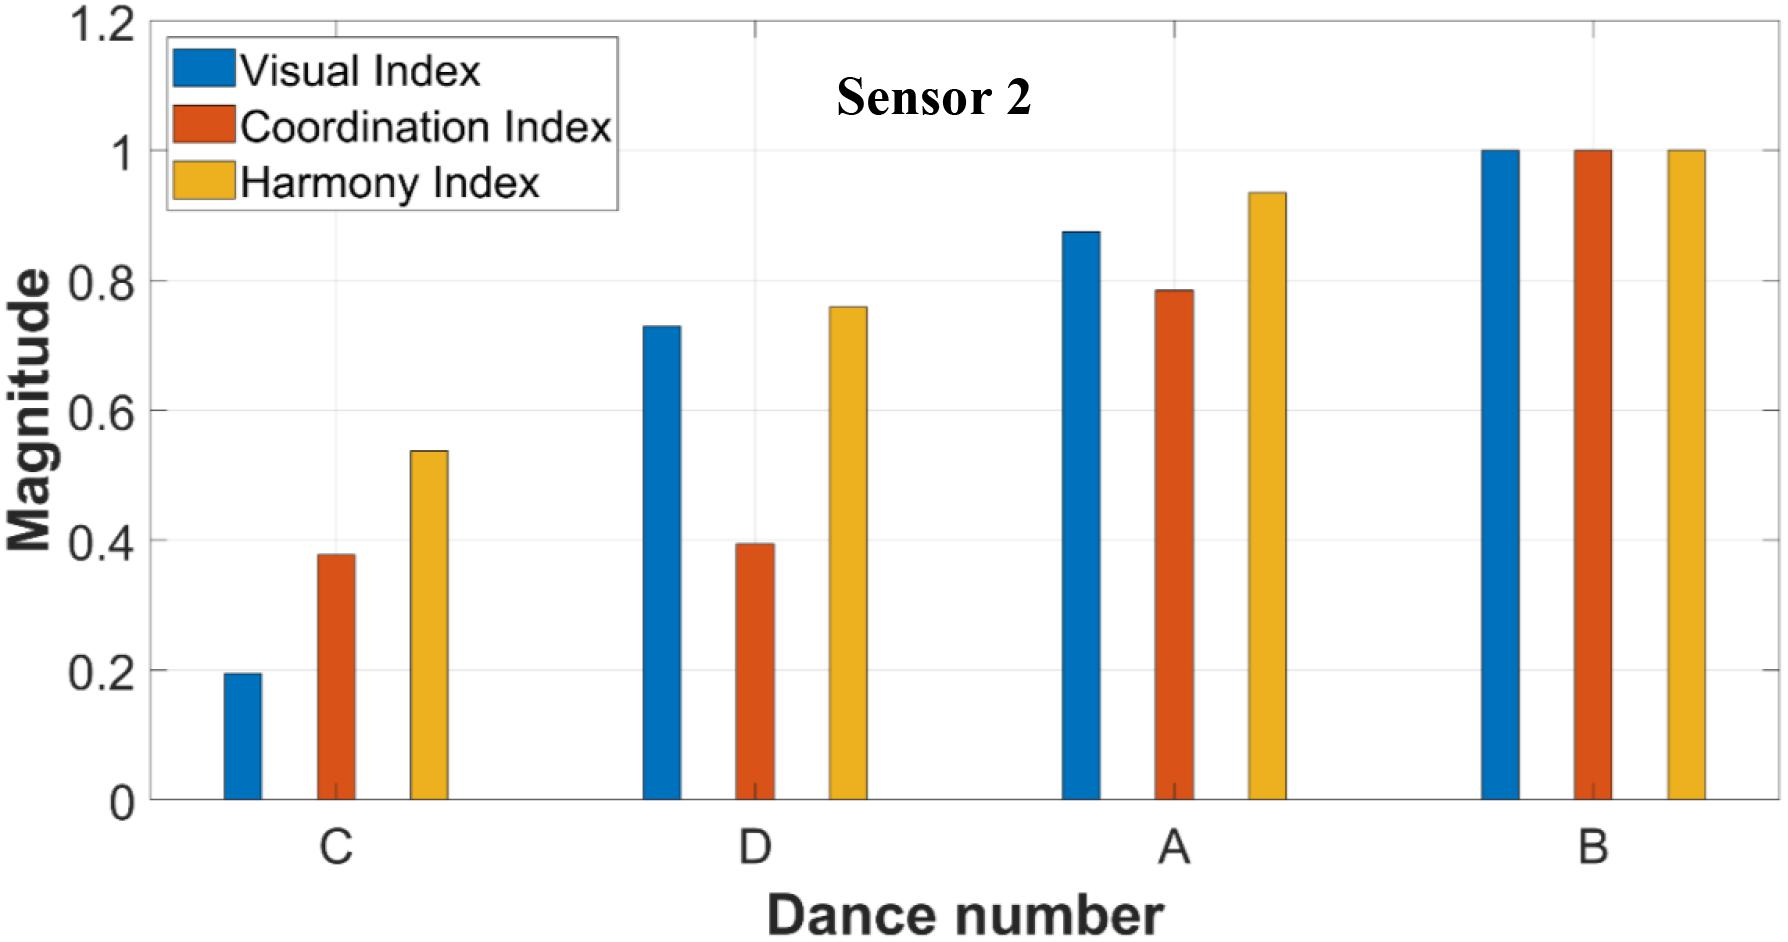
Figure 9. Visual Index, Coordination Index, and Harmony Index generated from sensor 2.
The only exception found in this experiment is the Coordination Index of Dance B and D from sensor 1 (Figure 8), with an error of 11% between the normalized index. In all other sensors and indexes, there is a clear classification of dance quality that matches the Visual Index. The two sensors classified the quality of the dances differently. More specifically, the qualitative order of dances from best dance to worst dance are B, D, C and A for sensor 1; and C, D, A, and B for sensor 2.
It is important to note that sensor 1 and sensor 2 capture the acceleration data of two different dance groups in the experiment (Figures 8, 9, respectively). Each dance group performed differently based on their collective ability to follow the tempo of the lead dancer and their internal harmony and coordination skills. Sensor 1 and sensor 2 collect vibrations from a different number of dancers (two and four dancers, respectively). If the two values from both the harmony and coordination indexes are averaged for each dance, the results from both Figure 8 (sensor 1) and Figure 9 (sensor 2) show a clear correlation between the two calculated indexes and the Visual Index (ground truth). Comparing results from sensor 1 and sensor 2, the match between calculations and observations are better when the number of dancers is higher. When the two calculated indexes’ trends match the Visual Index trend the algorithm effectively captures the decision of the judge. In the case of sensor 1, where only two dancers influenced the vibration, the data shows that the indexes are less distinct in capturing the Visual Index (ground truth). It can also be inferred that the Visual Index may pose a bigger bias when looking to two dancers as opposed to looking to four dancers, as there are fewer data points to penalize or to credit synchronization and other factors as noise or inaccuracy in the judge viewing the video.
The shortcoming of this simplified interface between human decisions and bridge vibrations is mostly due to the small number of dancers for sensor 1, only two, as opposed to the better estimation of indexes for sensor 2. The shortcoming of having a limited number of dancers to judge their coordination can be addressed in future dance experiments by adding more sensors to qualify their dance automatically.
Conclusion
Researchers explored the use of low-cost sensors to rank dance quality using two indexes that quantify coordination between dancers using accelerations. The research compares the indexes of coordination with visual observations. Researchers collected data using low-cost sensors that were built by high school students with no previous experience in sensing technologies or structural engineering. Four trials of dances were studied and compared using two sensors for two different groups of dancers, and each dance trial was classified attending to three different indexes. Two indexes, named Harmony Index and Coordination Index, ranked dance coordination and were obtained using the vibrations collected from sensors placed on the bridge. These two indexes were used to rank the quality of the dances based on mathematical treatment of the signals collected using the low-cost sensors. The third index, named Visual Index, was the ground truth based on experts’ observation. The results show that the two indexes rank the dance coordination for both groups of dancers in a sequence similar to that of the Visual Index (ground truth). The two indexes matched more accurately the dance quality from the group with more dancers, given the larger amount of distribution collected by the sensor. In general, the two sensors are able to sort the quality of the dances effectively and with the same ranks. This method can be employed cost-effectively by any non-technical person with the help of simple instructions to use the LEWIS sensors. The results and methods explained in this paper can be expanded to the area of HSI for the design and assessment of structural systems used for dancing, such as performance halls and ballrooms.
Data Availability Statement
The datasets generated for this study are available on request to the corresponding author.
Ethics Statement
The UNM Office of Research and Compliance and UNM Office of the Institutional Review waived the need for IRB approval for this research. Ethical consent was considered before the experiment and the authors and researchers were following regulations. The students and their parents agreed for images of them participating in the research presented in this manuscript. All of the students and their parents completed and signed a written consent form allowing for photographs of them participating in the summer program in which this study was conducted.
Author Contributions
FM designed the research and the experiments, directed the experiments, coordinated funds, field work, data acquisition, writing of preliminary results, discussions with dancers, coordination with dancers, presented preliminary results, analysis of new results, data analysis, data interpretation, results, and conclusions, writing of the document, review of the document. DM coordinated the experiments and field work, coordinated the data acquisition, writing of preliminary results, analysis of new results, data analysis, data interpretation, results, and conclusions, writing of the document, review of the document. CZ collected data in the field work, analyzed the data, wrote preliminary results, presented preliminary results, run analysis of new results, conducted new data analysis, data interpretation, results, and conclusions, writing of the document, review of the document. EW assisted the experiment and field work, assisted data acquisition, assisted writing of preliminary results, presented preliminary results, conducted preliminary analysis of results, interpreted results, and conclusions, assisted in the writing of the document and the review of the document.
Funding
The authors acknowledge the support from TRANSET (Project IDs: 17STUNM02 and 18STUNM03, Grant No. 69A3551747106) and 2017 Yangzhou University International Academic Exchange Fund for providing financial support to graduate students to conduct this research. The authors are also grateful for the UNITE Summer Program, 2018 for allowing high school students to participate in this research and partially supporting the second author of this manuscript.
Conflict of Interest
The authors declare that the research was conducted in the absence of any commercial or financial relationships that could be construed as a potential conflict of interest.
References
ASCE (2013). Minimum Design Loads for Buildings and Other Structures (ASCE/SEI 7–10). Reston, VA: ASCE.
Bocian, M., Brownjohn, J. M. W., Racic, V., Hester, D., Quattrone, A., and Monnickendam, R. (2016). A framework for experimental determination of localised vertical pedestrian forces on full-scale structures using wireless attitude and heading reference systems. J. Sound Vibration 376, 217–243. doi: 10.1016/j.jsv.2016.05.010
Dania, A., Hatziharistos, D., Koutsouba, M., and Tyrovola, V. (2011). The use of technology in movement and dance education: recent practices and future perspectives. Proced. Soc. Behavi. Sci. 15, 3355–3361. doi: 10.1016/j.sbspro.2011.04.295
Ellingwood, B., and Tallin, A. (1984). Structural serviceability: floor vibrations. J. Struc. Eng. 110, 401–418. doi: 10.1061/(ASCE)0733-94451984110:2(401)
Ellis, B. R., Ji, T., and Bre. (1997). Human-structure interaction in vertical vibrations. Proc. Inst. Civil Eng.-Struct. Build. 122, 1–9. doi: 10.1680/istbu.1997.29162
Fuhr, P. L., Huston, D. R., Kajenski, P. J., and Ambrose, T. P. (1992). Performance and health monitoring of the stafford medical building using embedded sensors. Iopscience.Iop.Org 1, 63–68. doi: 10.1088/0964-1726/1/1/009/pdf
Gheitasi, A., Ozbulut, O. E., Usmani, S., Alipour, M., and Harris, D. K. (2016). Experimental and analytical vibration serviceability assessment of an in-service footbridge. Case Stud. Nondestruct.Test. Eval. 6, 79–88. doi: 10.1016/j.csndt.2016.11.001
Gomez, J. A., Ozdagli, A. I., and Moreu, F. (2017). Reference-free dynamic displacements of railroad bridges using low-cost sensors. J. Intell. Mater. Syst. Struct. 1–15. doi: 10.1177/1045389X17721375
Großhauser, T., Bläsing, B., Spieth, C., and Hermann, T. (2012). Wearable sensor-based real-time sonification of motion and foot pressure in dance teaching and training. J. Audio Eng. Soc. 60, 580–589.
International building code [IBC] (2009). International Code Council, Inc. Boca Raton, FL: ICBO and SBCCI. 4051, 60478–5795. International building code 2009.
Ji, T., Ellis, B. R., Ji, T., and Eng, C. (1997). Human-structure interaction in vertical vibrations Elasticity of structures using analytical, semi-analytical and numerical methods View project Human-structure interaction in vertical vibrations. Struct. Build. 122, 1–9. doi: 10.1680/istbu.1997.29162
Kerr, S. C., and Bishop, N. W. M. (2001). Human Induced Loading on Flexible Staircases. Engineering Structures, Vol. 23. Available online at: www.elsevier.com/locate/engstruct (accessed April 23, 2019).
Kim, Y., Baek, S., and Bae, B. C. (2017). Motion capture of the human body using multiple depth sensors. Etri J. 39, 181–190. doi: 10.4218/etrij.17.2816.0045
Lynch, A., Majeed, B., O’flynn, B., Barton, J., Murphy, F., Delaney, K., et al. (2005). A wireless inertial measurement system (WIMS) for an interactive dance environment. J. Phys.: Conf. Ser. doi: 10.1088/1742-6596/15/1/016
Maharjan, D., Wyckoff, E., Agüero, M., Martinez, S., Zhou, L., and Moreu, F. (2019). “Monitoring induced floor vibrations: dance performance and bridge engineering,” in Sensors and Smart Structures Technologies for Civil, Mechanical, and Aerospace Systems 2019, 10970, 109701E (Washington: 109701E).
Mayagoitia, R. E., Nene, A. V., and Veltink, P. H. (2002). Accelerometer and rate gyroscope measurement of kinematics: an inexpensive alternative to optical motion analysis systems. J. Biomech. 35, 537–542. doi: 10.1016/S0021-9290(01)00231-7
Moreu, F., Lippitt, C., Maharjan, D., Aguero, M., and Nasimi, R. (2018). “Development, Training, Education, and Implementation of Low-Cost Sensing Technologies for Bridge Structural Health Monitoring (SHM)”. Report, No. 17STUNM02. Albuquerque, NM: University of New Mexico.
Moreu, F., Lippitt, C., Maharjan, D., Aguero, M., and Yuan, X. (2019). “Augmented Reality Enhancing the Inspections of Transportation Infrastructure: Research, Education, and Industry Implementation”.Report, No. 18STUNM03. Hamilton, ON: McMaster University.
Ozdagli, A. I., Liu, B., and Moreu, F. (2018). Low-cost, efficient wireless intelligent sensors (LEWIS) measuring real-time reference-free dynamic displacements. Mech. Syst. Signal Process. 107, 343–356. doi: 10.1016/j.ymssp.2018.01.034
Paj, S., Journal, A., and Digital, I. S. (2017). Dance and media technologies author (s): johannes birringer published by: the MIT press on behalf of performing arts journal. Inc. Stable. 24, 84–93.
Pan, S., Bonde, A., Jing, J., Zhang, L., Zhang, P., Noh, H. Y. (2014). BOES: building occupancy estimation system using sparse ambient vibration monitoring. In Lynch, J. P., Wang, K.-W., and Sohn, H. eds 9061, p. 90611O) Washington: International Society for Optics and Photonics.
Pan, S., Wang, N., Qian, Y., Velibeyoglu, I., Noh, H. Y., and Zhang, P. (2015). “Indoor Person Identification through Footstep Induced Structural Vibration,” in Proceedings of the 16th International Workshop on Mobile Computing Systems and Applications, Santa Fe,, 2015–2978.
Paradiso, J. A., and Sparacino, F. (1997). Optical Tracking for Music and Dance Performance. Available online at: http://www.cba.mit.edu/docs/papers/97.09.Zurich_3D4.pdf (accessed April 23, 2019).
Poppe, R. (2010). A survey on vision-based human action recognition. Image Vis. Compu. 28, 976–990. doi: 10.1016/J.IMAVIS.2009.11.014
Poston, J. D., Schloemann, J., Buehrer, R. M., Malladi, V. V. N. S., Woolard, A. G., and Tarazaga, P. A. (2015). “Towards indoor localization of pedestrians via smart building vibration sensing,” in 2015 International Conference on Location and GNSS (ICL-GNSS), Piscataway, NJ, IEEE, 1–6.
Reynolds, P. (2014). Vibration Serviceability of Long-Span Concrete Building Floors. Part 1: Review of Background Information. Available online at: https://www.researchgate.net/publication/228552565 (accessed April 23, 2019).
Shahabpoor, E., Pavic, A., Racic, V., and Zivanovic, S. (2016). Effect of group walking traffic on dynamic properties of pedestrian structures Journal of Sound and Vibration. J. Sound Vibration 387, 207–225. doi: 10.1016/j.jsv.2016.10.017
Simon, S. R. (2004). Quantification of human motion: gait analysis-benefits and limitations to its application to clinical problems. J. Biomech. 37, 1869–1880. doi: 10.1016/jjbiomech.2004.02.047
Vasilatou, V., Harrison, R., and Nikitas, N. (2017). Development of a human-structure dynamic interaction model for human sway for use in permanent grandstand design. Proced. Eng. 199, 2895–2900. doi: 10.1016/j.proeng.2017.09.585
Keywords: human–structure interaction, accelerations, human induced vibration, low-cost sensor, dance characterization, human decisions
Citation: Moreu F, Maharjan D, Zhu C and Wyckoff E (2020) Monitoring Human Induced Floor Vibrations for Quantifying Dance Moves: A Study of Human–Structure Interaction. Front. Built Environ. 6:36. doi: 10.3389/fbuil.2020.00036
Received: 08 May 2019; Accepted: 11 March 2020;
Published: 31 March 2020.
Edited by:
Branko Glisic, Princeton University, United StatesReviewed by:
James Mark William Brownjohn, University of Exeter, United KingdomJerome Lynch, University of Michigan, United States
Copyright © 2020 Moreu, Maharjan, Zhu and Wyckoff. This is an open-access article distributed under the terms of the Creative Commons Attribution License (CC BY). The use, distribution or reproduction in other forums is permitted, provided the original author(s) and the copyright owner(s) are credited and that the original publication in this journal is cited, in accordance with accepted academic practice. No use, distribution or reproduction is permitted which does not comply with these terms.
*Correspondence: Fernando Moreu, Zm1vcmV1QHVubS5lZHU=