 G. Lacanna
 M. Betti
 M. Ripepe
 G. Bartoli2
- 1Department of Earth Sciences, University of Florence, Florence, Italy
- 2Department of Civil and Environmental Engineering, University of Florence, Florence, Italy
Operational modal analysis (OMA), also known as output-only or ambient vibration test (AVT), has become in last decades a powerful approach for a wide range of applications in the field of civil engineering. When historical structures are investigated this approach is particularly appealing avoiding shaking the structure artificially. This paper discusses the assessment of the dynamic behavior of the Baptistery of San Giovanni in Firenze (Italy). Based on experimental results obtained through a temporary network of seismic sensors, the enhanced frequency domain decomposition (EFDD) technique is employed to evaluate frequencies and mode shapes. These modal parameters are subsequently used to calibrate a 3D finite element (FE) model of the Baptistery. Genetic algorithm (GA) technique is employed for calibration, thus allowing to obtain an accurate and robust numerical model. To verify the effects introduced by the number of identified modal parameters on the model updating procedure several analyses are in addition performed. This paper, providing an illustrative case study in the field of health monitoring of monumental structures, confirms that the OMA technique is able to derive effective information on the dynamic behavior of historical buildings, which in turn is useful to tune reliable and robust numerical models to be employed for structural analysis.
Introduction
Dynamic identification, coupled with appropriate tuned numerical models, is nowadays considered as a powerful and effective approach for investigating the health status of ancient buildings. Dynamic monitoring is, in fact, a non-invasive technique capable to provide unbiased information on the main frequencies and mode shapes, which are in turn directly related to structural damage (Hearn and Testa, 1991; Doebling et al., 1996; Gentile and Saisi, 2007; Saisi and Gentile, 2015). In this respect, the scientific literature reports a plethora of studies and applications that emphasize the importance of combining dynamic non-invasive experimental methodologies with proper numerical simulations for health assessment purposes of historic buildings (Pierdicca et al., 2016; Ubertini et al., 2017; Cavalagli et al., 2018).
This coupled approach become particularly significant when the historical building is located in an area characterized by high-to-moderate seismic hazard, like the case of the Baptistery of San Giovanni in Firenze (Italy). The Baptistery, a worldwide outstanding monument dating back to the XI century, has suffered several earthquakes over the centuries (up to Imax = VIII of MCS scale – ML = 5; C.P.T.I. – Catalogo Parametrico dei Terremoti Italiani1) and this paper discusses on the use of dynamic experimental measurements for the identification of a robust numerical model of this outstanding building.
According to a literature review, the overall path that constitutes the vibration-based structural assessment results composed by the following steps: (i) full-scale ambient vibration testing (AVT), usually performed in a output-only framework; (ii) modal identification from ambient vibration response through operational modal analysis (OMA) technique; (iii) parametric finite element (FE) modeling; and (iv) identification of the uncertain mechanical parameters (UMP) of the numerical model. The above procedure allows to identify reliable and robust FE models to be subsequently employed for different structural purposes. Many of the studies available in literature report on applications of AVT and OMA with multiple goals, such as damage assessment (Betti et al., 2015; Clementi et al., 2017; Alkayem et al., 2018), seismic vulnerability assessment (Bartoli et al., 2015; Erdogan, 2017), structural health assessment and monitoring (Castellazzi et al., 2012; Ramos et al., 2013; Pieraccini et al., 2017; Bassoli et al., 2018), modal updating and identification (Aoki et al., 2008; Chiorino et al., 2011; Torres et al., 2017; Girardi et al., 2019; Pavlovic et al., 2019), bell swinging effects assessment (Diaferio et al., 2017; Bru et al., 2019) and evaluation of the effectiveness of retrofitting (Pierdicca et al., 2019). While the vibration-based structural assessment is today a methodology particularly appreciated in the field of historic structures (because of its non-invasiveness and non-destructiveness) several issues still arise concerning the dynamic test setups to be adopted for each building typology.
This paper, with the aim of providing an additional illustrative case study in the field of health monitoring of monumental structures reports a procedure to be employed for structural identification which combines the use of digital seismic stations for the AVTs and genetic algorithm (GA) for the calibration of the UMP of a parametrized FE model. The modal behavior (main frequencies, mode shapes and damping) of the selected case study is identified through OMA technique by using data from a temporary network constituted by 10 seismic stations. The OMA technique, performed by using the enhanced frequency domain decomposition (EFDD) approach (Brincker et al., 2007; Rainieri and Fabbrocino, 2010; Lacanna et al., 2016), allows evaluating the first six frequencies and mode shapes and the corresponding damping of the Baptistery. To this aim, the analysis applied on the Baptistery and reported in Lacanna et al. (2016) was here extended to identify the Young moduli and the self-weight for three main structural components of the Baptistery. The assessed modal parameters are used to calibrate the UMP of a 3D FE numerical model by an optimization procedure. To minimizes the difference between experimental and numerical results a GA is employed. Being the GA a robust global optimization technique, it has been employed in the last decades by many scholars to solve a large class of minimization problems in the engineering field: from damage assessment (f.i. Mares and Surace, 1996) to structural identification (f.i. Faravelli et al., 2005). In addition, to verify the effects introduced on the model updating procedure by the number of identified modal parameters several analyses are performed varying the number of modal results employed to calibrate the numerical model.
The integration of the results of the AVT dynamic identification with 3D FE model analyses allows to gather an extensive knowledge of the dynamic behavior of the whole building and to minimize the uncertainties related to the structural parameters. The use of the seismometers for the ambient vibration recording allows to minimize the equipment needed to perform the AVT since these devices do not require any additional component for the operational conditions, while the use of GA allows to maximize the correlation between the numerical and experimental data.
The paper is organized as follows. Section “Geometry and Structure” summarizes the geometry and the structure of the Baptistery. Section “Ambient Vibration Tests” focuses on the AVT experimental campaign and the modal identification procedure adopted. Section “Numerical Modeling” reports on the numerical modeling, while section “Model Updating” discusses the model updating procedure employed. Eventually, section “Discussion of the Results” report the results discussing their sensitiveness with respect to the input data.
Geometry and Structure
According to a common interpretation the Baptistery of San Giovanni in Firenze, Italy (Figure 1), consecrated on November 6, 1059 and raised on the foundations of an existing Roman building, dates back to the XI century. From a geometrical point of view the Baptistery is a regular octagonal masonry building. The regularity of the geometry is characterized by an alternance of sides with portal and sides without portal. This plant regularity is interrupted on one side due to the presence of a rectangular apse (or scarsella). In the XIII century a large opening in the masonry wall was created, surmounted by a great arch, to add a new altar.
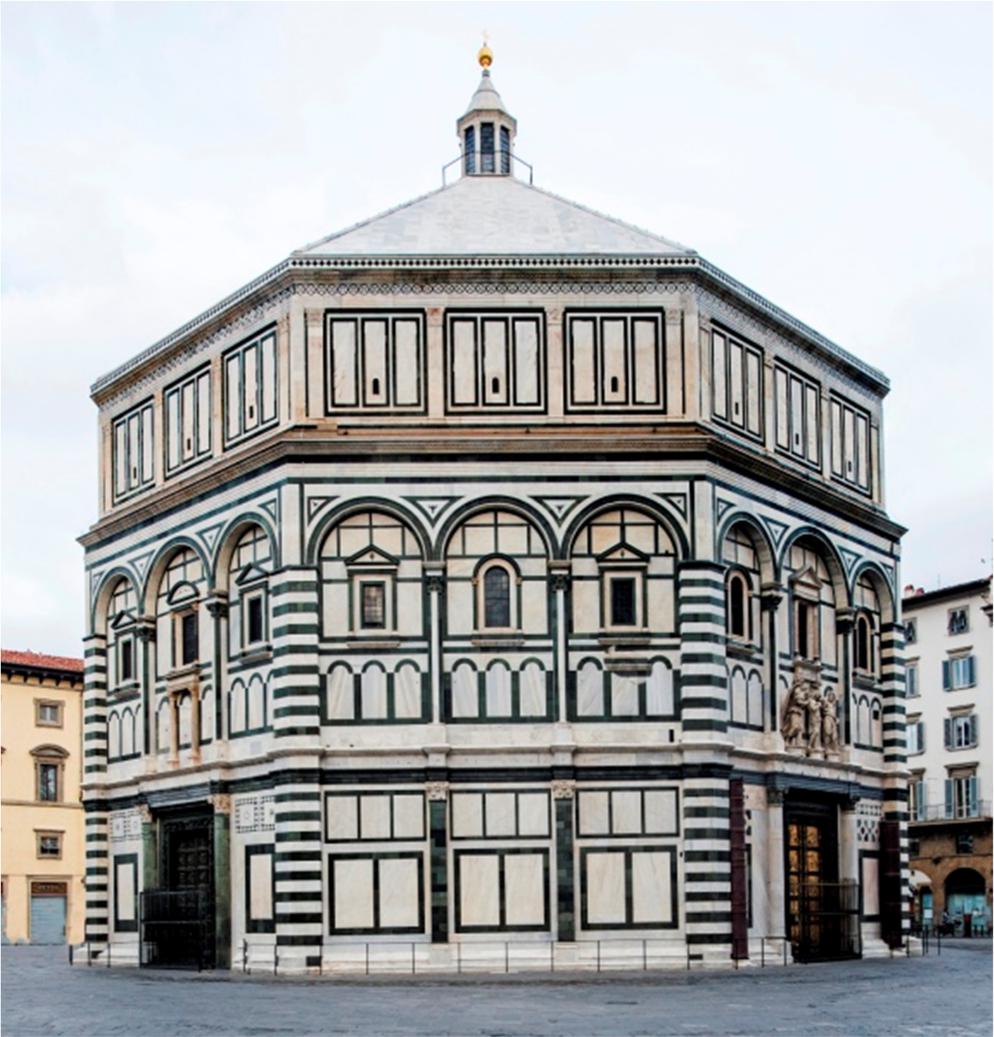
Figure 1. External view of the Baptistery of San Giovanni.
The length of the sides of the Baptistery, despite some irregularities as documented by a recent laser scanning survey (Tucci et al., 2018), are almost the same and equal, at the ground level, to about 13.5 m. The average external diameter is about 35 m, while the average internal diameter is approximately 27.7 m; centimetric differences with respect to these measures were observed by the laser scanning survey at higher levels. The thickness of the walls on the corners, including the marble covering, is about 3.5 m, almost 1/10 of the external diameter. The covering structure is realized by means of a cloister dome; the lower part of the dome is made of stone blocks arranged with horizontal beds, then with ashlar stone pyramidal on beds radially inclined. The upper part of the dome is instead made of masonry bricks. A pyramid-shaped flattened roof, not visible from the outside, protect the dome against the environmental loads. This pyramidal covering structure is structurally connected with the internal cloister dome by spurs, which start at the level of the impost of the internal cupola from the octagonal perimeter.
Geometry of the dome, together with exhaustive discussion of the centers of curvature of the upper and lower part of the dome, was the subject of several studies in the past (f.i. Giorgi and Matracchi, 2006).
The dome of the Baptistery evidences a system of cracks and deformations typical of domed buildings. This cracking pattern is composed by a first series of not passing cracks in the intrados of the dome in correspondence of the connection between the webs and by a second series of vertical passing cracks above the three great portals. The cracking pattern is discussed in Ottoni and Blasi (2016), while the causes that originated it are shown in Bartoli et al. (2017). Ottoni and Blasi (2016), in addition, demonstrated that the insertion made in 1514 of a steel tie-rod around the dome was able to provide a stabilization of the cracking pattern.
From a structural point of view, it is possible to recognize two levels. A first level starts from the ground floor up to the matroneum (the women’s gallery) with a height of about 9 m; the second level develops from the matroneum to the gallery (with a height of about 6.3 m). The connection between the two levels is realized by a first annular ring (that does not run over the whole perimeter being interrupted on the side of the rectangular apse), which constitutes the walkway of the matroneum. A second annular ring, continuous on all the 8 sides, is present at the top of the second level. It constitutes the support of the dome (leaning on the internal perimeter) and of the upper part of the tambour (leaning on the outer perimeter).
With the exception of the side of the rectangular apse, the walls of the first level can be considered as composed of two combined structural systems: an external part made of solid masonry (with a thickness of about 1.7 m) and an internal part made of granite pillar (with a diameter of about 0.7 m). This double curtain is connected at the level of the matroneum by means of the first annular ring (apart the side of the scarsella), and in correspondence of the vertex of the octagon where the geometric thickness of the walls is saturated (thickness of about 3.5 m). Within the two vertices of the octagon at the East side are the spiral stairs (with a diameter about 1.7 m) that allow the access to the upper levels of the structure (the matroneum and the gallery).
The structural layout of the first level is repeated at the upper level: there is a continuous curtain of stone masonry on the external front (with a thickness of about 1.15 m) and an inner curtain, aligned with the granite pillars at the lower level. The inner curtain is realized by a triple series of paired windows with central column and a stone balustrade. At this level, in correspondence of the alignments identified at the lower level by the granite pillars, several masonry walls (with a thickness of about 0.5 m) develop radially. These walls, as the lower pillars, trisect each side of the octagon on the inner front. The covering of the matroneum is made by three barrel vaults for side (that span the space from wall to wall). The masonry walls on the external front have three splayed openings for side with flaring inward (about 1.8 m high in the narrowest part of the flare and variable width: from about 0.8 m of the central one to about 0.3 m of the laterals). The radially disposed masonry walls continue at the gallery level where they become the ribs of the dome spanning the space between the extrados of the some and the intrados of the upper tambour. These ribs, in addition, constitute the support for the stone vaults that supports the marble roof of the Baptistery.
The upper gallery walkway creates a second annular ring, which connects inner and outer curtain. In contrast to the lower one, this ring is continuous along the whole perimeter. This second annular ring constitutes the support of the dome whose middle plane is leaning on the internal perimeter. Consequently, the dome is not centered on the ring-beam, but misaligned and moved to the inner perimeter. The lower part of the dome is marked by the presence of three opening on each side, disposed in axis with the openings below. Therefore, if the dome transfers its dead load mainly to the inner curtain of the walls of the octagon, the presence of the windows on the lower level of the dome conveys the dome dead load on the transversal masonry walls (the one placed between the matroneum and the gallery). This vertical load, in turn, is transferred to the granite pillars that constitute the inner curtain of the first level.
Ambient Vibration Tests
The dynamic survey was carried by using 10 seismic stations (Figure 2) and lasted 42 h, from 14 to 16 October 2013. The whole seismic network was composed as follows:
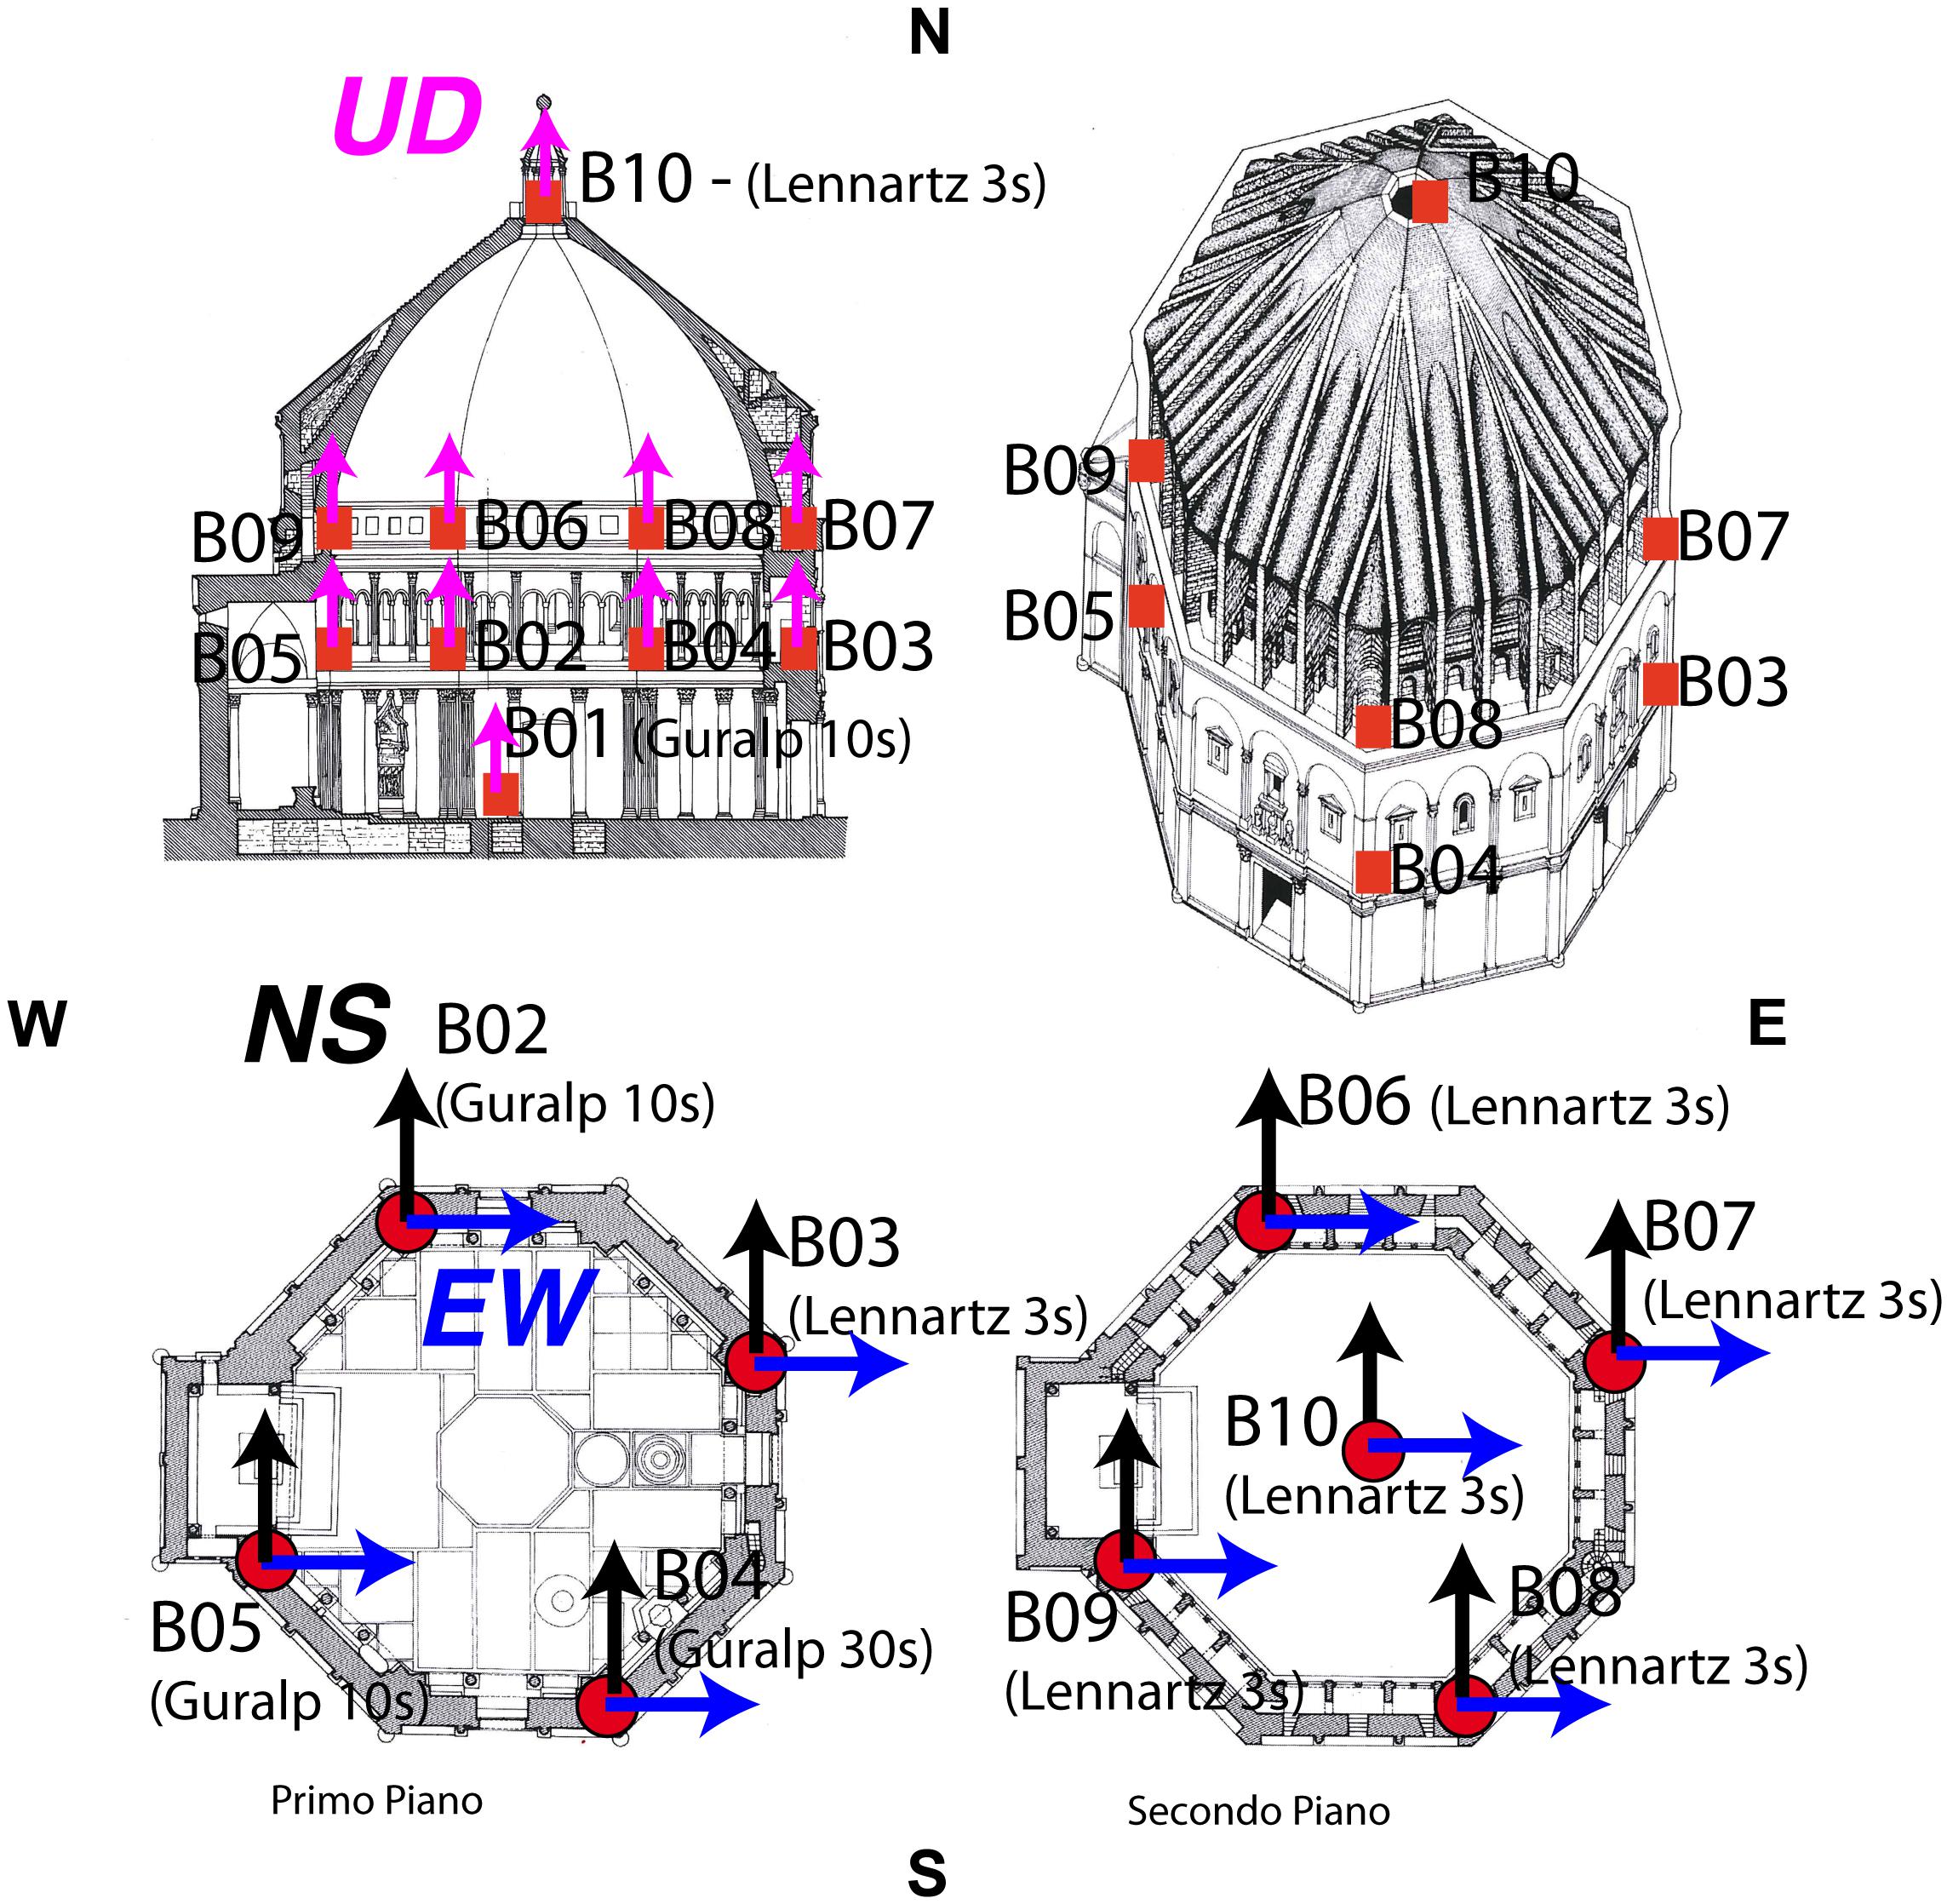
Figure 2. Layout of the seismic network during the AVT campaign (courtesy of “Opera di Santa Maria del Fiore”) (Lacanna et al., 2016).
• Six stations equipped with Lennartz 3D/5s 3-component seismometers (sensitivity 400 V/m/s and flat transfer functions up to 5 s).
• Three stations equipped with Guralp CMG-6T 3-component seismometers (sensitivity 2400 V/m/s and flat transfer function up to 10 s).
• One station equipped with Guralp CMG-40T 3-component seismometer (sensitivity 800 V/m/s and flat transfer function up to 30 s).
All the seismometers were recorded with a 24 bits Guralp CMG24 Digitizer at 100 Hz, and GPS was used to synchronize the time between the seismic stations during all the test.
The station B01 was located at the center of the basement and was employed as reference ground station (Figure 2). The stations B02, B03, B04, and B05 were positioned at the level of the first women’s gallery. The stations B06, B07, B08, and B09 (Figure 2) were positioned at the level of the second women’s gallery, on the same vertical axis of the first women’s gallery stations. The highest station, B10, was positioned in the lantern, 35 m above the ground (Figure 2).
The modal parameters were estimated automatically using the EFDD method, which was first presented by Brincker et al. (2007) and subsequently improved in Rainieri and Fabbrocino (2010).
The 42 h long records were divided into time windows 300 s long and overlapping by 66%. For each of them the spectral estimation was performed using the Welch’s technique (Welch, 1967) with Hanning weighting function and frequency resolution of 0.0122 Hz. The automatic EFDD procedure can be summarized as follows:
• Automatic identification of modal bandwidth (Figure 3c) using the modal coherence (Brincker et al., 2007; Rainieri and Fabbrocino, 2010). The mean (Figure 3a) and standard deviation (Figure 3b) of modal coherence are calculated for a set of 10 consecutive modal coherence.
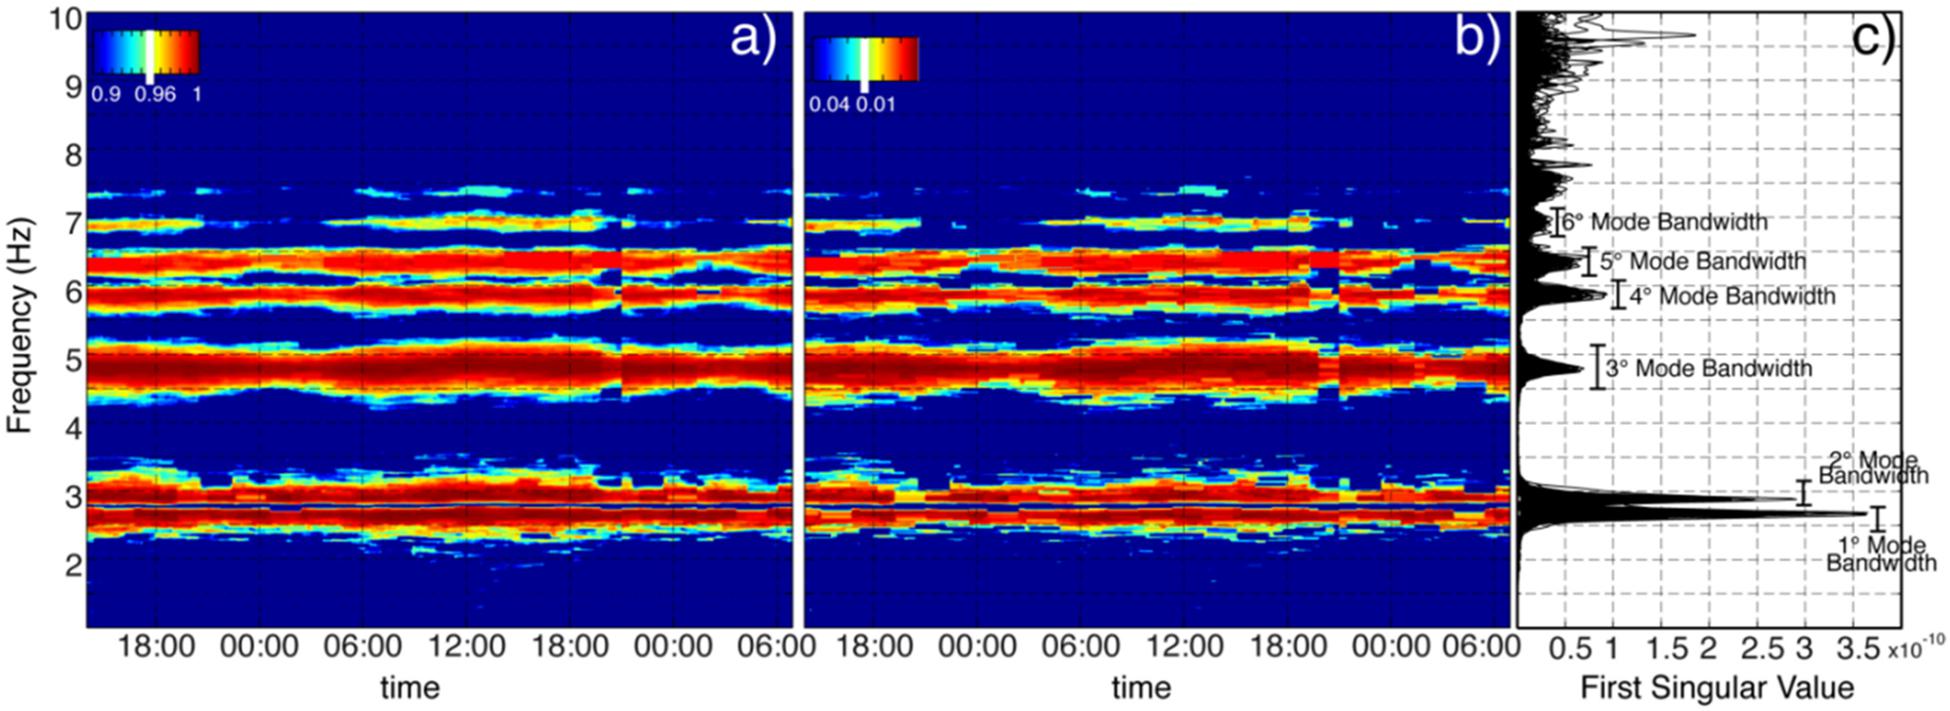
Figure 3. (a) Average of modal coherence. (b) Standard deviation of modal coherence. (c) First singular values calculated for the 42 h (Lacanna et al., 2016).
• Automatic identification of mode shapes looking for each modal bandwidth the maximum of the first singular value.
• The natural frequency and damping of each single mode are then evaluated using Single Degree of freedom (SDOF) spectral bell. The spectral bell is calculated using a MAC (Modal Assurance Criterion) of 0.9.
Additional details are reported in Lacanna et al. (2016). The EFDD allowed to automatically identify the first six mode shape of the Baptistery with following frequencies: 2.67, 2.88, 4.80, 5.88, 6.34, and 6.93 Hz (Figure 3 and Table 1). The damping ratio was calculated by using the logarithmic decrement technique of the normalized correlation function (Brincker et al., 2001).
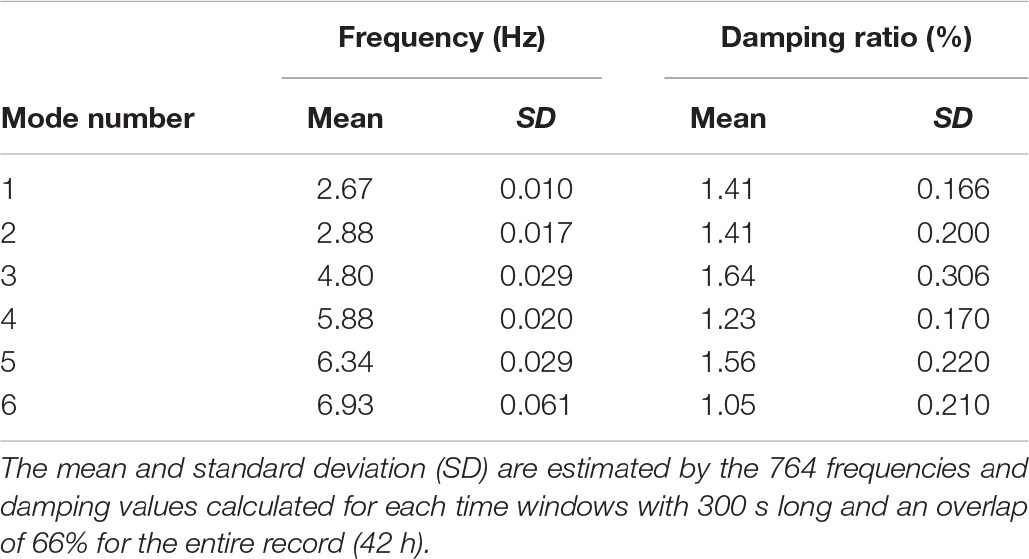
Table 1. Statistics of identified frequency and damping ratio of the Baptistery San Giovanni.
The results show that the Baptistery is characterized by following modal parameters:
1. The first mode shape is a transversal mode in the North-South (NS) direction with a frequency of 2.67 Hz and a damping ratio of 1.41% (Figure 4A and Table 1).
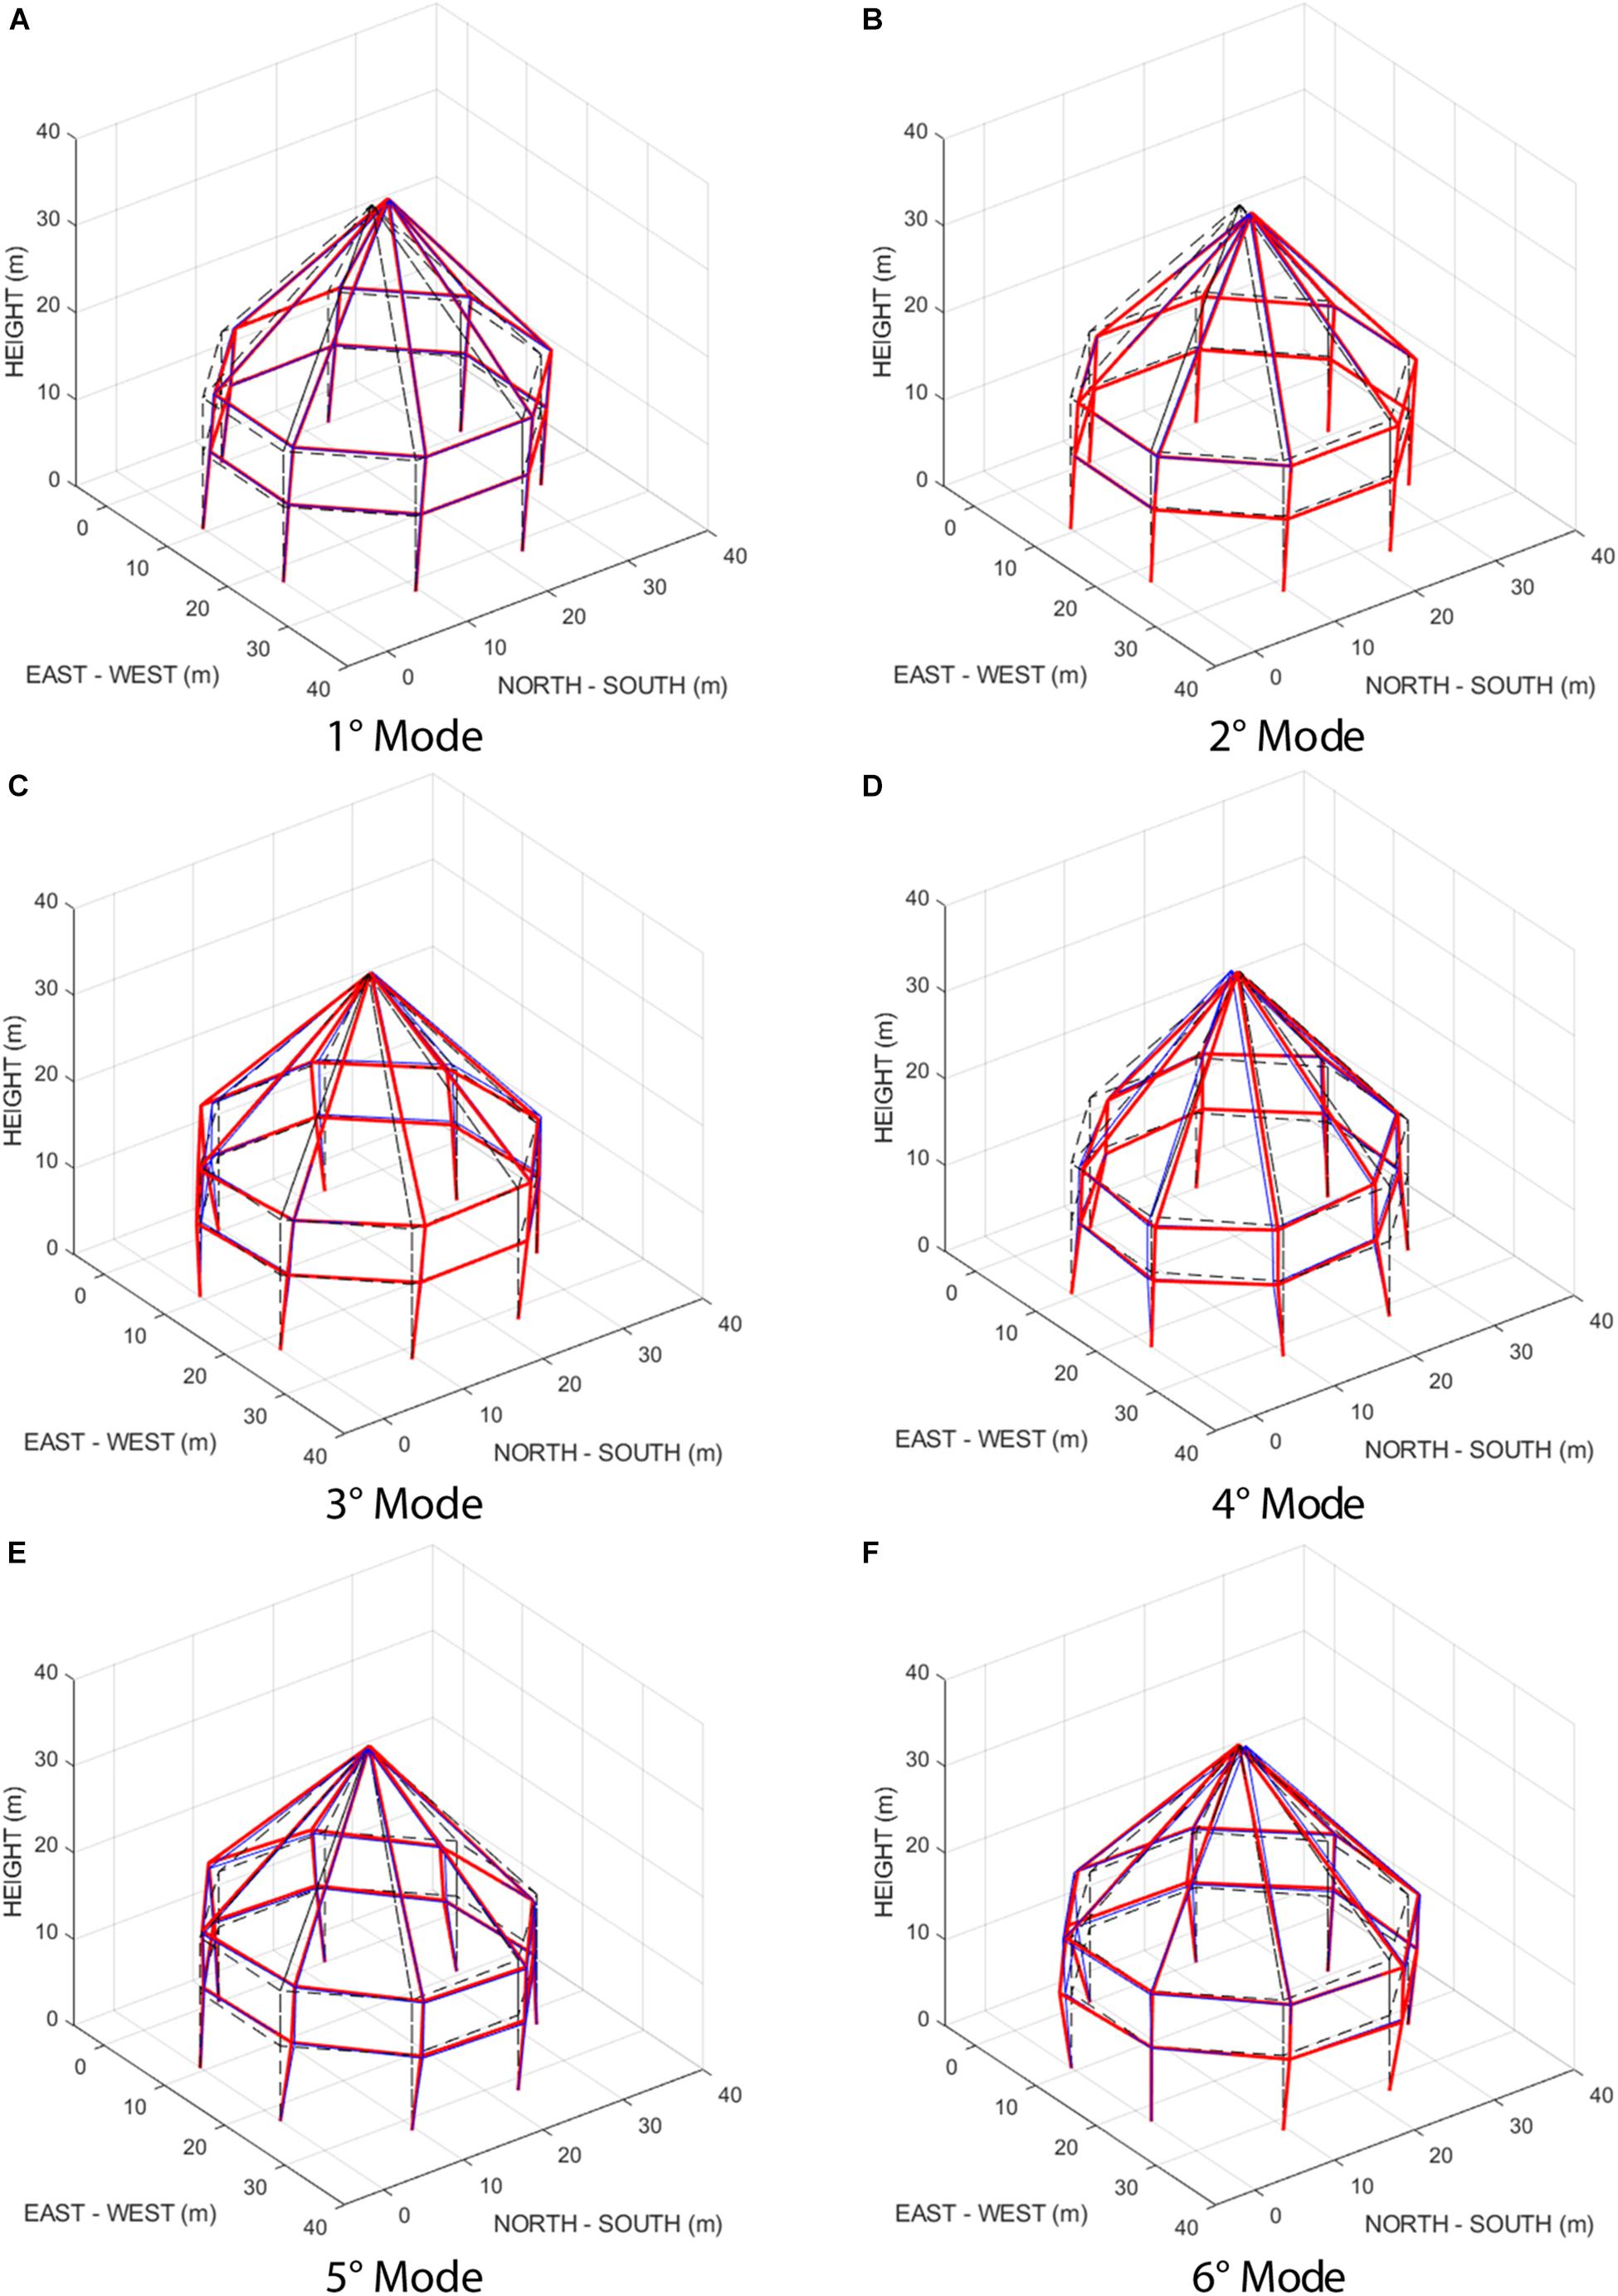
Figure 4. (A) 1° Mode, (B) 2° Mode, (C) 3° Mode, (D) 4° Mode, (E) 5° Mode, and (F) 6° Mode. Three-dimensional representation of the identified 6 mode shapes (blue lines) and of the numerical mode shapes obtained with the identified FE model (red lines).
2. The second mode shape is a transversal mode in the East-West (EW) direction with a frequency of 2.88 Hz and a damping ration of 1.41% (Figure 4B and Table 1).
It is worth noting that the closeness of the structure to a complete polar symmetry (only the presence of the scarsella makes the Baptistery not axial-symmetric) is responsible for the vicinity of the first two modes and the almost coincidence of the two damping ratios.
3. The third mode is a torsional one with a frequency of 4.80 Hz and a damping ratio of 1.64% (Figure 4C and Table 1).
4. The fourth mode shape is a flexural mode along the diagonal direction with a frequency of 5.88 Hz and a damping of 1.23% (Figure 4D and Table 1).
5. The fifth mode shape is a flexural mode along the EW direction with a frequency of 6.34 Hz and damping ratio of 1.56% (Figure 4E and Table 1).
6. The sixth mode shape shows amplitude of the vertical component at the station B10 (Figure 2) comparable to the maximum value recorded in EW direction at the station B07, thus indicating for this mode a relevant movement along the vertical axis (Figure 4F and Table 1).
The first five modal frequencies were continuously detected during the entire seismic campaign whereas the sixth mode was detected only during the daytime (Figures 3a,b). As shown in Lacanna et al. (2016), the detection period of the sixth mode coincides with the maximum amplitude of the seismic noise recorded at the ground station (B01), indicating that the seismic energy produced by anthropogenic activities is able to trigger the sixth mode during daytime whereas between 20:00 and 05:00 UTC this higher mode is poorly excited.
Numerical Modeling
In the last decades different numerical models of the Baptistery of San Giovanni were realized in order to analyze its structural behavior.
A first model numerical was realized in the nineties by Blasi and Papi (1996), by using the FE code ANSYS. This numerical model accurately reproduced the geometry and was composed of 8,000 nodes and 2,000 elements. Solid elements were employed for modeling the walls, the internal granite pillars, the ribs and the dome, while the covering was modeled by means of plane elements. The model was built so as to allow different values characterizing materials in different zones, in terms of elastic properties and specific weight. This model was subsequently updated in 2004 by Miceli and Papi (2004) to account for a more exhaustive representation of the area of the scarsella. The refined model was composed of about 10,000 nodes and 3,500 three-dimensional (3D) elements. The studies offered an insight to the structural behavior of the Baptistery under dead load, providing an enlightenment of the observed cracks on both the intrados of the dome and on the scarsella.
Bartoli and Betti built the numerical model in 2010, and the numerical model is published in Fratini et al. (2011), still by means of the commercial code ANSYS. The model was composed of 49,001 nodes and 37,210 elements. Masonry walls were modeled by means of 8-nodes isoparametric elements (about 27,700), while 4-nodes plane elements (about 9,500) were used to model the masonry ribs, the marble covering and the cloister dome. In addition, 14 one-dimensional elements were employed to model the internal columns. The aim of the modeling was to investigate the dynamic behavior of the Baptistery, after the pedestrianization of the square of the Baptistery in 2009. By means of a microwave interferometer radar, the dynamic response of the structure was monitored incessantly from October 19 through November 2, 2009 (i.e., 1 week before and 1 week after the vehicular traffic block around the square where the Baptistery is). The elastic parameters and the self-weight were calibrated by comparing the numerical and the experimental results. The mechanical parameters of the linear model (elastic modulus, Poisson’s ratio and own weight) were identified in order to reproduce the experimental results (a frequency of about 2.65 Hz on the North-South direction). Due to the number of uncertainties that affect the spatial distribution of the mechanical parameters, the identification was performed assuming a uniform distribution of the elastic properties over all the structural complex. For the modulus of elasticity (E) it was identified a uniform value equal to 2,500 N/mm2. The results identify a first mode shape in North-South direction with a frequency of 2.65 Hz equal to the experimental result. The second mode shape was a bending mode in the East-West direction with a frequency of 2.97 Hz. The third mode shape, with a frequency of 4.82 Hz, corresponded to a torsional mode-shape, which affects the walls of the Baptistery. Due to large number of uncertainties affecting the structure, i.e.,: elastic material properties and spatial distribution and internal texture of the masonry walls, the assessment procedure was intended at reproducing mainly the first modal frequency.
A third numerical model, still built using the code ANSYS, was built within a research project promoted by the “Opera di Santa Maria del Fiore” in Firenze during the year 2014. This new model was built based on the geometric data collected during the last laser scanning survey (Tucci et al., 2018) and the model paid specific attention to the correct reproduction of the main structural elements. All the structural components (internal columns, masonry walls, masonry ribs, marble covering and the cloister dome) were modeled by means of 3D solid 8-nodes isoparametric finite elements (SOLID185) and the 3D FE model consisted of 65,692 joints and 204,529 elements. The structure was modeled by assuming fixed restraints at the base and the numerical model, built as detailed as needed to represent the overall spatial configuration of masses and stiffness of the Baptistery, was employed by performing sensitivity analyses to provide an interpretation of the current damage (Bartoli et al., 2017). This latter model, whose discretization is reported in Figure 5, is here employed to perform model updating.
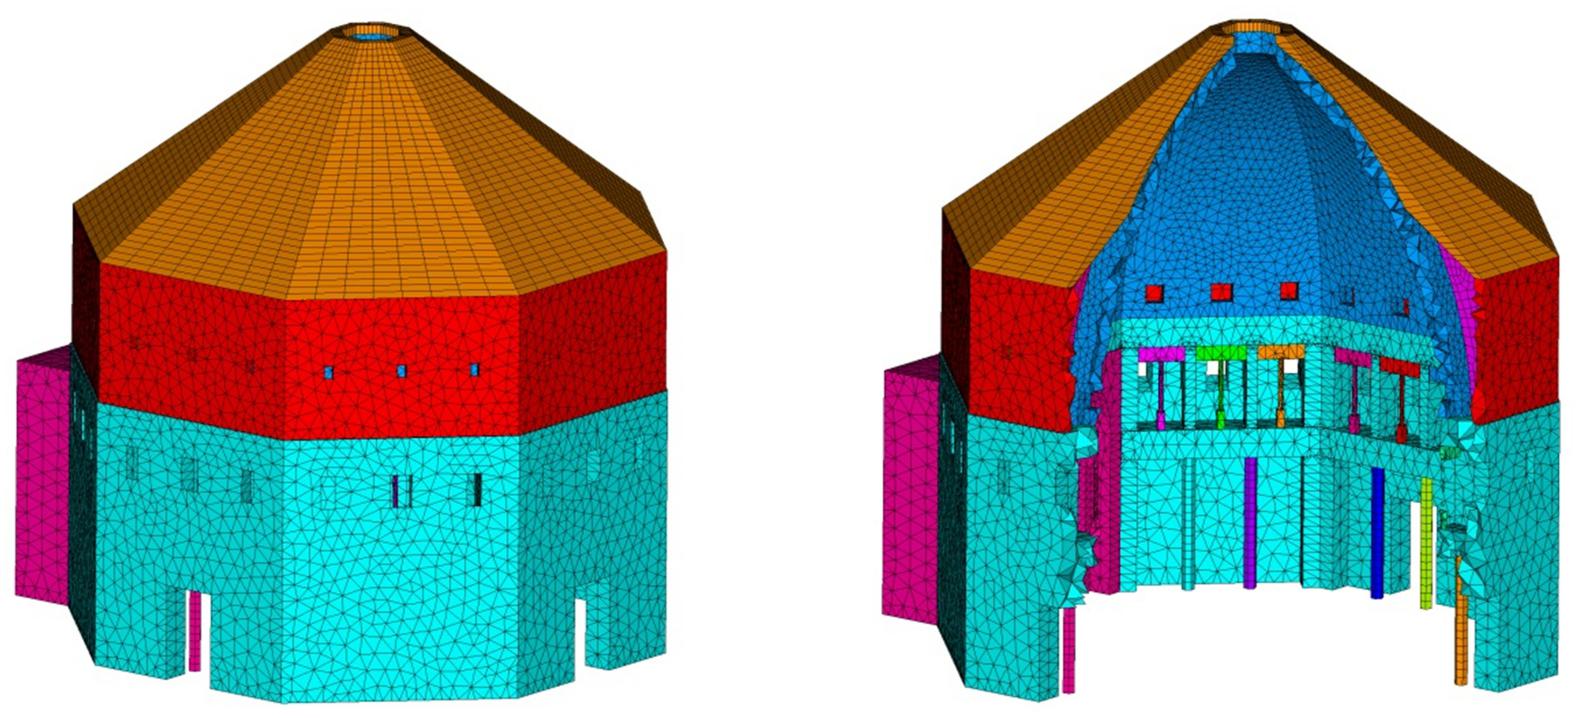
Figure 5. FEM discretization.
Model Updating
FE model updating is a process where the physical parameters of the FE model are gradually updated in such a way that the response of the FE model progressively approaches that of the real structure (Mottershead and Friswell, 1993). FE model updating can be performed by using trial-and-error methods, by simply varying few selected parameters based on expert judgment. This approach, despite its simplicity, may result somewhat inefficient being not able to provide reasonable physical explanation of the changes in structural characteristics.
In a more exhaustive mathematical framework, model updating can be seen as an inverse problem where a parameterized numerical model is combined with an optimization algorithm which is employed to minimize an objective function that measures the differences between the numerical results and the measured data. In this respect the efficiency to solve a large class of structural problems in the engineering field of artificial intelligence algorithms such as the GA has been successfully demonstrated in the last decades. Being the GA a robust global optimization technique, it has been successfully applied in minimization problems involving damage assessment by many researchers (Mares and Surace, 1996; Faravelli et al., 2005; Perera and Torres, 2006; Betti et al., 2015; Shabbir and Omenzetter, 2016).
The GA, originally introduced in the sixties by Holland (1975), is a global searching evolutionary processes based on ideas of natural selection from the Darwin’s principle. It operates starting with an initial population whose individuals, named chromosomes, are subjected to the operations inspired by the genetics laws. Individuals are selected according to their fitness performance, and they evolve based on genetic operations and replacement. Result of these operations, where the fitter chromosomes produce more offspring than the less fit ones, is a population, i.e., a collection of chromosomes, whose fitness is higher than the initial one (Holland, 1975).
From a computational point of view, the term chromosome refers to a candidate solution to a certain problem; a chromosome is in turn composed by genes, each of which encodes specific data of the candidate solution. The simplest form of GA involves four types of operators: (i) selection, (ii) crossover, (iii) mutation and (iv) elitism. The purpose of the first operator is to selects the chromosomes in the population for the reproduction: the most performing is the chromosome (i.e., higher its fitness value is), the more times it is likely to be selected for reproduction. The second operator generates two offspring by crossing, at a randomly chosen point, the parent chromosomes. Crossover implements the process of reproduction of the natural selection. The third operator randomly replaces a gene in a chromosome with another one chosen from the solution space. Mutation has the purpose to introduce diversity in the solution process, avoiding design toward a non-optimal solution or premature convergence (i.e., local minima). The last operator, the elitism, transfers the best chromosomes of the current generation to the next generation.
In this study, the GA is employed to minimize the differences between experimental and numerical results through a proper objective function. Next the coding of the problem, the fitness functions employed for model updating, and the analyses performed to verify the effect of the number of experimental modes considered on the results of the model updating are introduced.
Coding of the Problem
Optimization approaches rely on a forward model, consequently the outcome of the procedure depends both on the quality of the parametrized FE model and on the selection of the updating mechanical parameters (Shabbir and Omenzetter, 2016; Alkayem et al., 2018). Herein, due to the number of uncertainties that still affect the spatial distribution of the elastic mechanical parameters of the Baptistery, the identification was performed selecting as updating parameters the modulus of elasticity (E) and the self-weight (W) of few structural components. In particular, three mechanically different structural components have been selected based on the geometry of the Baptistery and of a preliminary survey: (i) the scarsella (ES and WS), (ii) the masonry dome (ED and WD), and (iii) the masonry walls (EM and WM). Self-weight was assumed varying between 18 kN/m3 (lower value) and 22 kN/m3 (upper value), while the E of each structural component was assumed varying between 700 MPa (lower value) and 3,600 MPa (upper value) (Boschi et al., 2109). The three components have been selected in order to provide an insight on the relative contribution of the stiffness of each part on the overall dynamic behavior of the building, and their selection represents a first in-depth of what done in a previous research (Fratini et al., 2011). Improvements of the classification here adopted will be possible based on experimental activities aimed at deepening the knowledge of the structural details of the Baptistery.
To build the chromosomes, a real-coded GA was employed; this allowed to avoid introducing a linear scaling conversion to express the elastic modulus and the weight of the elements. Chromosomes are so composed of six genes encoding the E and W of the three structural components. It is worth noting that genes can attain any real value between 0 (lower value of E and W range) to 1 (upper value of E and W range) and correspondingly each chromosome represents a possible identified FE model whose eigenfrequencies and eigenmode are numerically evaluated.
To perform the optimization, the parametric APDL language of the commercial FE code ANSYS was used to build the FE model in order to accept the ASCII input from the GA, whereas the code MATLAB was employed to apply the GA. In each iteration of the GA the chromosomes are generated according to the genetic rules above described, and are submitted to the ANSYS code to build the model and to obtain both frequencies and mode shapes that are, in its turn, employed to evaluate the fitness of the population.
Fitness Functions
The objective functions were built calculating the differences between experimental and numerical results. To verify the effects of the quantity (i.e., number of identified modal parameters employed for model updating) and quality of experimental data (i.e., both frequencies and mode shapes or only frequencies) on the updating process two different fitness function were considered. The first fitness function is reported in Eq. (1):
This function accounts for a difference on the frequencies and a difference on the values of nodal displacements of each mode shape (evaluated on the corner of each level, according to the experimental layout assumed for the AVT; Figure 2). Coherence between numerical (n) and experimental (e) mode shapes was evaluated through the modified total modal assurance criterion (MTMAC) (Perera and Ruiz, 2008; Georgioudakis and Plevris, 2016), an improvement of the MAC (Modal Assurance Criterion) where to account for differences between experimental and numerical results frequencies are introduced as penalty functions.
The second fitness function is reported in Eq. (2). This expression only takes into account errors on frequencies.
In Eqs (1) and (2) k represents the number of identified frequencies employed for the tuning of the numerical model. For comparative purposed this number was assumed equal to 2, 4, and 6; ϕi,n and ϕi, e represents the ith numerical and experimental mode shape respectively; and fi,n and fi,e denote the ith numerical and experimental main frequency (respectively).
Discussion of the Results
The parameters adopted to run the GA were chosen as follows: crossover probability was selected as 0.8, mutation probability was set to 0.1 and elitism rate was chosen as 0.05. Single-point crossover was used. These values, which are problem dependent, were selected starting to suggestions of existing literature (Mares and Surace, 1996; Pandey et al., 2014; Betti et al., 2015) and adapting them to the specific case (several preliminary tests were performed analyzing different algorithm parameters: crossover, mutation and elitism). The gene numbers of each chromosome were 6, and the population size was chosen equal to 10 times the gene numbers.
To verify both the effects introduced by the number of experimental modes on the model updating procedure and the effects of the type of experimental data (i.e., frequencies and mode shapes or only frequencies) several parametric analyses were performed. In particular, to verify the influence introduced by the number of experimental modes available three case were analyzed: k = 2, k = 4 and k = 6. To verify the influence introduced by the type of experimental data (frequencies and mode shapes or only frequencies) Eqs (1) and (2) were assumed as fitness functions. For all the analyses the maximum number of iterations was set to 70, but after about 20–30 iterations (depending on the case considered) it was possible to observe convergence of the algorithm toward the optimized solution.
Table 2, in term of obtained numerical frequencies and corresponding errors (expressed as percentage difference), summarizes the results obtained using the fitness function of Eqs (1) and (2) and considering 2, 4, or 6 experimental results for the model updating process (gray cells highlight the number of modes employed for tuning). The MAC between experimental and numerical modes is instead reported in Figure 6.
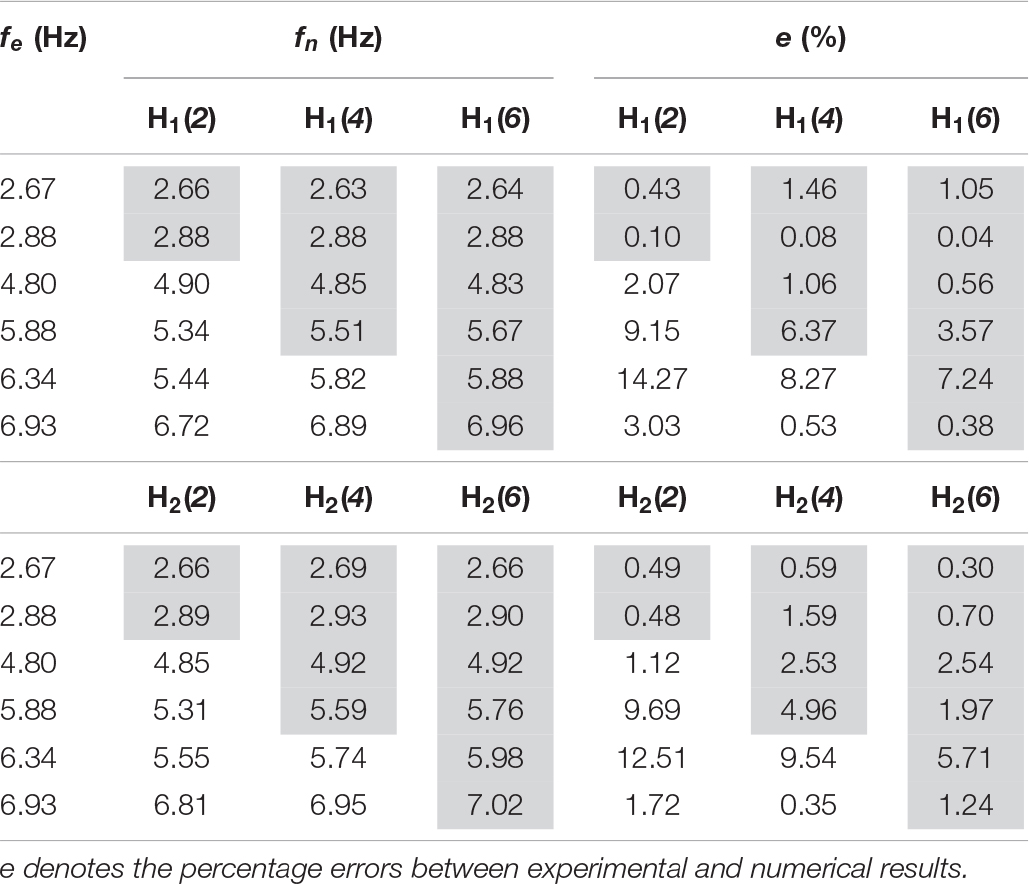
Table 2. Experimental frequencies (fe) and numerical frequencies (fn) obtained by tuning the numerical model with different number of experimental results (k) and employing Eq. (1) [H1(k)] and Eq. (2) [H2(k)] as fitness function.
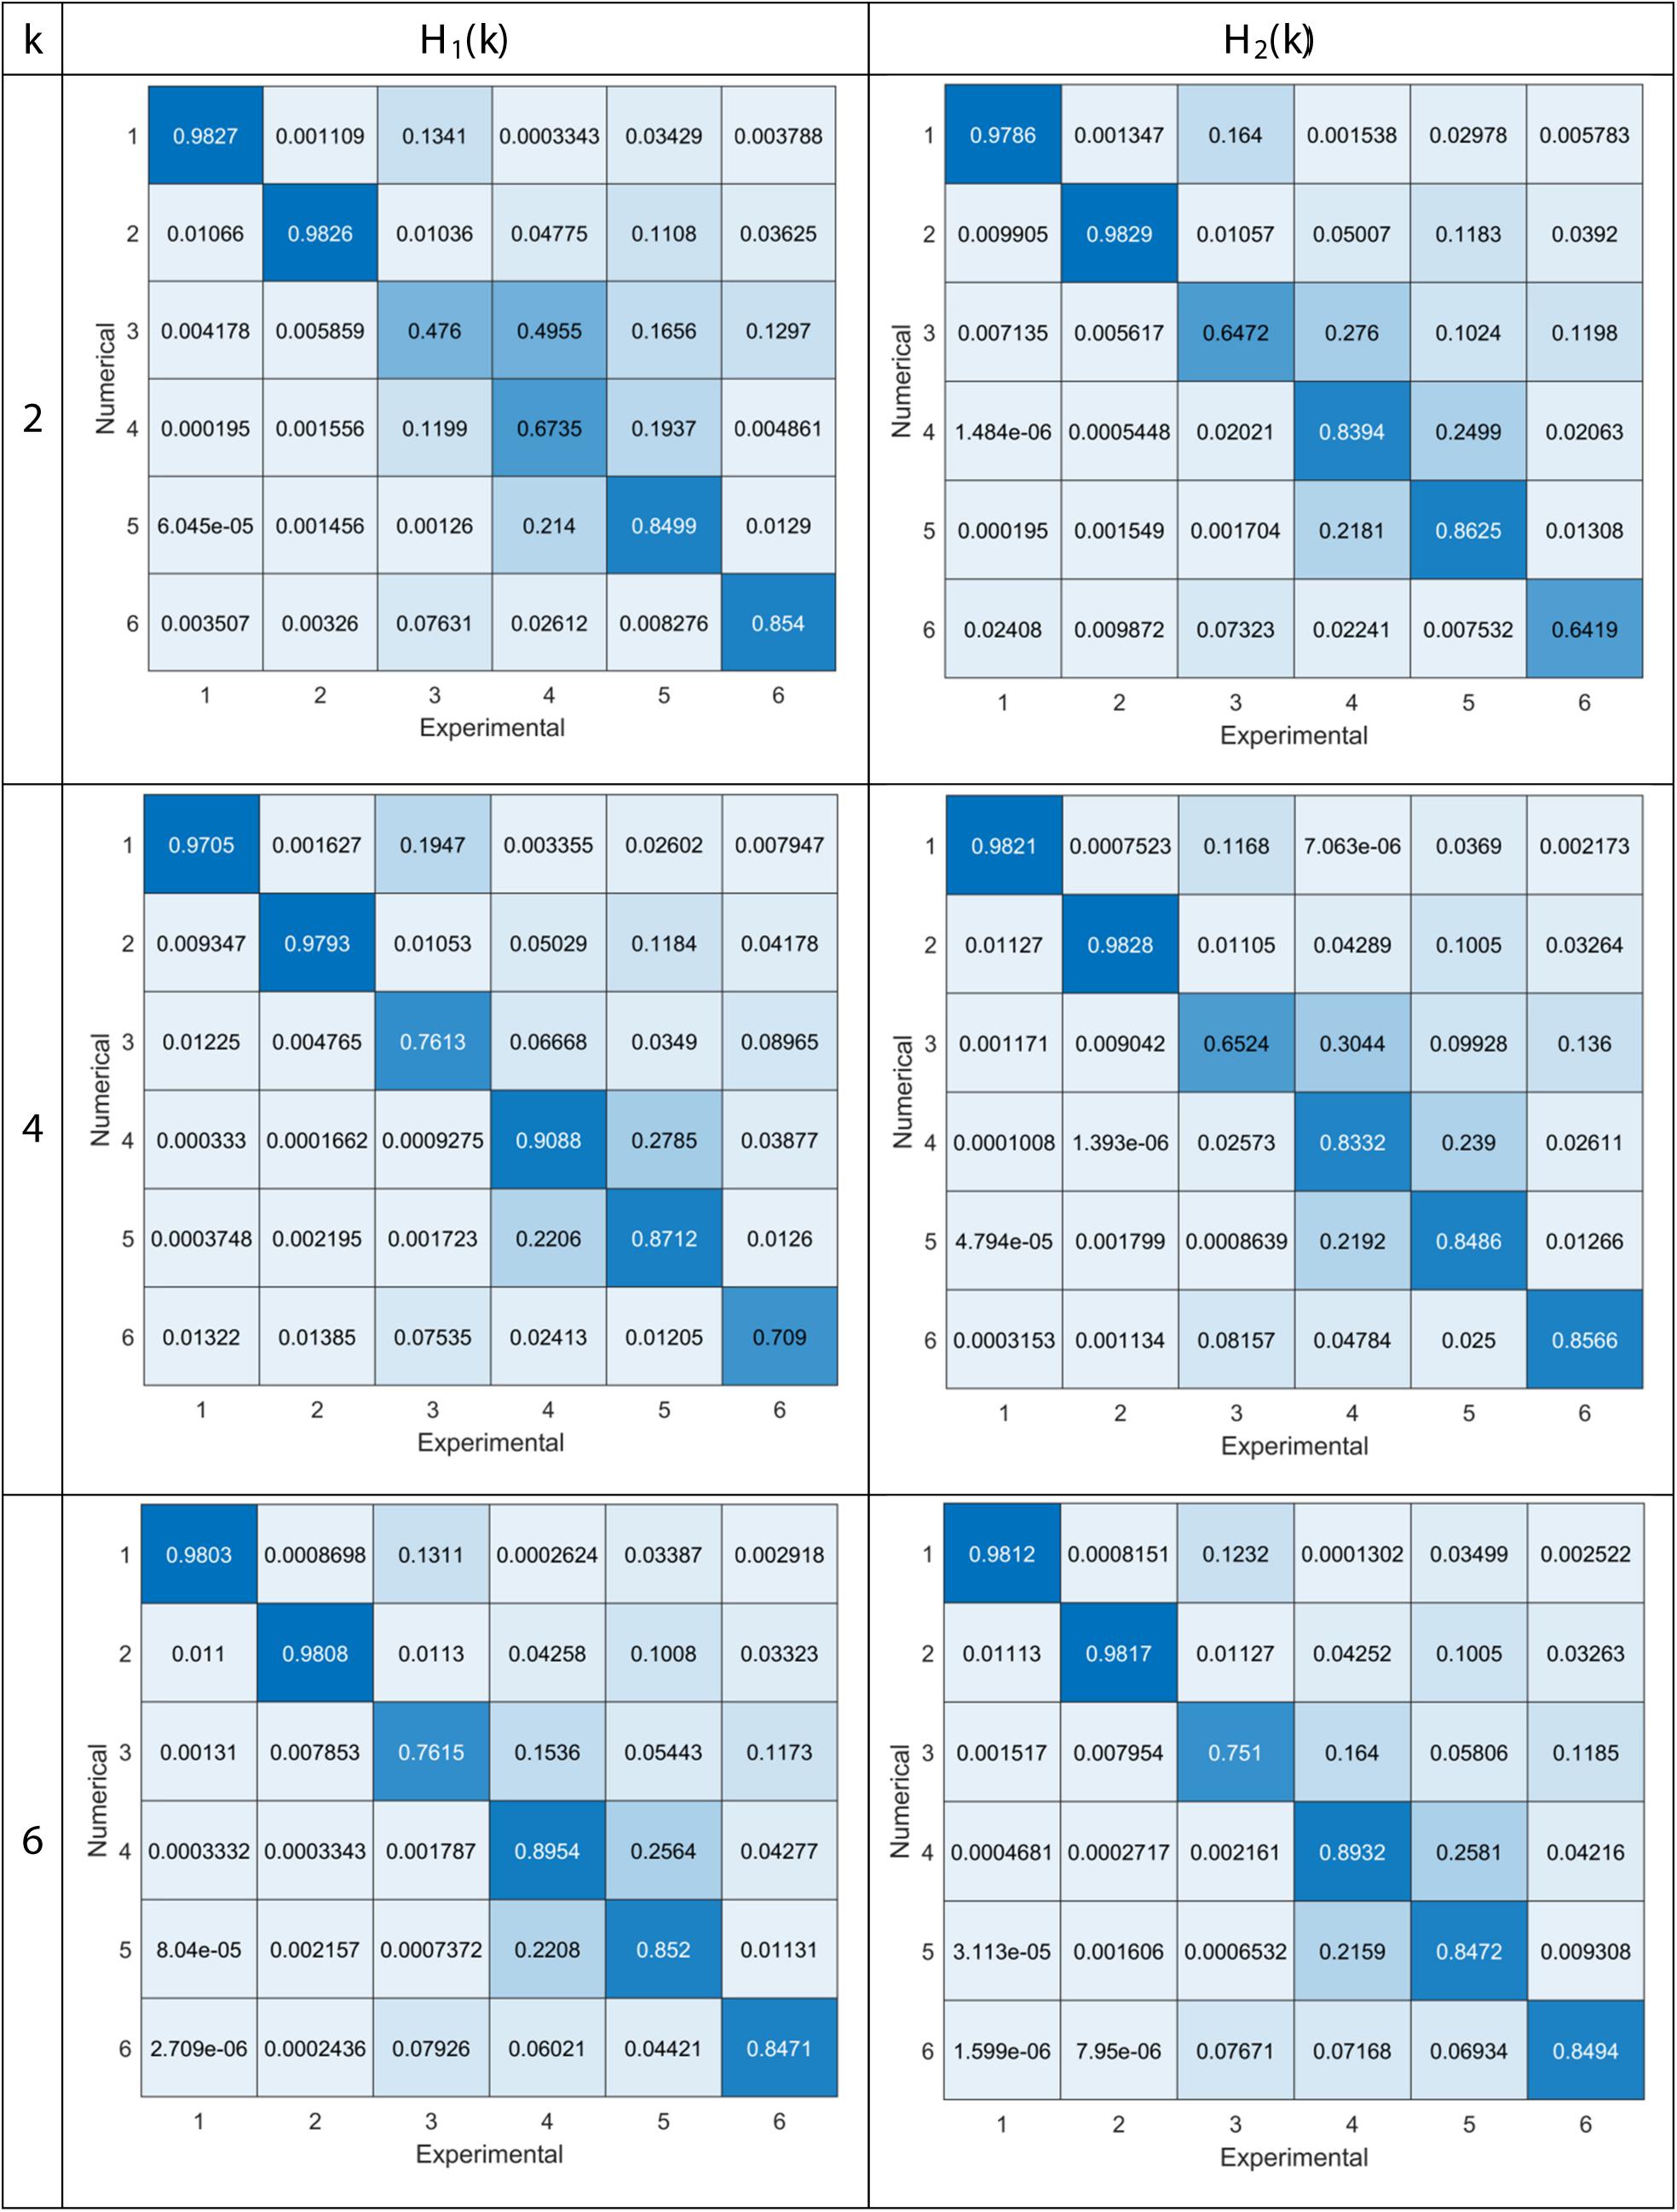
Figure 6. MAC between experimental and numerical mode shapes (numerical results vs experimental ones).
When Eq. (2) is employed as objective function it is possible, as expected, to observe a general improvement of the match between experimental and numerical frequencies with the increasing the number of experimental results. To account only for the first two experimental frequencies, for instance, originates an error between experimental and numerical results of about 9.7 and 12.5% on the higher modes [which becomes 9.1 and 14.3% when Eq. (1) is considered]. A significant improvement is however, obtained if the model updating process account for the mode shapes (i.e., if Eq. (1) is employed as fitness function). It is anyway interesting to highlight that when all the experimental results (i.e., the case k = 6 is considered) are employed for model updating, the MAC provided by Eq. (1) is almost similar to the one provided by Eq. (2).
For the case H1(6) [i.e., fitness function of Eq. (1) and model updating performed considering all the six experimental data] the following values of E and self-weight were obtained: (i) ES = 1,080 MPa and WS = 21.50 kN/m3 (scarsella), (ii) ED = 3,280 MPa and WD = 19.85 kN/m3 (masonry dome), and (iii) EM = 1,895 MPa and WM = 18.05 kN/m3 (masonry walls). The first mode of the updated numerical model is a bending mode in the NS direction with a frequency of 2.64 Hz. The second mode shape is a transversal bending mode in the EW direction with a frequency of 2.88, equal to the experimental result Hz. The third numerical mode shape has a frequency of 4.83 Hz and corresponds to a torsional mode-shape which affects mainly the walls of the Baptistery. Higher mode shapes are transversal and vertical modes. Comparison between experimental and numerical frequencies is reported in Table 3, while the comparison between experimental and numerical mode shapes expressed as MAC value is reported in Figure 6 and illustrated in Figure 4. It is possible to observe a good agreement between experimental and numerical frequencies and mode shapes.
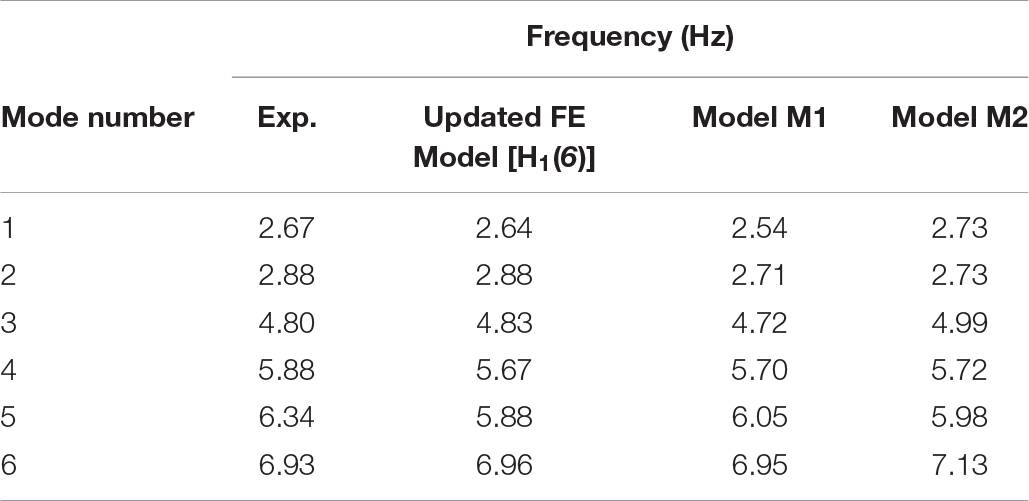
Table 3. Comparison between experimental and numerical main frequencies.
For the case H2(6) [i.e., fitness function of Eq. (2) and model updating performed considering all the six experimental data] the following values of the modulus of elasticity (E) and self-weight (W) were obtained: (i) ES = 1,025 MPa and WS = 19.00 kN/m3 (scarsella), (ii) ED = 3,270 MPa and WD = 21.50 kN/m3 (masonry dome), and (iii) EM = 2,100 MPa and WM = 18.10 kN/m3 (masonry walls). Both the results of case H1(6) and H2(6) highlight a significant difference on the relative contribution to the overall dynamic behavior of the Baptistery between the scarsella and the masonry dome; this is next investigated analyzing two ideal (numerical) cases.
It noteworthy that if compared with the results of a previous identification, reported in Fratini et al. (2011), performed assuming the same E for all the structural components (and equal to 2,500 MPa), it is possible to observe an improved agreement between experimental and numerical results. This is due to several factors: (i) the higher number of experimental mode shapes available (the previous identification was performed based on the first experimental frequency only); (ii) the selection of distinct structural components, each one with different E and W (i.e., the coding of the problem); and iii) the use of GA in combination with a fitness function which include the mode shapes through the MTMAC. It is to be pointed out that due to large number of uncertainties still affecting the material parameters and their spatial distribution together with the masonry internal texture (which is covered by marble), the identification procedure here adopted has foreseen the subdivision of the structure into only three different structural components. In this respect, improvements of the results here presented can be obtained by refining the current subdivision (provided that additional experimental investigation will allow to deepen the knowledge of constructive details).
As discussed in section “Geometry and Structure,” the scarsella, a rectangular apse created in the XIII century and surmounted by a great arch, alters the polar symmetry of the Baptistery and the GA, after convergence, provides a significant difference of the modulus of elasticity between the scarsella and the masonry dome. It is hence of interest to investigate the contribution of this structural component to the overall dynamic behavior of the Baptistery. A measure of the asymmetry introduced by the presence of the scarsella is the ratio between the first two experimental frequencies (f1,e/f2,e), equal to about 0.92. To investigate the effect introduced by the geometry in such ratio, the numerical model with the identified elastic parameters [the one identified with the case H1(6)] was employed as a numerical laboratory to perform two parametric analyses. In a first case (named Model M1) it has been analyzed the modal behavior of an ideal case where the scarsella is not present. In a second case (named Model M2) it has been analyzed an ideal configuration of perfect polar symmetry of the Baptistery. Figure 7 illustrates the differences on the mode shapes, while differences on the main frequencies are summarized in Table 3. Removing the scarsella (Model M1) modifies the ratio between the first two frequencies, which moves to 0.94, and, in general, this configuration mainly affect the first two frequencies. The case M2 (i.e., perfect polar symmetry of the Baptistery), on the contrary, introduces changes on all the frequencies and reverses the fourth with the fifth mode.
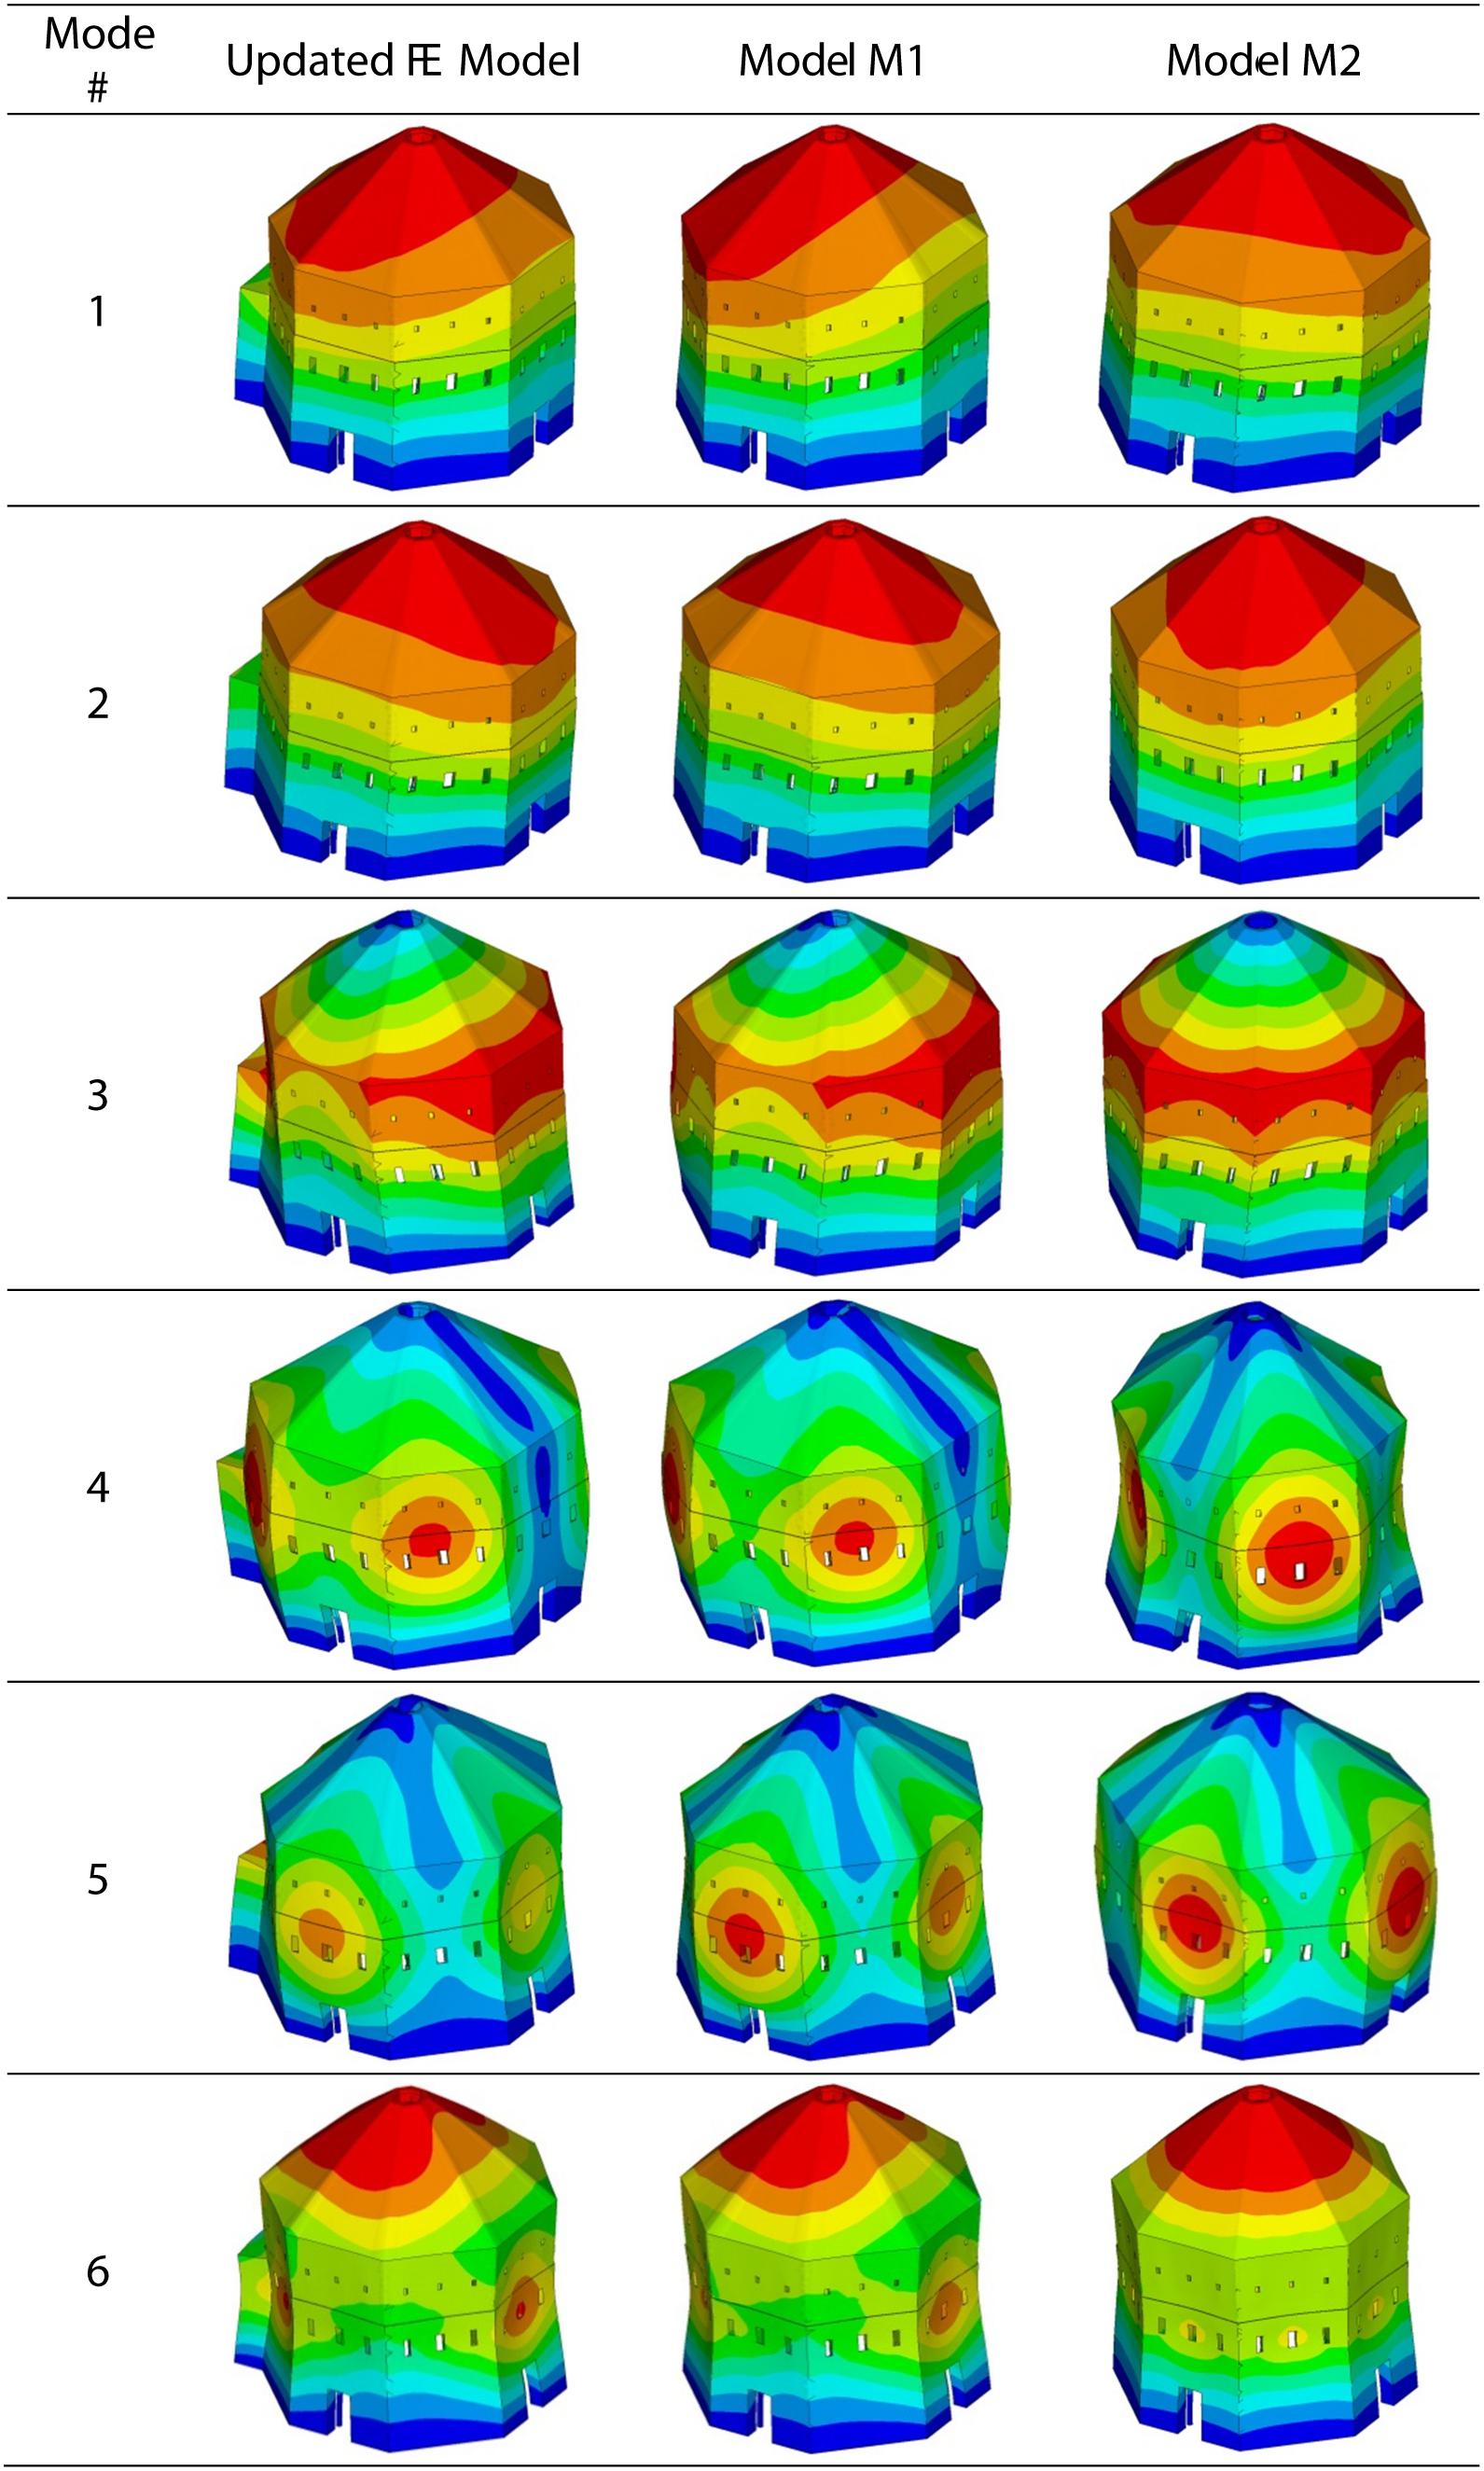
Figure 7. Axonometric view of the first six mode shapes of different models (first column: updated FE Model; second column: model M1; third column: model M2).
Concluding Remarks
This paper discussed the modal identification performed using 10 seismic stations and the model updating of the Baptistery of San Giovanni in Firenze (Italy). Vibration-data were automatically analyzed in output-only domain by EFDD, and the assessed dynamic behavior of the structure was subsequently employed to identify a numerical model. Being the paper aimed to model updating, the imaginary part of the identified mode shape (which may be due to non-linearities or to non-proportional damping) was disregarded. To minimize the objective function that measures the differences between the numerical results and the measured data the use of GA was proposed and investigated considering two fitness functions. The obtained results, both in terms of main frequencies and mode shapes, show high correspondence between the values obtained from the AVTs and the one obtained from the final identified numerical model. Integrating the results of the dynamic identification with the tuning of the numerical model has improved the knowledge of the structural behavior for the entire building, allowing to estimate the modulus of elasticity for three main structural components. In addition, by performing some parametric comparisons with the identified numerical model, it was possible to assess the effects introduced by the scarsella on the modal behavior of the Baptistery. The obtained results demonstrate once again that the OMA combined with a FE updating performed by using GA maximizes the correlation between numerical and experimental data, thus helping to minimize the uncertainties related to the structural parameters. In addition, the use of digital seismometers to develop the AVTs allows to minimize the equipment needed to perform the experimental tests since these devices do not require any additional component for the operational conditions. Future developments of the current research will consider a refinement of the identification of the three macro-components here assumed with the aim to perform an estimation of the uncertainties that inevitably affect the identification process.
Data Availability Statement
The datasets generated for this study are available on request to the corresponding author.
Author Contributions
GL analyzed the seismic data and wrote the manuscript. MB developed the analytical model and wrote the manuscript. MR and GB contributed to the writing of the manuscript and to developing the seismic analysis and the numerical model, respectively.
Funding
This research was financially supported by the “Opera di Santa Maria del Fiore” (which promoted a campaign of studies on the Baptistery of San Giovanni in 2014), that is gratefully acknowledged. The funder had no role in study design, data collection and analysis, decision to publish, or preparation of the manuscript.
Conflict of Interest
The authors declare that the research was conducted in the absence of any commercial or financial relationships that could be construed as a potential conflict of interest.
Footnotes
References
Alkayem, N. F., Cao, M., Zhang, Y., Bayat, M., and Su, Z. (2018). Structural damage detection using finite element model updating with evolutionary algorithms: a survey. Neural Comput. Appl. 30, 389–411. doi: 10.1007/s00521-017-3284-1
Aoki, T., Sabia, D., and Rivella, D. (2008). Influence of experimental data and FE model on updating results of a brick chimney. Adv. Eng. Softw. 39, 327–335. doi: 10.1016/j.advengsoft.2007.01.005
Bartoli, G., Betti, M., and Borri, C. (2015). Numerical modelling of the structural behaviour of Brunelleschi’s dome of santa maria del fiore. Intern. J. Architect. Herit. 9, 408–429. doi: 10.1080/15583058.2013.797038
Bartoli, G., Betti, M., and Torelli, G. (2017). Damage assessment of the baptistery of san giovanni in florence by means of numerical modelling. Intern. J. Masonry Res. Innov. 2, 150–168. doi: 10.1504/IJMRI.2017.085955
Bassoli, E., Vincenzi, L., D’Altri, A. M., de Miranda, S., Forghieri, M., and Castellazzi, G. (2018). Ambient vibration-based finite element model updating of an earthquake-damaged masonry tower. Struct. Control Health Monitor. 25:e2150. doi: 10.1002/stc.2150
Betti, M., Facchini, L., and Biagini, P. (2015). Damage detection on a three-storey steel frame using artificial neural networks and genetic algorithms. Meccanica 50, 875–886. doi: 10.1007/s11012-014-0085-9
Blasi, C., and Papi, R. (1996). “Il Battistero di S. giovanni a firenze: geometria e struttura,” in Rilievi, Documenti, Indagini Strumentali, Interpretazioni: Piazza, Battistero, Campanile, ed. S. Maria del Fiore (Firenze: Il Torchio).
Boschi, S., Galano, L., and Vignoli, A. (2109). Mechanical characterization of Tuscany masonry typologies by in situ tests. Bull. Earthq. Eng. 17, 413–438. doi: 10.1007/s10518-018-0451-4
Brincker, R., Andersen, P., and Jacobsen, N. J. (2007). “Automated frequency domain decomposition for operational modal analysis,” in Proceedings of the 25th SEM International Modal Analysis Conference, (Orlando, FL).
Brincker, R., Ventura, C., and Anderson, P. (2001). “Damping estimation by frequency domain decomposition,” in Proceedings of the 19th International Modal Analysis Conference, Kissimmee, FL.
Bru, D., Ivorra, S., Betti, M., Adam, J. M., and Bartoli, G. (2019). Parametric dynamic interaction assessment between bells and supporting slender masonry tower. Mechan. Syst. Signal Process. 129, 235–249. doi: 10.1016/j.ymssp.2019.04.038
Castellazzi, G., de Miranda, S., and Mazzotti, C. (2012). Finite element modelling tuned on experimental testing for the structural health assessment of an ancient masonry arch bridge. Math. Probl. Eng. 2012:495019. doi: 10.1155/2012/495019
Cavalagli, N., Comanducci, G., and Ubertini, F. (2018). Earthquake-induced damage detection in a monumental masonry bell-tower using long-term dynamic monitoring data. J. Earthq. Eng. 22, 96–119. doi: 10.1080/13632469.2017.1323048
Chiorino, M. A., Ceravolo, R., Spadafor, A., Zanotti Fragonara, L., and Abbiati, G. (2011). Dynamic characterization of complex masonry structures: the sanctuary of vicoforte. Intern. J. Architect. Herit. 5, 296–314. doi: 10.1080/15583050903582516
Clementi, F., Pierdicca, A., Formisano, A., Catinari, F., and Lenci, S. (2017). Numerical model upgrading of a historical masonry building damaged during the 2016 Italian earthquakes: the case study of the Podestà palace in Montelupone (Italy). J. Civ. Struct. Health Monitor. 7, 703–717. doi: 10.1007/s13349-017-0253-4
Diaferio, M., Foti, D., Giannoccaro, N. I., and Ivorra, S. (2017). Model updating based on the dynamic identification of a baroque bell tower. Intern. J. Saf. Sec. Eng. 7, 519–531. doi: 10.2495/SAFE-V7-N4-519-531
Doebling, S. W., Farrar, C. R., Prime, M. B., and Schevitz, D. W. (1996). Damage Identification And Health Monitoring Of Structural And Mechanical Systems From Changes In Their Vibration Characteristics: A Literature Review. Technical report LA-13070-MS, UC-900, Los Alamos National Laboratory, New Mexico.
Erdogan, Y. S. (2017). Discrete and continuous finite element models and their calibration via vibration and material tests for the seismic assessment of masonry structures. Intern. J. Architect. Herit. 11, 1026–1045. doi: 10.1080/15583058.2017.1332255
Faravelli, L., Materazzi, F., and Rarina, M. (2005). “Genetic algorithms for structural identification,” in Proceedings of ICOSSAR 2005, Roma.
Fratini, M., Pieraccini, M., Betti, M., Bartoli, G., and Atzeni, C. (2011). Assessment of vibration reduction on the baptistery of san giovanni in florence (Italy) after vehicular traffic block. J. Cult. Herit. 12, 323–328. doi: 10.1016/j.culher.2011.01.003
Gentile, C., and Saisi, A. (2007). Ambient vibration testing of historic masonry towers for structural identification and damage assessment. Constr. Build. Mater. 21, 1311–1321. doi: 10.1016/j.conbuildmat.2006.01.007
Georgioudakis, M., and Plevris, V. (2016). “Investigation of the performance of various modal correlation criteria in structural damage identification,” in Proceeding of the VII European Congress on Computational Methods in Applied Sciences and Engineering, Crete.
Giorgi, L., and Matracchi, P. (2006). “Santa maria del fiore, facciata, corpo basilicale, cupola,” in Santa Maria del Fiore. Teorie e Storie Dell’archeologia E Del Restauro Nella Città Delle Fabbriche arnolfiane, ed. Alinea (Firenze: Alinea).
Girardi, M., Padovani, C., Pellegrini, D., and Robol, L. (2019). A model updating procedure to enhance structural analysis in the FE code NOSA-ITACA. ASCE J. Perform. Construct. Facilit. 33:e04019041. doi: 10.1061/(ASCE)CF.1943-5509.0001303
Hearn, G., and Testa, R. B. (1991). Modal analysis for damage detection in structures. J. Struct. Eng. 117, 3042–3063.
Lacanna, G., Ripepe, M., Marchetti, E., Coli, M., and Garzonio, C. A. (2016). Dynamic response of the baptistery of san giovanni in Florence, Italy, based on ambient vibration test. J. Cult. Herit. 20, 632–640. doi: 10.1016/j.culher.2016.02.007
Mares, C., and Surace, C. (1996). An application of genetic algorithms to identify damage in elastic structures. J. Sound Vib. 195, 195–215. doi: 10.1006/jsvi.1996.0416
Miceli, E., and Papi, R. (2004). “Sulla statica del Battistero alla luce delle nuove indagini e delle interpretazioni dei dati sperimentali,” in Santa Maria del Fiore e le Chiese fiorentine del Duecento e del Trecento nella Città Delle Fabbriche Arnolfiane (Firenze: Alinea).
Mottershead, J. E., and Friswell, M. I. (1993). Model updating in structural dynamics: a survey. J. Sound Vi. 167, 347–375. doi: 10.1006/jsvi.1993.1340
Ottoni, F., and Blasi, C. (2016). Hooping as an ancient remedy for conservation of large masonry domes. Intern. J. Architect. Heri. Conserv. Anal. Restor. 10, 164–181. doi: 10.1080/15583058.2015.1113335
Pandey, H. M., Chaudhary, A., and Mehrotra, D. (2014). A comparative review of approaches to prevent premature convergence in GA. Appl. Soft Comput. 24, 1047–1077. doi: 10.1016/j.asoc.2014.08.025
Pavlovic, M., Trevisani, S., and Cecchi, A. (2019). A procedure for the structural identification of masonry towers. J. Nondestruct. Eval. 38:38. doi: 10.1007/s10921-019-0575-8
Perera, R., and Ruiz, A. (2008). A multistage FE updating procedure for damage identification in large-scale structures based on multiobjective evolutionary optimization. Mech. Syst. Signal Process. 22, 970–991. doi: 10.1016/j.ymssp.2007.10.004
Perera, R., and Torres, R. (2006). Structural damage detection via modal data with genetic algorithms. ASCE J. Struct. Eng. 132, 1491–1501. doi: 10.1061/(asce)0733-9445(2006)132:9(1491)
Pieraccini, M., Betti, M., Forcellini, D., Devis, D., Papi, F., Bartoli, G., et al. (2017). Radar detection of pedestrian-induced vibrations of Michelangelo’s David. PLoS One 12:e0174480. doi: 10.1371/journal.pone.0174480
Pierdicca, A., Clementi, F., Fortunati, A., and Lenci, S. (2019). Tracking modal parameters evolution of a school building during retrofitting works. Bull. Earthq. Eng. 17, 1029–1052. doi: 10.1007/s10518-018-0483-9
Pierdicca, A., Clementi, F., Isidori, D., Concettoni, E., Cristalli, C., and Lenci, S. (2016). Numerical model upgrading of a historical masonry palace monitored with a wireless sensors network. Intern. J. Mas. Res. Innov. 1:2016. doi: 10.1504/IJMRI.2016.074748
Rainieri, C., and Fabbrocino, G. (2010). Automated output-only identification of civil engineering structures. Mech. Syst. Signal Process. 24, 678–695. doi: 10.1016/j.ymssp.2009.10.003
Ramos, L. F., Aguilar, R., Lourenco, P. B., and Moreira, S. (2013). Dynamic structural health monitoring of Saint Torcato church. Mech. Syst. Signal Process. 35, 1–15. doi: 10.1016/j.ymssp.2012.09.007
Saisi, A., and Gentile, C. (2015). Post-earthquake diagnostic investigation of a historic masonry tower. J. Cult. Herit. 16, 602–609. doi: 10.1016/j.culher.2014.09.002
Shabbir, F., and Omenzetter, P. (2016). Model updating using genetic algorithms with sequential -niche technique. Eng. Struct. 120, 166–182. doi: 10.1016/j.engstruct.2016.04.028
Torres, W., Almazan, J. L., Sandoval, C., and Boroschek, R. (2017). Operational modal analysis and FE model updating of the metropolitan cathedral of santiago, chile. Eng. Struct. 143, 169–188. doi: 10.1016/j.engstruct.2017.04.008
Tucci, G., Conti, A., and Fiorini, L. (2018). “3-D Survey and structural modelling: the case of the san giovanni baptistery in florence,” in Digital Heritage. Progress in Cultural Heritage: Documentation, Preservation, and Protection. EuroMed 2018. Lecture Notes in Computer Science, ed. M. Ioannides (Florence: Mandragora), 271–280. doi: 10.1007/978-3-030-01762-0_23
Ubertini, F., Comanducci, G., Cavalagli, N., Pisello, L., Materazzi, A. L., and Cotana, F. (2017). Environmental effects on natural frequencies of the San Pietro bell tower in Perugia, Italy, and their removal for structural performance assessment. Mechan. Syst. Signal Process. 82, 307–322. doi: 10.1016/j.ymssp.2016.05.025
Keywords: dynamic identification, operational modal analysis, modal parameters, numerical model, model updating, genetic algorithm, structural health monitoring
Citation: Lacanna G, Betti M, Ripepe M and Bartoli G (2020) Dynamic Identification as a Tool to Constrain Numerical Models for Structural Analysis of Historical Buildings. Front. Built Environ. 6:40. doi: 10.3389/fbuil.2020.00040
Received: 07 September 2019; Accepted: 19 March 2020;
Published: 09 April 2020.
Edited by:
Michele Palermo, University of Bologna, ItalyReviewed by:
Giacomo Bernagozzi, University of Bologna, ItalyLuca Zanotti Fragonara, Cranfield University, United Kingdom
Copyright © 2020 Lacanna, Betti, Ripepe and Bartoli. This is an open-access article distributed under the terms of the Creative Commons Attribution License (CC BY). The use, distribution or reproduction in other forums is permitted, provided the original author(s) and the copyright owner(s) are credited and that the original publication in this journal is cited, in accordance with accepted academic practice. No use, distribution or reproduction is permitted which does not comply with these terms.
*Correspondence: G. Lacanna, Z2lvcmdpby5sYWNhbm5hQHVuaWZpLml0