- 1Earthquake Engineering and Structural Dynamics Laboratory (EESD), School of Architecture, Civil and Environmental Engineering (ENAC), École Polytechnique Fédérale de Lausanne (EPFL), Lausanne, Switzerland
- 2Department of Civil Engineering and Architecture, European Centre for Training and Research in Earthquake Engineering, University of Pavia, Pavia, Italy
Equivalent frame models are an effective tool for the seismic assessment of existing masonry structures. Due to their simplicity, these models can be used to perform multiple nonlinear dynamic analyses, accounting explicitly for different sources of modeling and input uncertainty. In the past, equivalent frame models have been used to effectively estimate the global response of buildings whose behavior is dominated by in-plane failure modes of piers and spandrels. The recent development of a three-dimensional macroelement formulation for modeling both the in-plane and out-of-plane response extends the use of equivalent frame models to the additional study of local out-of-plane mechanisms of a building. This work applies the newly developed formulation, implemented in OpenSEES (McKenna et al., 2000), to the modeling of two shaking table tests on a stone masonry building and on a modern mixed concrete-unreinforced masonry structure. Since the approach explicitly accounts for the quality of connections in the building (i.e., wall-to-wall and floor-to-wall connections), specific elements and material models were developed for modeling these connections in an equivalent frame idealization of the three-dimensional structure. Through comparison with the experimental results, the performance of the modeling approach is discussed, and the sensitivity of the response to the major sources of modeling uncertainty (quality of connections, damping model) is assessed. The comparisons show that these new equivalent frame models can capture the onset of out-of-plane failure for historical structures with poor floor-to-wall connections and for modern URM buildings with stiff RC slabs, where the slab can uplift from the URM wall, which leads to changing static and kinematic boundary conditions of the out-of-plane loaded wall. The results further show that 1–2% of damping leads to good agreements with the experimental results if initial stiffness proportional Rayleigh damping is used.
1. Introduction
The assessment of the seismic behavior of buildings through an equivalent-frame idealization is widely used, both in research and in the professional field. It comes with a limited computational cost when compared to more detailed methods and therefore allows for performing nonlinear dynamic analyses of buildings. These other methods, such as the macro-modeling of masonry structures through continuum material models (Lotfi and Shing, 1991; Berto et al., 2002), are often based on homogenization (Milani et al., 2007; Zucchini and Lourenço, 2009; Milani, 2011) or the more complex and computationally demanding micro-modeling approaches (Lourenço and Rots, 1997; Wilding et al., 2017; Zhang et al., 2017) in which units and interfaces are modeled explicitly. Compared to these models, the equivalent-frame approach has a reduced cost and a simpler calibration procedure, which is based directly on structural element tests, since phenomenological laws are generally applied to describe the nonlinear behavior of entire elements (piers, spandrels) and to impose their displacement capacity through simple criteria, such as drift or chord rotation limits, applied at the structural element level (Lagomarsino and Cattari, 2015; Chácara et al., 2019).
The use of an equivalent-frame idealization of a building, however, requires rather strong assumptions. The first and most obvious consists of the possibility of defining a frame structure of pier elements, spandrels, and nodes that reliably replicates the layout of a façade (Berti et al., 2017). A second assumption is that the connections between the different walls of a building—provided by floor diaphragms and by the link between orthogonal walls—are sufficient to ensure that out-of-plane failure modes cannot develop before the building attains its entire in-plane capacity. Assuming this, the analysis performed through an equivalent frame model is reliable as long as local out-of-plane mechanisms do not appear. When this assumption holds, the method can be used in conjunction with numerical formulations for the elements that tackle only the in-plane response of masonry walls. This approach is common in the literature when elements to be used in equivalent frame models are defined (Roca et al., 2005; Belmouden and Lestuzzi, 2009; Lagomarsino et al., 2013; Addessi et al., 2014; Penna et al., 2014). The application of such models in nonlinear dynamic simulations proved that they can provide good estimates of the global response of a building in terms of displacement, drifts and acceleration profiles (Mandirola et al., 2016; Penna et al., 2016).
However, restricting the field of applicability of equivalent frame models to buildings with a good system of connections, which provides a sufficient restraint to out-of-plane mechanisms, can constitute an important limitation of the method when dealing with existing historical buildings which often feature timber slabs. Moreover, even in modern buildings with reinforced concrete slabs, the boundary conditions that are applied to an out-of-plane loaded element can vary with an increase in lateral deformations to the point where the element could lose the restraints against out-of-plane deformations and a mechanism can activate, as discussed by Tondelli et al. (2016). If the model does not account for any out-of-plane response, a different assessment strategy needs to be adopted for the out-of-plane mechanism, which typically consists of a rigid-body analysis of the kinematic chain that could be activated. Such an analysis, however, remains uncoupled from the in-plane assessment.
On the contrary, integrating the out-of-plane response into an equivalent frame model can directly account for the interaction of the in-plane response in determining the loads applied to an element loaded in the out-of-plane direction. In this way, the actions transmitted by horizontal diaphragms, as well as the transient variation of boundary conditions and the magnitude and phase of the accelerations imposed on the out-of-plane loaded element, can be estimated. Additionally, it is possible to relax the assumption that the out-of-plane loaded mass is rigidly lumped to the in-plane walls, which also improves the modeling of the in-plane response and the estimate of the periods and modes.
To develop such a model, however, the element formulation used for masonry members needs to properly account for their out-of-plane response. Models developed using force-based elements (Raka et al., 2015; Siano et al., 2018; Peruch et al., 2019a,b) can potentially capture the out-of-plane response, although they have not yet been used in this context. One macroelement formulation explicitly developed for this is presented in Vanin et al. (2019) and will be adopted herein. Moreover, these models require the explicit definition of modeling details that are neglected in standard in-plane equivalent-frame analyses, such as the possibly nonlinear behavior of all connections, including wall-to-wall connections at corners and floor-to-wall connections, or more generally, the nonlinear response of weak floors. In section 2, this paper presents the tools implemented in OpenSEES for developing a full three-dimensional equivalent frame model using the macroelement presented in Vanin et al. (2019) and discusses the most relevant modeling choices and their effect on the numerical simulations. The analysis concentrates on the effect of out-of-plane mass that is not rigidly lumped to orthogonal walls on the modeling of roofs and gable elements as well as on the sensitivity of the response to the assumptions related to the behavior of connections (wall-wall and wall-slab connections) and the damping. To address these topics, the results of two shake table tests will be used as a comparison for the numerical models: a stone masonry aggregate of two buildings, presented in section 3, and a modern mixed reinforced concrete/masonry structure, shown in section 4, in which out-of-plane loaded walls were subjected to variable boundary conditions depending on the in-plane global behavior. Numerical simulations are compared to experimental results in terms of global quantities (floor displacements and accelerations), local deformations (displacements of out-of-plane loaded elements, slip between wall and floors), and distribution of damage and drifts in the walls of the building.
2. Model Formulation and Implementation in OpenSEES
This section presents the new tools developed for the 3D equivalent frame models in OpenSEES (McKenna et al., 2000). These tools comprise the new macroelement formulation, which can capture the in-plane and the out-of-plane response of piers and spandrels, the orthotropic membrane element for modeling the elastic orthotropic response of floor diaphragms and the material models assigned to zero-length elements for modeling nonlinear floor-to-wall connections and nonlinear wall-to-wall connections.
2.1. Macroelement Formulation
All masonry elements, both piers and spandrels, in the following analyses are modeled through the macroelement formulated in Vanin et al. (2019) and presented in detail in Vanin (2019). Node regions between piers and spandrels are considered as rigid zones in which no deformation takes place. All macroelements are defined by three nodes (see Figures 1A–C); if nodes I and J are not located at the macroelement ends, a rigid offset, consistent with the hypothesis of rigid node regions, is defined. The used elements can capture the in-plane and out-of-plane flexural response through three sectional models applied at the element ends and at the central section, which can reproduce the deformation modes shown in Figures 1A–C. Those sections are equipped with the section model presented in Vanin et al. (2019), accounting for a no-tension material with limited compressive strength, modeling possible crushing at the section edges. The compressive behavior of the material is defined by a damage law which imposes no post-peak strength degradation and unloading to the origin. The cyclic behavior in flexure is therefore governed by the decompression of the section; little energy dissipation takes place only as a consequence of crushing.
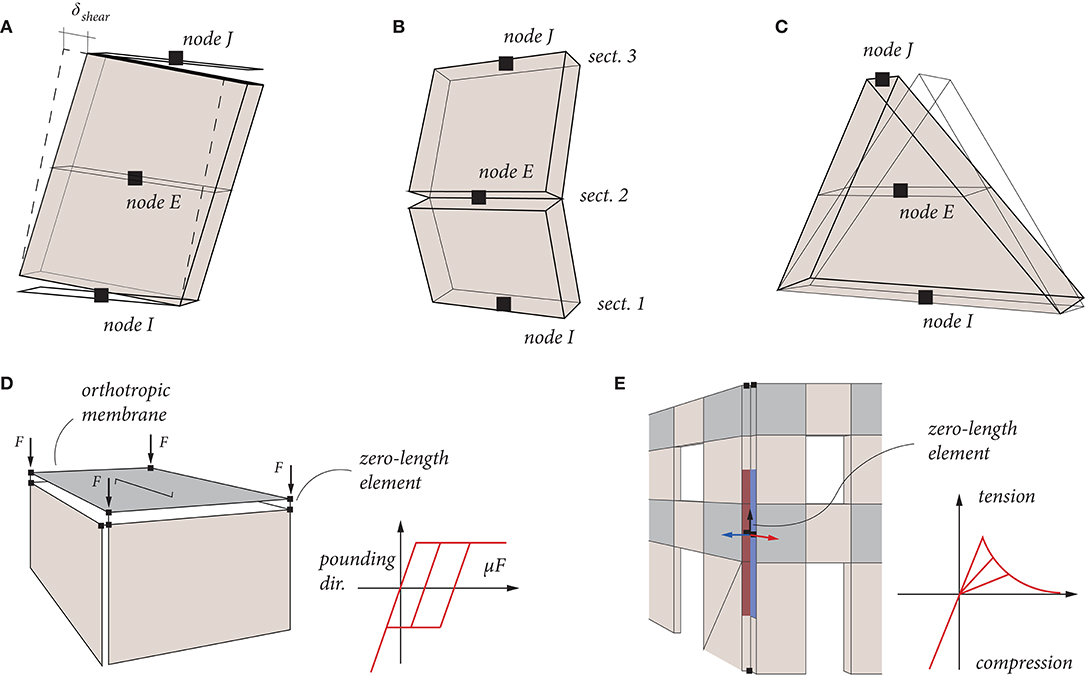
Figure 1. (A) In-plane and (B) out-of-plane deformation of the applied macroelement formulation, including flexural and in-plane shear components; (C) gable elements used in the simulations; (D) definition of zero-length elements for modeling the interaction between orthogonal walls; and (E) the floor-to-wall connection that allows for frictional beam slip and pounding.
The shear model, defining the shear deformability and force capacity in the in-plane direction, is based on a Mohr-Coulomb failure criterion, i.e., by a frictional contribution governed by a friction coefficient and a cohesive contribution, attributed to the gross sectional area, governed by a cohesion parameter. The energy dissipation in hysteretic cycles and progressive stiffness degradation are controlled by a damage and plasticity model. Shear deformations in the out-of-plane direction, as well as torsional deformations, are modeled as linear elastic. Further details on the element formulation are presented in Vanin et al. (2019) and Vanin (2019), to which the reader is referred. To capture the out-of-plane behavior of the element, a P − Δ formulation is applied. Since stone masonry buildings often include also gables, triangular gable elements that are based on the same formulation are implemented. These elements are equipped with a section that decreases in size along the height of the elements and with a consistent mass matrix derived specifically for triangular elements. Based on the section rotations and lumped shear deformations at the central node, the element can calculate drifts values separating flexural and shear deformation components. A failure drift model, for each failure mode, can be implemented, causing complete loss of lateral strength; however, for the present study, no element drift failure criterion was used.
2.2. Orthotropic Membrane Elements
The floor stiffness is a key aspect in equivalent frame models of existing buildings, as these buildings often feature deformable timber floors, which cannot be idealized as rigid diaphragms. Such elements present some stiffness in the main direction of the floor, parallel to the principal beams, and a lower stiffness in the orthogonal direction and in shear deformations. To properly account for their deformability and allow for comparisons between results of different models, the same orthotropic elastic model assumed in the software Tremuri (Lagomarsino et al., 2013) was implemented in OpenSEES as a section model to be applied to quadrangular shell elements. The model accounts only for membrane stresses (σx, σy, and τxy, referred to the material axes x and y) and provides no stiffness to bending deformations. Such stresses are related to local deformations through:
where Ex is the E-modulus in the direction of the principal beams, Ey is the E-modulus in the direction orthogonal to the principal beams, e is the ratio between the two E-moduli, i.e., . The stiffness of the orthotropic membrane is further defined by the Poisson's ratio ν and the shear modulus Gxy, which is independent from the other parameters. Section forces are then obtained simply by integrating the constant membrane stresses along the element thickness. The parameters Ex and Ey are referred to the material axes, whose orientation is defined by the angle with respect to the local axes of the shell element. If the element is defined between four nodes I, J, K, and L, the such local orientation is given by the average direction of sides IJ and LK.
2.3. Nonlinear Floor-To-Wall Connections
If it is assumed that deformable floors remain linearly elastic throughout shaking, the connection between floor and wall must properly account for their nonlinear behavior and possible connection failure at the beam support. If the expected source of nonlinearity is a slip of the beam with respect to the wall, the connection can be modeled through a zero-length element to which a frictional model is assigned. Such a simple frictional model is shown schematically in Figure 1D. In this model, the nodes of the floor must be modeled independently from the nodes of the walls to capture possible relative displacements. The two displacement components of the slip—orthogonal and parallel to the wall orientation—can be modeled by a single three-dimensional interface. Since the interaction between floors and walls can depend on particular phenomena (pounding toward the walls, possible sliding only in the beam direction, loss of contact due to excessive sliding) not captured by a generic friction model, a specific law governing the floor slip was implemented in OpenSEES.
The implemented model features zero shear strength when traction deformations are applied. When subjected to compression, the connection can transfer transversal forces proportional to a friction coefficient μ in the plane of the floor. The model has been implemented in 3D, i.e., an axial force N causes a shear resistance in two orthogonal directions, assuming a coupled circular strength domain. In the following, the sliding is assumed to only take place in the direction perpendicular to the wall, while in the direction parallel to the wall the floor beams are assumed to be fully able to transfer loads through a linear elastic model. When calculating a new state at step n + 1 from the last converged step n, corresponding to the increment of deformations (Δu, Δv) in the vertical load direction and in the direction of sliding, respectively, a trial state can be estimated as:
where kN and kV are the penalty stiffness applied in the vertical and transversal directions. The condition to check the sliding is given by the yield function f:
When the condition f ≤ 0 is not met, sliding can occur. Assuming zero dilatancy, the correction to be applied to V is calculated as:
In the following analyses, it is further assumed that no slip toward the wall is possible, i.e., in the direction of the wall the floor-to-wall connection is modeled as elastic. This condition is applied simply by forcing the value of to be non-negative after every update, as defined in Equation (4). For corner nodes, the floor node needs to be connected to the nodes belonging to the wall perpendicular to the main direction of the floor to apply loads and restraints against an out-of-plane mechanism to the correct elements.
2.4. Wall-To-Wall Connections
The connection between orthogonal walls is also modeled through zero-length elements. The connection can potentially exhibit a nonlinear behavior, for example, through the development of a vertical crack, which can lead to an out-of-plane overturning of one façade. This can be modeled in a simplified approach through point connections at the corner nodes, to which appropriate tensile properties are assigned. The maximum tension force that the interface can transfer can be defined by the integration of a tensile strength assigned to the masonry along a tributary section, as shown in Figure 1E. Alternatively, more precise modeling can be obtained through the use of fiber sections, which are assigned to the zero-length element. However, these were not used in this study.
To apply a simple material model, the following interfaces use a material model specifically implemented for this scope in OpenSEES, featuring a linear elastic response in compression and a damage tension law with exponential softening. The material is defined only by its elastic properties, the tensile strength, and its fracture energy in mode I opening, representing the area under the stress-displacement relation that it describes. Such material model can account in a simplified way for the force transfer along a certain corner crack length, deriving from tensile contributions of cracks through head-joints and frictional contributions along bed-joints. However, being a uniaxial material law, it cannot capture friction phenomena deriving from the interaction between the two façades. Such phenomena, however, should not be of primary importance when uniaxial time-histories are applied, as presented in the following case-studies.
3. Stone Masonry Building
The first case study for the proposed equivalent frame model approach accounting for out-of-plane behavior and complex nonlinear connections is a stone masonry building recently tested on a shaking table in EUCENTRE, Pavia (Italy) (Guerrini et al., 2019; Senaldi et al., 2019). The building, built in half scale due to the space limitations imposed by the testing equipment, is composed of two adjacent units of different heights, with a weak connection between them (Figure 2). Its characteristics, in terms of openings layout, dimensions, height, structure, and inclination of roofs, are intended to reproduce the typological characteristics of the historical building stock of the city of Basel, Switzerland. The building is made of two-leaf stone masonry walls of reducing thickness along the height (starting from 35 to 25 cm). Because the test unit represents the prototype at half scale, scaling laws for time, mass, and stiffness/strength properties were applied. The scaling of material properties was approximated by the use of expanded polystyrene spheres added in 40% proportion to the mortar (Senaldi et al., 2019).
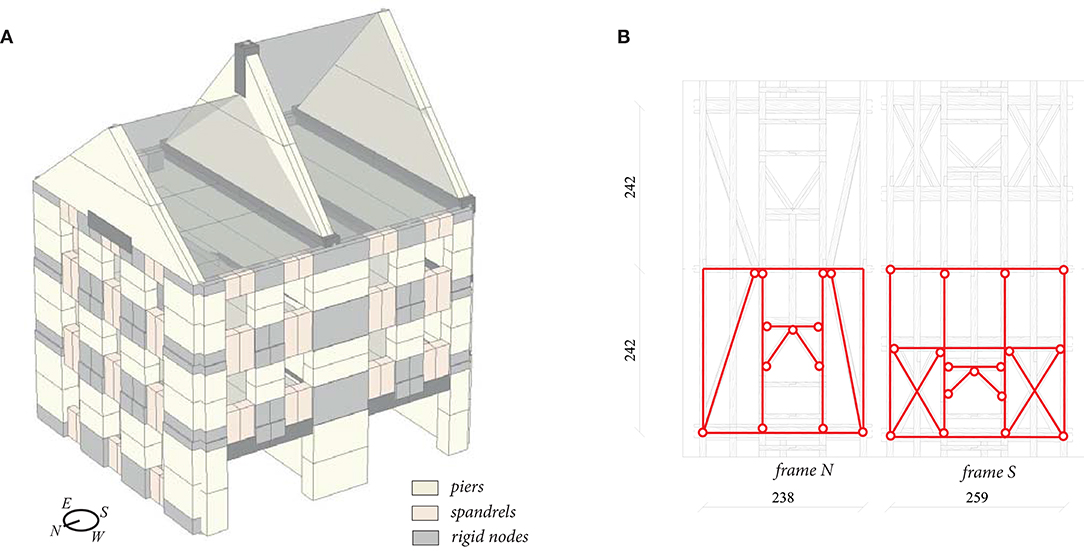
Figure 2. Stone masonry building: (A) equivalent frame model of the complete building and (B) estimate of the roof diaphragm stiffness through an equivalent system of trusses.
The shake table test applied a uni-directional ground motion, which acted parallel to the East and West façade (Figure 2). The East and West façade were therefore loaded in-plane while the three gable walls were loaded out-of-plane. The horizontal diaphragms are timber floors with a single layer of planks, which are therefore deformable in-plane. The orientation of the floor beams varies between stories, i.e., the beams on the first two floors span parallel to the orientation of the shaking, i.e. in East-West direction, while the third floor beams span perpendicularly, in North-South direction. As a result, the third floor provides a much weaker constraint to the out-of-plane loaded elements. A stiffer system of trusses constitutes the roof structure, as shown in Figure 2B.
The structure was subjected to ground motions of increasing intensities. First, some low-intensity records were applied (Senaldi et al., 2019), which will not be simulated here, since they did not produce any significant damage that could have affected the performance of the structure when subjected to higher intensity records. The main shaking was obtained by scaling the Montenegro earthquake (1979). The available data include acceleration measures, relative displacements between the structure and a stiff steel frame placed inside the structure that moved with the shaking table, and the displacements measured through an optical system of grid markers in the south, east, and north façades. The prototype was subjected to eight main runs which applied ground motions with a peak ground acceleration (PGA) of up to around 0.35 g (175% of the original record). At this PGA, the initiation of an out-of-plane deformation of the south gable was observed. Before the building was subjected to ground motions of higher intensities, the connection between floors and walls was improved by activating some previously installed connectors (Guerrini et al., 2019). For the scope of study, we analyze only the first eight runs that were performed on the building with weak connections. A more detailed description of the building prototype, construction details, and testing procedure are given in Senaldi et al. (2019), to which the reader is referred.
3.1. Model Calibration
An equivalent frame model of the building has been defined as in Figure 2A. The gables were modeled through single triangular elements, to which an exact mass distribution is applied. The element can overturn around the edge of the base section. Despite the low level of interlocking at the interface, the connection between the two units showed little damage, and no significant pounding between the two buildings was observed. For this reason, the central pier is modeled through a single element. The lintels over the ground floor openings, connected to the nodes of the above piers, are modeled as simply supported on the adjacent piers, i.e., they cannot transfer horizontal forces to the supporting elements. In such way they are able to provide a restraint against vertical displacements of the above piers, without acting as a reinforcement to the first-story spandrels. The regions over the ground floor openings are considered as subdivided into two spandrels and a rigid node, following the opening layout of the upper story. The experimental crack pattern did not include any relevant damage to the regions modeled as a rigid node. Since the thickness reduction of the walls takes place at the floor levels, spandrels are assigned a constant average thickness through their height.
Floors are modeled through orthotropic membrane elements as presented in section 2.2. The shear modulus of the single-plank diaphragms was assumed to be 10 MPa; this stiffness was determined according to the approach proposed in Brignola et al. (2008). The roof stiffness, due to the presence of a system of trusses, is considerably higher. From linear elastic analysis of the static system shown in Figure 2, the stiffnesses of the two trusses are assumed to be 3.70 and 6.60 kN/mm, respectively, for the north and south roof elements.
The masonry properties were derived from various tests on panels constructed with the same masonry typology as used for the construction of the building. These tests included uniaxial compression tests, diagonal compression tests (Senaldi et al., 2019), and four shear-compression tests on two squat (H = 1.45 m, L = 1.17 m, t = 0.30 m) panels and two slender panels (H = 1.80 m, L = 0.60 m, t = 0.30 m), representing the dimensions of the ground story piers of the east façade. Results of the calibration against such tests are presented in Figure 3 for two panels of the squat series (CT) and one of the slender series (CS). The level of precompression varies from 0.2 MPa (CT02, CS02) to 0.5 MPa (CT01), resulting in different failure modes (shear or flexural/hybrid). The most reliable source for the estimate of the lateral stiffness and strength of the masonry elements was considered to be the shear compression test series, which was also based on the results presented in Vanin et al. (2017). A Young's modulus E equal to 2170 MPa was derived from the average of the initial lateral stiffness measured in the four shear-compression tests, assuming a G/E ratio of 0.30 (with G therefore equal to 650 MPa). Such G/E ratio was chosen based on the indications provided in the Italian code (MIT, 2009) for different stone masonry typologies. Although an isotropic material could not have a G/E ratio lower than 0.33, lower values can be found in the literature for masonry (Bosiljkov et al., 2005; Petry and Beyer, 2015) and are derived theoretically if the material is considered as an homogenized continuum made of isotropic elastic components (Wilding et al., 2019). Since the model accounts explicitly for stiffness loss in the pre-peak phase, the E- and G-moduli were chosen to represent the initial rather than the effective stiffness.
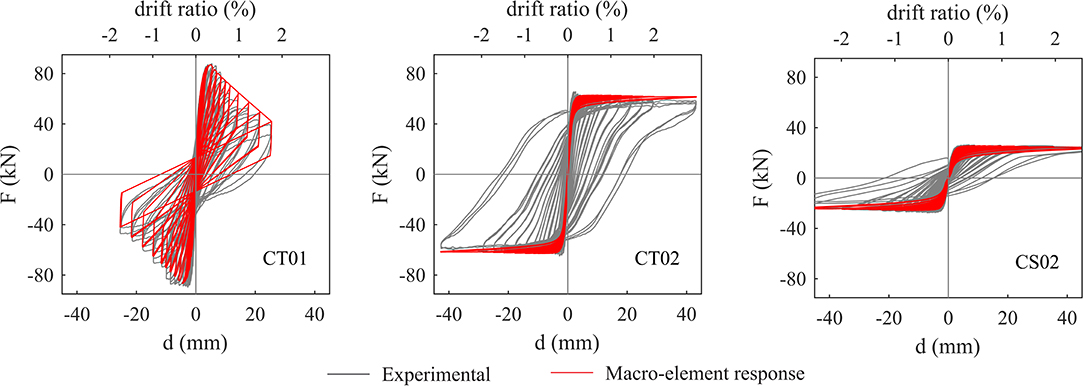
Figure 3. Stone masonry building: calibration of the mechanical properties of the macroelements against three shear compression tests performed on masonry of the same typology as the prototype.
The non-linear properties are calibrated based on the shear-compression tests, as well. Assuming a friction coefficient μ0 = 0.40, a value of cohesion c = 0.09 MPa could be derived. The residual friction coefficient μR, controlling the shape of hysteresis cycles, is assumed to be 0.10. The 20% post-peak force drop is calibrated to be reached at a drift of 0.8%. Complete loss of lateral strength, when exceeding a drift criterion, was not considered in the following analyses, for neither flexural nor shear failure modes. The compressive strength derived from compression tests (equal to 1.30 MPa) lead to an underestimation of the force capacity of the walls used for calibration showing a flexural failure mode. It might be assumed that higher stresses than the compressive strength measured in a compression test of an entire wall can be attained locally, where stresses spread through bigger units and there are few joints in which cracks can develop (Petry and Beyer, 2015; Vanin et al., 2017). Based on this assumption the compressive strength was calibrated to a value of 2.20 MPa to correctly reproduce the force capacity of slender piers. The same set of properties was applied to pier and spandrel elements.
The mass of masonry elements is considered to be distributed along their axes; the floor masses, including some additional masses that were placed at the floor levels, are lumped to the corner nodes. The total mass of the model, consistent with the tested prototype, is equal to 82.1 t. The first three modal shapes and periods of the numerical model agree reasonably well with those extracted from dynamic identification of the physical model. Results are compared in terms of modal shapes, frequencies and MAC values in Figure 4. It is worth noting that modeling the roof structure led to a significant shift of the modal properties compared to the model with rigidly lumped gable and roof masses. This is also due to the particularly high aspect ratio of the south gable. Further calibration of the elastic properties of floors and masonry elements could improve the match; however, values obtained directly from tests shown in Figure 3 are applied in all following analyses.
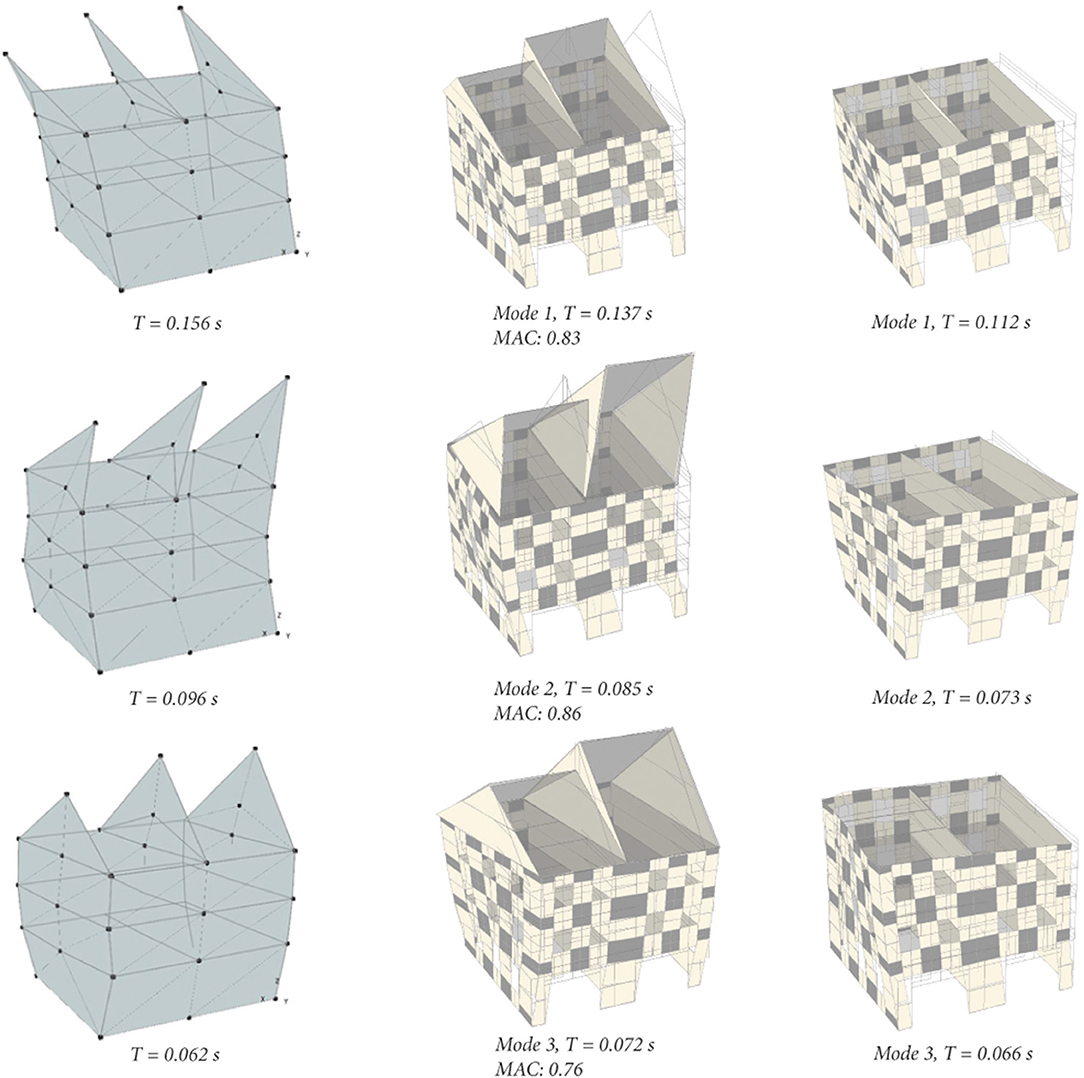
Figure 4. Stone masonry building: modal analysis of the complete model and simplified model without explicitly modeling the gable. Modal shapes and periods are compared to the results of the dynamic identification.
3.2. Sensitivity Analysis
A set of non-linear dynamic analyses of the building was performed with the objective of identifying the effect on the seismic response of two major sources of uncertainty for the modeling of this building, i.e., the damping model and the modeling of connections. Since cracking at the corners was not observed during the physical test, a rather high value of tensile strength equal to 0.05 MPa was assumed for wall-to-wall connections, ensuring a linear behavior until an irreversible out-of-plane displacement of a façade took place. For the other two parameters, which were the friction coefficient assigned to the floor-to-wall connections and the damping ratio, a factorial combination on three levels was assumed. The damping ratio was varied between 1, 2, and 3%. A Rayleigh damping model, proportional to the mass and the initial stiffness matrix was assumed. The damping ratio was applied at the period of the first mode in the direction of shaking and at three times the such period to obtain a rather large period interval inside which the damping ratio was approximately constant, considering that damage accumulation also produces a period shift in the model. The friction coefficient was varied in the range of 0.80–1.00–1.20 to obtain a variation of the floor-to-wall connection effectiveness.
Each of the nine models was subjected to the entire sequence of eight ground motions, modeling the accumulation of damage as in the shake table test. Figure 5 shows a comparison between failure modes and maximum total drifts on the macroelements, i.e., by the sum of flexural and shear drifts. For out-of-plane failure modes, the magnitude of the out-of-plane displacement components of each element are shown by the color scale to highlight the failure mechanism. A high model sensitivity is observed for the assumed damping ratio, which influences both the maximum drifts on the masonry elements and the failure mode itself for models with weaker connections.
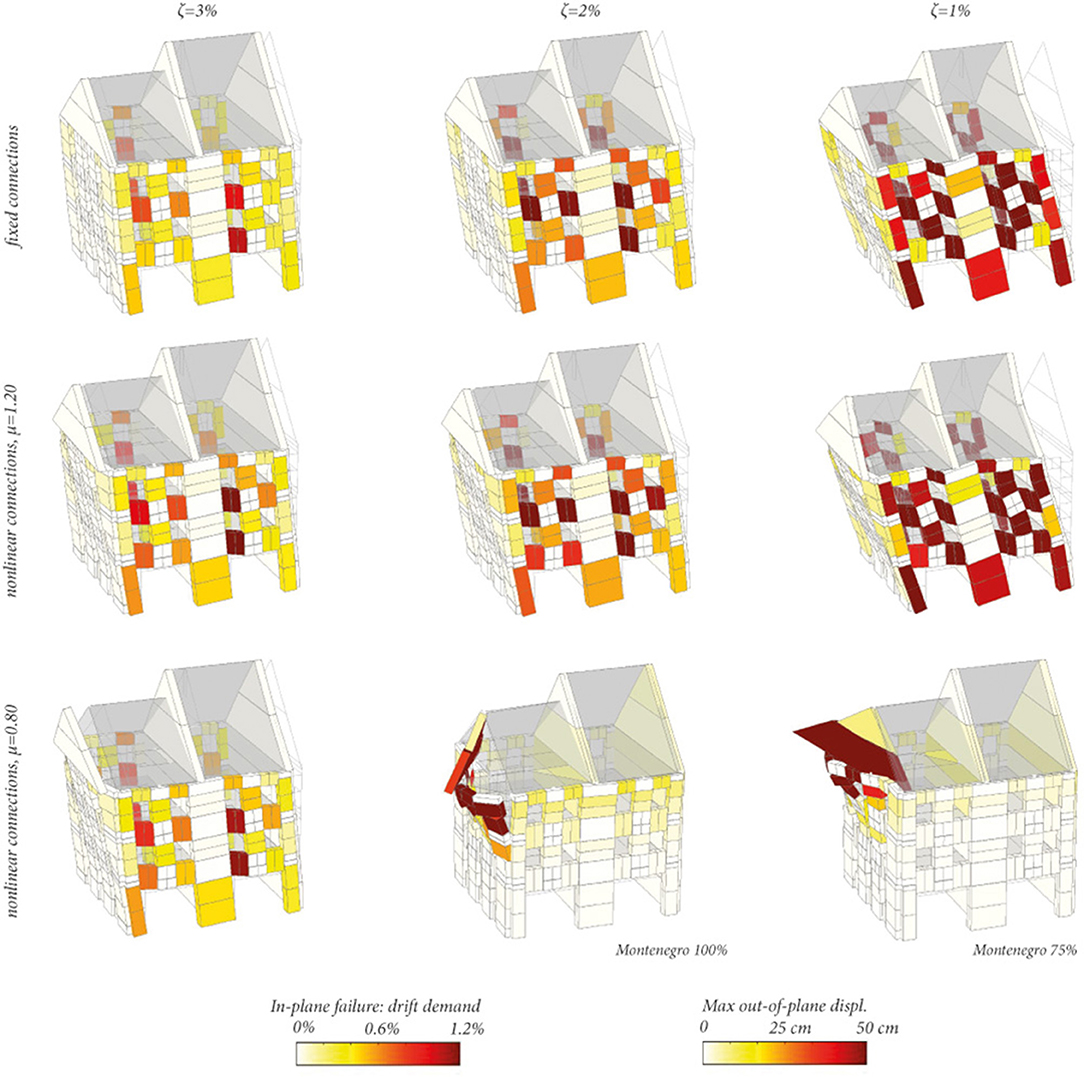
Figure 5. Stone masonry building: sensitivity of failure modes to the effectiveness of floor-to-wall connections and to the damping ratio ζ. Deformation scale: 25 (in-plane failure modes), 1 (out-of-plane mechanisms).
Also the friction coefficient of the wall-to-floor interfaces influenced the failure mode. The maximum transversal load transferred from the floors to the walls was given by the friction coefficient and by the compression force that was attributed to each interface. For all floors, 80% of the vertical load was attributed to the walls between which the floor spans, and the remaining 20% was attributed to the walls parallel to the span. Since this ratio is rather arbitrary, physically high values for the friction coefficient could be linked to an underestimation of the compression on the walls parallel to the floor span and should be interpreted simply as an increase of the effectiveness of the connection between floors and walls. However, results clearly show that an increase in force transfer between floor-to-wall connections produces a change in the failure mode, which passes from an out-of-plane failure mode to an in-plane behavior. The higher vulnerability of the top story to out-of-plane failure corresponds with the experimental observations; it is due to the different floor orientations. The roof trusses are parallel to the gable walls while the second floor beams span orthogonal to the gable walls.
The comparison between numerical and experimental maximum displacements at the upper story (Figure 6A) and at the gable level (Figure 6B) shows that the set of analyses best predicting the experimental values is the one performed with a 1% damping ratio. With higher damping ratios, the damping forces (summing up to 20–25% of the total base shear when a damping ratio equal to 3% is adopted) excessively reduce the displacements on the building, The difference between models adopting different damping ratios is more evident for higher intensity ground-motions, when the nonlinear behavior of the elements, rather than their elastic properties, governs the building response.
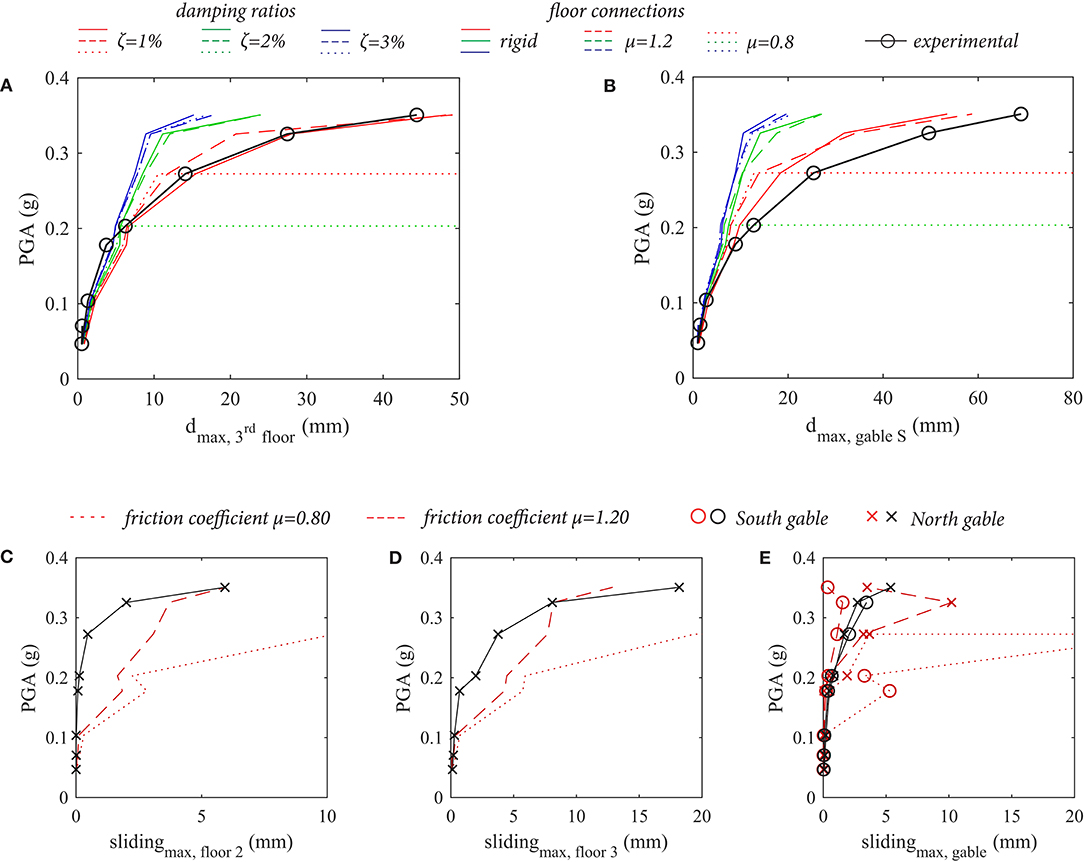
Figure 6. Stone masonry building: estimates of global response quantities with models featuring rigid floor-to-wall connections or nonlinear connections. (A) Third-floor maximum displacement, (B) gable maximum displacement, sliding between diaphragms, and walls for ζ = 1% at the second (C) and third (D) floor, and between the roof and the gable (E).
As long as the force transfer is sufficient to prevent out-of-plane failure, the different assumptions on the effectiveness of connections do not lead to a considerable change in global deformation parameters. However, the rigid connection hypothesis yields a correct estimate of the global response only in the case in which such response is substantially in-plane, as it was in the analyzed case. If the response to be modeled features relevant out-of-plane deformations, then the non-linearity of floor connections is a key aspect to be captured. In the presented case-study, when the relative sliding between floors and walls becomes more relevant (Figures 6C–E), the deformable connection model starts capturing the phenomenon with better accuracy than the rigid connection model, which is instead adequate for lower level of seismic intensity. The quantitative comparison between experimental and numerical sliding shows however some differences and a considerable sensitiveness to the adopted friction coefficient. When the highest level of connection strength is adopted (μ = 1.20), numerical and experimental sliding values can be compared in terms of seismic intensity at which the sliding becomes relevant and, numerically, in terms of order of magnitude of displacements.
3.3. Time-History Response
The best result of this sensitivity analysis in terms of predicted maximum displacement at the top story and local sliding are obtained for the analysis with a damping ratio of 1% and a friction coefficient equal to 1.20. For this set of parameters, also the force-displacement response (Figure 7) and the time-history response (Figure 8) of the model agree well with the experimental results.
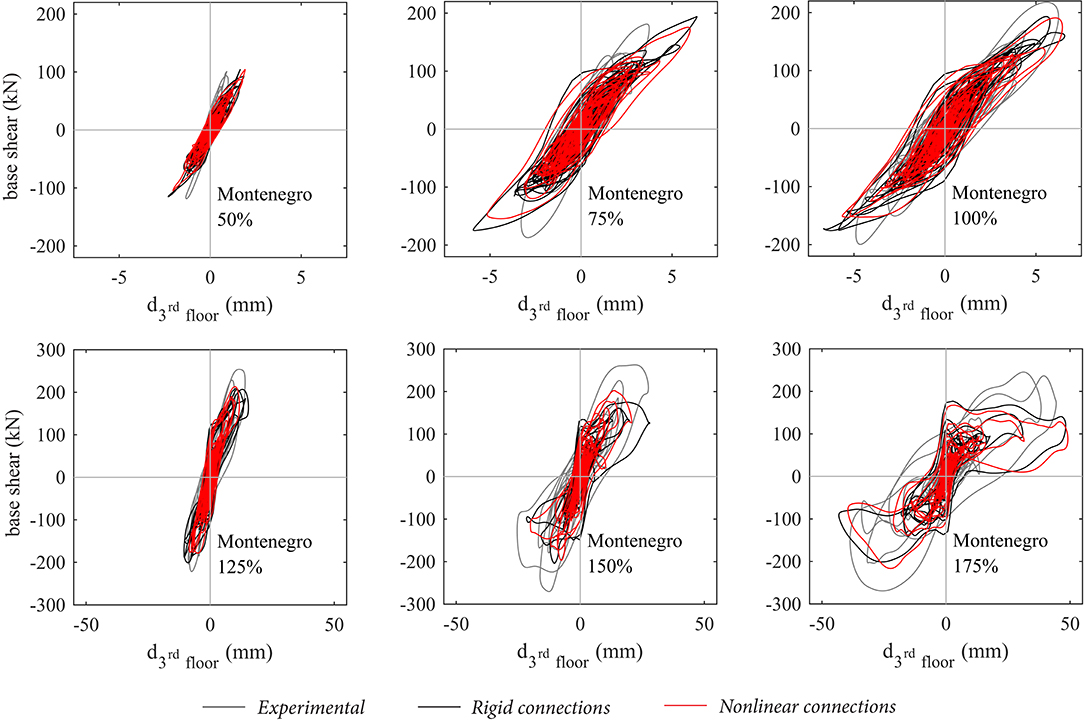
Figure 7. Stone masonry building: comparison between experimental and numerical force-displacement global response.
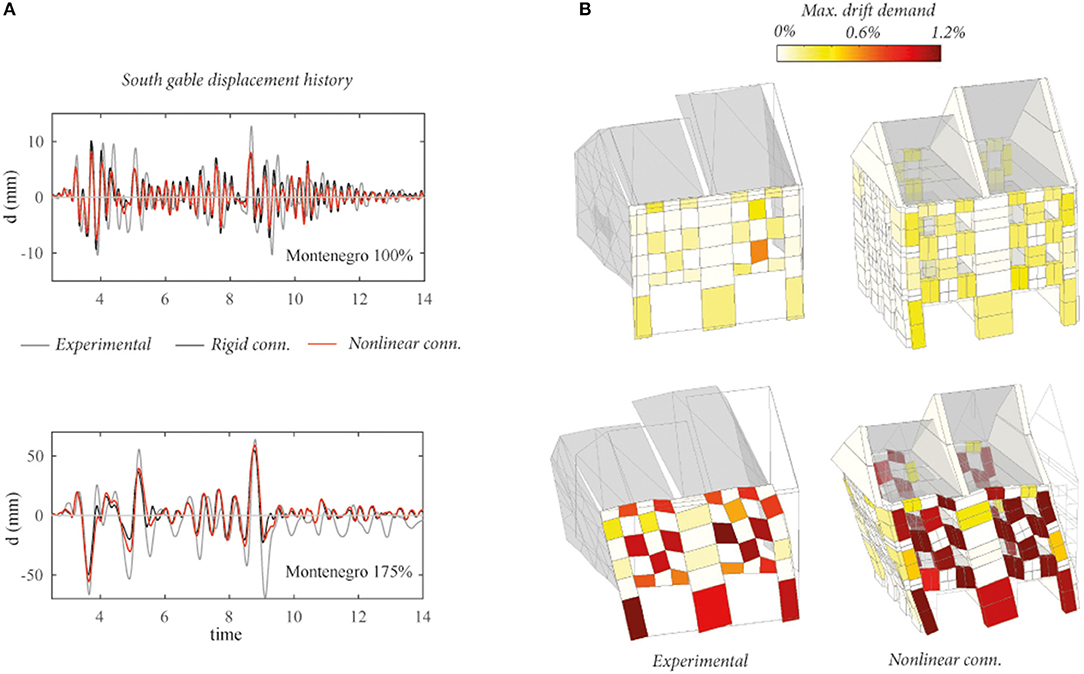
Figure 8. Stone masonry building: (A) time-history displacement d of the South gable; (B) comparison between maximum total experimental and numerical element drifts.
Experimental displacement measures are obtained from hard-wired measures of the relative displacements between the floors and the fixed reference steel frame. The base shear is obtained from the accelerations measured by all available accelerometers, to each of which a share of the total mass of the building is attributed. The maximum experimental drift on every element of the east façade is obtained by discretizing the wall into piers, spandrels, and nodes and computing deformations from the optical displacement measurements Senaldi et al. (2019). For the pier elements of the upper stories the rigid body rotation was removed. It was estimated from the average rotation of the two horizontal sides of the node below the element. This approach of post-processing the optical displacement measurements, however, introduces a certain degree of approximation in the comparison between numerical and physical models. In the numerical model the nodes are modeled as rigid while in the physical model they are not. However, in the numerical model part of the nodal deformations are actually captured by the pier elements. This applies in particular of flexural cracks of the physical model that are in the nodal region but close to the piers or spandrels. Since flexural and shear components of deformation could not be extracted from the experimental displacements, only total drifts are compared.
The extent of damage to piers and spandrels is driven by the shear deformations while flexural deformations do not affect the damage level of piers and spandrels significantly. Since the base piers of the east façade are subjected to mainly flexural/rocking deformations, the maximum total drift to which they were subjected is not representative of the expected damage level on every element. The experimentally surveyed crack pattern (Figure 9) correlates much more closely with the maximum shear drifts on the elements, i.e., the drift computed from shear deformations only. A concentration of damage is predicted on spandrels, whereas little damage is predicted on piers. The magnitude of shear drift corresponding to cracking of the spandrels is on the order of 0.2%, while severe and extensive damage on spandrels corresponds to a maximum shear drift that often exceeded 0.6%.
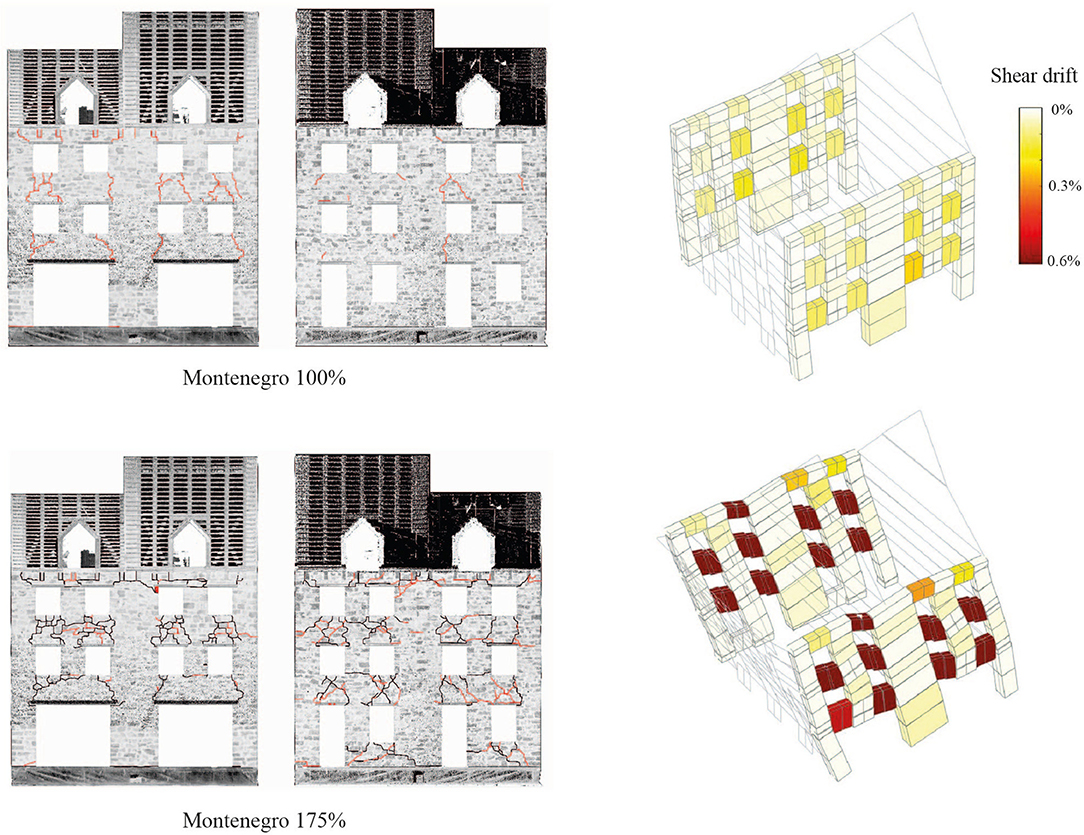
Figure 9. Stone masonry building: comparison between experimental crack patterns and shear drifts in the elements after Montenegro 100% and Montenegro 175%.
Given an appropriate set of model parameters, this equivalent frame model predicts the magnitude of the experimental displacement, as well as the failure mode and the distribution of the maximum drift on elements, with sufficient precision, both at lower ground-motion intensities and at the most severe shaking. While the drifts and displacements for low seismic intensity are well-estimated by all analyzed models, the response at higher seismic intensities is rather sensitive to the model parameters, mainly the damping ratio and the connection strength. When predicting the seismic behavior of a building rather than the here presented posterior analysis of a shake table test, a probabilistic approach considering different scenarios seems necessary and can improve insights into the possible structural behavior of the building when such information is not available.
4. Mixed Reinforced Concrete/Unreinforced Masonry Structure
The effectiveness of the modeling approach in capturing complex interactions between in-plane and out-of-plane building responses was tested by modeling a modern mixed reinforced concrete (RC) and unreinforced masonry (URM) structure. This four-story structure was also tested on the uni-directional shaking table at the EUCENTRE, Pavia. During the last test of this building, before reaching failure of the in-plane loaded URM walls of the first and second story, one of the out-of-plane loaded URM walls of the fourth story failed (Beyer et al., 2015). The test specimen was symmetrical with regard to the north-south axis. The façades that were loaded in-plane, i.e., the East and West façades, featured two URM walls, not confined by any RC frame, and one RC wall each, toward the south side (see Figure 10). In the out-of-plane direction, one URM wall was present at each side. All slabs were RC slabs. The building was designed to address, among other topics, the different response of out-of-plane loaded URM walls when flanked by RC and URM walls, respectively. For this reason, the RC walls were grouped at the south end of the building. The out-of-plane loaded URM wall of the south side was therefore flanked by two RC walls and the out-of-plane loaded URM wall of the north side was flanked by two URM walls. The test results showed that the URM wall flanked by URM walls was much more vulnerable to out-of-plane loading than the URM wall flanked by RC walls. The underlying mechanism was described in Tondelli et al. (2016) and is briefly summarized below.
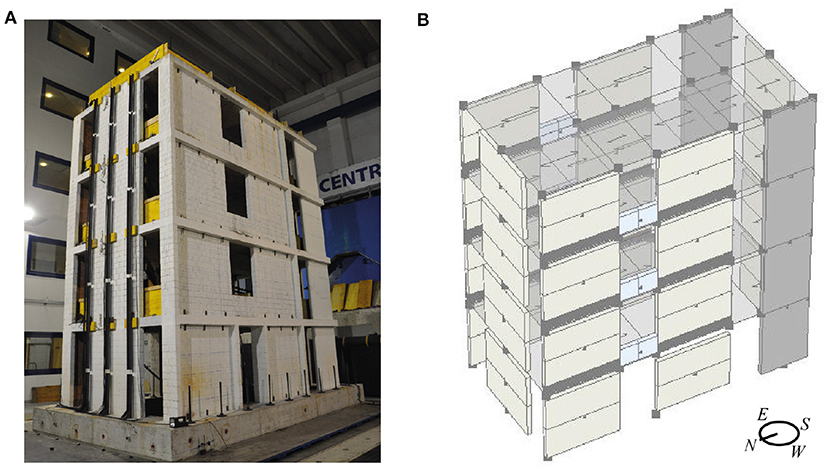
Figure 10. Mixed RC/URM building: (A) test prototype on the shaking table, and (B) equivalent frame model of the building.
The building was subjected to nine main ground motions of increasing intensity, obtained by scaling the ground motion of the Montenegro earthquake (1979), i.e., the same ground motion that was used for testing the stone masonry building. This building was also instrumented with accelerometers and potentiometers measuring local deformations, including the out-of-plane deformation of the walls at all stories, which will be compared in the following to the deformations predicted by the numerical model. Story displacements are derived from an optical measurement system equivalent to the one used for the building in section 3. The base shear was calculated from the recorded accelerations, to which a tributary mass was assigned. In the last two runs, the accelerometers at the two upper stories were saturated, so the accelerations were calculated from the displacement histories recorded by the optical measurement system. The data processing is presented in more detail in Beyer et al. (2015).
The out-of-plane loaded wall of the fourth story of the north side collapsed during the last run, and this was previously studied in Tondelli et al. (2016) with the use of a discrete element modeling approach. Tondelli et al. (2016) modeled a story-high wall and subjected it to the experimentally recorded horizontal and vertical velocity histories of the third and fourth floor slabs at the north end of the building. These velocity histories also described the change of boundary conditions due to the slab uplift as a result of the rocking of the in-plane loaded URM walls of the fourth story of the building. The walls at the north end rock when the building moves in the southern direction. When the out-of-plane URM wall loses contact with the top slab, its axial load is reduced and it loses the constraint against axial elongation, which triggers an out-of-plane mechanism toward the interior of the building. It can be assumed that when the vertical constraint is lost, the horizontal constraint remains effective (Tondelli et al., 2016). In the test setup, a support against out-of-plane collapse was placed at 60 mm distance from the out-of-plane walls for safety reasons, which was touched during the last run and therefore this wall was considered collapsed. The objective of this case study is to investigate whether the new equivalent frame model can capture this out-of-plane failure, which requires capturing the in-plane response of the piers of the east and west facade and the out-of-plane response of the north pier for variable boundary conditions at the top of the pier.
4.1. Model Calibration
The discrete element model of the isolated fourth story wall, subjected to the recorded accelerations and boundary conditions, correctly captures the failure mechanism. In this study, the same problem is assessed through an equivalent frame model (Figure 10) that models both story accelerations and the slab uplift as a function of the in-plane behavior. Concrete walls are modeled through a single force-based beam element per story, with five integration points. A fiber section approach is used to model the sectional behavior. Since local deformations in the concrete elements are not of interest, the force-based element approach is considered sufficiently accurate for the scope of the study. Unreinforced masonry elements, both piers and spandrels, are modeled with a single macroelement. For pier elements loaded in their out-of-plane direction, further discretization was not considered necessary since the location of the hinge of the out-of-plane mechanism in the test was close to the midheight (Tondelli et al., 2016). The slabs were modeled with elastic shell elements. Unlike in the model of the stone masonry building where orthotropic membrane elements were used to represent the slabs, the RC slabs of the mixed building had a considerable bending stiffness and were therefore modeled with shell elements.
The material properties of concrete and steel were derived from material tests as described in Beyer et al. (2015). The compressive strength of concrete was set to 39 MPa for the whole section; the yield strength of the steel was set to 530 MPa. As for the building in section 3, the material properties of URM elements were extracted from the available shear-compression tests (Petry and Beyer, 2014) performed for characterizing the material. The test series included five tests, wherein different boundary conditions (ratios between shear span and wall height ranging between 0.5 and 1.5) and axial loads were applied. From the series, two tests that developed shear failure are plotted in Figure 11. The Young's modulus of masonry is assumed to be 4,500 MPa, and the shear modulus to 1,500 MPa. The compression strength derived from compression tests, equal to 5.66 MPa, sufficiently describes the response of the flexural panels. A cohesion of 0.23 MPa and a friction coefficient μ0 = 0.23 define the maximum shear strength. The hysteretic dissipation and the post-peak force drop are defined, respectively, by a residual friction coefficient of μR = 0.15 and a 20% force drop at a drift of 0.25%. Such values, as well as the elastic properties, are obtained by calibration against the available shear-compression tests.
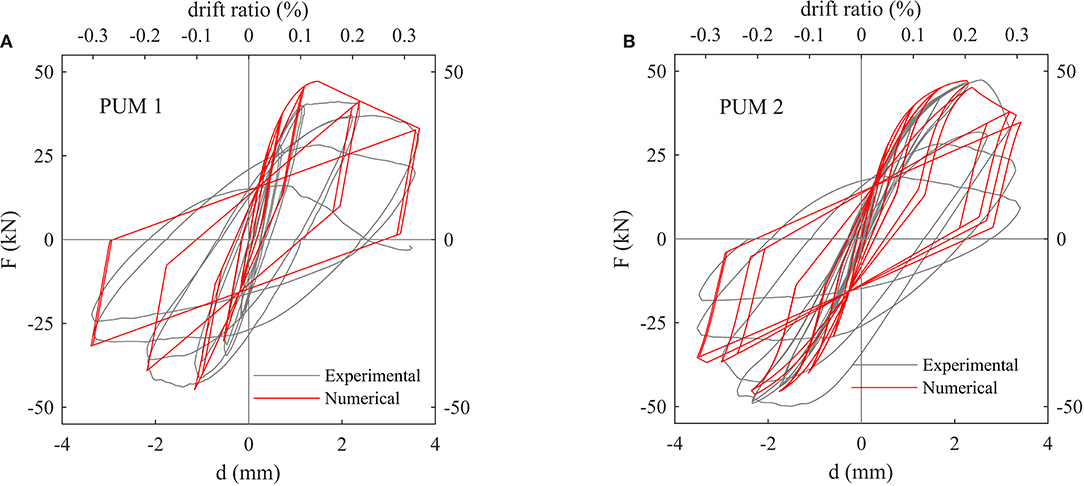
Figure 11. Mixed RC/URM building: calibration of the numerical shear model based on two shear compression tests, (A) PUM1 and (B) PUM2, on scaled masonry walls, as described in Petry and Beyer (2014).
4.2. Time-History Response
The simulations of the nine experimental runs were performed by applying the accelerogram recorded at the level of the shaking table. Two models, featuring damping ratios of 1% and 2%, were considered. The reference periods used to calibrate the damping model were the period T1, relative to the first mode, and 3T1 The damping model was assumed to be a Rayleigh damping proportional to the initial stiffness only to avoid excessively damping the out-of-plane oscillations of the masonry elements, which increase considerably in period as a function of their amplitude. The global response, as shown in Figure 12, is better predicted by the 1% damping ratio model, though both models reasonably predict both the maximum displacements and accelerations at the top floor. The out-of-plane local displacements predicted for the north-side walls are shown in Figure 13. The initiation of the phenomenon is captured at the correct seismic intensity by both models, and the magnitude of the out-of-plane displacement is better described by the model with the lower damping ratio.
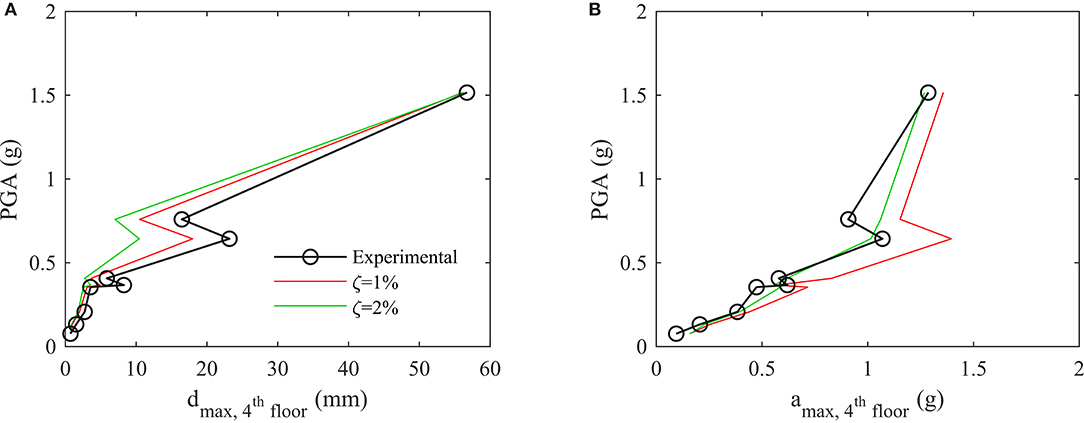
Figure 12. Mixed RC/URM building: global response parameters predicted by the models for different damping ratios. (A) Maximum displacements and (B) maximum acceleration at the top floor.
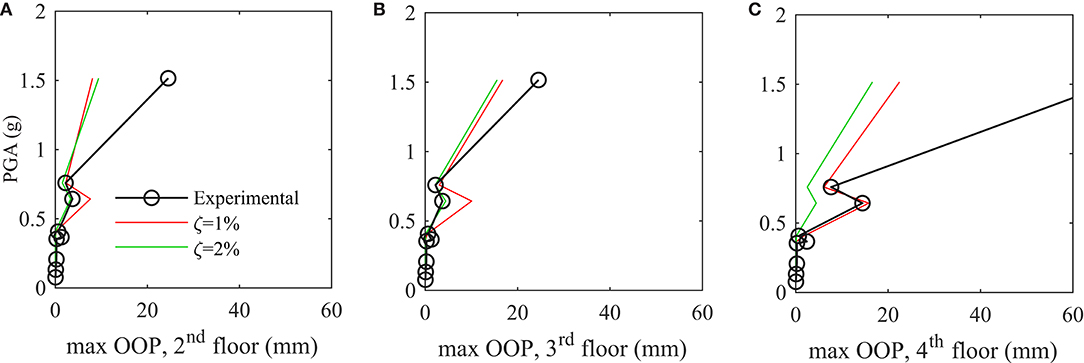
Figure 13. Mixed RC/URM building: comparison of experimental and numerical out-of-plane displacements at (A) the second, (B) third, and (C) fourth stories for increasing levels of ground-motion intensities.
The slab uplift and consequent loss of vertical load on the out-of-plane elements is captured by the model and is also the phenomenon that initiates the increase of out-of-plane displacements in the simulations. However, the model fails to describe the complete out-of-plane collapse in the last run. Since the global demand on the entire building in terms of magnitude of maximum base shear forces, accelerations, and displacements, as shown in Figures 14, 15, was also correctly predicted for the last run, the underestimation of the out-of-plane displacement can be attributed to the sensitivity of the phenomenon to the local change in boundary conditions. Although the model can capture the kinematics of the phenomenon, the development of an out-of-plane failure requires the exact prediction of the time-history response in the instant of slab uplift and is particularly sensitive to the duration of the predicted uplift. This level of detail is hardly achievable in a time-history analysis, and therefore the modeling approach seems suitable only for predicting the onset of the out-of-plane mechanisms wherein the kinematics is related to the transient variation of boundary conditions depending on the in-plane response.
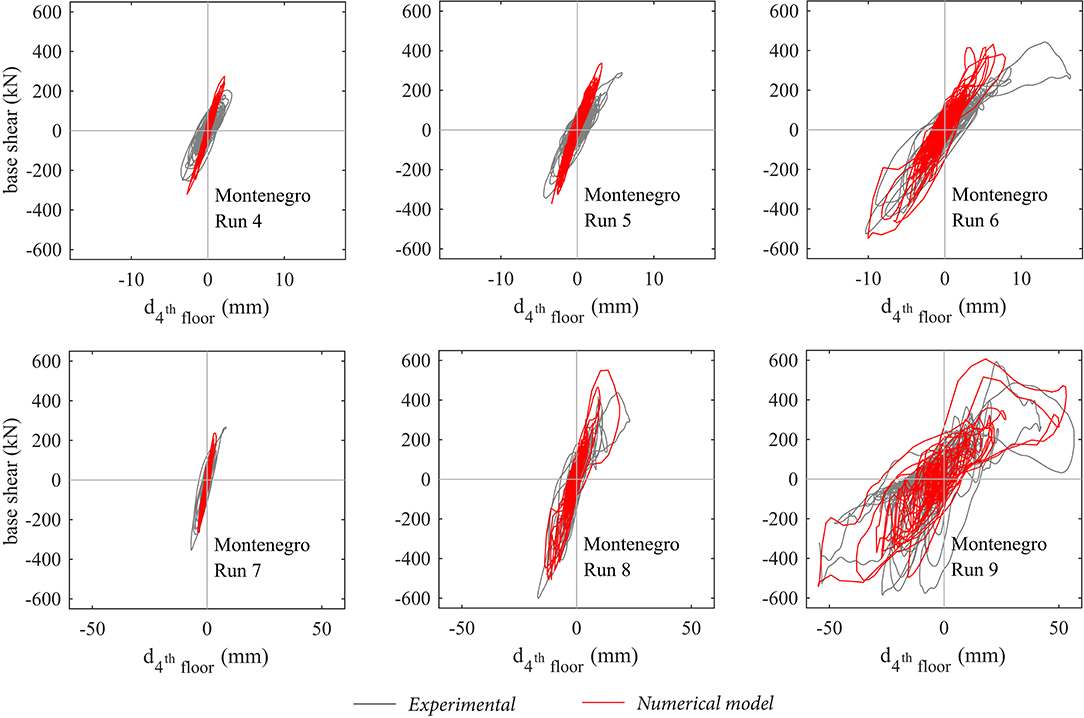
Figure 14. Mixed RC/URM building: force displacement global response of the building (damping ratio ζ = 1%).

Figure 15. Mixed RC/URM building: comparison of time-history responses for Run 9, for (A) the top floor displacement and (B) the out-of-plane deformation at the top story.
5. Conclusions
The novel implementation of a macroelement for simulating the in-plane and out-of-plane behavior of masonry panels allows equivalent frame models to capture the seismic response of unreinforced masonry buildings that develop in-plane and out-of-plane failure modes. In addition, elements and materials have been implemented for a refined modeling of connections. In such a way, the common assumptions of perfect connections between orthogonal walls and between floors and walls can be relaxed for equivalent frame models, and the method can be applied to buildings, such as historical masonry buildings, which do not meet the requirement of perfect connections.
Calibrating such models using quasi-static test results is generally sufficient to predict the stiffness and the modal characteristics of the building as well as the maximum force capacity, even when complex roof structures and tall gables are present. The time-history response, and therefore the prediction of failure mode, maximum drifts, and damage to single elements, depends on the damping model that is applied and the modeling of connections. However, the numerical simplicity of equivalent frame models allows for multiple dynamic analyses that can explicitly model the parameter uncertainty. In such a way, one can estimate a scenario of possible failure modes and damage patterns at different seismic intensities, including an assessment of model uncertainties.
The out-of-plane failure of elements was confirmed to be sensitive to the modeling assumption regarding the connection to the floors for buildings with deformable diaphragms and to the exact modeling of boundary connections for buildings with stiff floors. In the first case, the effectiveness of the connection, i.e., the maximum force transfer that can take place between floors and walls, governs the problem and defines the failure mode. A model accounting for non-linear connections can therefore capture the change in the seismic response from out-of-plane failure modes to in-plane failure, which can be obtained by improving the building connections, and show the vulnerability of a building to this type of failure mode.
For buildings with stiff floors, the change in boundary conditions related to the in-plane response is explicitly captured. Despite correctly modeling the kinematics of the phenomenon, the response is sensitive to the duration of the boundary condition change, and the prediction of the out-of-plane response is therefore reliable only up to the initiation of the mechanism.
Data Availability Statement
The simulations presented in this paper can be reproduced using the OpenSEES models and libraries provided in https://github.com/eesd-epfl/OpenSees. The repository contains also the data of preliminary shear and compression tests used for calibration, and the data extracted from the shaking table tests used for comparison with numerical models. For more extensive documentation and data on the shaking table tests, refer to Senaldi et al. (2019) and Beyer et al. (2015).
Author Contributions
FV deriving the formulation and implementation of the macroelement and the material models presented in the paper, performing the analyses, and writing the article. AP and KB co-writing the paper and supervising FV.
Funding
This work was prepared as part of the Basel-Project, which was supported by the Swiss Federal Office of the Environment and the Construction Department of the Canton Basel-Stadt.
Conflict of Interest
The authors declare that the research was conducted in the absence of any commercial or financial relationships that could be construed as a potential conflict of interest.
References
Addessi, D., Mastrandrea, A., and Sacco, E. (2014). An equilibrated macro-element for nonlinear analysis of masonry structures. Eng. Struct. 70, 82–93. doi: 10.1016/j.engstruct.2014.03.034
Belmouden, Y., and Lestuzzi, P. (2009). An equivalent frame model for seismic analysis of masonry and reinforced concrete buildings. Constr. Build. Mater. 23, 40–53. doi: 10.1016/j.conbuildmat.2007.10.023
Berti, M., Salvatori, L., Orlando, M., and Spinelli, P. (2017). Unreinforced masonry walls with irregular opening layouts: reliability of equivalent-frame modelling for seismic vulnerability assessment. Bull. Earthq. Eng. 15, 1213–1239. doi: 10.1007/s10518-016-9985-5
Berto, L., Saetta, A., Scotta, R., and Vitaliani, R. (2002). An orthotropic damage model for masonry structures. Int. J. Numer. Methods Eng. 55, 127–157. doi: 10.1002/nme.495
Beyer, K., Tondelli, M., Petry, S., and Peloso, S. (2015). Dynamic testing of a four-storey building with reinforced concrete and unreinforced masonry walls: prediction, test results and data set. Bull. Earthq. Eng. 13, 3015–3064. doi: 10.1007/s10518-015-9752-z
Bosiljkov, V. Z., Totoev, Y. Z., and Nichols, J. M. (2005). Shear modulus and stiffness of brickwork masonry: an experimental perspective. Struct. Eng. Mech. 20, 21–43. doi: 10.12989/sem.2005.20.1.021
Brignola, A., Podestà, S., and Pampanin, S. (2008). “In-plane stiffness of wooden floor,” in Proceedings of the New Zealand Society for Earthquake Engineering Conference (Wairakei).
Chácara, C., Cannizzaro, F., Pantò, B., Caliò, I., and Lourenço, P. B. (2019). Seismic vulnerability of urm structures based on a discrete macro-element modeling (dmem) approach. Eng. Struct. 201:109715. doi: 10.1016/j.engstruct.2019.109715
Guerrini, G., Senaldi, I., Graziotti, F., Magenes, G., Beyer, K., and Penna, A. (2019). Shake-table test of a strengthened stone masonry building aggregate with flexible diaphragms. Int. J. Architect. Herit. 13, 1078–1097. doi: 10.1080/15583058.2019.1635661
Lagomarsino, S., and Cattari, S. (2015). Perpetuate guidelines for seismic performance-based assessment of cultural heritage masonry structures. Bull. Earthq. Eng. 13, 13–47. doi: 10.1007/s10518-014-9674-1
Lagomarsino, S., Penna, A., Galasco, A., and Cattari, S. (2013). TREMURI program: an equivalent frame model for the nonlinear seismic analysis of masonry buildings. Eng. Struct. 56, 1787–1799. doi: 10.1016/j.engstruct.2013.08.002
Lotfi, H. R., and Shing, P. B. (1991). An appraisal of smeared crack models for masonry shear wall analysis. Comput. Struct. 41, 413–425. doi: 10.1016/0045-7949(91)90134-8
Lourenço, P. B., and Rots, J. G. (1997). Multisurface interface model for analysis of masonry structures. J. Eng. Mech. 123, 660–68. doi: 10.1061/(ASCE)0733-9399(1997)123:7(660)
Mandirola, M., Galasco, A., Penna, A., and Magenes, G. (2016). “Nonlinear macroelement modelling of experimental tests on masonry buildings with rigid diaphragms,” in Proceedings of the 16th International Brick and Block Masonry Conference (Padova).
McKenna, F., Fenves, G. L., Scott, M. H., and Jeremic, B. (2000). Open System for Earthquake Engineering Simulation (OpenSees). Technical Report, University of California, Berkeley, CA.
Milani, G. (2011). Simple homogenization model for the non-linear analysis of in-plane loaded masonry walls. Comput. Struct. 89, 1586–1601. doi: 10.1016/j.compstruc.2011.05.004
Milani, G., Lourenço, P. B., and Tralli, A. (2007). 3D homogenized limit analysis of masonry buildings under horizontal loads. Eng. Struct. 29, 3134–3148. doi: 10.1016/j.engstruct.2007.03.003
MIT (2009). Istruzioni per l'applicazione delle “Nuove Norme Tecniche per le Costruzioni” di cui al Decreto Ministeriale 14/1/2008. Technical report, Min. delle Infrastrutture e dei Trasporti.
Penna, A., Lagomarsino, S., and Galasco, A. (2014). A nonlinear macroelement model for the seismic analysis of masonry buildings. Earthq. Eng. Struct. Dyn. 43, 159–179. doi: 10.1002/eqe.2335
Penna, A., Senaldi, I. E., Galasco, A., and Magenes, G. (2016). Numerical simulation of shaking table tests on full-scale stone masonry buildings. Int. J. Architect. Herit. 10, 146–163. doi: 10.1080/15583058.2015.1113338
Peruch, M., Spacone, E., and Camata, G. (2019a). Nonlinear analysis of masonry structures using fiber-section line elements. Earthq. Eng. Struct. Dyn. 48, 1345–1364. doi: 10.1002/eqe.3188
Peruch, M., Spacone, E., and Shing, P. B. (2019b). Cyclic analyses of reinforced concrete masonry panels using a force-based frame element. J. Struct. Eng. 145:04019063. doi: 10.1061/(ASCE)ST.1943-541X.0002335
Petry, S., and Beyer, K. (2014). Scaling unreinforced masonry for reduced-scale seismic testing. Bull. Earthq. Eng. 12, 2557–2581. doi: 10.1007/s10518-014-9605-1
Petry, S., and Beyer, K. (2015). Force-displacement response of in-plane-loaded URM walls with a dominating flexural mode. Earthq. Eng. Struct. Dyn. 44, 2551–2573. doi: 10.1002/eqe.2597
Raka, E., Spacone, E., Sepe, V., and Camata, G. (2015). Advanced frame element for the seismic analysis of masonry structures: model formulation and validation. Earthq. Eng. Struct. Dyn. 44, 2489–2506. doi: 10.1002/eqe.2594
Roca, P., Molins, C., and Marí, A. R. (2005). Strength capacity of masonry wall structures by the equivalent frame method. J. Struct. Eng. 131, 1601–1610. doi: 10.1061/(ASCE)0733-9445(2005)131:10(1601)
Senaldi, I. E., Guerrini, G., Comini, P., Graziotti, F., Penna, A., Beyer, K., et al. (2019). Experimental seismic performance of a half-scale stone masonry building aggregate. Bull. Earthq. Eng. 18, 609–43. doi: 10.1007/978-3-319-99441-3_147
Siano, R., Roca, P., Camata, G., Pelà, L., Sepe, V., Spacone, E., et al. (2018). Numerical investigation of non-linear equivalent-frame models for regular masonry walls. Eng. Struct. 173, 512–529. doi: 10.1016/j.engstruct.2018.07.006
Tondelli, M., Beyer, K., and DeJong, M. (2016). Influence of boundary conditions on the out-of-plane response of brick masonry walls in buildings with RC slabs. Earthq. Eng. Struct. Dyn. 45, 1337–1356. doi: 10.1002/eqe.2710
Vanin, F. (2019). Equivalent frame models for in-plane and out-of-plane response of unreinforced masonry buildings (Ph.D. thesis). École Polytechnique Fédérale de Lausanne (EPFL), Lausanne, Switzerland.
Vanin, F., Penna, A., and Beyer, K. (2019). A three-dimensional macro-element for modelling of the in-plane and out-of-plane response of masonry walls. Earthq. Eng. Struct. Dyn. doi: 10.1002/eqe.3277 (accepted).
Vanin, F., Zaganelli, D. Penna, A., and Beyer, K. (2017). Estimates for the stiffness, strength and drift capacity of stone masonry walls based on 123 quasi-static cyclic tests reported in the literature. Bull. Earthq. Eng. 15, 5435–5479. doi: 10.1007/s10518-017-0188-5
Wilding, B. V., Dolatshahi, K. M., and Beyer, K. (2017). Influence of load history on the force-displacement response of in-plane loaded unreinforced masonry walls. Eng. Struct. 152, 671–682. doi: 10.1016/j.engstruct.2017.09.038
Wilding, B. V., Godio, M., Sory, L., and Beyer, K. (2019). “Shear to elastic modulus ratio in unreinforced masonry,” in Proceedings of the 13th North American Masonry Conference (Salt Lake City, UT).
Zhang, S., Mousavi, S. M. T., Richart, N., Molinari, J.-F., and Beyer, K. (2017). Micro-mechanical finite element modeling of diagonal compression test for historical stone masonry structure. Int. J. Solids Struct. 112, 122–132. doi: 10.1016/j.ijsolstr.2017.02.014
Keywords: 3D macroelement, equivalent frame modeling, out-of-plane response, masonry, modeling uncertainty, seismic analysis
Citation: Vanin F, Penna A and Beyer K (2020) Equivalent-Frame Modeling of Two Shaking Table Tests of Masonry Buildings Accounting for Their Out-Of-Plane Response. Front. Built Environ. 6:42. doi: 10.3389/fbuil.2020.00042
Received: 11 December 2019; Accepted: 23 March 2020;
Published: 16 April 2020.
Edited by:
Gabriele Milani, Politecnico of Milan, ItalyReviewed by:
Nuno Mendes, University of Minho, PortugalBartolomeo Pantò Panto, Imperial College London, United Kingdom
Copyright © 2020 Vanin, Penna and Beyer. This is an open-access article distributed under the terms of the Creative Commons Attribution License (CC BY). The use, distribution or reproduction in other forums is permitted, provided the original author(s) and the copyright owner(s) are credited and that the original publication in this journal is cited, in accordance with accepted academic practice. No use, distribution or reproduction is permitted which does not comply with these terms.
*Correspondence: Katrin Beyer, a2F0cmluLmJleWVyQGVwZmwuY2g=
 Francesco Vanin
 Andrea Penna
 Katrin Beyer