 Amy Kim
 Shuoqi Wang
 Lindsay McCunn
 Hessam Sadatsafavi3
- 1Department of Civil and Environmental Engineering, University of Washington, Seattle, WA, United States
- 2Department of Psychology, Vancouver Island University, Nanaimo, BC, Canada
- 3Department of Emergency Medicine, University of Virginia Health System, Charlottesville, VA, United States
A case study was undertaken on one floor of a multi-floor office building in Seattle, WA. Its aim was to offer a straight-forward example for facilities managers, administrators, and researchers alike wishing to perform systematic, naturalistic, mixed-methods research in office spaces that have recently been retrofitted. Changes were made to the floor’s layout, and to the size of employees’ workspaces. New sound-making technology and a modern lighting framework were added. Objective measurements of lighting, acoustics, and indoor air quality were taken and an online questionnaire was distributed to staff to afford subjective measurements of their perceptions about the previous and new open-plan settings. Items concerning satisfaction with workspace layout, size, lighting, acoustics, air quality, and level of input into the retrofit process were asked. After the new space had been used for 1.5 months, occupants reported being more satisfied, in general, than they recalled being in the original setting. The size of personal workspaces and a sense of privacy were especially important to employees. Despite overhead lighting illuminance levels being below recommended industry standards, occupants were not dissatisfied with light levels. The sound masking system was iteratively commissioned based on negative occupant feedback, resulting in purposely setting some areas to exceed or fall short of acoustical performance guidelines; indoor air quality remained unchanged. Differences in quantitative and qualitative findings highlight the importance of gathering self-reported information from occupants in several ways and exploring them carefully to better understand why environmental satisfaction (or dissatisfaction) exists. Employees’ sense of environmental control remained a prominent theme in the data, supporting existing studies in the field of environmental psychology. While perceptions of control did not improve after the retrofit, occupants’ responses about the level of input they had into the retrofit process correlated significantly and positively with their perceptions of environmental satisfaction after its completion. The nuanced findings from this case study’s customized approach to measuring objective environmental stimuli, along with occupants’ environmental perceptions, add to a growing body of literature merging social scientific methodologies with technical environmental assessments for practical use by decision-makers working to satisfy employee preferences.
Introduction
Over the past several decades, engineers, architects, and facilities managers have focused their attention on health factors and psychological well-being in indoor environments. Arguably, the human workforce is an organization’s greatest asset, as well as its largest expense. Approximately 90% of the cost of business operations is spent by organizations on staff salaries and benefits, while 9% is spent on rent, and a mere 1% on energy (World Green Building Council, 2014). As human resources and talent management become predominant components of business success, human resource leaders, as well as those in the design disciplines, are understanding that the physicality of the work environment, and the ways in which occupants experience it psychosocially, are integral to performance strategies and financial returns.
Numerous studies report significant positive associations between the indoor environment of built settings, environmental satisfaction, and satisfaction on the job (e.g., Oldham and Fried, 1987; Carlopio, 1996; Wells, 2000; De Croon et al., 2005). Indeed, a host of empirical research populates a multidisciplinary body of literature that introduces and tests conceptual models concerning how the physical environment in open-plan office buildings influence environmental and job satisfaction. One example is the Cost-effective Open-Plan Environments (COPE) project that gathered questionnaire data from almost 800 office users in nine buildings (Veitch et al., 2007). The resulting model connected overall environmental satisfaction with perceptions of lighting, ventilation, privacy, and acoustics (and statistically predicted job satisfaction). However, despite a general recognition from an interdisciplinary research community that design frameworks for sustainable and economical workplaces should encompass facets that concern and benefit building occupants, studies are not often able to account for more than a few physical aspects at a time, in relatively controlled conditions (e.g., Newsham et al., 2009; Shin, 2016; McCunn et al., 2018; Kim A. et al., 2019; Kim A. A. et al., 2019).
Comprehensive interior retrofit strategies apply a set of refurbishments to lighting, acoustics, and indoor air quality (IAQ), combined with strategic densification, driven by potential cost savings and the preferences of a millennial workforce who enjoy flexible and open workspaces (Gensler, 2015; Hongisto et al., 2016). Although some research illustrates that relations exist between occupant satisfaction and these attributes (Wells, 2000; Donald and Siu, 2001; Veitch et al., 2002, 2003, 2005; Lee and Brand, 2005; Newsham et al., 2008), for example, did not uncover a predicted association between occupants’ satisfaction with their work setting and job satisfaction. Those authors suggest that mediating relations are challenging to account for and that employees’ opinions about particular space modernization strategies tend to change over time. We also know that different office types influence workers’ overall satisfaction. Kim and de Dear (2013) found that employees with private offices report higher overall satisfaction with their workplace environment compared to those who work in an open-plan setting. A different study, similar to the present work in its quasi-experimental methodology, found that employee satisfaction with open-plan office features was stronger after a retrofit, but the change management strategies executed by the organization, as well as the level of employee participation in design decisions, also played a significant role in bolstering satisfaction with alterations made to acoustics, spatial density, lighting, and air quality (Hongisto et al., 2016). Similarly, Newsham et al. (2009) conceptual model indicated a link between some indoor environmental attributes and occupant well-being. Newsham et al. (2009) found that overall environmental satisfaction is an important contributor to job satisfaction, mediated by factors such as management and compensation.
Given the complexity of merging technical environmental assessments with observer-based environmental appraisal, more can be explored about how people respond to modern office retrofits, especially during opportunities where current employees can self-report psychosocial experiences of physical attributes, thereby affording research with a greater degree of ecological validity. Buildings undergoing renovation are often difficult for researchers to access, and construction schedules can change frequently in ways that make a systematic approach to objective and subjective data collection difficult. Thus, additional findings from a purposive, mixed-methods study relating common design variables and employees’ psychosocial experience of them in situ over time would undoubtedly be valuable to organizational decision-makers and administrators, facilities managers, and multi-disciplinary researchers alike.
The present case study was led by a team of engineers, along with an environmental psychologist. It capitalized on an existing project to combine the common survey method with field study techniques after a retrofit was done to one floor of a multi-floor office building (i.e., the UW Tower on the University of Washington campus in Seattle). The retrofit provided a prudent opportunity for a naturalistic investigation that could associate changes to particular physical conditions of an open-plan office setting with occupants’ perceptions of those conditions.
As Newsham et al. (2009) acknowledge, a number of physical features of a work environment (e.g., lighting, acoustics, air quality, density, and controllability) can independently, and in combination, influence employees’ environmental satisfaction. The objective of this case study is to examine objective data about specific environmental changes, along with both quantitative and qualitative data about users’ perceptions of their work setting over time, in order to provide evidence-based, practical insights that may be easily understood and replicated by organizations and researchers seeking to improve the value of physical refurbishments. For administrators and facilities managers, this case study may serve as a relatively straight-forward example of how to gather evidence on the success of a retrofit from the perspective of occupants and, perhaps, induce building developers and owners to make efficient programmatic investments.
Materials and Methods
An assessment of occupants’ perceptions of the pre-retrofit environment, and a separate post-occupancy evaluation, were undertaken on one floor of a four-building tower complex on the University of Washington’s Seattle campus. The retrofit included the large-scale refurbishment of two office areas, labeled “C3” and “O3,” each on the same connected floor of the UW Tower. A total of 167 occupants moved out of C3 and O3 combined before the retrofit began.
Occupants moved out of the original space in August, 2017. Construction started in October, 2017 and continued through March, 2018. Occupants moved back in during March and April, 2018. One hundred and twenty-four occupants returned once the retrofit was completed; 43 did not return. Thirty new employees moved into the retrofitted office space from other buildings on campus.
No changes were planned to alter the floor’s IAQ or ventilation rate; the mechanical system, and its operation, were unaltered. The retrofit included new finishes (e.g., paint on interior walls, carpeting, new ceiling tiles to soften the acoustical environment). With respect to density and space allocation, all new workstations had lower partitions (from 1.57 m originally, down to 1.42 m) to afford occupants more access to window views. However, these changes also created less square footage per person in individual workstations (approximate average of 5.39 m2 down to 3.90 m2 per workstation). All new workstations were fully adjustable and reconfigurable by occupants. The new layout included less allocation for private workstations and, as a result, a balance of communal and quiet space was integrated into the design. A larger kitchen, with breakout lounges, was planned to encourage social interaction between employees. Multiple types of seating (e.g., booths, bar-style seats) were also added. In addition to assigned workstations, hoteling stations were included, as well as semi-private conference spaces with modern technology platforms.
The existing lighting design included suspended ceilings with 0.6 × 1.2 m (2 × 4 feet) recessed fluorescent light fixtures. These fixtures were replaced with new light-emitting diode (LED) fixtures, wireless lighting controls, photometric sensors for automatic dimming, occupancy sensors, and different color rendering/temperature capability. In addition to the changes made to the ceiling light fixtures, all occupants received tunable task lighting fixtures on their desks to allow light levels and color temperatures to be set preferentially.
Changes to the acoustical environment occurred mostly via the integration of sound masking speakers. Three-hundred fifty-three miniature, omnidirectional, direct field sound speakers/emitters were installed into the ceiling (185 in C3 and 168 in O3), providing nearly 180° of sound dispersion. The emitters are adjustable to allow sound masking input to be reduced by up to 9 in 3 dB increments to compensate for different acoustic conditions within a zone. Each zone could be independently adjusted for masking and auxiliary audio levels and spectra. The new sound masking system was tuned to have a sound pressure level of 47 dBA for open offices, and 45 dBA for conference and huddle rooms.
Study Design
Two questionnaires (see section “Psychosocial Environmental Assessment”) were developed for this case study and received Institutional Review Board (IRB) approval from the University of Washington Human Subject Division (IRB ID: STUDY00002930). The questionnaires were administered to employees using the online survey tool Qualtrics (Qualtrics XM, 2019) at Times 1 and 2 with permission from the facilities managers responsible for the building. The timeline of the retrofit and questionnaire distribution is shown in Figure 1.
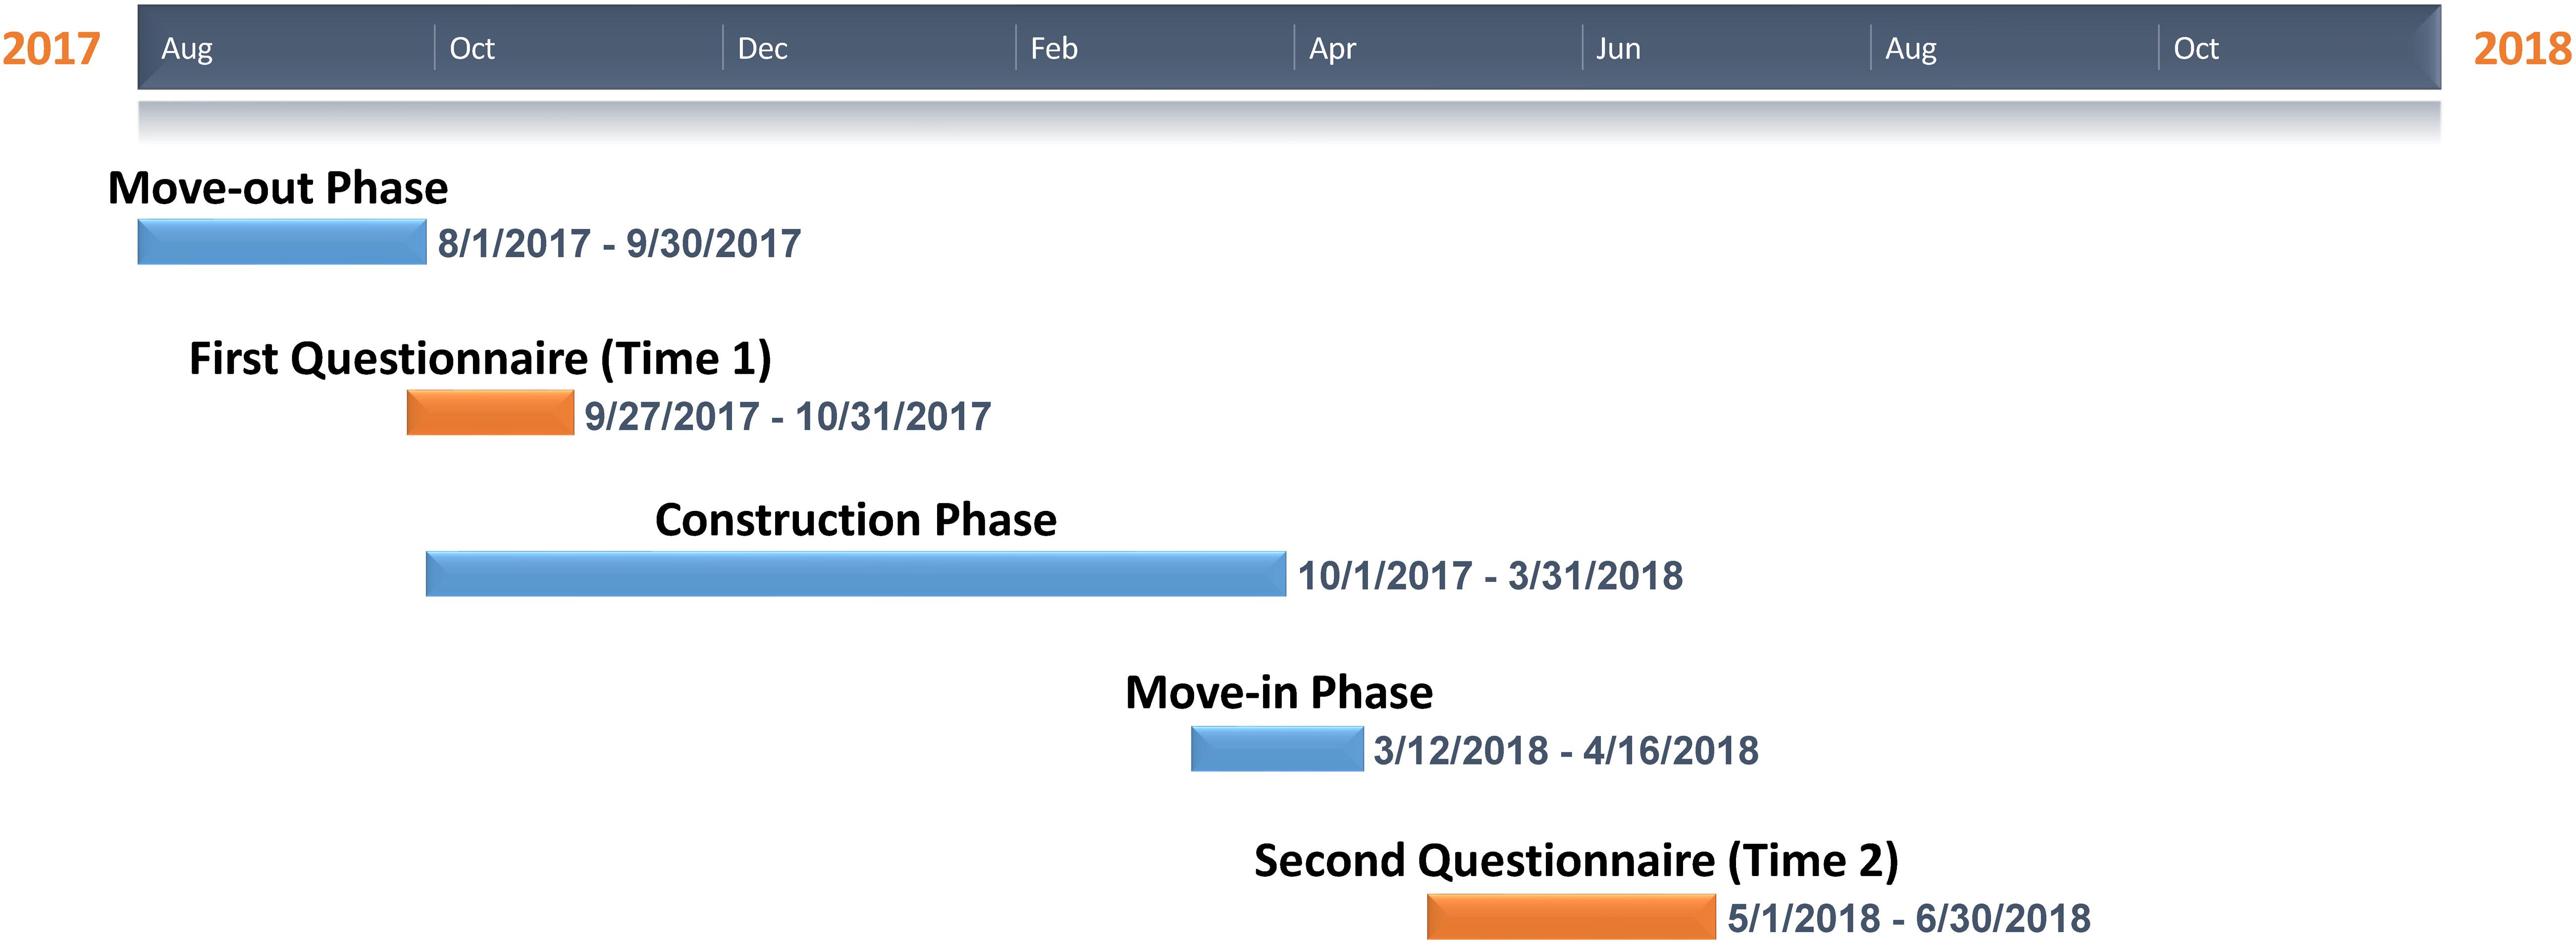
Figure 1. Timeline of the retrofit and questionnaire distribution.
Because the pre-retrofit questionnaire was distributed approximately 4 weeks after employees had moved into a temporary office space (i.e., Time 1), items were worded retroactively such that participants were prompted to answer while actively thinking about the ways in which they felt in the original office space. Then, one and a half months after the renovation had been completed, a second questionnaire (i.e., Time 2) using the same items was distributed and participants were asked about their current perceptions of the new office space.
Twenty-seven out of 167 (16%) occupants responded to the first distribution of the questionnaire; 57 out of 154 (37%) occupants took part in the second distribution. Of those 57 individuals, only eight were returning participants (participants created a numeric code for themselves in order for the research team to compare anonymized responses over time). As stated in ASHRAE Standard 55 (ASHRAE, 2013), for an environmental survey distributed to more than 45 occupants, the response rate must exceed 35%. Although the first distribution did not reach the required response rate, the second distribution did exceed 35%. Considering the limitation of the low response rate for the first distribution, and because not every participant responding to the second questionnaire completed the first questionnaire (in some cases, the participants failed or forgot to create a code), data for both periods were analyzed on aggregate, and limited comparisons between time points were made. Non-response bias is not likely to be a source of systematic error in our results for two reasons. First, as studies have suggested (Olson, 2006; Tourangeau et al., 2010), the survey was designed (in terms of the survey length, confidentiality, and the sensitivity of information requested) and administrated in a way that did not make it more likely for certain groups to refuse to participate or be absent during the surveying period. Second, the data collection was conducted in a homogenous population (UW Information Technology employees) and it is safe to assume that our sample is essentially random subsets of the employees and good representations of the broader group of potential participants (Holbrook et al., 2007).
Objective Environmental Assessment
A combination of objective data about physical features in the setting, as well as subjective data collected from occupants, can be used to ascertain whether the built environment provides satisfactory conditions. The light intensity, acoustics, and particulate matter (PM) concentration of the floor were evaluated against established guidelines, such as the Illuminating Engineering Society (IES) Lighting Handbook (Illuminating Engineering Society, 2011), the WELL Building Standard (International Well Building Institute, 2019), the RESET Air Standard (RESET, 2018), and the National Primary and Secondary Ambient Air Quality Standards (EPA, 2006). Requirements for the relevant parameters in these guidelines are summarized in Table 1. An overview of the measurement locations and equipment for these environmental parameters is given in Figures 2, 3.
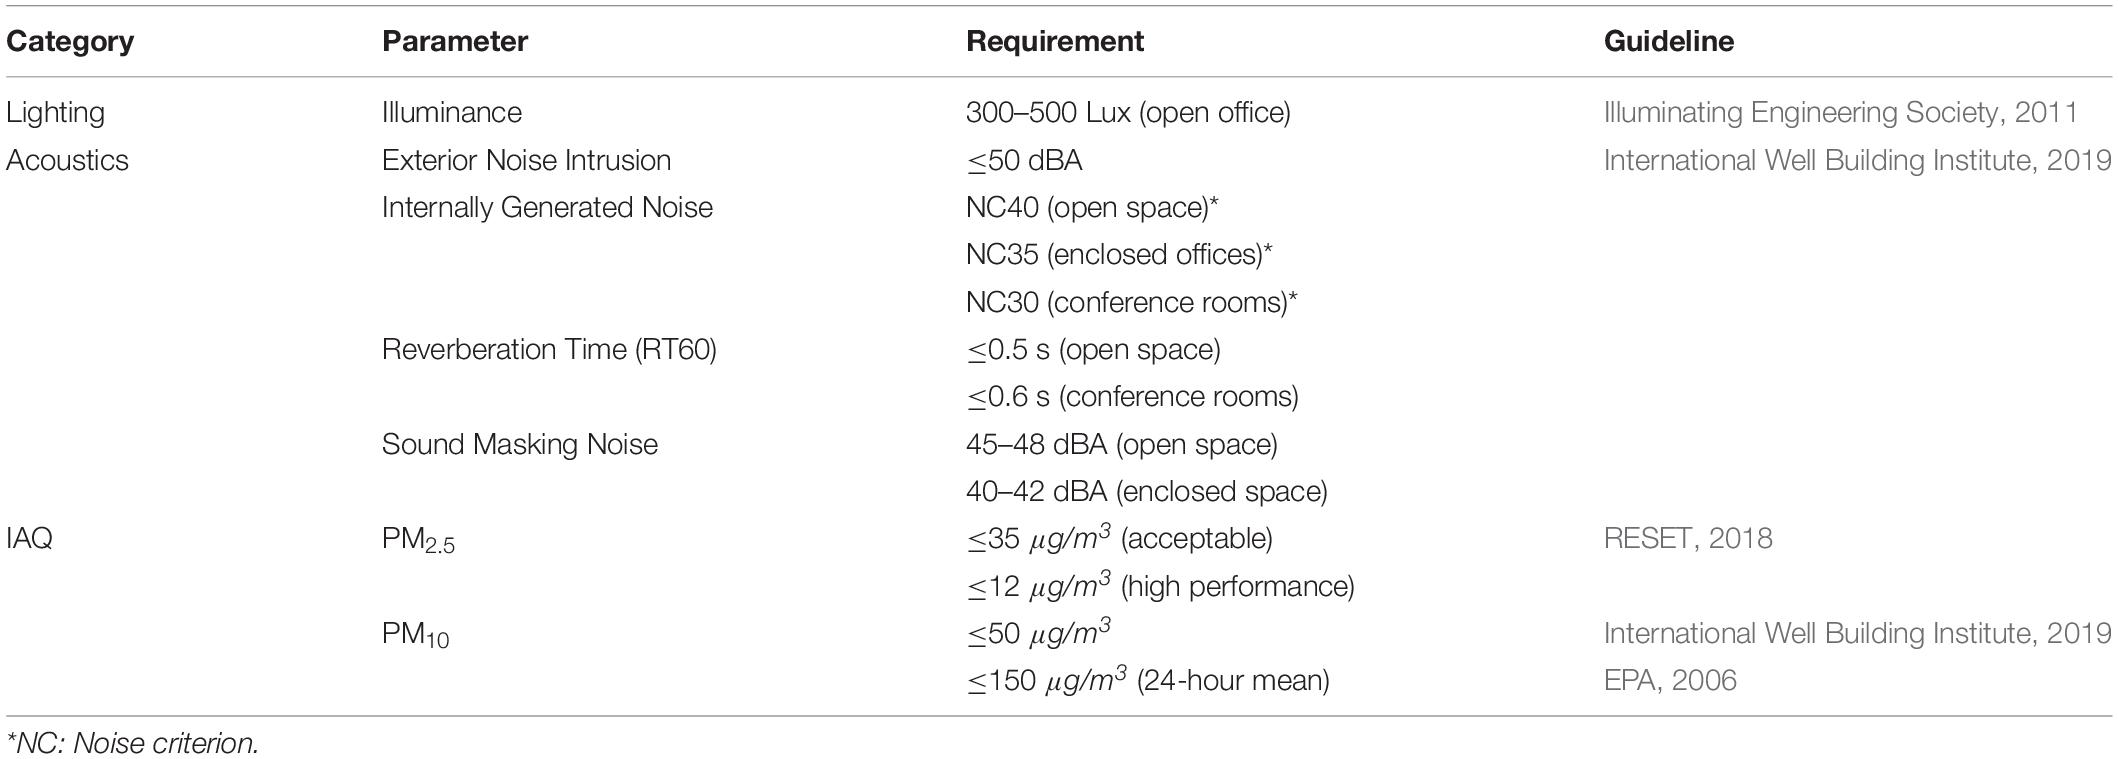
Table 1. Requirements for environmental parameters of office space in various guidelines.
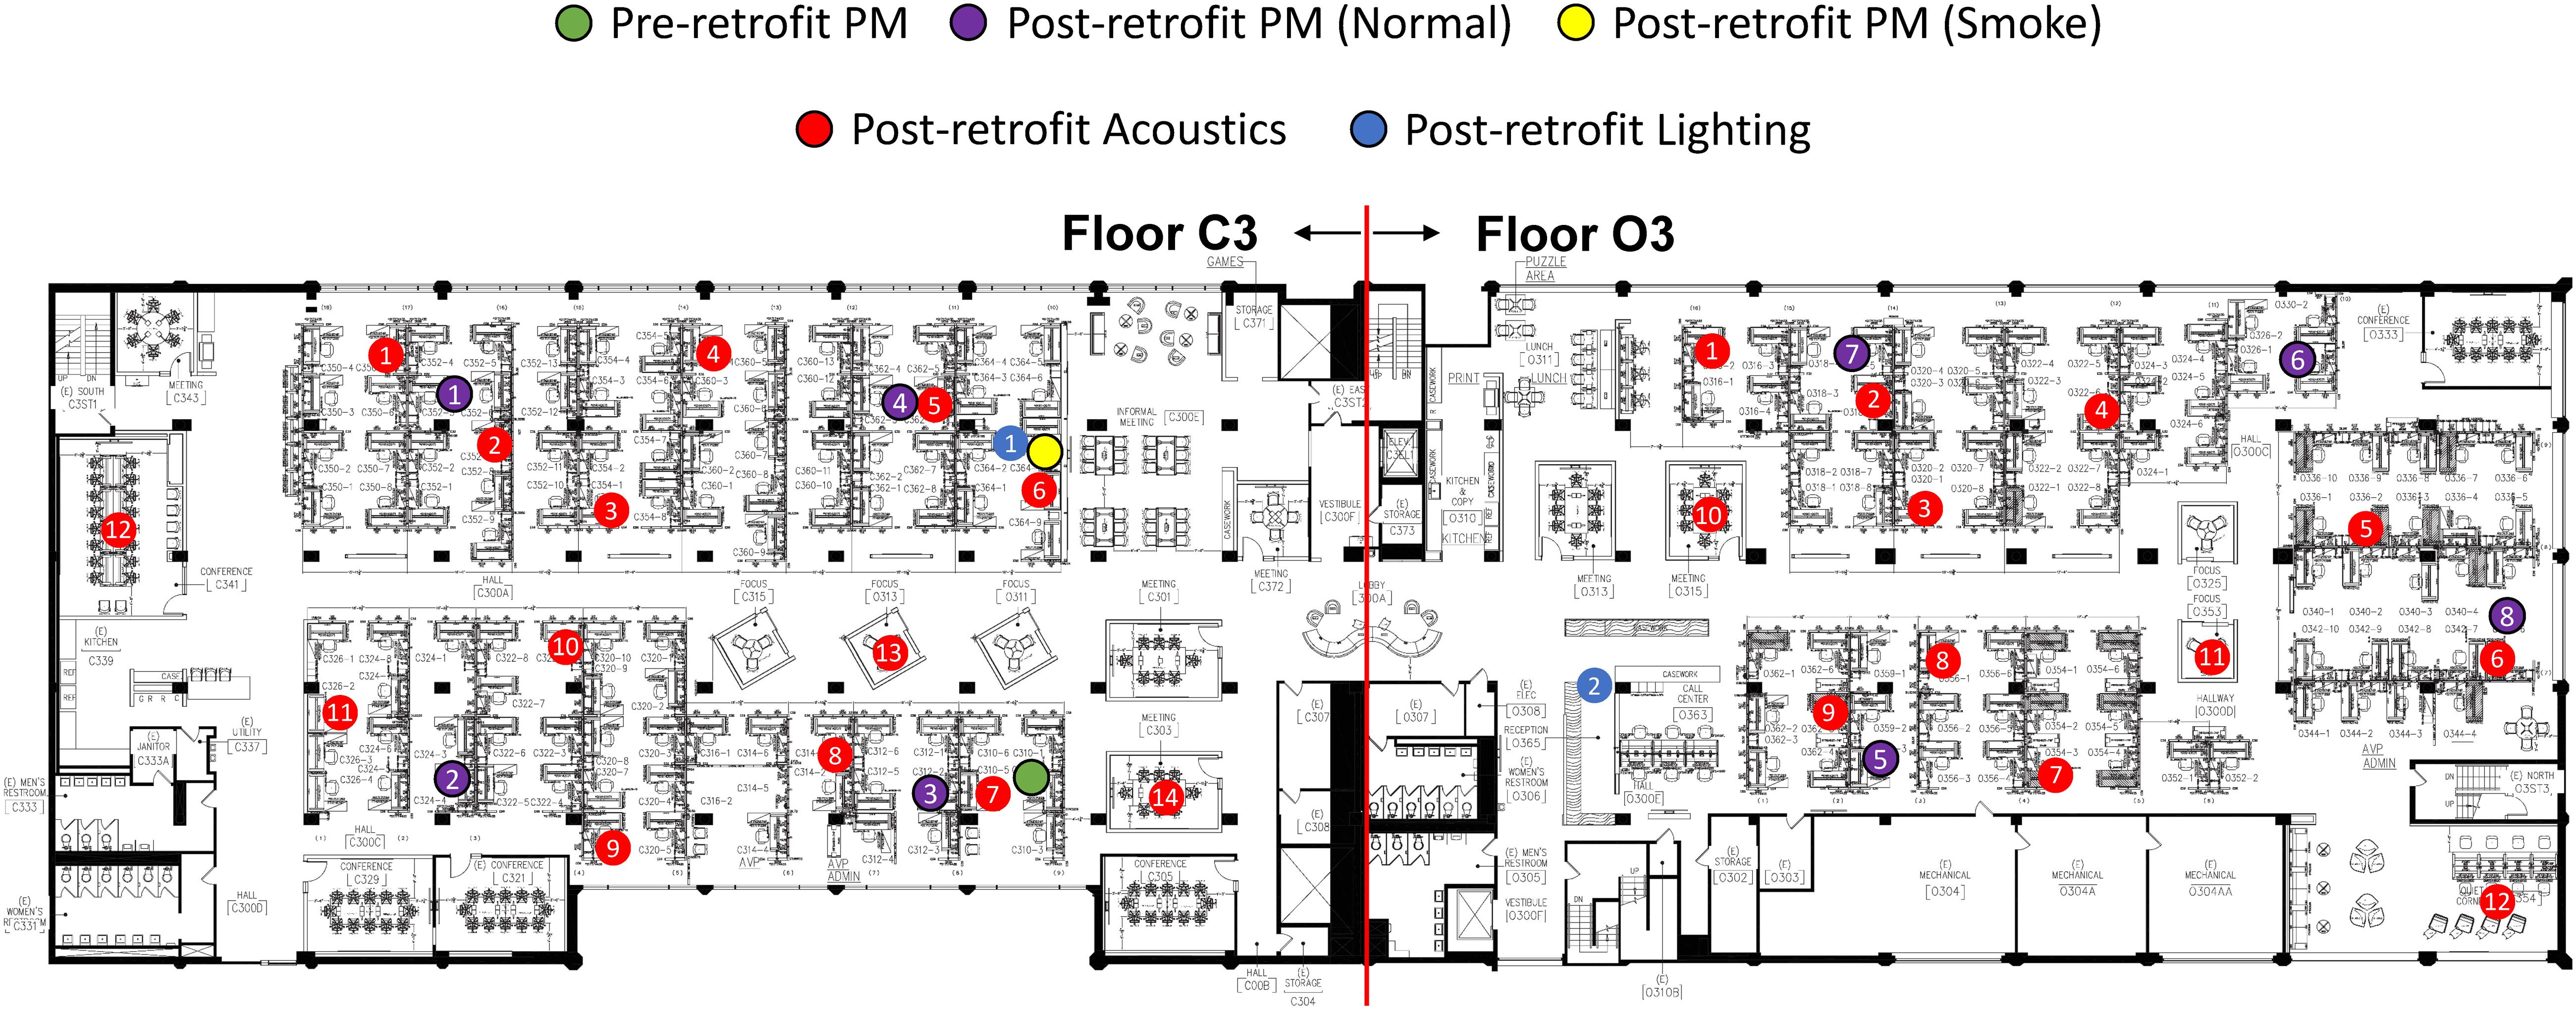
Figure 2. Measurement locations for various environmental parameters pre- and post-retrofit.
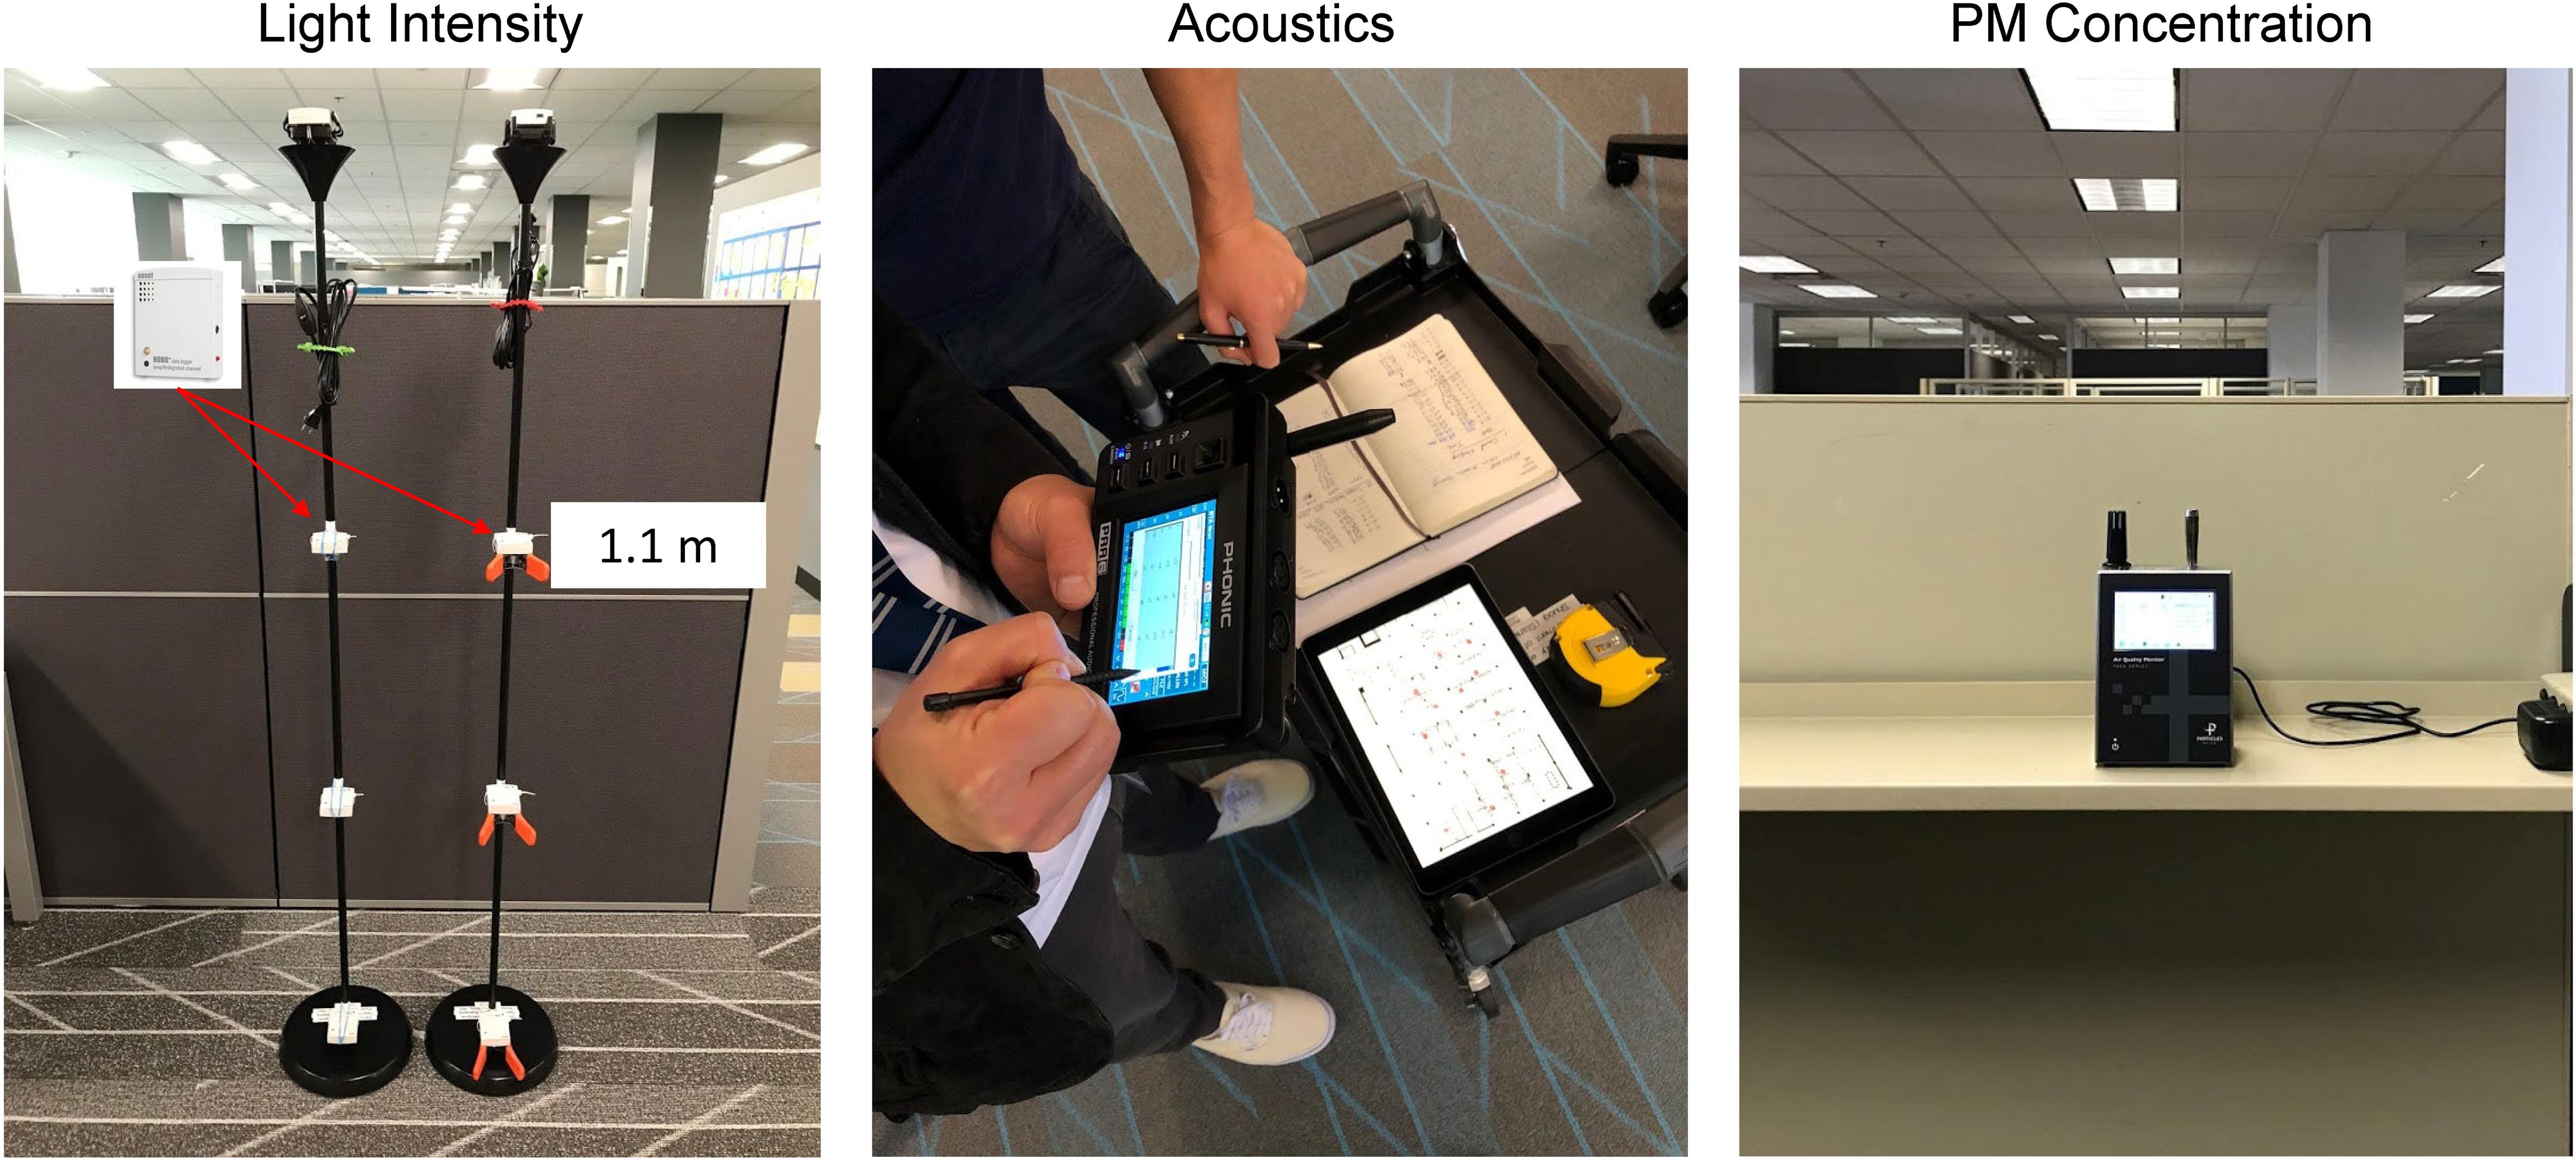
Figure 3. Equipment used for the measurements of environmental parameters.
Light Intensity
Because of equipment constraints, no light intensity measurements were conducted before the retrofit. After the retrofit, as part of a different thermal comfort study, two measurement stations were fabricated using eight HOBO U12-012 data loggers (Onset, 2019) that recorded air temperature, relative humidity, and light intensity. For each station, four HOBOs were mounted at different heights above ground as recommended in ASHRAE Standard 55 (ASHRAE, 2013) (i.e., 0.1, 0.6, 1.1, and 1.7 m). Light intensity recorded by the HOBO at 1.1 m above ground was used from each station to represent lighting conditions at the desk level. The two measurement locations (one for C3 and one for O3) were selected to minimize disturbance to the occupants (but still afford cogent representation of the space) and are shown in Figure 2.
Lighting quality consists of multiple aspects. Kruisselbrink et al. (2018) reviewed thirty studies and found that eleven different aspects of lighting could be used to describe overall lighting quality. Although the quantity of light measured by illuminance or luminance is used in much of the existing literature, control, spectral power distribution of light, and dynamics of light were also found to be indicative of overall lighting quality. In the present study, no information about the quantity of light was available from the pre-retrofit environment. Thus, illuminance was measured after the renovation to provide a simple assessment of the lighting quality of the new setting.
Acoustics
No acoustical parameters were measured prior to the retrofit. However, a Phonic PAA6 sound meter (Phonic, 2019) was used at the post-retrofit phase to measure external noise intrusion, internally-generated noise, reverberation time, and sound masking noise level. Twenty-six different sampling spots were selected to represent a global understanding of the acoustical performance of the setting. Twenty of these locations were in open workspaces, three were in conference rooms, and two were in the huddle rooms (i.e., smaller conference rooms). Examples of these spaces are shown in Figure 4.
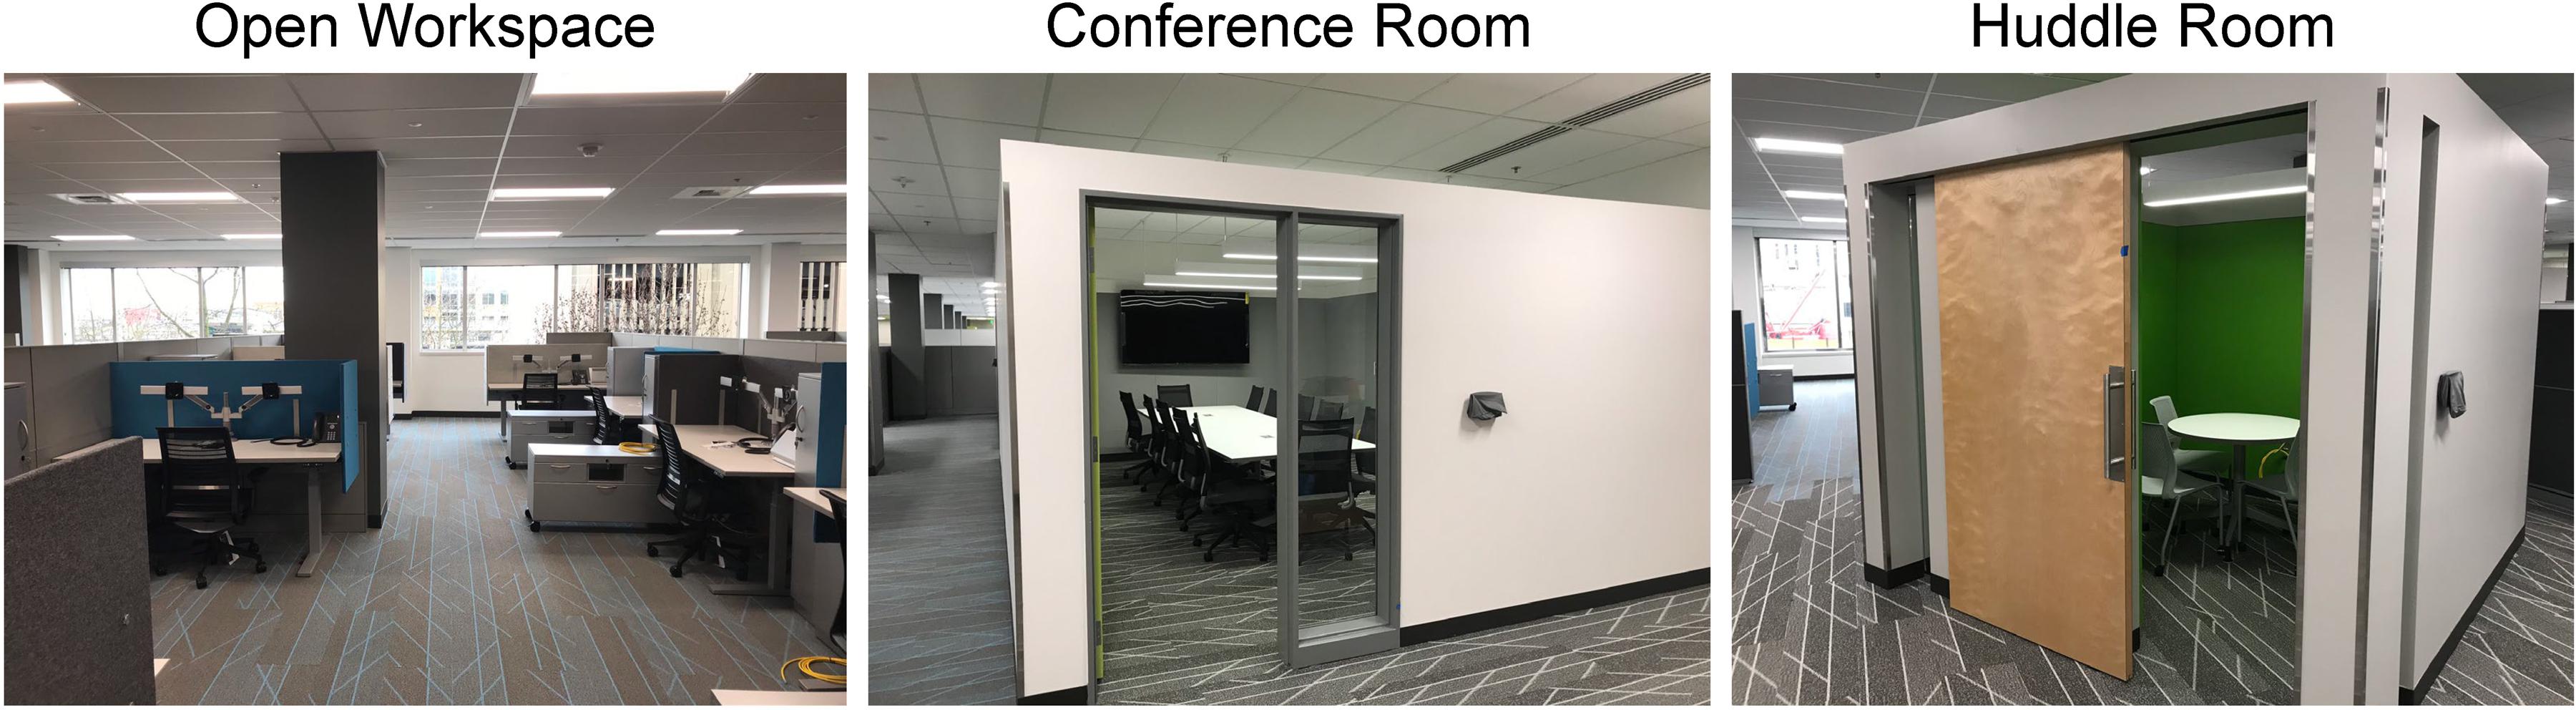
Figure 4. Different types of rooms of the retrofitted workspace.
Measured acoustics parameters were selected in accordance with the WELL Building Standard (International Well Building Institute, 2019), which is the first standard of its kind that focuses solely on the health and wellness of building occupants. Sampling locations were chosen so that different types of spaces were represented, as required by the WELL Building Standard (International Well Building Institute, 2019). Kim A. et al. (2019) discussed the details of the measurement protocol.
Indoor Air Quality
Particulate matter concentrations (i.e., PM2.5 and PM10) were measured to characterize the IAQ of the floor. A Particles Plus 7302-AQM air quality monitor (Particles Plus Inc., 2019) was deployed on C3 approximately one month before the retrofit and started to gather IAQ data at a fixed location to avoid conflict with moving activities. No IAQ data were collected for O3 before the retrofit. After the retrofit, IAQ data were collected from multiple locations (as shown in Figure 2) in both C3 and O3’s open workspaces for approximately 20 days. A summary of the time and locations of collected samples is provided in Table 2.
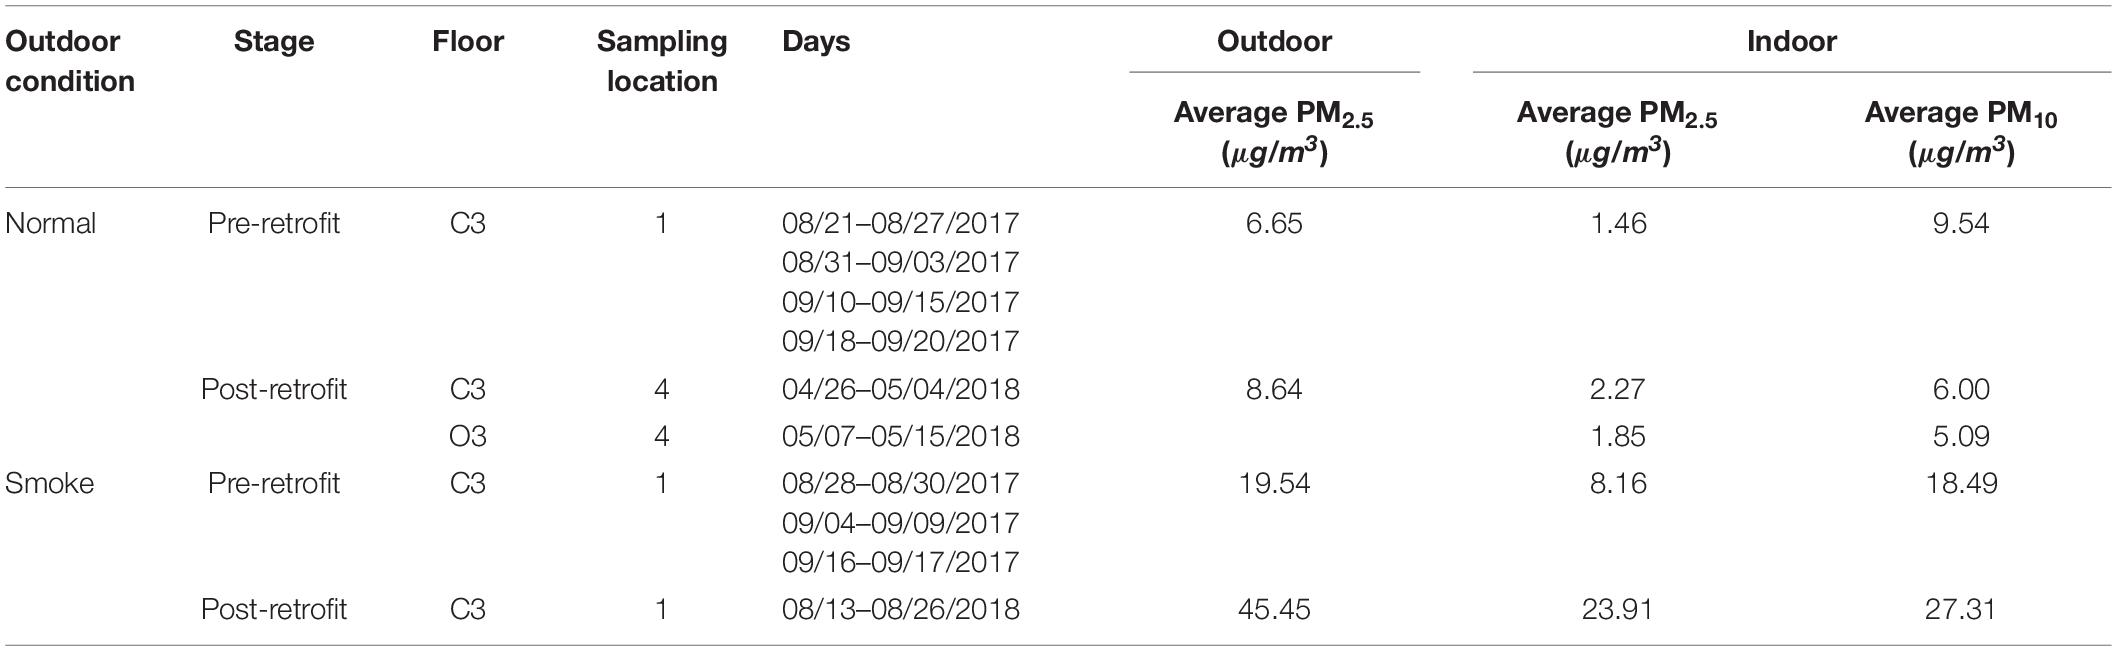
Table 2. Average PM concentration levels pre- and post-retrofit during normal and smoke days (for working hours on weekdays).
During the pre-retrofit measurement of C3 in August and September, 2017, the Seattle area experienced elevated levels of wildfire smoke and the outdoor air was polluted for approximately 11 days. To make IAQ comparisons under similar outdoor conditions, additional IAQ measurements were taken in August, 2018 in the retrofitted workspace when outdoor air was also polluted by wildfire smoke. The hourly average outdoor PM2.5 measurements were obtained from a monitoring station located 7 km south of the UW Tower complex near downtown Seattle. The station is managed by the Puget Sound Clean Air Agency (2019). The outdoor PM10 level is not measured by the agency. The indoor and outdoor PM2.5 concentration ratio (I/O ratio) was estimated to evaluate the pre- and post-retrofit IAQ of the office space.
Psychosocial Environmental Assessment
Two questionnaires were designed to measure over time a number of psychosocial variables drawn from the body of environmental psychology literature (e.g., Veitch et al., 2007). For the purposes of the present study, 19 items were used to measure occupants’ environmental satisfaction. Tests of internal consistency at both time points indicated that the items associated with each other well enough to form a valid scale measuring environmental satisfaction (α = 0.93 for the first distribution of the questionnaire and α = 0.94 for the second distribution).
Specifically, two items asked occupants about their perceptions of the acoustical environment at work, and three items asked them about their perceptions of density in the office space. Another three concerned participants’ perceptions of privacy and two had to do with occupants’ sense of control in altering physical conditions at work. One item had to do with thermal satisfaction, and another with perceptions of the esthetics of the setting. Four items asked about lighting conditions, two items measured perceptions of IAQ, and one asked about views to the outside. Eighteen of these items were measured on a 7-point Likert scale ranging from 1 (“very unsatisfactory”) to 7 (“very satisfactory”) while one item was measured on a 7-point Likert scale ranging from 1 (“strongly disagree”) to 7 (“strongly agree”) (see Tables 3, 4 for exact wording of all items).
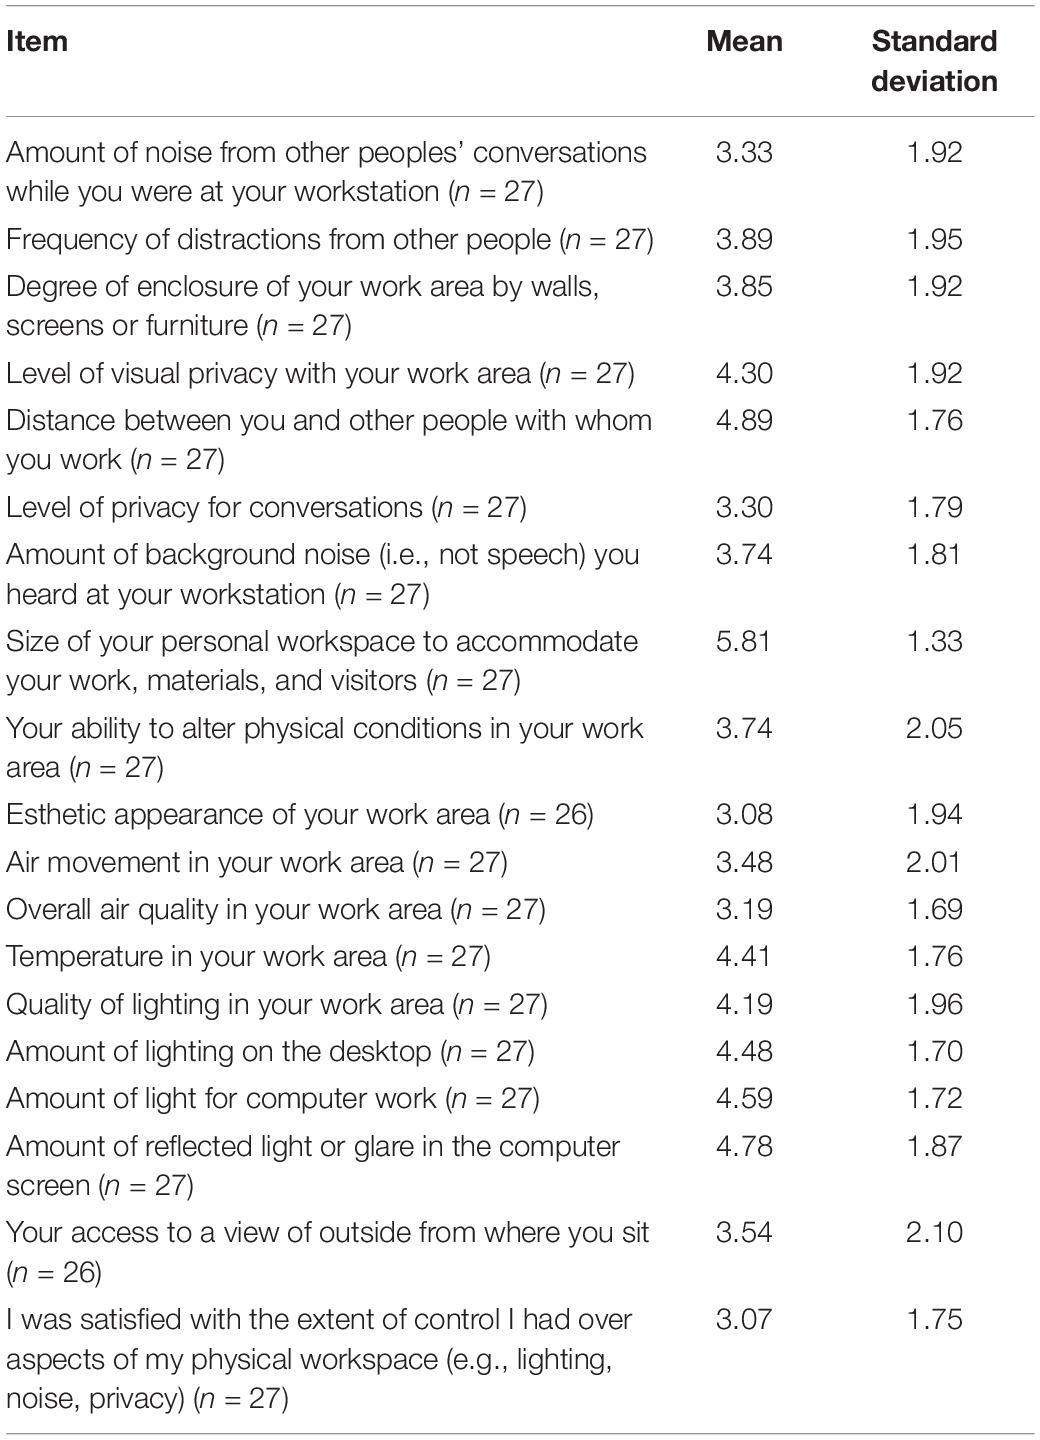
Table 3. Descriptive statistics for items measuring occupant satisfaction with their environment at work before renovation (Time 1).
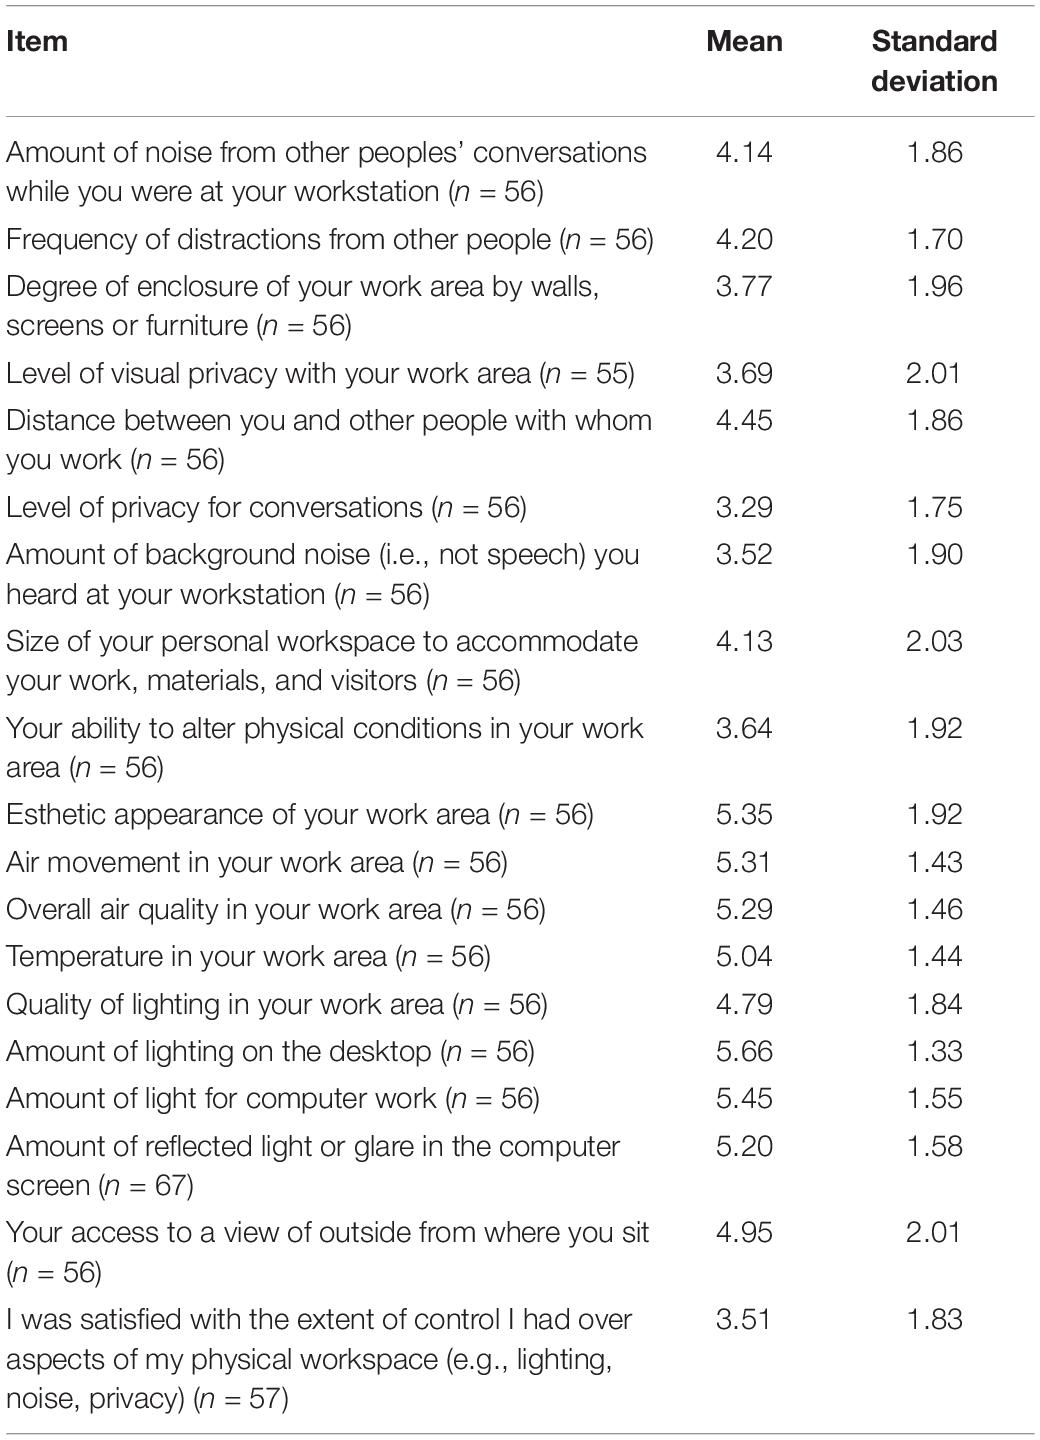
Table 4. Descriptive statistics for items measuring occupant satisfaction with their environment at work after renovation (Time 2).
The second distribution of the questionnaire included two additional items measured on a 7-point Likert scale ranging from 1 (“strongly disagree”) to 7 (“strongly agree”) to capture qualitative feedback from occupants about their perceived input into the design process (see Table 5 for exact wording of all items). Taken together, these two items form a valid scale of participatory satisfaction, with a Cronbach’s alpha of 0.84.
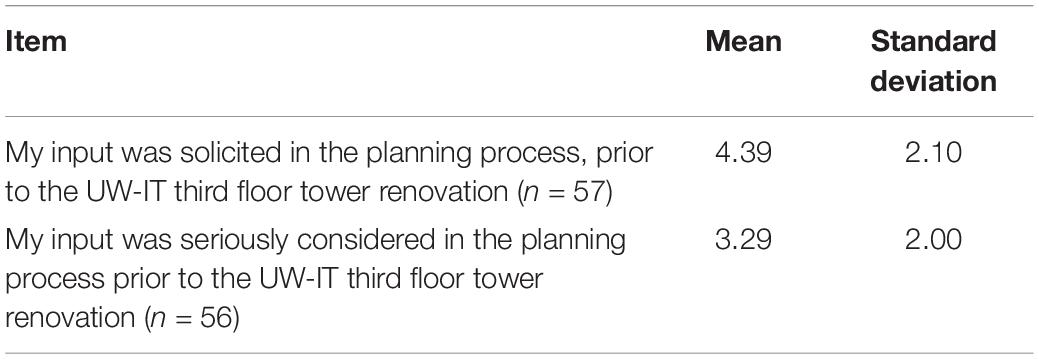
Table 5. Descriptive statistics for items measuring participatory satisfaction with their environment at work after renovation (Time 2).
Finally, an open-ended item was included in the second distribution of the questionnaire that asked participants who agreed that the renovation had changed the ways in which they and their co-workers communicate and coordinate with each other to get work done to list specific examples of why they believed so.
Results
Objective Assessment Results
Light Intensity
Post-retrofit 1-minute illuminance data were obtained from the HOBOs for C3 from June 18th to June 22nd, and for O3 from June 25th to July 3rd in 2018 (weekends excluded). As shown in Figure 5, the light intensity on both floors during working hours (8 a.m. to 6 p.m.) was at a much lower level than what is required by IES for open office spaces. On both floors, overhead fixtures were operating at a dimmed level to conserve energy. Occupants on O3 requested lower ambient light resulting in the lower illuminance observed on O3. In addition, in the case of O3, access to natural daylight is partly blocked by surrounding buildings. Each workstation on C3 and O3 was provided with a task light (PlanLED, 2019) to provide additional targeted lighting to fulfill individual occupant needs. The task lights were color-tunable with a color rendering index (CRI) of 90, capable of delivering 2000 lux of illuminance at its maximum setting. It is worth noting that employees working in C3 and O3 are from the Information Technology (UW-IT) department; their work involves the use of one or more computer monitors, in most cases. This may explain the need for lower ambient light compared to paper-based work tasks.
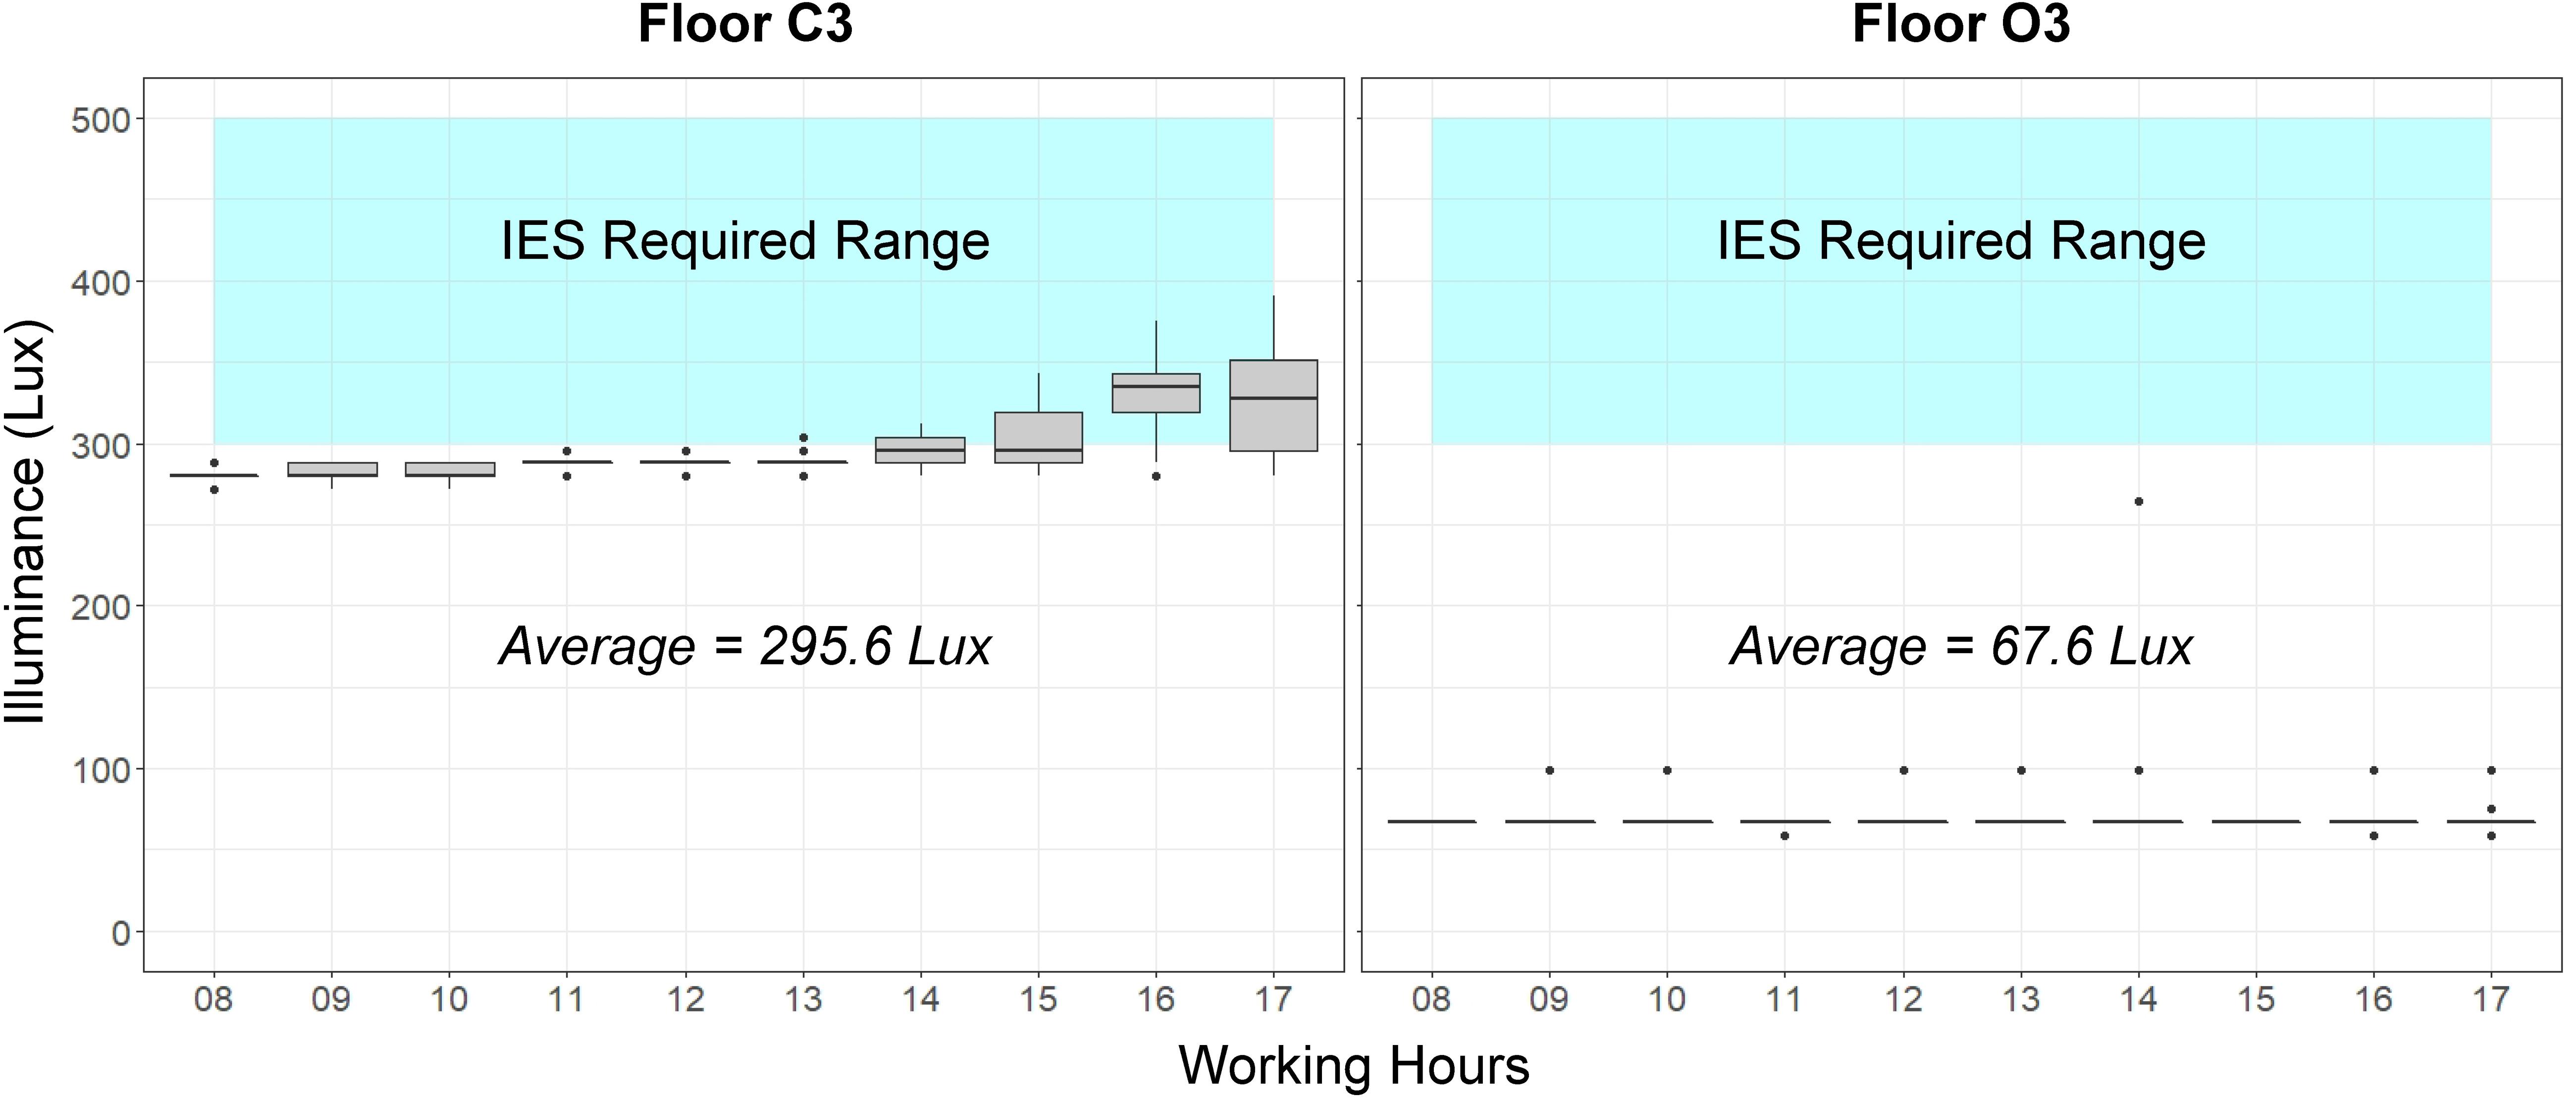
Figure 5. Post-retrofit light intensity on C3 and O3 during working hours on weekdays.
Acoustics
Measurements of acoustical parameters were conducted on October 11th and 15th, 2018 during unoccupied hours (after 6 p.m.). Kim A. et al. (2019) discuss the details of the analysis. Exterior noise was within the range of 40.0–43.6 dBA across all of the 26 sampling locations—this did not exceed 50 dBA, as required by the WELL Building Standard (International Well Building Institute, 2019). The internally-generated noise in the majority of the open office space met the NC40 requirements except for four sampling spots that exceeded the limit at high frequencies (near the range of 2–5 kHz). Noise readings in the sampled conference rooms and huddle rooms were above the recommended NC30 curve at mid and high frequencies (ranging from 1 to 8 kHz). The reverberation time RT60 exceeded the maximum recommended value in nine out of 21 sampling spots in the open spaces, and in two out of five sampling spots in enclosed spaces (including conference rooms and huddle rooms). The measured sound masking noise level was, in general, lower on O3 than C3 (i.e., lowered by facilities management at the request of some dissatisfied O3 occupants). The levels of most of C3’s open spaces were within the range defined in WELL (International Well Building Institute, 2019) while levels in O3 were below range. Because of the open ceiling design of all the conference and huddle rooms, much higher sound masking levels existed than what is required by WELL (International Well Building Institute, 2019) in order to afford conversational privacy. As a result, open office areas close to these room types also experienced higher sound masking noise levels.
Indoor Air Quality
Five-minute PM2.5 and PM10 concentrations were obtained pre- and post-retrofit and were averaged over one hour. These hourly averages were separated further based on outdoor air conditions (normal days and smoky days). From Table 2, it can be seen that, under normal outdoor conditions, the average indoor PM2.5 and PM10 levels were much lower than the acceptable limit specified by RESET (2018) and WELL (International Well Building Institute, 2019) during working hours. When the outdoor air was polluted by wildfire smoke, the average indoor PM2.5 and PM10 levels were still within acceptable ranges, although elevated.
To better compare the IAQ before and after the retrofit, a time series of both PM2.5 and PM10 measurements are given in Figures 6–8. The performance of the ventilation system appeared to be consistent before and after the retrofit under normal outdoor conditions as shown in Figures 6, 7. During smoky days, the post-retrofit PM2.5 in Figure 8 appeared to exceed limits on multiple occasions (which was not the case before the retrofit, as shown in Figure 6). However, the outdoor PM2.5 level was much higher during the smoky days in 2018 than in 2017, which may explain the exceedance. To facilitate a fair comparison, the I/O ratio for PM2.5 was estimated using linear regression. By defining the outdoor PM2.5 concentration as xout, the indoor PM2.5 concentration xin can be calculated as follows:
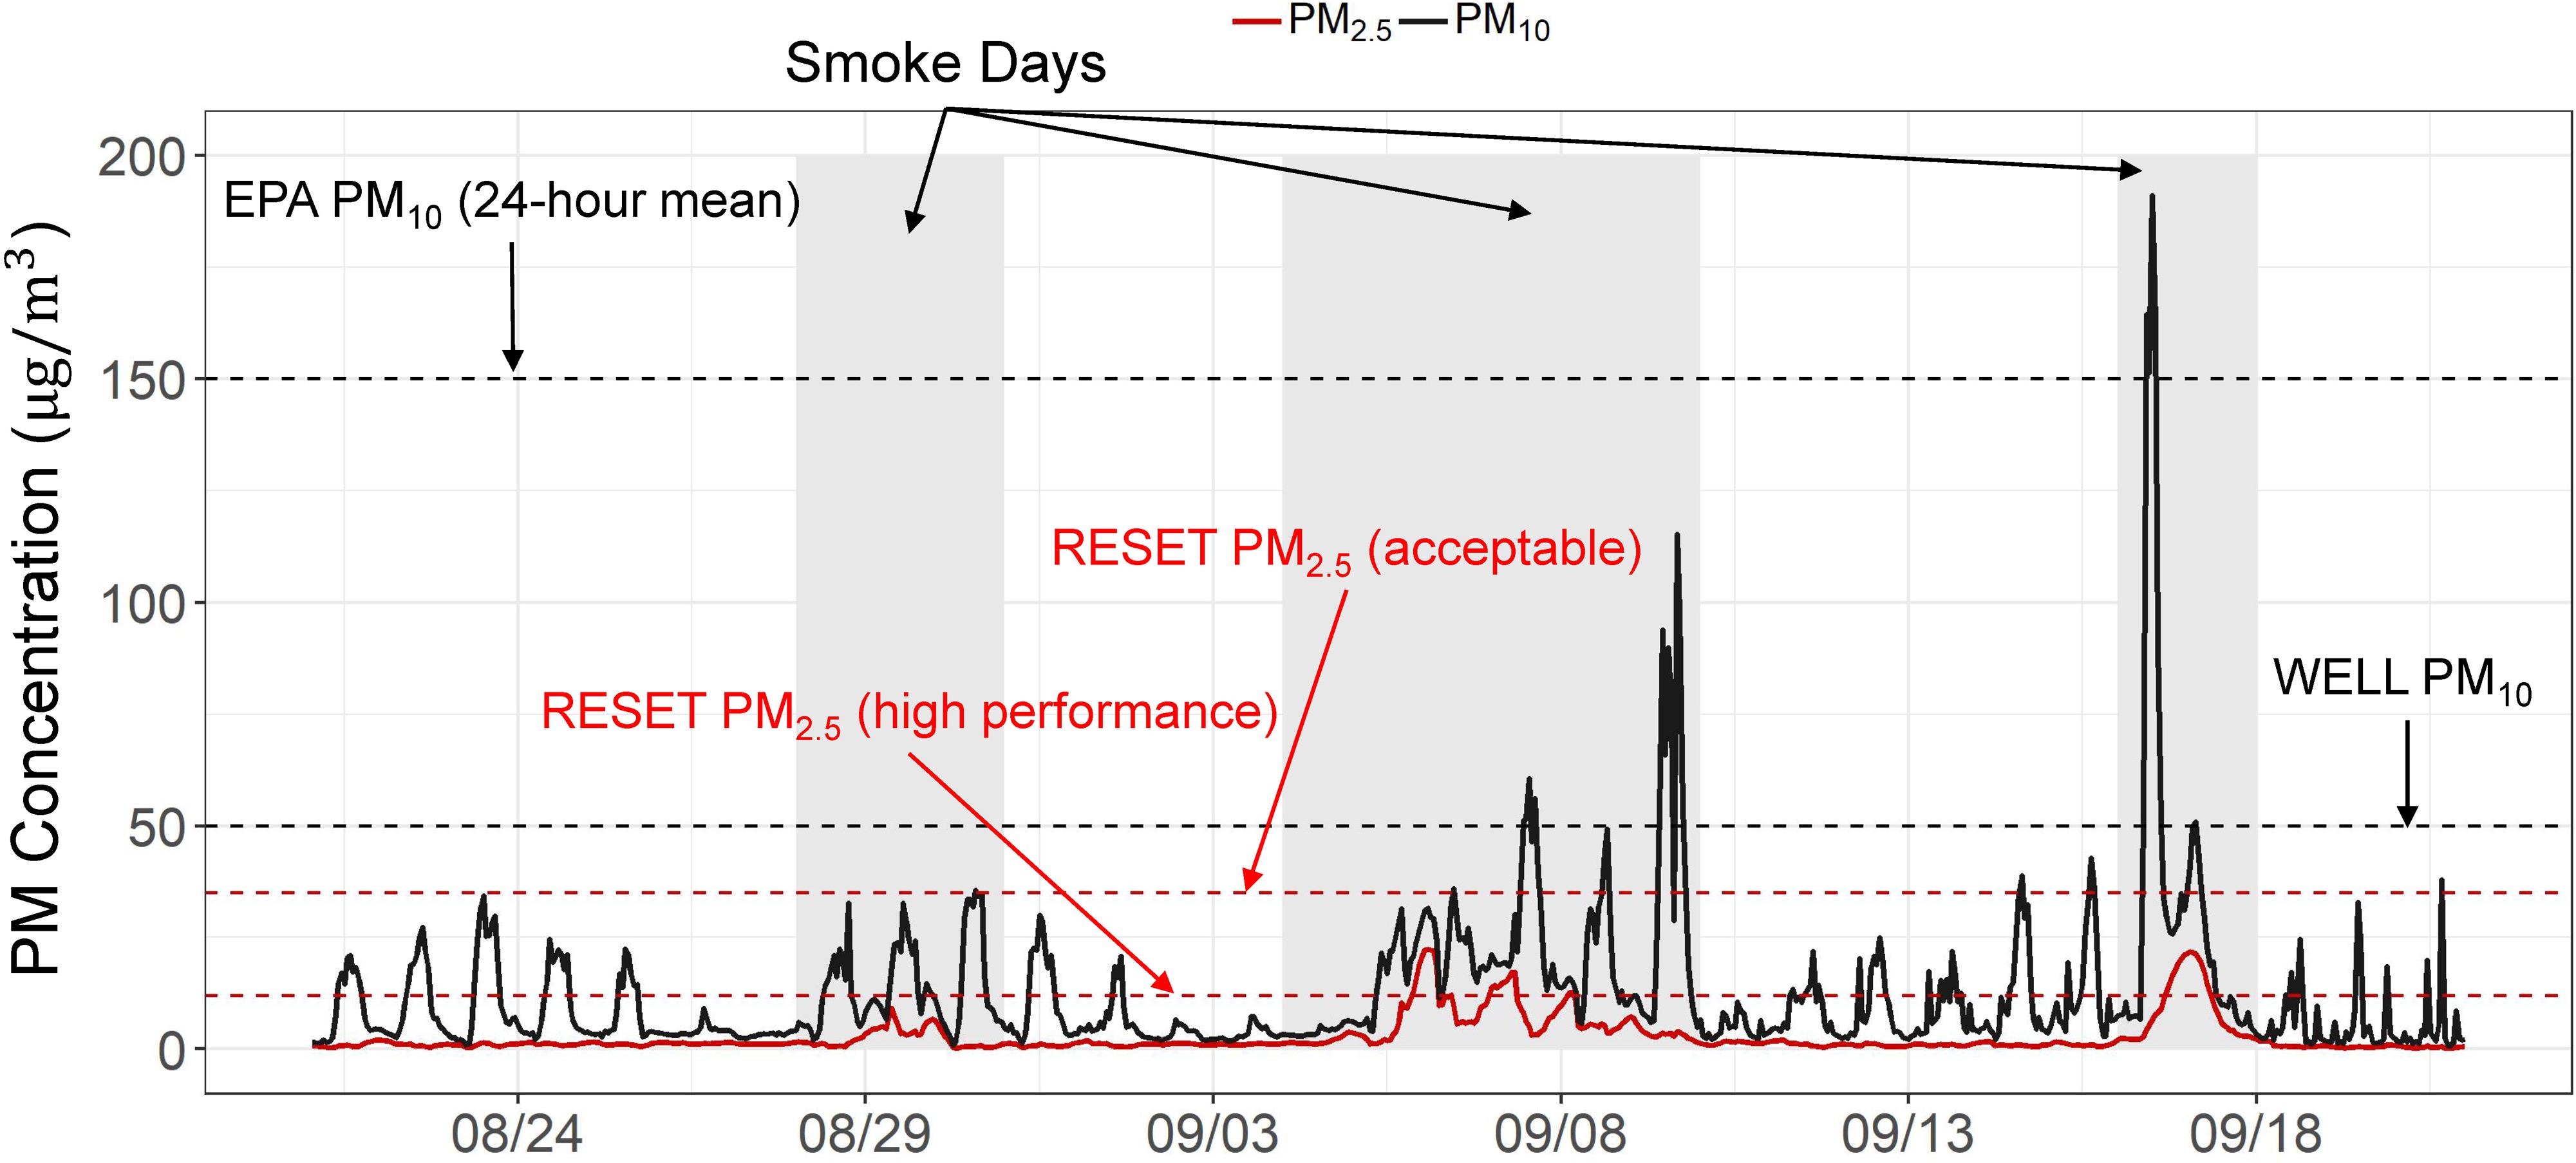
Figure 6. Pre-retrofit PM2.5 and PM10 levels on C3.
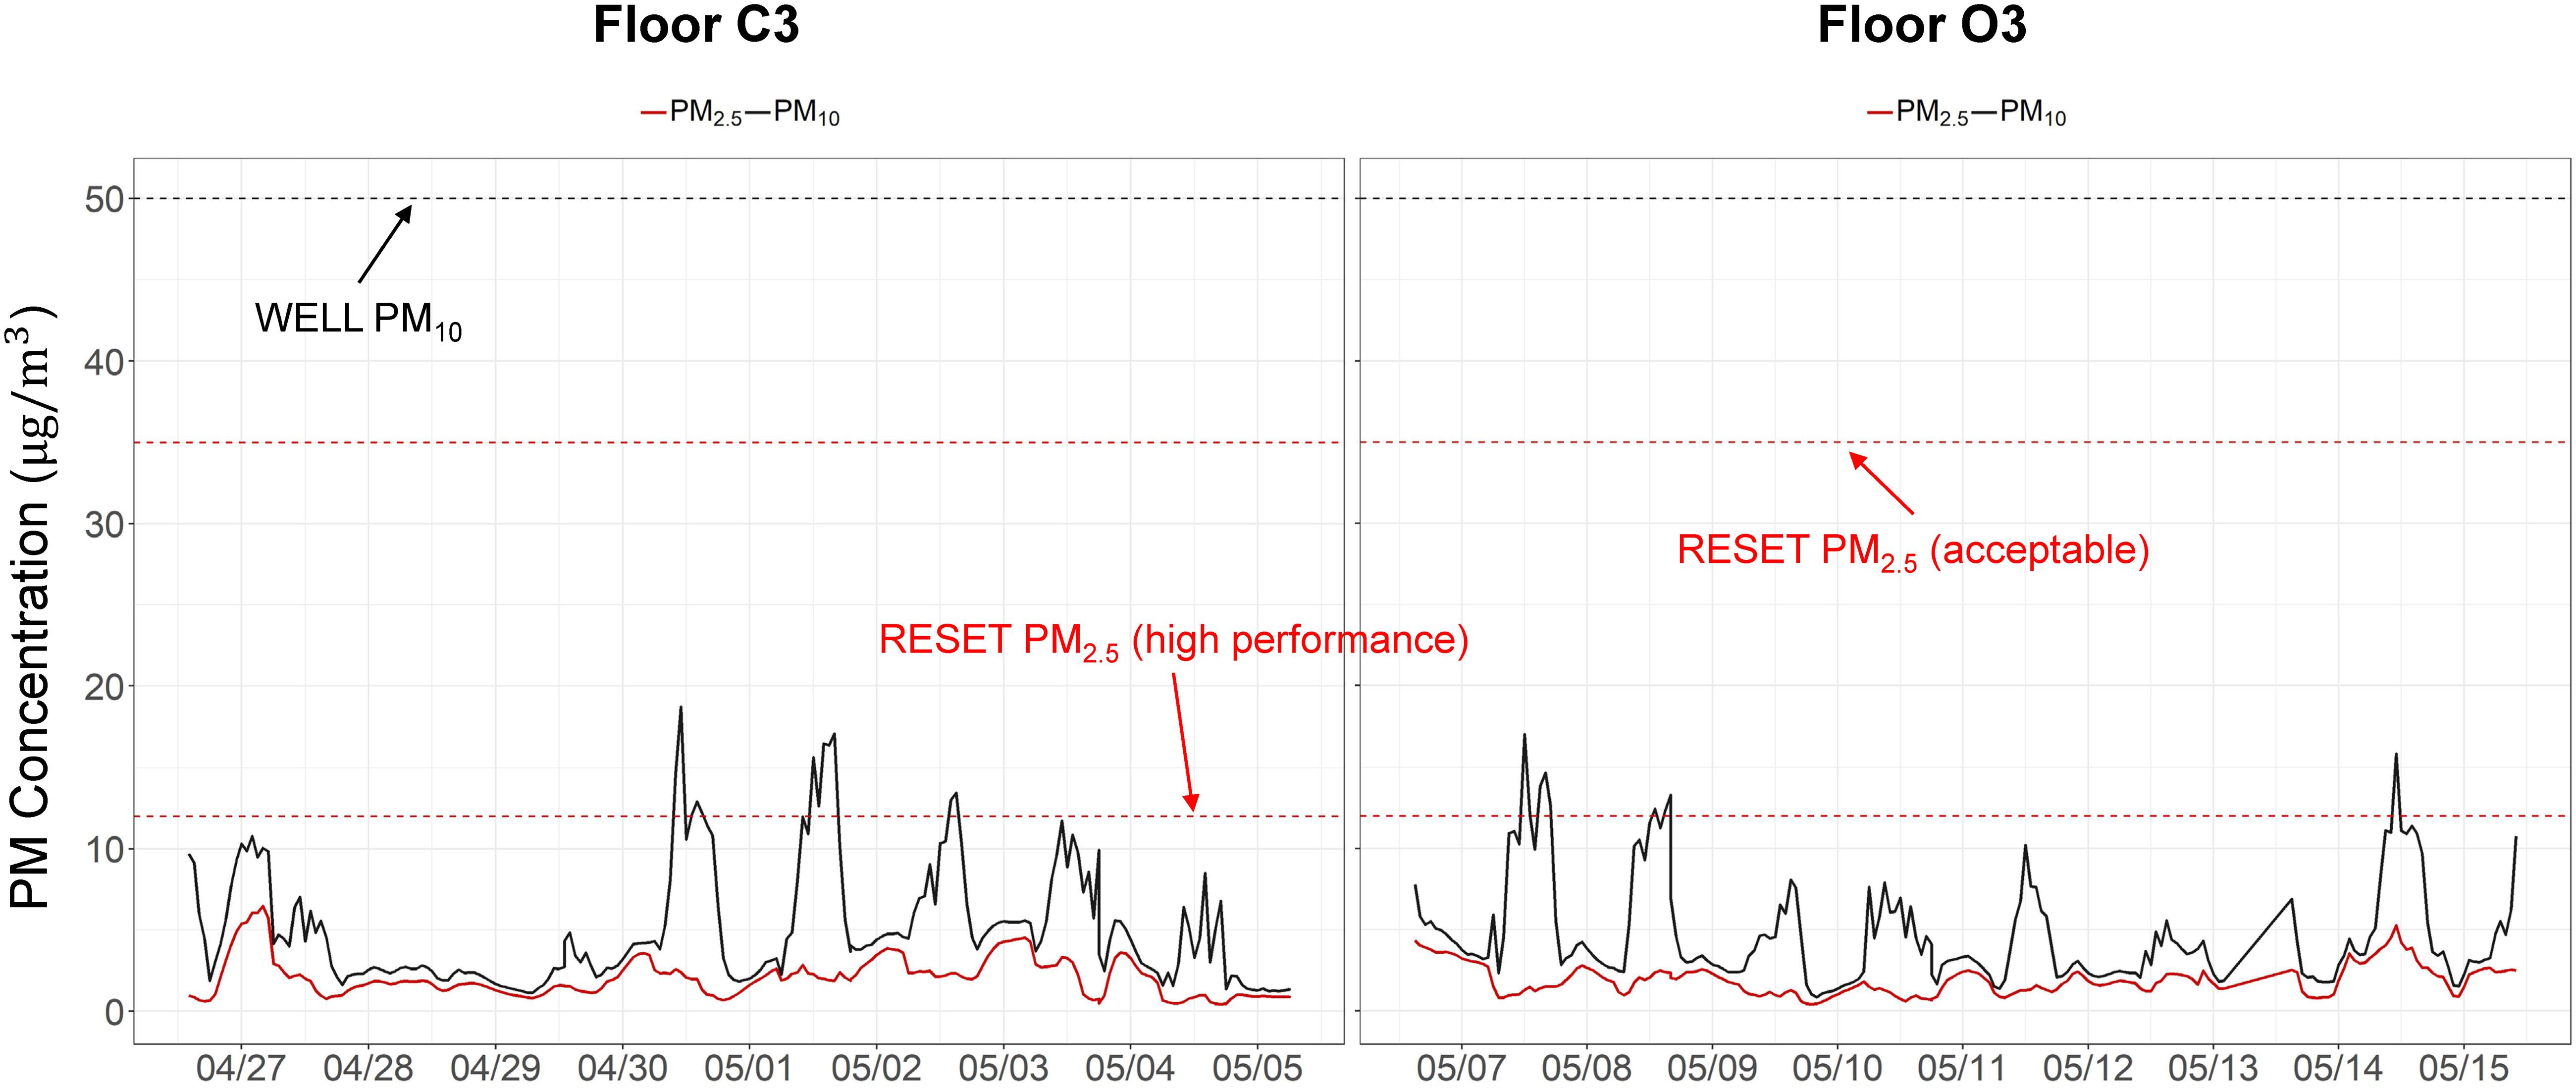
Figure 7. Post-retrofit PM2.5 and PM10 levels on C3 and O3 during normal days.
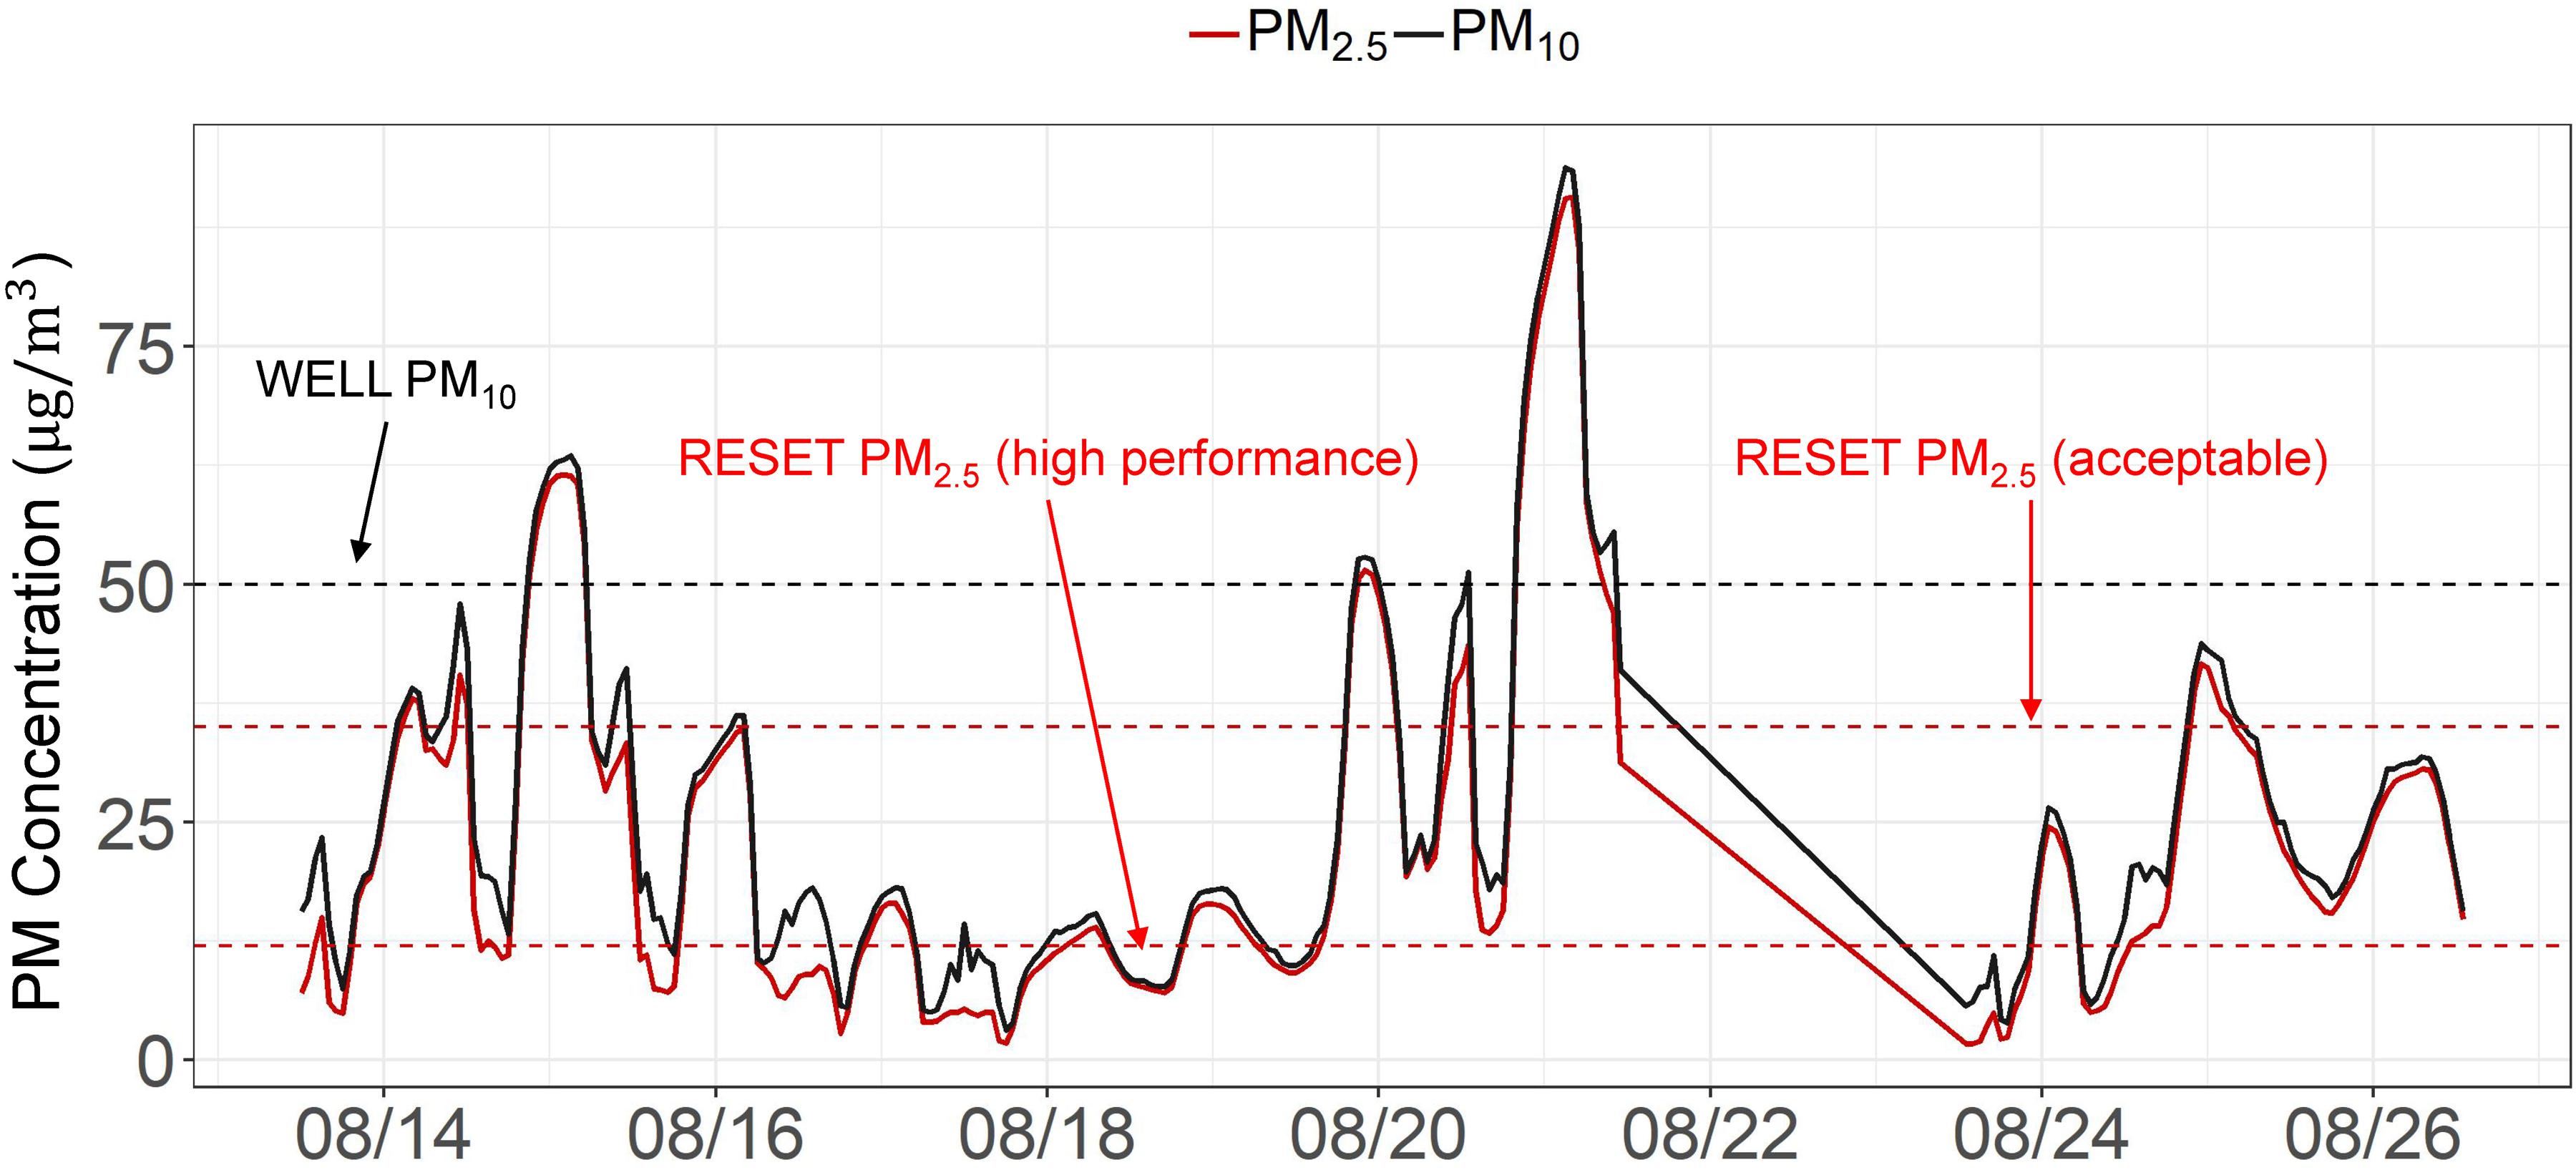
Figure 8. Post-retrofit PM2.5 and PM10 levels on C3 during smoke days.
where a0 is the indoor PM source, and a1 is the I/O ratio. Scatter plots in Figure 9 show that on normal days, the indoor and outdoor PM2.5 did not appear to have much correlation and indoor levels were maintained in a range of approximately 0 to 6 μg/m3. When outdoor PM2.5 was elevated because of wildfire smoke, the correlation strengthened. However, the I/O ratio was still below 50% before and after the retrofit.
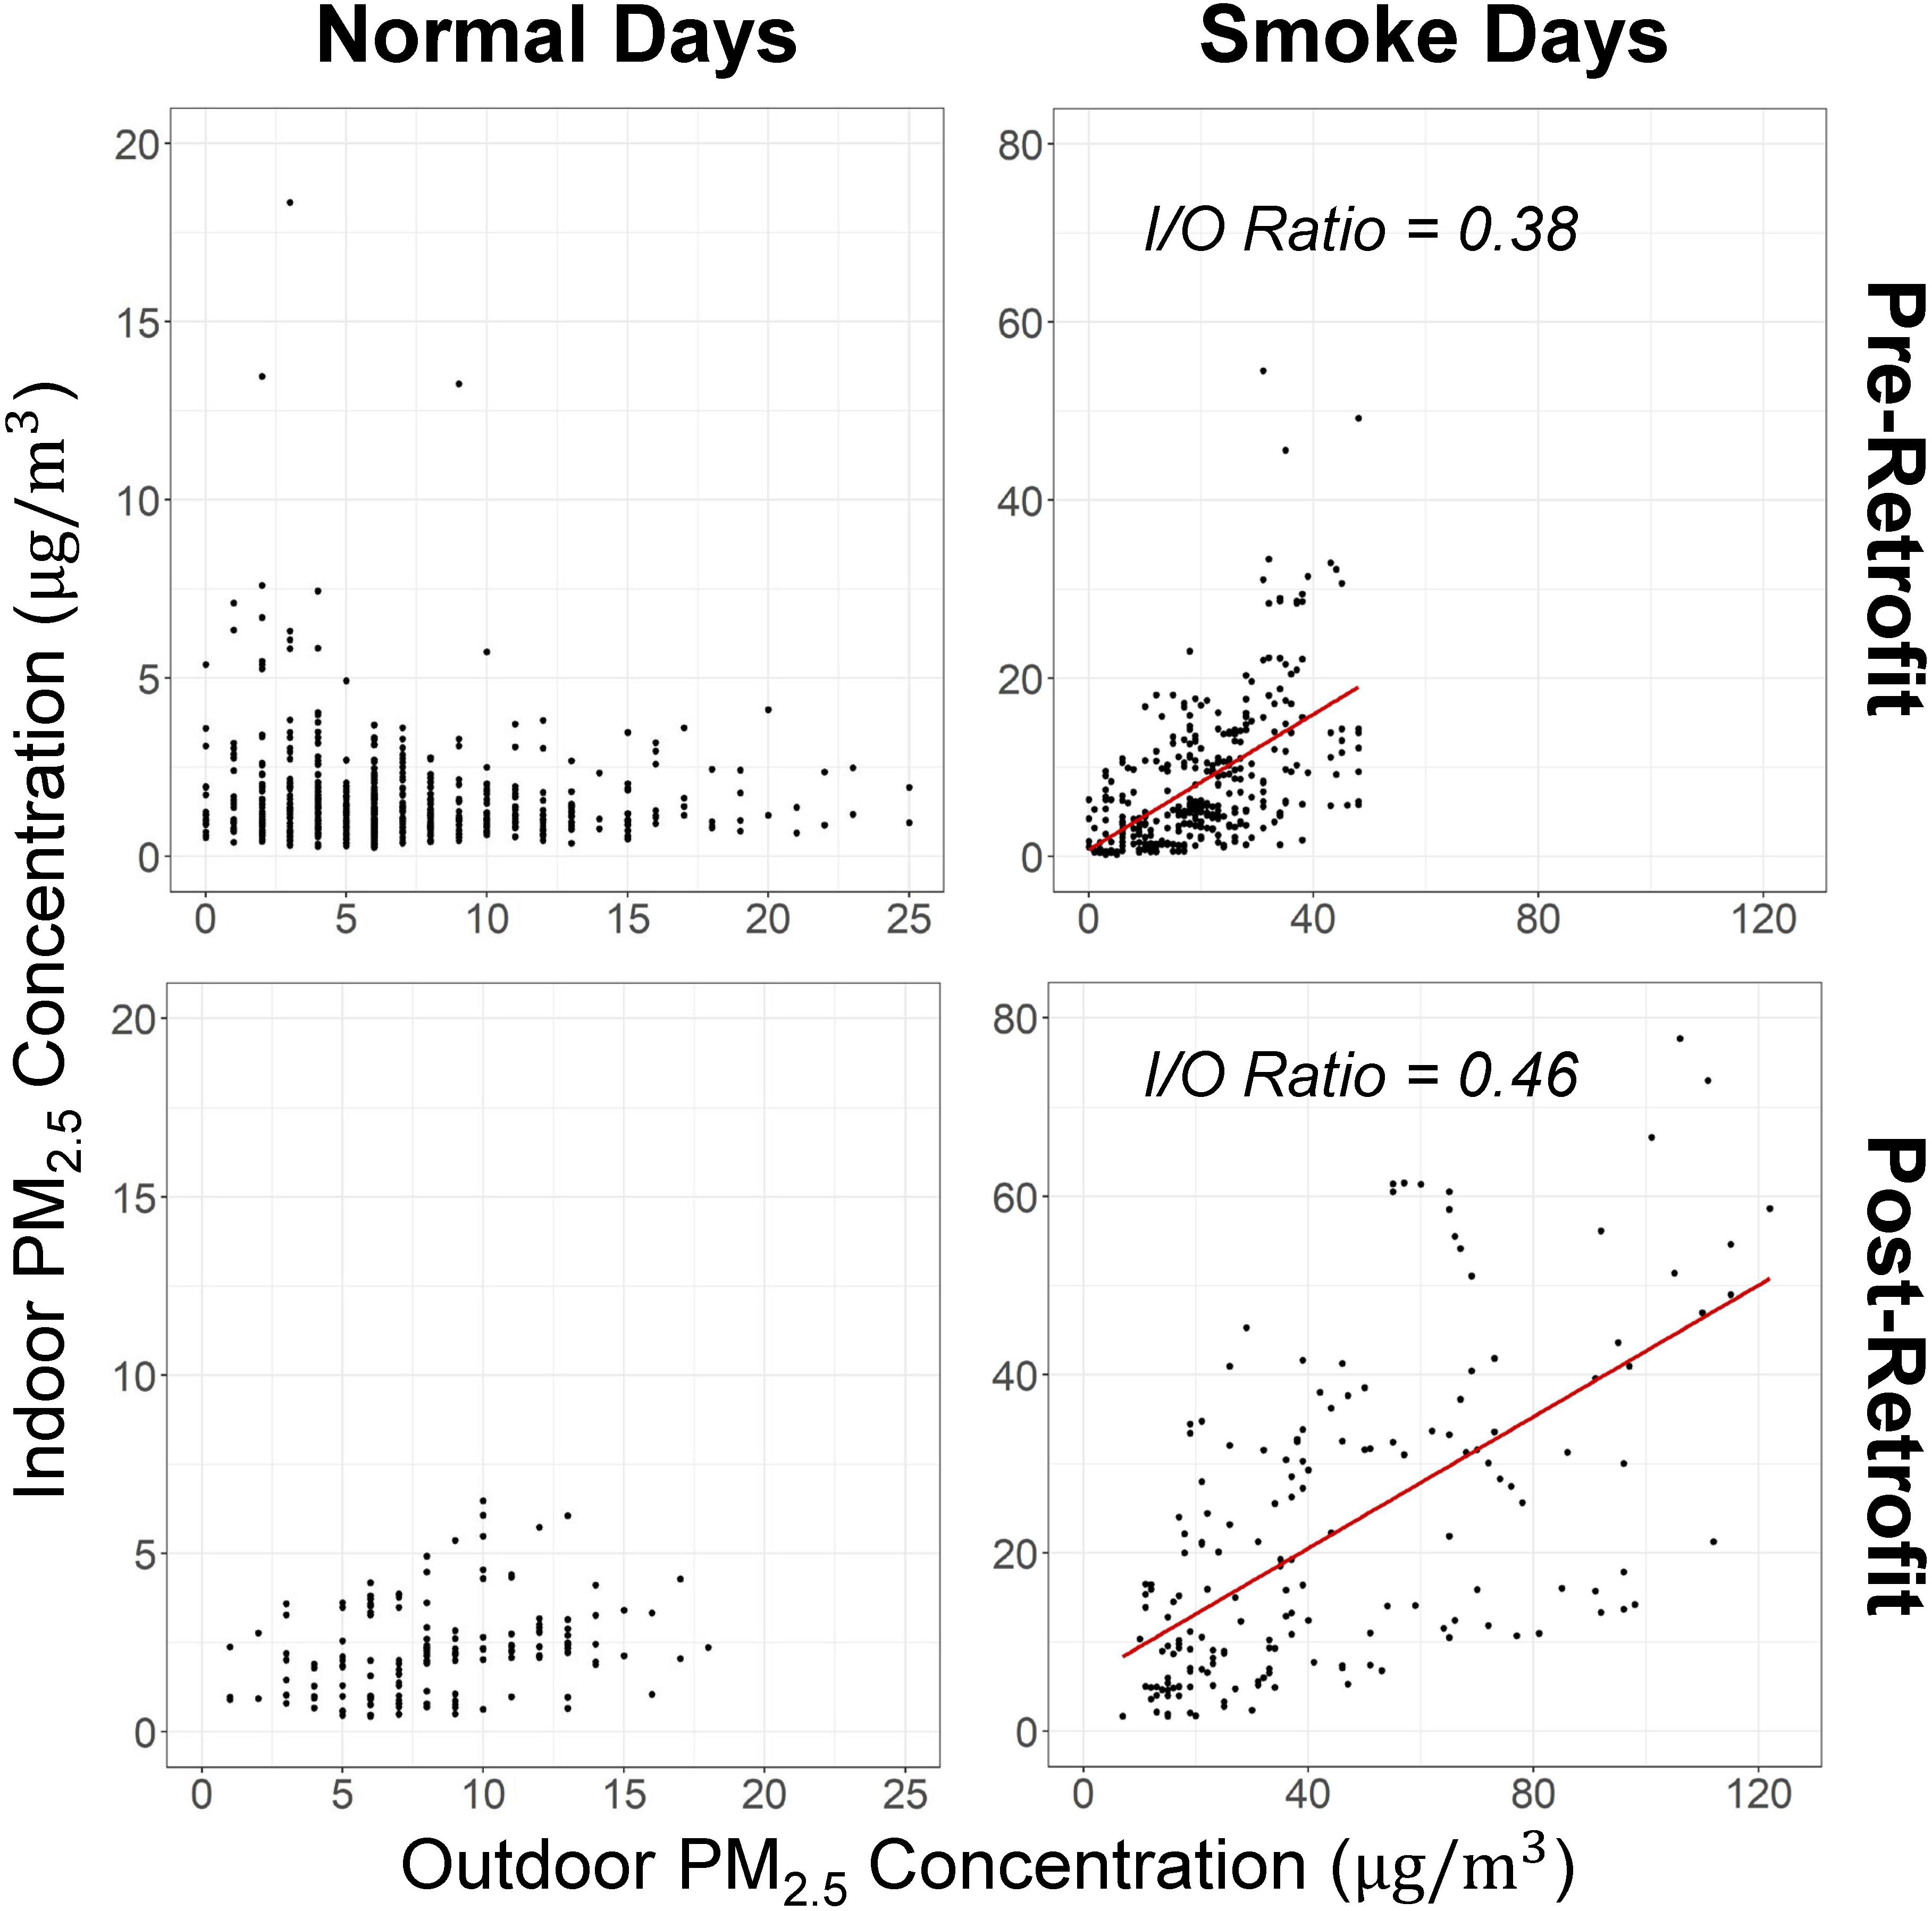
Figure 9. Estimated I/O ratios for PM2.5.
Psychosocial Environmental Assessment Results
Data for each item, for both distributions of the questionnaires, were checked for normality based on recommendations by Kline (1998). All items met the criteria for acceptable skewness (values between +3 and −3) and acceptable kurtosis (values between +8 and −8). Means and standard deviations for the 19 items measuring occupants’ environmental satisfaction concerning their experience with the setting before the retrofit can be found in Table 3. Table 4 lists the means and standard deviations of the same items concerning the time after the retrofit.
While considering their work environment before the retrofit, participants responded quite neutrally to all items (i.e., most means were between 3 and 4.5 on the 7-point Likert scale). The item with the highest mean had to do with participants’ satisfaction with the size of personal workspaces to “accommodate work, materials, and visitors” (M = 5.81, SD = 1.33). The lowest mean value concerned item asking about occupants’ satisfaction with the extent of control they felt to have over aspects of their physical workspace (M = 3.07, SD = 1.75).
When responding to the same items during the second distribution of the questionnaire, the item with the highest mean concerned perceptions of the amount of light on employees’ desktops (M = 5.66, SD = 1.33). The lowest mean value for occupants responding about their work environment after the retrofit was for the item concerning satisfaction with the level of privacy for conversations (M = 3.29, SD = 1.75).
Although only eight individuals took part in both questionnaires, paired samples t-tests were conducted using Bonferroni-adjusted alpha levels of 0.003 per test (0.05/19) to understand whether any differences between the two time points were statistically significant (cf. Rosenthal and Rosnow, 1991). Four differences were revealed to be statistically significant (all other ps > 0.003) whereby participants answering the questionnaire after the retrofit felt more satisfied with the esthetic appearance of their work area, t(7) = −4.33, p = 0.003, the amount of lighting on their desktops, t(7) = −6.11, p < 0.001, the amount of light for computer work, t(7) = −4.93, p = 0.002, and the amount of access to a view outside, t(7) = −6.34, p < 0.001 (all means and standard deviations are reported in Table 4).
To better understand whether differences existed in occupants’ broader perception of environmental satisfaction, a variable containing all 19 items was computed per time point because of the strong Cronbach’s alpha levels. A paired-samples t test between scale means revealed that, overall, participants felt more environmental satisfaction after the retrofit, M = 3.99, SD = 1.25 and M = 4.45, SD = 1.21, respectively, t(56) = 2.84, p = 0.01.
The two additional Likert-scale items measured in the second distribution of the questionnaire concerning perceptions of input into the design process afforded neutral mean values (see Table 5). However, when taken together as a scale measuring participatory satisfaction, it correlated significantly and positively with occupants’ overall perceptions of environmental satisfaction after the completion of the retrofit, r = 0.60, p < 0.01.
The open-ended item included in the second distribution of the questionnaire was systematically content analyzed as per Sommer and Sommer (2001) to understand emergent themes for occupants as they considered how the renovation benefited them and their peers working in the office. When occupants who believed that the renovation had changed the ways in which they communicated and coordinated with their co-workers were asked to provide specific examples, four main themes emerged from the 58 distinct comments offered by the 33 individuals who chose to answer this item (58% response rate). The four main themes that emerged from the open-ended data were “connectedness/collaboration and social interaction” (52% of the comments), “privacy” (12% of the comments), “noise” (12%), and “interruption and distraction” (11%). While other themes also emerged from the data, such as “efficiency,” “lighting,” and “control,” none made up more than 5% of the data and so were not analyzed further (although it is worth noting that all of the comments in these themes were negatively-valanced).
Because the themes in this study were not created and validated in previous research, disagreements between two raters were counted before being resolved through discussion so that an inter-rater reliability statistic could be calculated. Cohen (1960) kappa was used to assess inter-rater reliability for each main theme. In general, a substantial agreement between raters (i.e., no disagreements for all themes, κ = 1.0) occurred.
The most frequent theme, “connectedness/collaboration and social interaction,” included comments such as “The new space helps people meet each other casually” and “The open space design has afforded quick and easy communication between team members.” Indeed, 87% of the comments in this theme were positively-valanced. Comments in this theme centered around categories to do with perceived spontaneity and efficiency of teamwork fostered by a sense of physical proximity between employees. Huddle rooms and open spaces were noted as affording opportunities for collaboration and communication, as well as the new technology added to the office space (e.g., name cards and lights to show when an employee was free or busy).
Similarly, the second most frequent theme, “privacy,” contained comments such as “there is very little privacy for sensitive work or phone conversations that need to be kept private between customers without details being shared to neighboring teams or people who walk by,” and “additionally, there are not enough conference rooms that actually offer privacy, all the conference rooms can hear people in the desks around them from inside and in the desk around or walking by in the halls we can hear the conversations in the conference rooms.” However, most comments in this theme (67%) were positive, generally falling into categories concerning technology, desk layout, and orientation.
Finally, the other two main themes of “noise” and “interruption and distraction” contained predominantly negative words and phrases (89 and 87%), respectively. For example, one participant stated that it is “very difficult to have conversations with the background pink noise,” and “noise and distractions are much more of an issue with the open office format and people have been told this is a collaboration space. This ended up being a double whammy: it’s harder to concentrate because of the terrible desks, and people don’t care about making noise because it’s ‘collaboration’.” Categories to do with noise concerned environmental stress and sensitivity in relation to the sound masking system, and the open-plan layout. The one positive comment about noise was that “the white noise dampens distracting conversations.”
Categories to do with interruption and distraction generally concerned the same elements as those within the “noise” theme. Most comments had to do with conversational distractions, dissatisfaction with the open-plan layout, and that, in comparison, more interruptions and distractions were being perceived after the renovation. Comments to do with both of these themes noted that the increase in spontaneous collaborations and communication had created a negative amount of noise, interruption, and distraction.
Discussion
In general, occupants’ overall environmental satisfaction increased after the retrofit. When recalling their perceptions of the setting before design changes were made, occupants responded neutrally. The strongest attribute driving satisfaction with the original setting was the size of personal workspaces. Had this been understood in the planning stages of the retrofit, occupants’ satisfaction levels concerning this attribute may not have decreased. Indeed, other studies have demonstrated that occupants appraise indoor environmental qualities differently depending on the amount of personal space and spatial configuration they perceive to have in their workplace (Kim and de Dear, 2013; Leder et al., 2016).
After the retrofit, the lowest mean value concerned occupants’ satisfaction with the level of privacy they had for conversations. Interestingly, this quantitative result seems to contrast with qualitative data offered by participants who elected to respond to open-ended items in the questionnaire. When answering about the ways in which the new office had changed their behavior at work, the most frequent theme had to do with “connectedness/collaboration and social interaction” and many concerned positive reflections on the ease with which employees could chat, work together, and solve problems. It seems that although changes were made to the size of personal workstations, and that the level of privacy was generally understood by occupants to be less satisfactory than before the retrofit was complete, a positive outlook on collaboration and pro-social interaction occurred for employees. It seems that while most of the positive comments to do with privacy concerned technology, desk layout, and orientation, many of the negative comments centered on conversational confidentiality at desks and in the huddle rooms. Facilities managers and designers should continue to place value on the strength of occupants’ desires for conversational privacy at personal workstations, as well as in common areas (along with privacy in relation to the work done on computer screens).
Other comments noted that the increase in spontaneous collaborations and communication after the renovation, with its open-plan design and white noise system, had created an overload of noise, along with excessive interruptions and distractions. The combination of positive and negative comments in response to the renovation highlights the nuances of human environmental perceptions of indoor environments. Not surprisingly, a sense of control is an important element in the body of literature on the ways in which people respond to changes in the work setting–significant sources of dissatisfaction in open-plan offices include air quality (Pejtersen et al., 2006), noise level, and lack of privacy (Brookes and Kaplan, 1972; Mercer, 1979; Marans and Spreckelmeyer, 1982; Sundstrom et al., 1982; Zalesny and Farace, 1987; Brill et al., 2001; Pejtersen et al., 2006; Danielsson and Bodin, 2008; Haapakangas et al., 2008; Kaarlela-Tuomaala et al., 2009; Lee, 2010; Frontczak et al., 2011; Kim and de Dear, 2013). Performance ratings also appear to decline when employees work in relatively dark offices with a higher density, at closer interpersonal distances, especially when they have difficulty screening out unwanted stimulation (Oldham and Fried, 1987; Oldham et al., 1991). In the present case study, occupants recalled feeling dissatisfied with the amount of control they had over lighting, noise, and privacy in their workspace before the renovation. Although occupants’ perception of control did not significantly improve after the retrofit was complete, their responses about the extent of input they had into the retrofit process correlated significantly and positively with overall perceptions of environmental satisfaction after its completion. This correlation supports other research (e.g., Hongisto et al., 2016; Kim A. A. et al., 2017) and may serve as additional evidence that a sense of control over sources of environmental stimuli, as well as over provision of input into the design process, associates with a general satisfactory outcome for building users.
Objective data collected about the post-retrofit lighting quality indicate that overhead light fixtures had been dimmed, affording light intensities below industry standards. Nevertheless, participants who took part in both pre- and post-retrofit questionnaires reported significantly stronger levels satisfaction with the amount of light on their desktops, and for doing computer work, than before the design changes occurred. Arguably, after the retrofit, many occupants may have perceived ability and freedom to “layer on” light at their workspace by using the newly supplied tuneable task lights. Given that diming overhead light fixtures can conserve energy for a building, these satisfactory results from the perspective of participants may be used to support arguments made by facilities managers wishing to make energy-efficient decisions without negatively affecting occupant satisfaction. Of course, the results of the present study may be, partially, influenced by the type of work occupants were doing on the floor (i.e., using computers for most of the workday for IT tasks).
After accounting for wildfire smoke, no significant changes to objective measurements of air quality on the floor were detected. In fact, participants’ satisfaction with air movement in their work area improved after the retrofit. This may be because the open-plan layout included lower-partitions around individual workspaces and more open, common areas in which employees can spend time during the workday. And, while the acoustics on the floor were, objectively, within recommended “healthy” ranges, qualitative data indicate that many occupants’ had a negative perception of noise levels in some parts of the floor, which spurred decisions to further lower sound masking levels in particular areas. Comments often cited environmental stress and sensitivity in relation to the sound masking system and the open-plan layout. Kim A. et al. (2019) explore in detail why these results may have occurred and highlight that a general approach to acoustics when retrofitting open-plan offices can be complex at the level of the individual. Indeed, Kim and de Dear (2013) found noise levels (along with visual privacy) to be the primary concern for open plan office occupants. Despite advances in sound masking technology, facilities managers should remain attentive to occupants’ levels of satisfaction with acoustics in different areas of a setting and be prepared to accommodate designs based on human perception.
Conclusion
One aim of this case study was to offer a straight-forward example for facilities managers and researchers alike wishing to perform systematic, naturalistic, mixed-methods research in office spaces that have recently undergone a retrofit. We measured a range of employee perceptions about the previous and new open-plan work environment. After the new setting had been used for 1.5 months, occupants reported being more satisfied, in general, than they recalled being with the original setting. The size of personal workspaces and privacy were especially important to employees. Differences in quantitative and qualitative data highlight the importance of gathering data from building occupants in a number of ways and exploring them carefully to better understand why environmental satisfaction (or dissatisfaction) exists. Employees’ sense of environmental control remained a key theme in the data (and supports a number of previous studies in the field of environmental psychology). While perception of control did not improve after the retrofit, occupants’ responses about the level of input they had into the retrofit process correlated significantly and positively with their perceptions of environmental satisfaction after its completion. Results may have implications for organizations and designers as they consider new ways to improve IEQ in today’s office settings that do not apply a “one-size-fits-all’ approach to design. Indeed, the nuanced findings in this case study, along with its relatable materials and procedure, add to a growing body of literature merging social scientific methodologies with technical environmental assessments for practical use by decision-makers who wish to attend to the subjective needs and preferences of building users.
Data Availability Statement
The datasets generated for this study are available on request to the corresponding author.
Ethics Statement
The studies involving human participants were reviewed and approved by University of Washington Human Subject Division (IRB ID: STUDY00002930). Written informed consent for participation was not required for this study in accordance with the national legislation and the institutional requirements.
Author Contributions
AK and LM contributed to the development of the project idea and drafted the manuscript for publication. SW performed the objective data analysis. LM performed the subjective data analysis. HS reviewed the final manuscript and provided feedback on the objective assessment results.
Funding
The portion of work related to indoor air quality was partially supported by the National Science Foundation (Grant #1852995). Any opinions, findings, and conclusions or recommendations expressed in this material are those of the authors and do not necessarily reflect the views of the National Science Foundation.
Conflict of Interest
The authors declare that the research was conducted in the absence of any commercial or financial relationships that could be construed as a potential conflict of interest.
Acknowledgments
The authors would like to thank Troy Swanson and the UW Tower Facility Services team for assisting in the indoor air quality monitoring, and Kim Lokan (UW IT Facility Services) and UW IT occupants for allowing us to access their space and for participating in the survey. We also thank Dana Kendall (Seattle Pacific University) for helping to develop some of the questionnaire items.
References
ASHRAE, (2013). ANSI/ASHRAE Standard 55-2013 – Thermal Environmental Conditions for Human Occupancy. Atlanta, GA: The American Society of Heating and Refrigerating and Air-Conditioning Engineers.
Brill, M., Weidemann, S., Allard, L., Olson, J., and Keable, E. B. (2001). Disproving Widespread Myths about Workplace Design. Jasper, IN: BOSTI Associates.
Brookes, M. J., and Kaplan, A. (1972). The office environment: space planning and affective behavior. Hum. Fact. 14, 373–391. doi: 10.1177/001872087201400502
Carlopio, J. R. (1996). Construct validity of a physical work environment satisfaction questionnaire. J. Occup. Health Psychol. 1, 330–344. doi: 10.1037/1076-8998.1.3.330
Cohen, J. (1960). A coefficient of agreement for nominal scales. Educ. Psychol. Measur. 20, 37–46. doi: 10.1177/001316446002000104
Danielsson, C. B., and Bodin, L. (2008). Office type in relation to health, well-being, and job satisfaction among employees. Environ. Behav. 40, 636–668. doi: 10.1177/0013916507307459
De Croon, E., Sluiter, J., Kuijer, P. P., and Frings-Dresen, M. (2005). The effect of office concepts on worker health and performance: a systematic review of the literature. Ergonomics 48, 119–134. doi: 10.1080/00140130512331319409
Donald, I., and Siu, O.-L. (2001). Moderating the stress impact of environmental conditions: the effect of organizational commitment in Hong Kong and China. J. Environ. Psychol. 21, 353–368. doi: 10.1006/jevp.2001.0229
EPA, (2006). 40 CFR §50.6 - National Primary And Secondary Ambient Air Quality Standards for PM 10. Ithaca, NY: Cornell Law School.
Frontczak, M., Schiavon, S., Goins, J., Arens, E., Zhang, H., and Wargocki, P. (2011). Quantitative relationships between occupant satisfaction and satisfaction aspects of indoor environmental quality and building design. Indoor Air 22, 119–131. doi: 10.1111/j.1600-0668.2011.00745.x
Gensler, (2015). The Future of Workplace. Available at: https://www.gensler.com/design-forecast-2015-the-future-of-workplace (accessed September 18, 2019).
Haapakangas, A., Helenius, R., Keskinen, E., and Hongisto, V. (2008). “Perceived acoustic environment, work performance and well-being - survey results from Finnish offices,” in Proceedings of the 9th International Congress on Noise as a Public Health Problem ICBEN, Sweden, 434–441.
Holbrook, A. L., Krosnick, J. A., and Pfent, A. (2007). “The causes and consequences of response rates in surveys by the news media and government contractor survey research firms,” in Advances in Telephone Survey Methodology, eds J. M. Lepkowski, C. Tucker, J. M. Brick, E. D. de Leeuw, L. Japec, P. J. Lavrakas, et al. (Hoboken, NJ: Wiley-Interscience), 499–528.
Hongisto, V., Haapakangas, A., Varjo, J., Helenius, R., and Koskela, H. (2016). Refurbishment of an open-plan office – Environmental and job satisfaction. J. Environ. Psychol. 45, 176–191. doi: 10.1016/j.jenvp.2015.12.004
Illuminating Engineering Society, (2011). The Lighting Handbook, 10th Edn, New York, NY: Illuminating Engineering Society.
Kaarlela-Tuomaala, A., Helenius, R., Keskinen, E., and Hongisto, V. (2009). Effects of acoustic environment on work in private office rooms and open-plan offices – longitudinal study during relocation. Ergonomics 52, 1423–1444. doi: 10.1080/00140130903154579
Kim, A., Wang, S., McCunn, L., Prozuments, A., Swanson, T., and Lokan, K. (2019). Commissioning the acoustical performance of an open office space following the latest healthy building standard: a case study. Acoustics 1, 473–492. doi: 10.3390/acoustics1030027
Kim, A. A., Wang, S., and McCunn, L. J. (2019). Building value proposition for interactive lighting systems in the workplace: combining energy and occupant perspectives. J. Build. Eng. 24:100752. doi: 10.1016/j.jobe.2019.100752
Kim, A. A., McCunn, L. J., and Lew, J. (2017). Successful facility change-management practices for retrofit projects: case study in lighting. J. Manag. Eng. 33:05017001. doi: 10.1061/(ASCE)ME.1943-5479.0000519
Kim, J., and de Dear, R. (2013). Workspace satisfaction: the privacy-communication trade-off in open-plan offices. J. Environ. Psychol. 36, 18–26. doi: 10.1016/j.jenvp.2013.06.007
Kline, R. B. (1998). Principles and Practice Of Structural Equation Modeling. New York, NY: Guilford Press.
Kruisselbrink, T., Dangol, R., and Rosemann, A. (2018). Photometric measurements of lighting quality: an overview. Build. Environ. 138, 42–52. doi: 10.1016/j.buildenv.2018.04.028
Leder, S., Newsham, G. R., Veitch, J. A., Mancini, S., and Charles, K. E. (2016). Effects of office environment on employee satisfaction: a new analysis. Build. Res. Inform. 44, 34–50. doi: 10.1080/09613218.2014.1003176
Lee, S. Y., and Brand, J. L. (2005). Effects of control over office workspace on perceptions of the work environment and work outcomes. J. Environ. Psychol. 25, 323–333. doi: 10.1016/j.jenvp.2005.08.001
Lee, Y. S. (2010). Office layout affecting privacy, interaction, and acoustic quality in LEED-certified buildings. Build. Environ. 45, 1594–1600. doi: 10.1016/j.buildenv.2010.01.007
Marans, R. W., and Spreckelmeyer, K. F. (1982). Evaluating open and conventional office design. Environ. Behav. 14, 333–351. doi: 10.1177/0013916582143005
McCunn, L. J., Kim, A., and Feracor, J. (2018). Reflections on a retrofit: organizational commitment, perceived productivity and controllability in a building lighting project in the United States. Energy Res. Soc. Sci. 38, 154–164. doi: 10.1016/j.erss.2018.02.002
Mercer, A. (1979). Office environments and clerical behaviour. Environ. Plan. B Urban Anal. City Sci. 6, 29–39. doi: 10.1068/b060029
Newsham, G., Brand, J., Donnelly, C., Veitch, J., Aries, M., and Charles, K. (2009). Linking indoor environment conditions to job satisfaction: a field study. Build. Res. Inform. 37, 129–147. doi: 10.1080/09613210802710298
Newsham, G. R., Veitch, J. A., and Charles, K. E. (2008). Risk factors for dissatisfaction with the indoor environment in open-plan offices: an analysis of COPE field study data. Indoor Air 18, 271–282. doi: 10.1111/j.1600-0668.2008.00525.x
Oldham, G. R., and Fried, Y. (1987). Employee reactions to workspace characteristics. J. Appl. Psychol. 72, 75–80. doi: 10.1037/0021-9010.72.1.75
Oldham, G. R., Kulik, C. T., and Stepina, L. P. (1991). Physical environments and employee reactions: effects of stimulus-screening skills and job complexity. Acad. Manag. J. 34, 929–938. doi: 10.2307/256397
Olson, K. (2006). Survey participation, nonresponse bias, measurement error bias, and total Bias. Public Opin. Q. 70, 737–758. doi: 10.1093/poq/nfl038
Onset, (2019). HOBO U12 Temperature/Relative Humidity/Light/External Data Logger. Bourne, MA: Onset Computer Corporation.
Particles Plus Inc, (2019). 7301-AQM and 7302-AQM Remote Air Quality and Environmental Monitor. Stoughton, MA: Particles Plus Inc.
Pejtersen, J., Allermann, L., Kristensen, T. S., and Poulsen, O. M. (2006). Indoor climate, psychosocial work environment and symptoms in open-plan offices. Indoor Air 16, 392–401. doi: 10.1111/j.1600-0668.2006.00444.x
Phonic, (2019). PAA6 Dual-Channel Precision Audio Analyzer with Built-in Condenser Measurement Mics. Taipei: Phonic.
Puget Sound Clean Air Agency, (2019). Air Quality Graphing. Seattle, WA: Puget Sound Clean Air Agency.
Qualtrics XM, (2019). Qualtrics XM - The Leading Experience Management Software. Provo, UT: Qualtrics XM.
Rosenthal, R., and Rosnow, R. L. (1991). Essentials of Behavioral Research: Methods And Data Analysis. New York, NY: McGraw-Hill.
Shin, J.-H. (2016). Toward a theory of environmental satisfaction and human comfort: a process-oriented and contextually sensitive theoretical framework. J. Environ. Psychol. 45, 11–21. doi: 10.1016/j.jenvp.2015.11.004
Sommer, R., and Sommer, B. (2001). A Practical Guide to Behavioral Research. New York, NY: Oxford University Press.
Sundstrom, E., Herbert, R. K., and Brown, D. W. (1982). Privacy and communication in an open-plan office: a case study. Environ. Behav. 14, 379–392. doi: 10.1177/0013916582143007
Tourangeau, R., Groves, R. M., and Redline, C. D. (2010). Sensitive topics and reluctant respondents: demonstrating a link between nonresponse bias and measurement error. Public Opin. Q. 74, 413–432. doi: 10.1093/poq/nfq004
Veitch, J. A., Bradley, J. S., Legault, L. M., Norcross, S. G., and Svec, J. M. (2002). Masking Speech In Open-Plan Offices With Simulation Ventilation Noise: Noise-Level And Spectral Composition Effects On Acoustic Satisfaction; Irc-Ir-846; Institute For Research In Construction. Ottawa, ON: National Research Council Canada.
Veitch, J. A., Charles, K. E., Farley, K. M. J., and Newsham, G. R. (2007). A model of satisfaction with open-plan office conditions: COPE field findings. J. Environ. Psychol. 27, 177–189. doi: 10.1016/j.jenvp.2007.04.002
Veitch, J. A., Charles, K. E., Newsham, G. R., Marquardt, C. J. G., and Geerts, J. (2003). Environmental Satisfaction in Open-Plan Environments: 5. Workstation and Physical Condition Effects; IRC-RR-154; Institute for Research in Construction. Ottawa, ON: National Research Council Canada.
Veitch, J. A., Geerts, J., Charles, K. E., Newsham, G. R., and Marquardt, C. J. G. (2005). “Satisfaction with lighting in open-plan offices: COPE field findings,” in Proceedings of Lux Europa 2005: National Research Council Canada, Ottawa, 414–417.
Wells, M. M. (2000). Office clutter or meaningful personal displays: the role of office personalization in employee and organizational well-being. J. Environ. Psychol. 20, 239–255. doi: 10.1006/jevp.1999.0166
World Green Building Council, (2014). Health, Wellbeing & Productivity in Offices: The Next Chapter for Green Building. Available at: https://www.worldgbc.org/news-media/health-wellbeing-and-productivity-offices-next-chapter-green-building (accessed September 18, 2019).
Keywords: office retrofit, employee perception, workplace design, indoor environmental quality, environmental satisfaction
Citation: Kim A, Wang S, McCunn L and Sadatsafavi H (2020) Impact of Office Modernization on Environmental Satisfaction: A Naturalistic Field Study. Front. Built Environ. 6:58. doi: 10.3389/fbuil.2020.00058
Received: 09 October 2019; Accepted: 09 April 2020;
Published: 07 May 2020.
Edited by:
Zhen Chen, University of Strathclyde, United KingdomReviewed by:
Basak Gucyeter, Eskişehir Osmangazi University, TurkeyXinyi Song, Georgia Institute of Technology, United States
Copyright © 2020 Kim, Wang, McCunn and Sadatsafavi. This is an open-access article distributed under the terms of the Creative Commons Attribution License (CC BY). The use, distribution or reproduction in other forums is permitted, provided the original author(s) and the copyright owner(s) are credited and that the original publication in this journal is cited, in accordance with accepted academic practice. No use, distribution or reproduction is permitted which does not comply with these terms.
*Correspondence: Amy Kim, YW15YWtpbUB1dy5lZHU=