 Alessia Monaco
 Giovanni Minafò
 Jennifer D’Anna
 M. Concetta Oddo2
 Lidia La Mendola
- 1Department of Architecture and Design, Politecnico di Torino, Turin, Italy
- 2Department of Engineering, University of Palermo, Palermo, Italy
In this paper, the tensile behavior of Fiber Reinforced Cementitious Matrix (FRCM) strips is investigated through Finite Element (FE) models. The most adopted numerical modeling approaches for the simulation of the fiber-matrix interface law are described. Among them, the cohesive model is then used for the generation of FE models which are able to simulate the response under traction of FRCM strips tested in laboratory whose results are available in the technical literature. Tests on basalt, PBO and carbon coated FRCM specimens are taken into account also considering different mechanical ratios of the textile reinforcement. The comparison between FE results and experimental data allows validating the adopted numerical modeling approach. Finally, some considerations are provided on the effects of the fiber fabric mechanical ratio and the strength and stiffness of the interface on the tensile capacity of the FRCM strips.
Introduction
In the last decades, the scientific interest in the rehabilitation of existing structures has increasingly involved the use of innovative materials and techniques. In particular, Fiber Reinforced Polymers (FRPs) for the strengthening of masonry structures are widely adopted mainly because of the numerous advantages offered by this technique, such as easy installation and achievement of high mechanical performance.
Recently, a new fiber reinforced composite material has been also developed, in which epoxy resin is replaced by inorganic material (cementitious mortar) aimed at binding the fibers with the substrate. The Fiber Reinforced Cementitious Matrix (FRCM) is usually used with glass, aramidic, or carbon fibers but also with synthetic polymeric reinforcement such as PBO fibers.
In the technical literature several topics are investigated in the field of the rehabilitation of masonry structures, including the evaluation of the global mechanical behavior of the strengthened structures, the analysis of local mechanisms concerning the bond behavior at the interface between reinforcing system and substrate, the adoption of adequate theoretical models for the simulation of the material properties and structural response of masonry elements.
FRCM composites seem to be particularly promising for seismic retrofitting of existing masonry structures. Thanks to their high strength-to-weight ratio, they can ensure a significant increase of the seismic capacity by contrasting the onset of collapse mechanisms, with negligible increase of mass. Limited experimental investigations have been carried out on the enhancement of the seismic capacity that can be obtained by using this innovative system (De Santis et al., 2019), even if this could be one of its most promising field of application. Recent studies have proved the effectiveness of FRCM composites to improve the ultimate strength of masonry walls under in-plane (Bertolesi et al., 2016) and out of plane (Scacco et al., 2020) loads. The tensile behavior of FRCM materials is quite complex because affected not only by fabric and mortar characteristics, but also by the strength at the interface between the two components (Dalalbashi et al., 2018; Grande and Milani, 2018), which is a critical issue because of sliding phenomena and cohesive failure in the matrix.
Recently, FRCM experimental characterization through tensile tests has been the main topic of several studies. As result, three standards for the tensile characterization of FRCMs have been defined, including the US document Icc. AC434 (2016), the recommendations provided by Rilem Technical Committee (2016) and the Italian Guidelines on the qualification of Linea Guida per la (2019).
The tensile behavior of FRCM materials is influenced by different factors, such as specimen geometry and fabrication, setup used during tensile test. In particular, the test setup plays a key role and different configurations have been proposed in the literature (D’Antino and Papanicolaou, 2018).
The behavior of such complex material like FRCM needs to be investigated using adequate monitoring techniques and, in this sense, the use of advanced systems (Digital Image Correlation) has represented a useful solution, which has been employed by some researchers (Caggegi et al., 2017; D’Anna et al., 2019).
Several variables can affect the tensile behavior of FRCM composites, such as the presence of coating treatment of the rovings, the ultimate strain of fibers, the type of stitching, the volume fraction of fibers, and different works tried to assess the effect of these parameters experimentally (D’Anna et al., 2019).
Besides experimental works, numerical studies have been performed (Bertolesi et al., 2014; Carozzi et al., 2014; Monaco et al., 2019), which constitute an important contribution in order to reach the goal of defining a reliable analytical model for the FRCM tensile response characterization. However, the results achieved so far are not enough and more investigations are needed to reach this goal.
Within this framework, the present paper is focused on the investigation of the tensile response of FRCM strips through Finite Element (FE) models. The most adopted numerical modeling approaches for the simulation of the fiber-matrix interface law are described. Among them, the cohesive model is then used for the generation of FE models which are able to simulate the response under traction of FRCM strips tested in laboratory, which results are available in the technical literature.
In the field of the state of the art briefly described above, the main contribution of the research consists in the increase of the existing numerical data currently available, aiming at the definition of an analytical constitutive model of the composite material in tension. The current database, actually, is extremely limited from both experimental and numerical standpoint to make reliable models of the constitutive response of the system. Tests on basalt, PBO and carbon coated FRCM specimens are taken into account also considering different mechanical ratios of the textile reinforcement. The comparison between FE results and experimental data allows validating the adopted numerical modeling approach. Finally, some considerations are provided on the effects of the fiber fabric mechanical ratio and the strength and stiffness of the interface on the tensile capacity of the FRCM strip. Such design considerations can be regarded as a key novelty of this research, conducted through a parametric investigation aimed at individuating the main parameters that rule the damage mechanism of the interface. Actually, the finding of the research consists in the detection of a non-linear relationship between the axial stiffness of the FRCM strip and the variation of the mechanical fabric ratio. Furthermore, a non-linear response has been individuated in the variation of the ultimate tensile capacity of the composite material with the percentage of reinforcement.
In the following sections, firstly, the interface modeling techniques adopted in this research are briefly described; then the simplified micro-modeling approach is presented and the validation against experimental data available in the literature is reported. Finally, the parametric analyses are described and the design considerations are provided.
Interface Modeling Techniques
This section briefly describes the interface modeling techniques adopted in this research. In particular, the perfect bond model is firstly described and the limits in its use for the current application are highlighted. Subsequently, the cohesive bond model is shown and its ability in reproducing the damage process of fiber-matrix interface is remarked.
Perfect Bond
The first simplified approach for simulating adherence between fibers and mortar matrix is perfect bond. Such a modeling consists in the adoption of the embedded technique, used to specify that an element or group of elements is embedded in “host” elements. For example, this technique is typically used to model rebar reinforcement.
The model is based on the research of the geometric relationships between nodes of the embedded elements and the host elements. This means that, when a node of an embedded element lies within a host element, its degrees of freedom are constrained to the values of the corresponding degrees of freedom of the host element, usually through interpolation. The interaction between the nodes to be constrained can be ruled by a specific geometric tolerance that allows defining the maximum distance between nodes of embedded and host region of the model. Usually such a tolerance can be set at 5% of the average size of all non-embedded elements in the model.
With reference to Figure 1, the shaded region represents the tolerance zone: if an embedded node is located inside this zone, the node is constrained to the host elements and its position will be adjusted in order to move the node onto the corresponding node of the host element. Considering the application to the current case-study, if the fibers are modeled as shell elements with equivalent mechanical properties, then the nodes of the shell elements will be constrained to the nodes of the mesh used for the matrix and their degrees of freedom will be matched.
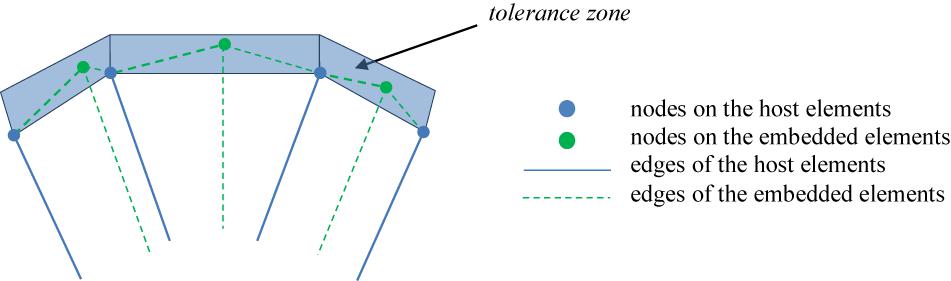
Figure 1. Perfect bond model.
Cohesive Traction-Separation Law
The insertion of a cohesive contact property can be used for defining those interactions in which the contact stresses, t, depend on a given value of elastic stiffness, K. In particular, this approach is primarily intended for situation in which the interface thickness is small enough to be considered negligible. In general, this interfacial behavior can be defined taking into account three typical phases of the actual interface cohesive behavior between surfaces in contact: (1) the first linear elastic phase expressed in terms of tractions vs. separations linear relationship prior to the interface damage; (2) the second stage which corresponds to the damage occurrence; (3) the last phase denoted by the non-linear response of the damaged interface. The typical cohesive behavior is represented in Figure 2. In particular, the first elastic stage is defined in terms of an elastic constitutive matrix that relates the normal and shear stresses to the normal and shear separations across the interface and it can then be written as:
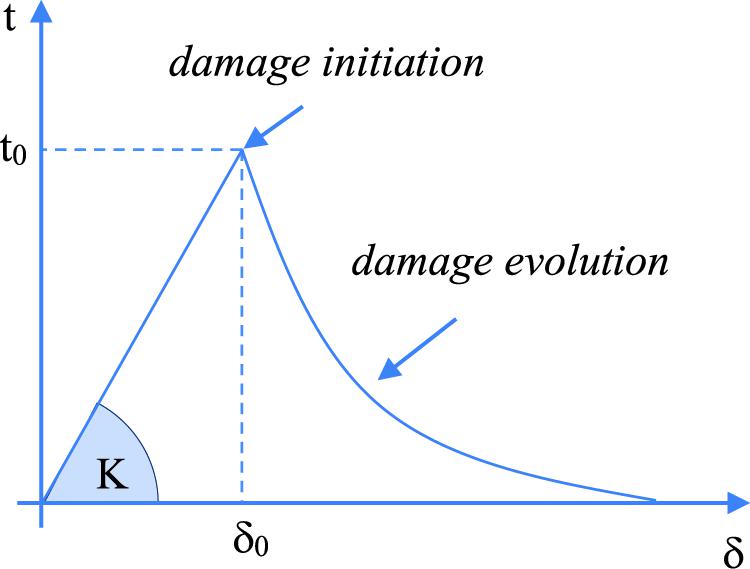
Figure 2. Cohesive model.
In Eq. 1 K represents the elastic stiffness matrix, t is the nominal traction stress vector, tn, ts, and tt are the normal and the two tangential local directions, respectively, and δn, δs, and δt the corresponding separations. Therefore, it can be observed that, in general, the definition of coupled or uncoupled behavior is allowed. A limit to the elastic behavior can be established defining a damage initiation criterion which can be founded on the achievement of limit stress values at a contact point according to the following expression:
In Eq. 2 and represent the peak values of the contact stress when the separation is purely in the normal direction or first and second shear direction, respectively. Once the initiation criterion is reached, a damage evolution law can be adopted for describing the rate at which the cohesive stiffness is degraded. The evolution law could be linear or non-linear, according to the most accredited theoretical model available in the literature.
Simplified Micro-Modeling Approach
General Features
A typical specimen of FRCM strip for the tensile test is represented in Figure 3. In particular, the figure reports a schematization of the specimens tested by some of the authors at the Heavy Lab of Queen’s University of Belfast (D’Anna et al., 2019) using different layers of basalt fibers as textile reinforcement. The reinforcement used for the strips is typically made in form of bidirectional grid. In the literature, two different approaches can be used for modeling the textile grid in the FE simulations: the first approach is the detailed modeling of the geometry of the grid, assuming perfect bond in the contact points at the intersections between orthogonal yarns; the second approach consists in a simplified modeling of the complex geometry of the grid, the latter being assumed as an equivalent shell element. There are several examples in the literature of detailed modeling (among others Mazzucco et al., 2018). Conversely, in the model herein presented, the second approach is adopted.
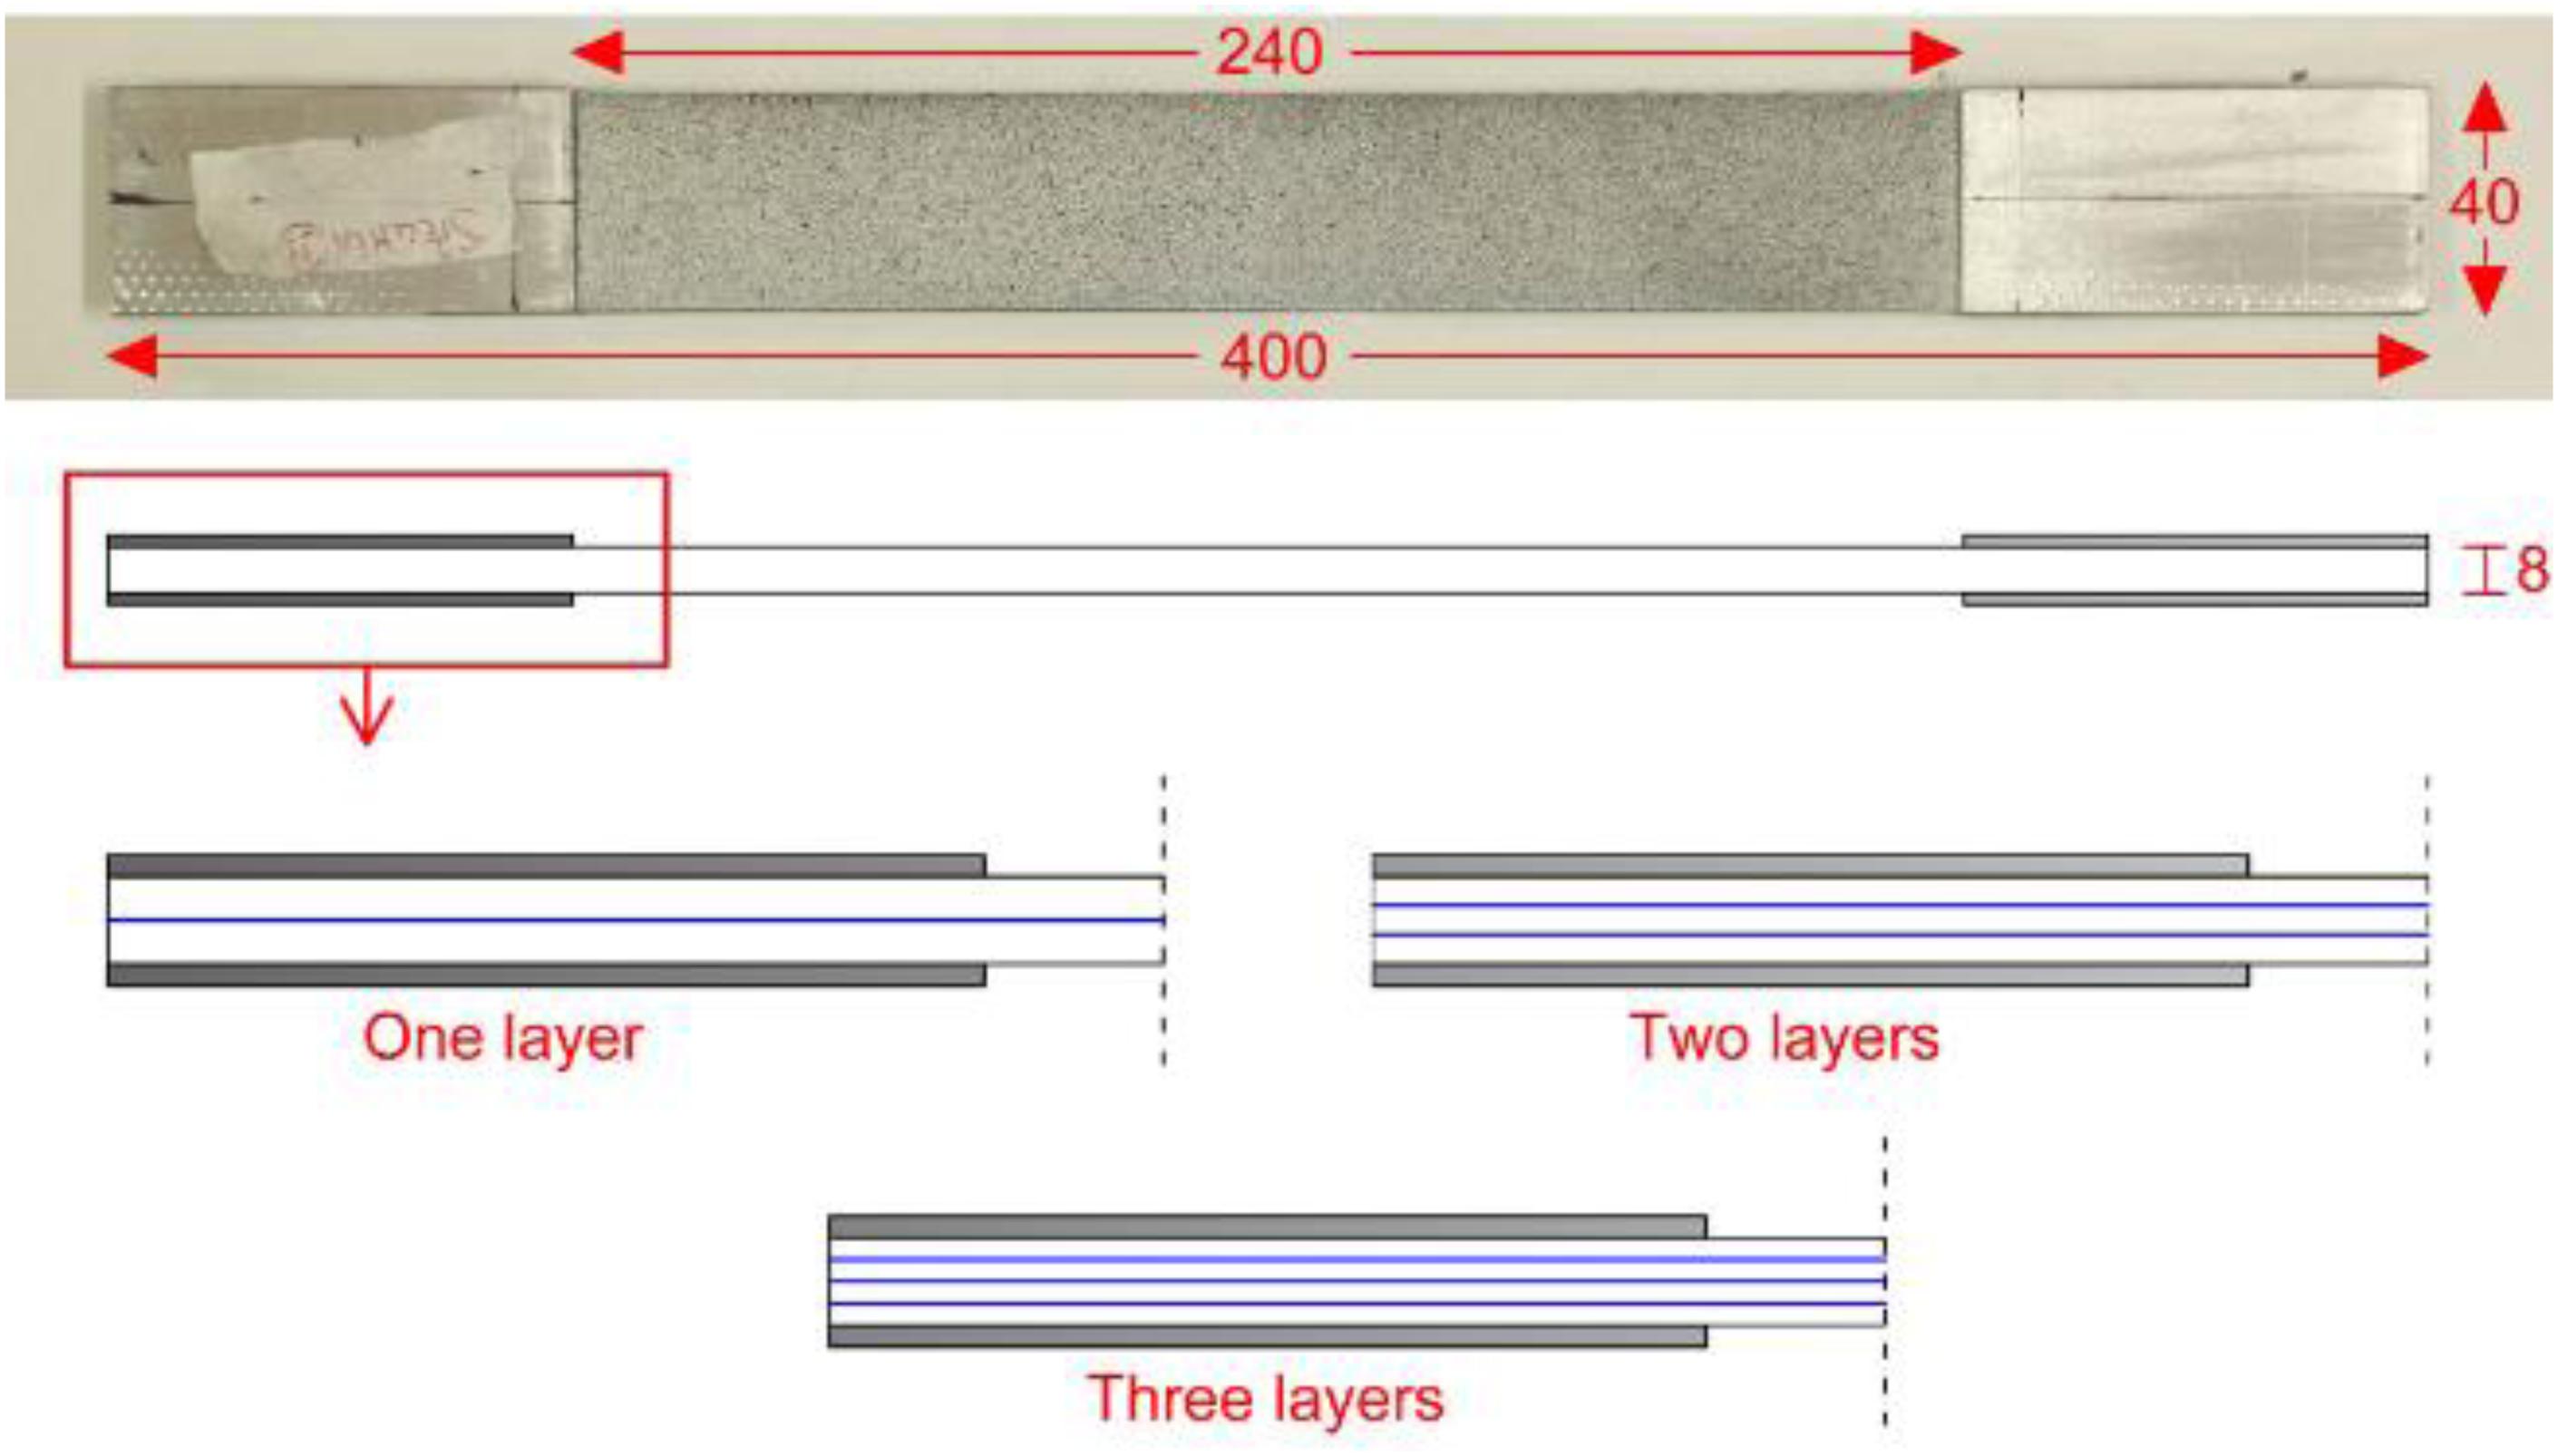
Figure 3. Geometrical features of the specimens tested by D’Anna et al. (2019).
In particular, the simulations are performed using Abaqus Theory Manual (2019). As reported in Figure 4, two different models are generated, adopting in both cases an equivalent lamina for the simulation of the textile fibers. The two models differ for the contact behavior implemented at the interface between fibers and mortar matrix: in the first model, named model T1, perfect bond is assumed at the interface (Figure 4A); in the second model, model T2, a cohesive interaction is established between surfaces in contact (Figure 4B).
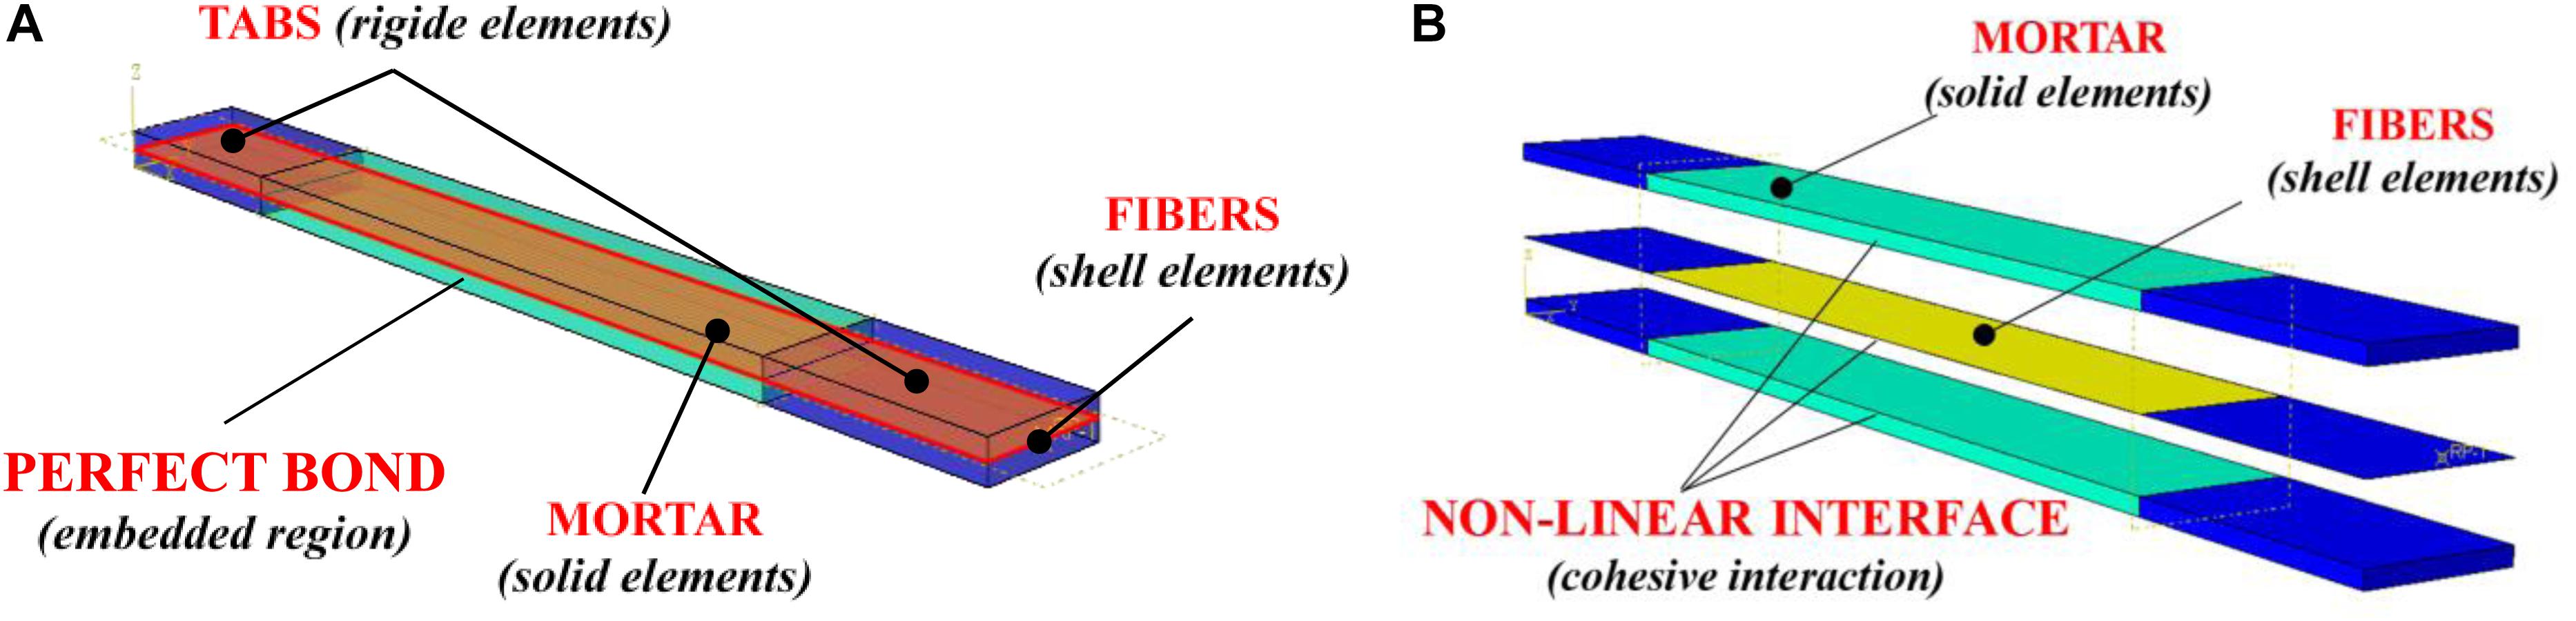
Figure 4. Model types: (A) model T1; (B) model T2.
The numerical model presents the following boundary conditions: at the bottom and top ends of the specimen, rigid tabs prevent the slip between mortar and fabric; the displacement of the elements included in this region of the model are ruled by a rigid body constraint, bonded to the motion of a reference point. In particular, the nodes belonging to the rigid body constraint are tie nodes with both translational and rotational degrees of freedom associated to the motion of the reference point. The specimens presents restrained nodes on the top while an imposed displacement is applied on the bottom to the reference point.
The finite elements adopted for the mesh, for both model T1 and T2 were first order hexahedral elements for the mortar (C3D8R) while the textile reinforcement is modeled using linear quadrilateral shell elements (S4R) (Figure 5A). A total of 16,000 solid elements are used to model the mortar while 8,000 shell elements are employed for the fabric. The mesh size is 4 mm for both element types. The choice of the mesh size is done performing mesh sensitivity analyses. Figure 5B reports the results of the mesh sensitivity analyses performed on the specimens tested by D’Anna et al. (2019) using three different mesh sizes: 1, 2, and 4 mm. It can be observed that the result is not affected by the mesh size, all analyses provide almost the same load-displacement curve in all stages. Conversely, the computational time required to run the models is significantly different. Table 1 reports the computational time required by each analysis: it can be observed that the Model A (mesh size 1 mm) requires a computational time over 30 times higher than Model B (2 mm mesh size) and almost 300 times higher than Model C (4 mm mesh size); furthermore, Model B requires a computational time over 10 times higher than Model C and, therefore, the mesh size chosen to perform the analyses in this study is 4 mm.
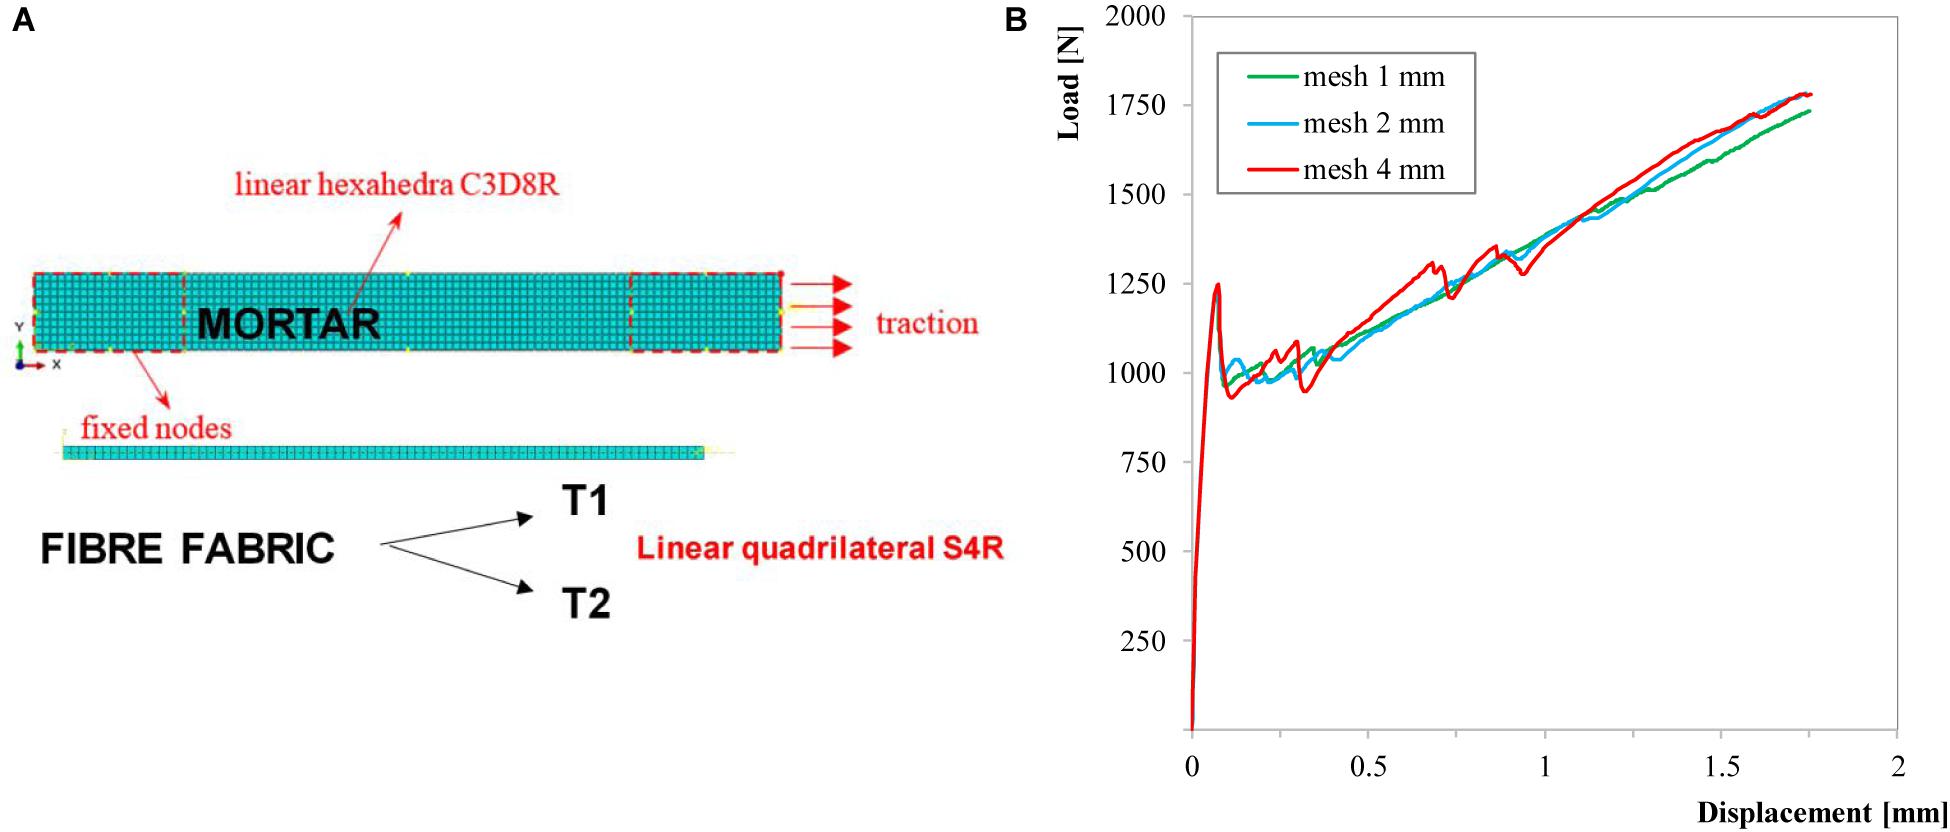
Figure 5. Mesh: (A) mesh of the elements; (B) mesh sensitivity analyses.
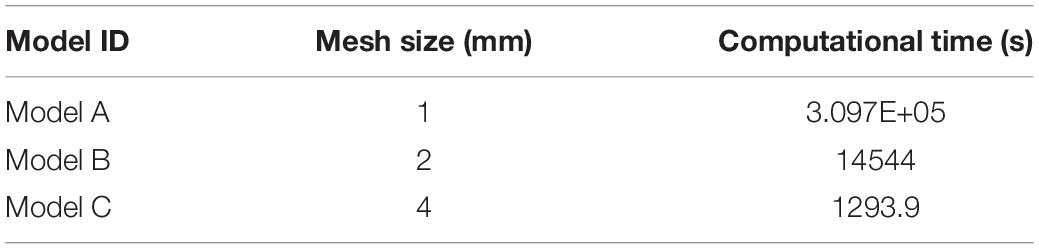
Table 1. Computational performance of different mesh sizes.
Mechanical Properties
As already mentioned, the fibers are modeled as an equivalent lamina whose mechanical behavior is defined through an orthotropic linear behavior in which two directions are considered, i.e., the longitudinal direction of the fiber filaments and the transversal one. The mechanical properties needed for defining the constitutive models are deduced from tensile tests on fiber grid strips. In particular, the necessary parameters are – the elastic modulus E1 in the warp direction of the fabric – the elastic modulus in the transversal direction E2, herein assumed equal to 0.4% of E1 – the Poisson’s ratio ν, assumed equal to 0.35 in both directions. Therefore, with reference to the Figure 6, in which the local coordinate system is reported, the shear moduli are obtained using the following expressions:
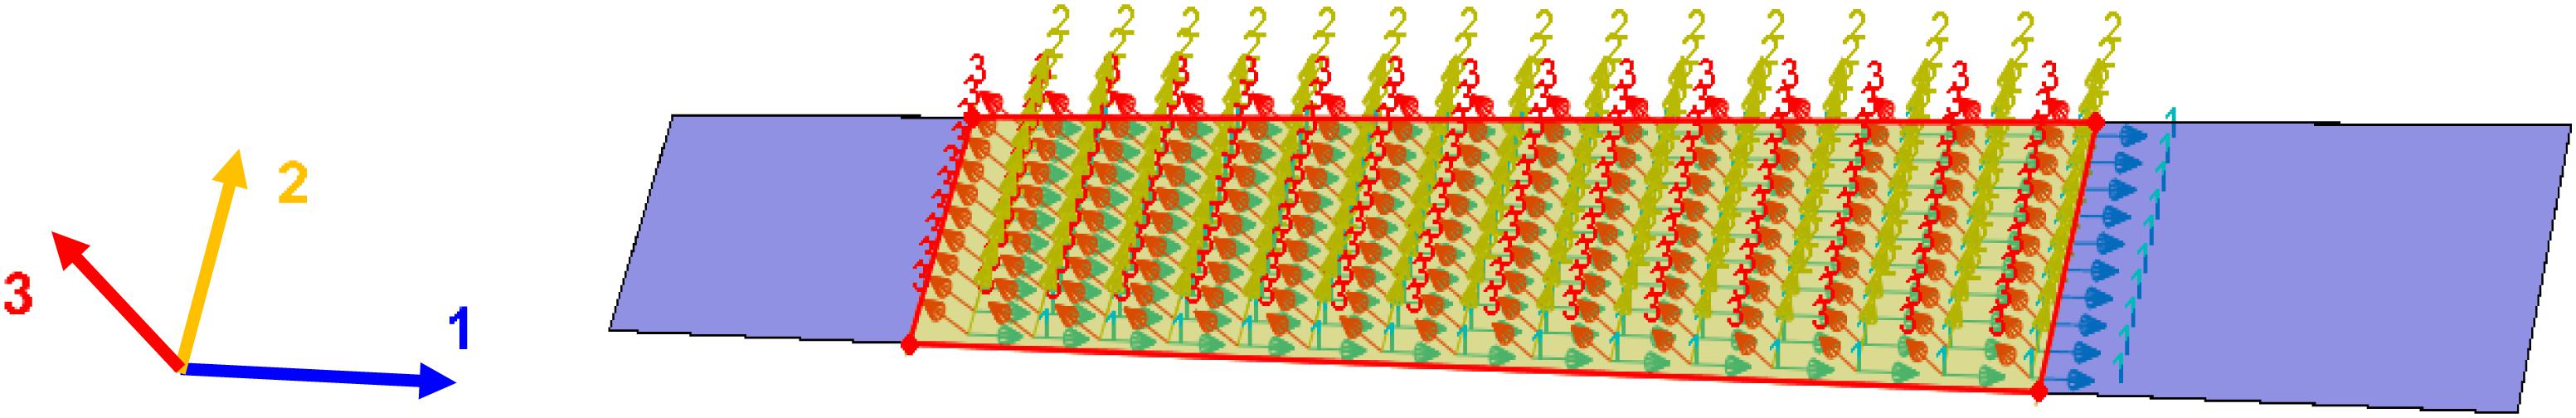
Figure 6. Orthotropic lamina behavior for the textile fibers.
As regards the mortar matrix, a classical plasticity model for quasi-brittle material is used, taking into account the post-elastic damage. In compression, the constitutive law by Sargin (1971), Figure 7A, is adopted hile the tensile behavior is deduced from the average of stress-strain experimental curves (Figure 7B). The damaged response is simulated according to several studies in the literature. In particular, Mazzucco et al. (2018) suggest the following expressions for defining the compressive and tensile damage variable, named dc and dt, respectively.
Figure 7. Constitutive model of mortar: (A) in compression; (B) in tension.
In Eqs 4a and 4b the coefficients Ac, Bc, λc, At, Bt, λt, are calibrated through laboratory tests and the values adopted are those suggested by Mazzucco et al. (2018) and reported in Table 2.
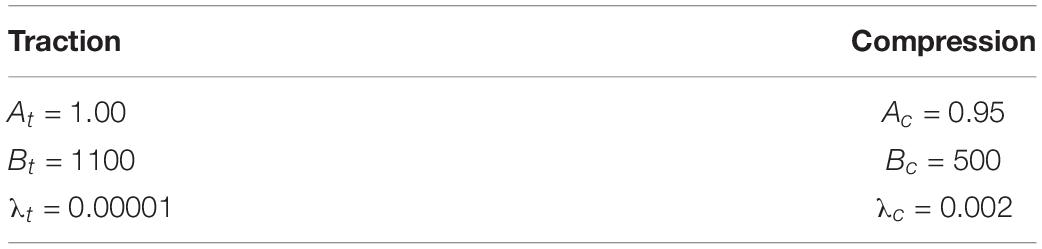
Table 2. Damage parameters of mortar.
Finally, the mechanical behavior of the interface is modeled adopting the cohesive approach. As usually done also for different applications, such as for reinforced concrete structures, an uncoupled traction-separation elastic response is implemented (Monaco, 2016; Carozzi et al., 2016; Malena et al., 2019; Monaco et al., 2019). Using the uncoupled approach, the extra-diagonal terms of the matrix K in Eq. 1 are equal to zero, meaning that only tangential cohesive constraints are enforced; the normal separations are not constrained and the cohesive constraint is restricted to act along the tangential direction only. In order to describe the post-elastic damaged behavior of the interface represented in Figure 2, a damage variable D is introduced, assuming the rate of the damage suggested in the literature (Mazzucco et al., 2018) and the relationship between shear stress and inelastic slip reported qualitatively in Figure 8. The first linear branch is ruled by the stiffness K. The second linear branch is derived assuming the value of the total fracture energy G1 + G2 and the maximum shear stress reached at the interface level τmax. The model parameters of the interface used in the analyses are: K equal to 2 N/mm3; G1 + G2 equal to 0.345 N/mm; τmax equal to 0.78 MPa. The trend of the damage variable is defined as D = 1−τ/τel, in which τ is the actual value of the shear stress in the descending branch and τel the corresponding shear stress considering an elastic behavior. It could be worth to note that, generally, a combination of normal and shear separations across the interface arises, i.e., the effective separation δm is generally due to both normal and shear components as. This means that the normal separations δn are generally non-null even in those cases in which the elastic stiffness Knn is zero. However, for simplicity, in the present model, the normal separations δn are assumed small with respect to the shear components and, thus, they are neglected for the calculation of δm and D.
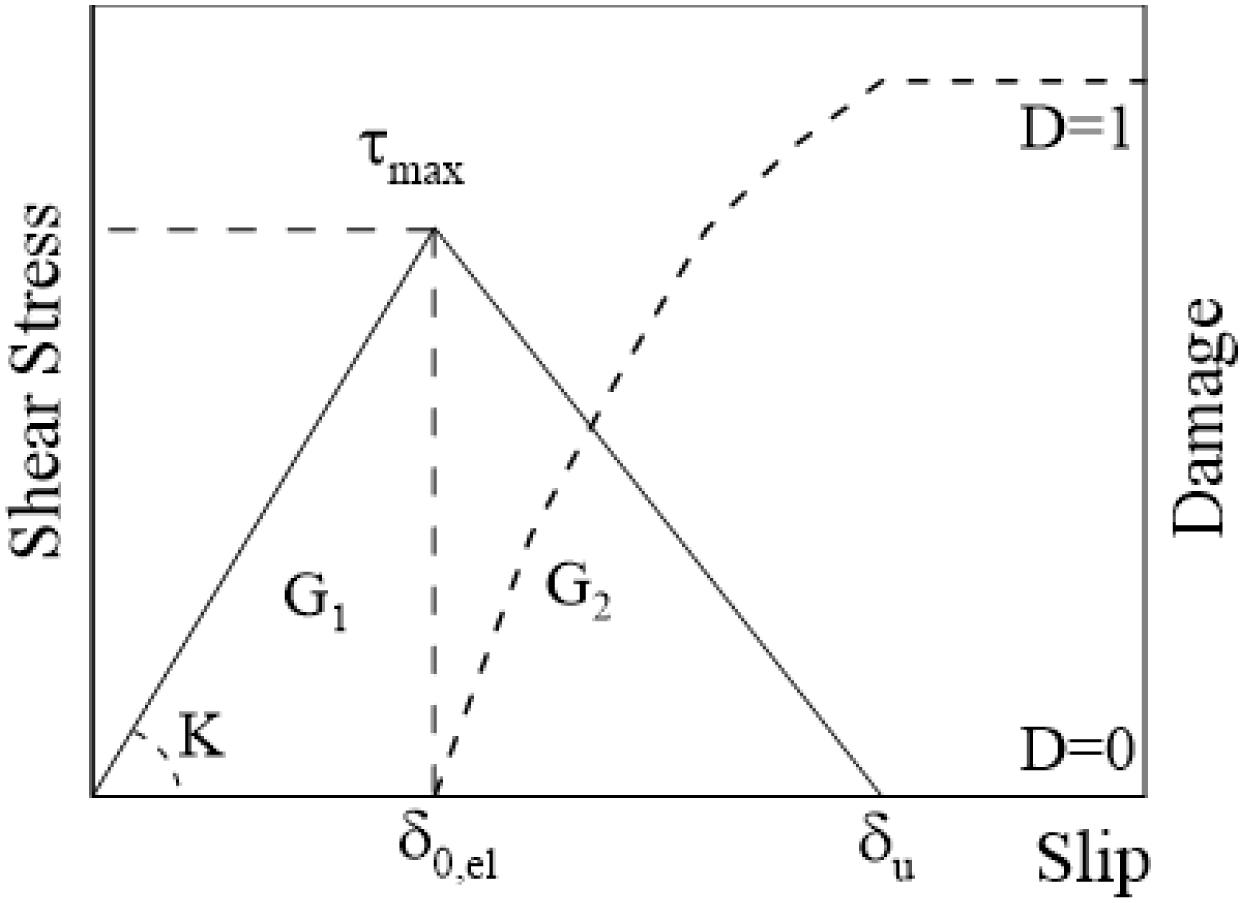
Figure 8. Damage evolution at the interface.
Reference Experimental Tests
The results of some experimental tests available in the literature are used for the validation of the model. In particular, the experiments performed by Arboleda et al. (2016); D’Antino and Papanicolaou (2018), and D’Anna et al. (2019) are taken into account. Table 3 summarizes the main features of the tested specimens, which differ for type of mortar matrix, fibers and reinforcing ratios.
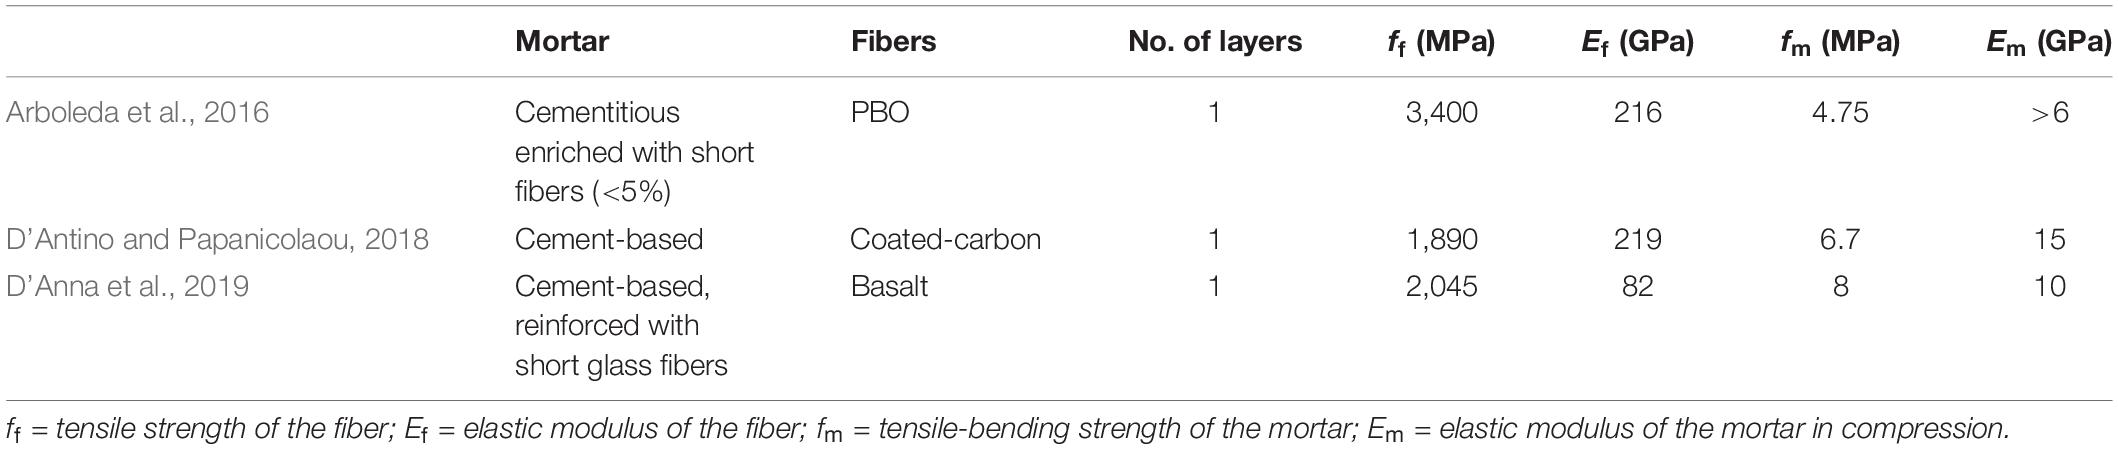
Table 3. Experimental tests used for the model validation.
These experimental studies were selected among the numerous others found in the literature on the basis of the completeness of base data available for performing a detailed numerical model. Additionally, selected studies allowed to investigate on the effect of different kinds of fiber fabric.
Arboleda et al. (2016) tested rectangular coupons of various FRCM systems adopting different gripping methods to transfer the load: clevis and clamping grip. In this paper, only experiments conducted with the clamping grip method are taken into account because they allow a complete mechanical behavior characterization of the composite with a tensile failure of each constituent material. Moreover, the same authors tested specimens with one layer of PBO, carbon and glass fibers but, in this paper, only the tests on PBO strengthened strips are validated because, differently from carbon and glass FRCM specimens, they exhibited a marked tri-linear behavior. The tested coupons had nominal dimensions equal to 410 mm × 50 mm × 10 mm; they were manufactured using a manual impregnation technique by first applying a 5 mm layer of cementitious matrix, followed by one layer of the fabric pressed into the mortar. The top layer of mortar matrix was then applied as flat as possible with finishing trowel.
D’Antino and Papanicolaou (2018) tested four different FRCM composites using two tensile test set-ups, namely the clamping-grip method applied to rectangular prism specimens and the curved-flange method applied to dumbbell specimens. In their work, the authors tested two standard modulus carbon fiber bidirectional textiles having the same dry area weight (170 g/m2) and the same spacing between bundles (20 mm), one with fiber coating and the other one without coating (i.e., with/without full impregnation of fiber bundles). The carbon specimens were embedded within the same cement-based matrix. Then, using the same matrix, they also manufactured specimens with unidirectional galvanized steel cord textile. Finally, specimens with lime-based matrix and coated AR-glass fibers were manufactured and tested. In this paper, only rectangular coated carbon specimens are considered for the FE model validation. The specimens had a length of 500 mm and a thickness of 10 mm, with 80 mm of grip length per-side.
Finally, D’Anna et al. (2019) performed tensile tests on FRCM strips reinforced with basalt fibers embedded into cement-based matrix reinforced with glass fibers. The mechanical properties of the matrix provided by the manufacturer were: flexural strength of 8 MPa, compressive strength equal to 25 MPa, Young’s modulus of 10 GPa. Regarding the basalt textile, the latter was a primed bidirectional grid, with nominal cell size of 6 mm × 6mm. The mesh was characterized mechanically through a series of tensile tests on twelve 260 mm × 13.5 mm textile strips, obtaining average values equal to 2045 MPa, 2.6% and 82 GPa for the strength, the strain and the modulus of elasticity respectively. All the FRCM specimens were 400 mm long × 40 mm wide × 8 mm thick and they were reinforced with one, two and three layers of basalt fiber textile. In general, the specimens reinforced with one or two layers exhibited a tri-linear behavior while the results from the three-layer specimen showed a bi-linear trend of the tensile response. In this paper, only the results of the single-layer specimens are taken into account for the validation, for homogeneity with the features of the other experimental tests considered.
Model Validation and Discussion
The experimental results briefly reported in the previous section are used for the validation of the proposed numerical model. Figure 9 shows the load-displacement experimental curves from D’Anna et al. (2019) compared with the numerical results obtained by using the embedded and cohesive model. It is clear that the embedded model is not able to capture the second stage of the characteristic trilinear behavior of FRCM specimens. For this reason, the cohesive model was preferred in order to reproduce the FRCM tensile response.
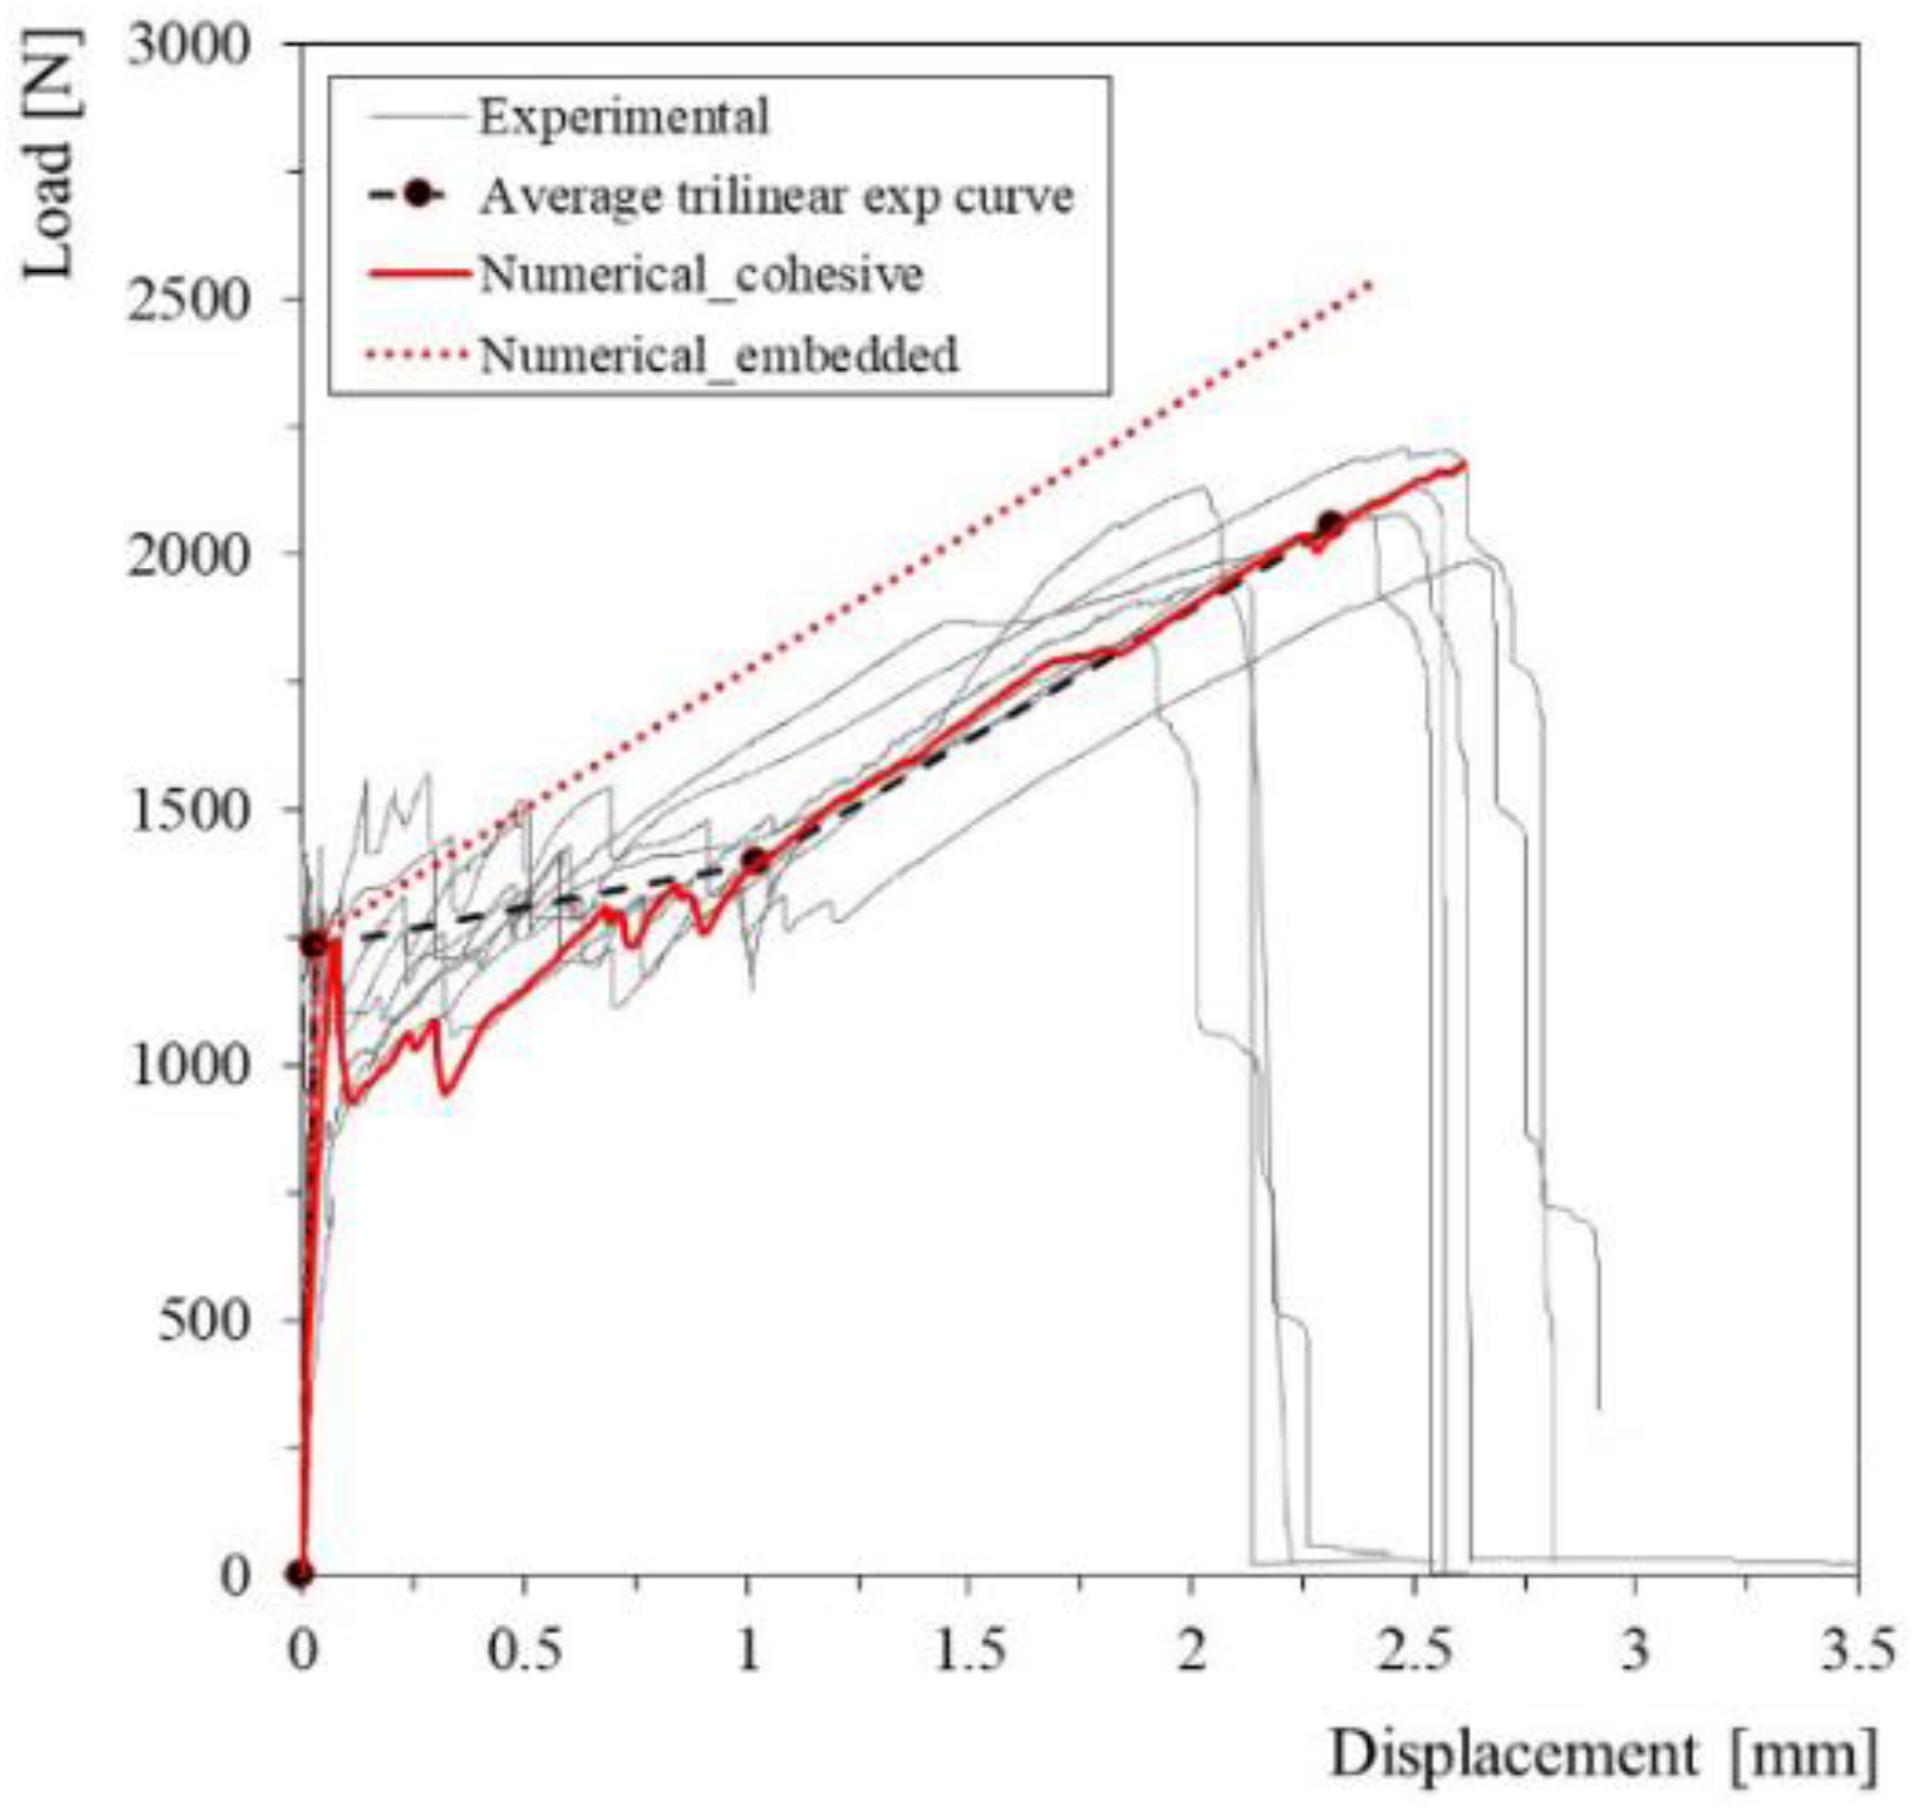
Figure 9. Comparison between experimental results (D’Anna et al., 2019), embedded model and cohesive model.
Figure 10 shows the average load-displacement experimental curves from different authors compared with the numerical results. In the graphs, also the response of the bare fiber is reported with a dashed line. It can be observed that the cohesive approach is appropriate in reproducing the tensile response of the strips for the examined cases. The model provides quite good prediction of the first cracking load and the second and third stage are generally within the average experimental values. Conversely, as regards the slope of the third stage of the tensile response, it is noted that it is not always in accordance with the axial stiffness of the bare fiber fabric. More details can be provided on the crack pattern numerically obtained. In particular, in Figure 11 the comparison between experimental and numerical cracks is depicted with reference to the 1-layer specimen tested by D’Anna et al. (2019). The numerical model is based on the theory of continuum damage and, therefore, it is possible to observe the numerical pattern of cracks showing the maximum principal strains obtained during the analysis. The comparison with the experimental evidence at the end of the test is quite satisfactory. Based on the data available in the reference study, the comparison is available only for the specimen reported in D’Anna et al. (2019).
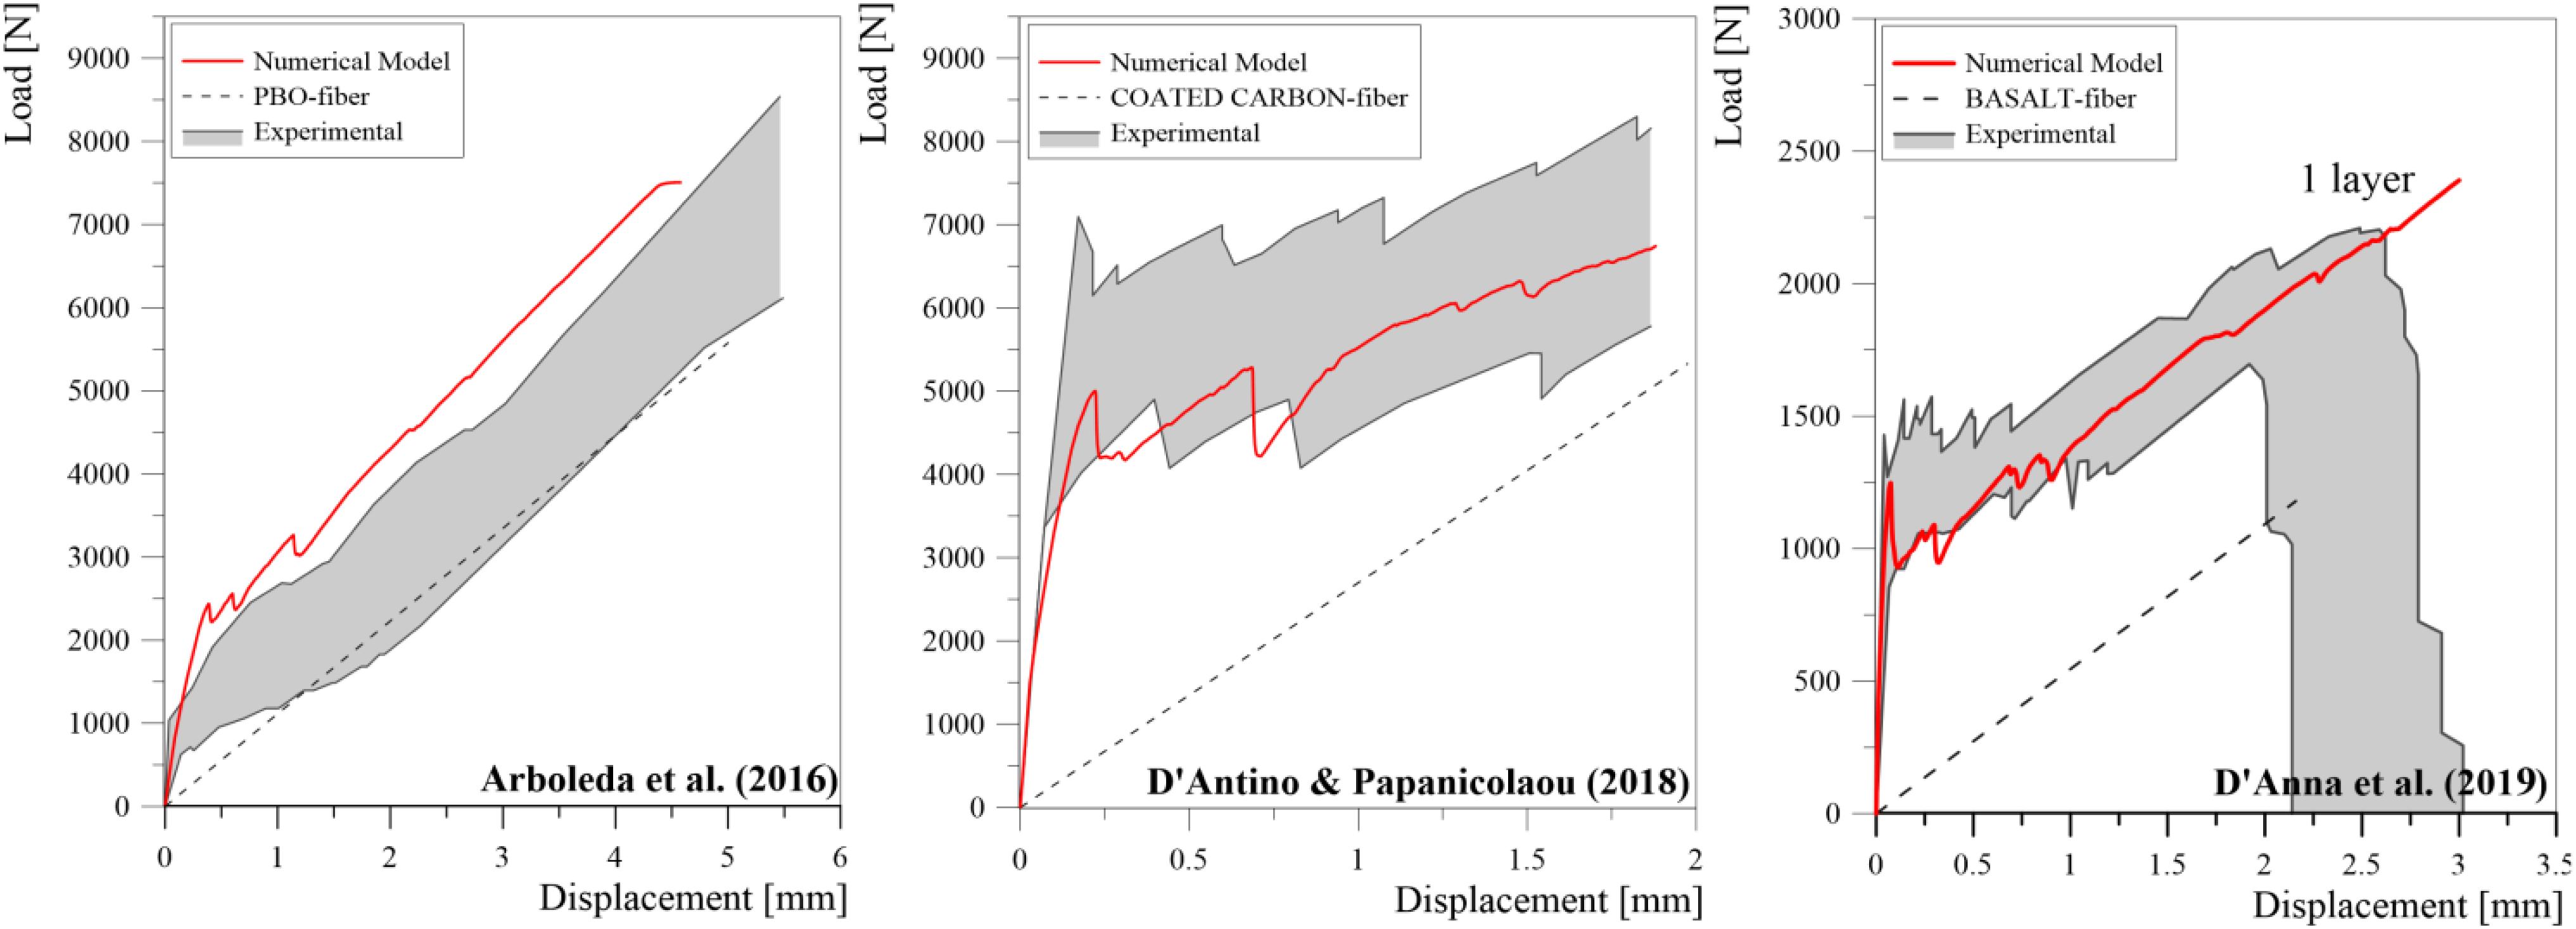
Figure 10. Model validation.
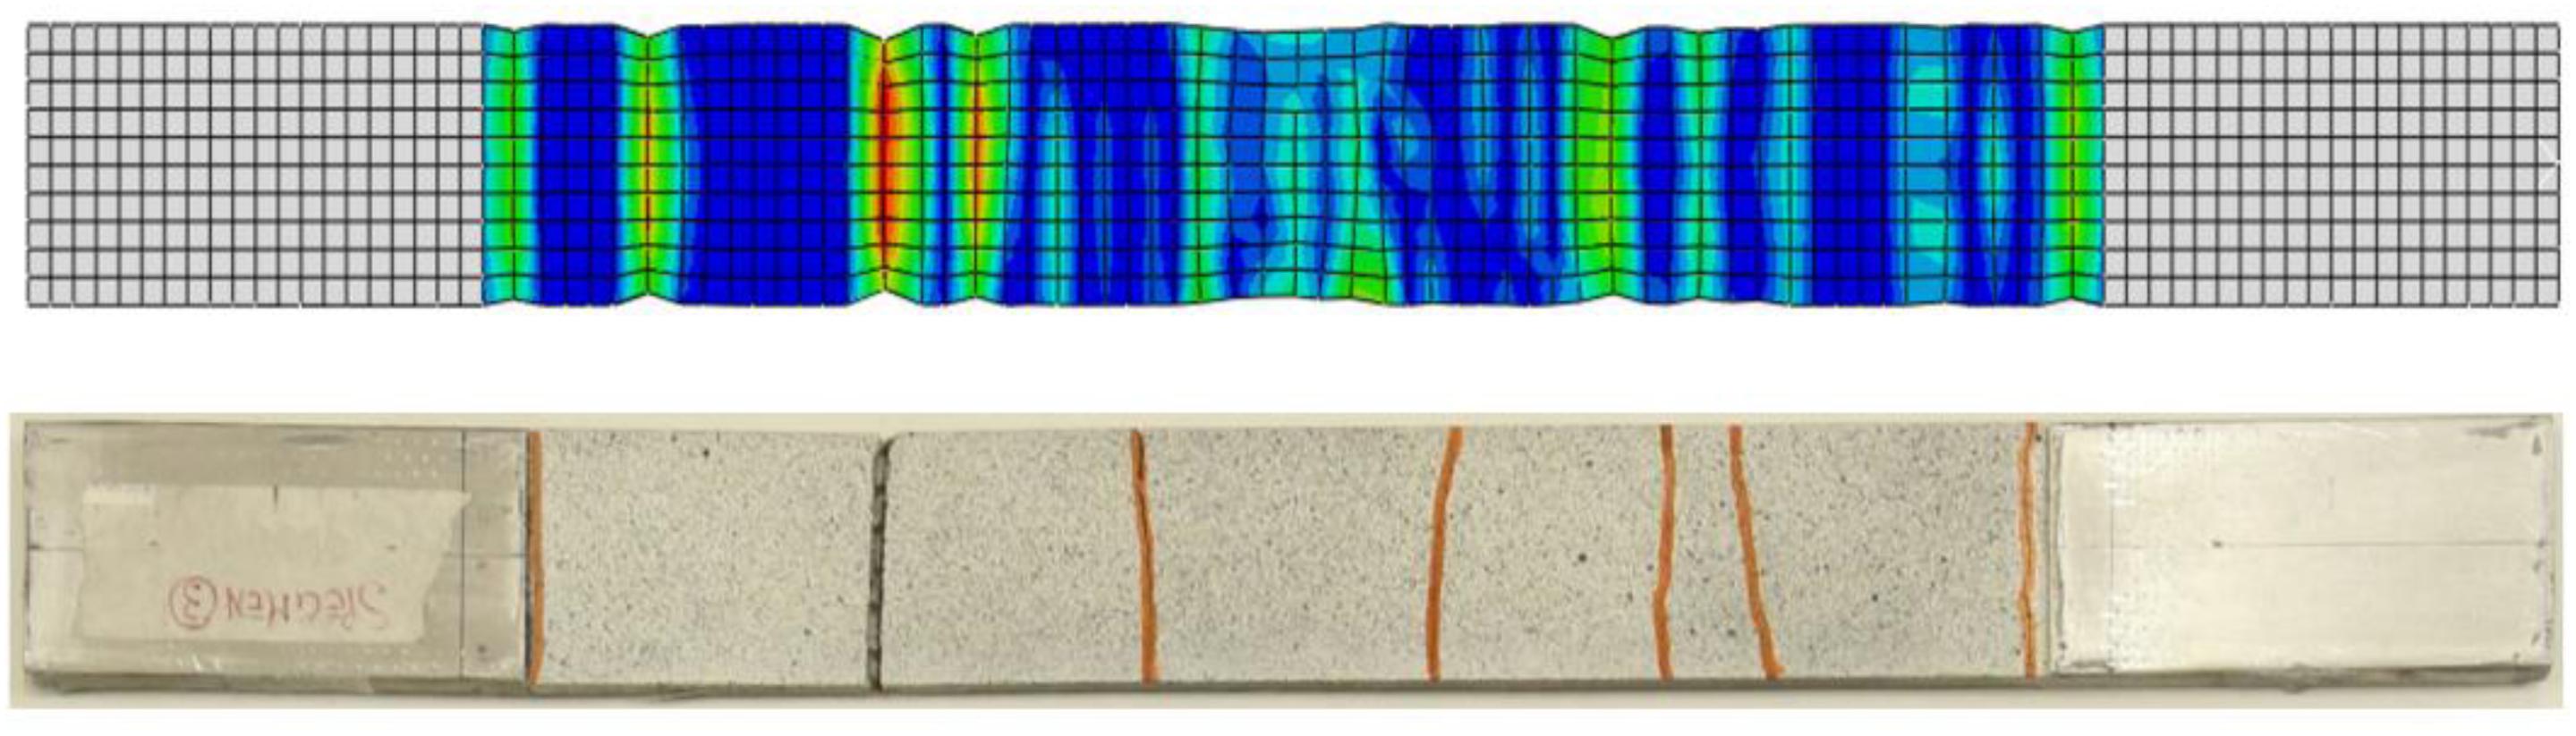
Figure 11. Comparison between numerical and experimental crack pattern (Monaco et al., 2019).
With the aim of further investigating the phenomena occurring during the third stage of the behavior, the model allows developing some parametric analyses for evaluating the variation of the axial stiffness in the third stage with the variation of the fiber fabric ratio. Therefore, the parameter ω is defined as:
In Eq. 5 Af is the total area of fiber fabric in the longitudinal direction of the strip, ff is the tensile strength of the fiber, fmc is the compressive strength of the mortar, b and t are the width and depth of the strip, respectively.
Figure 12A shows the outcome of the parametric analyses. In particular, the graph depicts the values of the stiffness in the third phase (EIII A, in which A is the cross-section of the FRCM) normalized with respect to the axial stiffness of the bare fabric, with the variation of the mechanical ratio of fiber textile. It can be observed that the FE results are fitted by a non-linear ascending curve, which tends asymptotically to the values of 1 for highly increasing values of ω. As expected, the mortar deformability can affect the slope of the third branch of the tensile response of the FRCM composite, especially for low reinforcing fabric ratios.
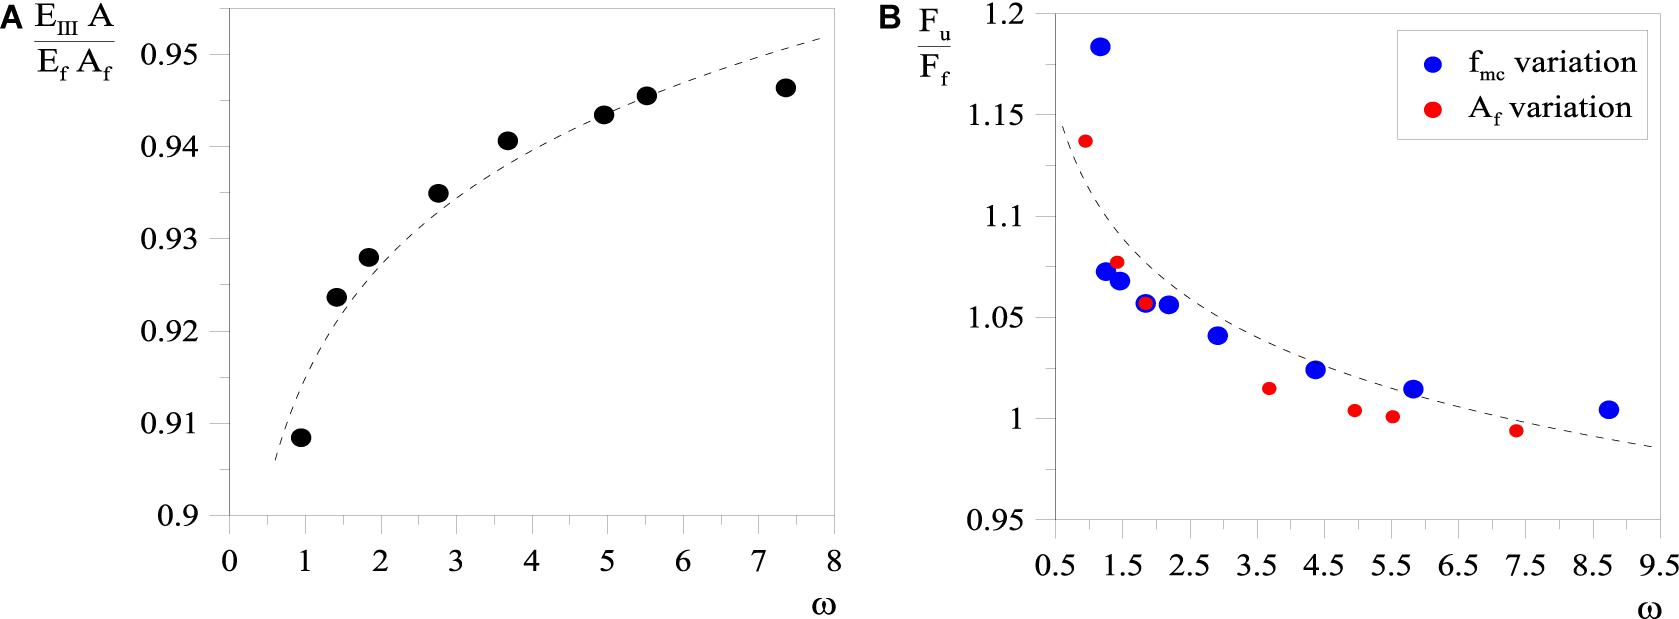
Figure 12. Parametric study: (A) axial stiffness in the III stage; (B) ultimate tensile capacity.
Further observations can be made analyzing the variation of the tensile capacity of the FRCM composite system with the variation of ω. In this regard, Figure 12B reports the ultimate tensile capacity Fu normalized with the ultimate capacity of the bare fiber Ff. It can be observed that the numerical results are fitted by a non-linear descending curve, which shows that the contribution of the mortar matrix becomes evident only for low ratios of fiber fabric. For great values of ω, the effect of the mortar on the axial capacity can be considered negligible. Similar considerations are effective considering the variation of both mortar strength, fmc, and fiber reinforcement transversal area, Af.
Conclusion
In this paper, the tensile behavior of FRCM strips was investigated through FE simulations. Different approaches for the modeling of the interface were presented and, among them, the cohesive modeling technique was adopted for generating finite element models of FRCM coupons tested under pure traction. The model was validated against experimental data available in the literature, in which different mortar matrices and reinforcing fibers were used.
The cohesive approach showed to be appropriate in reproducing the tensile response of the strips for the examined cases. The model provided quite good prediction of the first cracking load and the second and third stage were generally within the average experimental values.
A parametric study was useful for developing some considerations on the tensile behavior of the FRCM strips. In particular, the influence of the mechanical ratio of fiber fabric was investigated showing that, for increasing values of the ratio, the contribution of the mortar to the tensile load capacity and the axial stiffness of the FRCM strip tends to be negligible. The relationship between axial stiffness and tensile capacity with the variation of the mechanical ratio of fiber fabric was always non-linear and followed an ascending and descending trend in the respective cases.
Further studies are currently under investigation by the authors, mainly addressed to the influence of the stiffness and strength of the interface on the behavior of the composite system and the development of detailed geometrical and mechanical modeling of the fiber grid.
Data Availability Statement
The datasets generated for this study are available on request to the corresponding author.
Author Contributions
AM performed the design of the finite element model and the computational framework, analyzed the numerical data and wrote the manuscript. JD’A contributed in the design of the model and analysis of the data and performed some of the experiments used for the model validation. MO performed the numerical simulations and drafted some of the figures. GM performed the design and implementation of the research and contributed to the analysis of the data. LL supervised the project and the findings of this work. All authors discussed the results and contributed to the final manuscript.
Funding
This research was supported by a grant from the Italian Ministry for University and Research (MIUR) for PRIN-2017 project “Innovative systems based on inorganic mortar and non-metallic reinforcement for the upgrade of masonry structures and non-structural elements.” The financial support is gratefully acknowledged. Activities for the research were developed among the Project ReLUIS “Progetto Esecutivo Accordo DPC/ReLUIS 2019-2021, WP14 – Contributi normativi per Materiali Innovativi per Interventi su Costruzioni Esistenti.”
Conflict of Interest
The authors declare that the research was conducted in the absence of any commercial or financial relationships that could be construed as a potential conflict of interest.
References
ICC (2016). AC434 Masonry and Concrete Strengthening Using Fabric-reinforced Cementitious Matrix (FRCM) and Steel Reinforced Grout (SRG) Composite Systems, ICC Evaluation Service. Whittier: ICC.
Arboleda, D., Carozzi, F. G., Nanni, A., and Poggi, C. (2016). Testing procedures for the uniaxial tensile characterization of fabric-reinforced cementitious matrix composites. J. Compos. Constr. 20:04015063.
Bertolesi, E., Carozzi, G., Milani, G., and Poggi, C. (2014). Numerical modelling of Fabric Reinforced Cementitious Matrix composites (FRCM) in tension. Constr. Build. Mater. 70C, 531–548. doi: 10.1016/j.conbuildmat.2014.08.006
Bertolesi, E., Milani, G., and Poggi, C. (2016). Simple holonomic homogenization model for the non-linear static analysis of in-plane loaded masonry walls strengthened with FRCM composites. Composite Struct. 158, 291–307. doi: 10.1016/j.compstruct.2016.09.027
Caggegi, C., Lanoye, E., Djama, K., Bassil, A., and Gabor, A. (2017). Tensile behavior of a basalt TRM strengthening system: influence of mortar and reinforcing textile ratios. Composites Part B Eng. 130, 90–102.
Carozzi, F. G., Colombi, P., Fava, G., and Poggi, C. (2016). A cohesive interface crack model for the matrix–textile debonding in FRCM composites. Composite Struct. 143, 230–241.
Carozzi, G., Milani, G., and Poggi, C. (2014). Mechanical properties and numerical modeling of fabric reinforced cementitious matrix (FRCM) systems for strengthening of masonry structures. Composite Struct. 107, 711–725. doi: 10.1016/j.compstruct.2013.08.026
Dalalbashi, A., Ghiassi, B., Oliveira, D. V., and Freitas, A. (2018). Fibre-to mortar bond behavior in TRM composites: effect of embedded length and fibre configuration. Composites Part B Eng. 152, 43–57.
D’Anna, J., Amato, G., Chen, J. F., Minafò, G., and La Mendola, L. (2019). On the use of Digital Image Correlation (DIC) for evaluating the tensile behavior of BFRCM strips. Key Eng. Mater. 817, 377–384.
D’Antino, T., and Papanicolaou, C. (2018). Comparison between different tensile test set-ups for the mechanical characterization of inorganic-matrix composites. Constr. Build. Mater. 171, 140–151.
De Santis, S., De Canio, G., de Felice, G., Meriggi, P., and Roselli, I. (2019). Out-of-plane seismic retrofitting of masonry walls with textile reinforced mortar composites. Bull Earthquake Eng. 17:6265.
Grande, E., and Milani, G. (2018). Interface modeling approach for the study of the bond behavior of FRCM strengthening systems. Composites Part B Eng. 141, 221–233.
Icc. AC434 (2016). Proposed Acceptance Criteria for Masonry and Concrete Strengthening Using Fibre-reinforced Cementitious Matrix (FRCM) and Steel Reinforced Grout (SRG) Composite Systems. Whittier, CA: ICC-Evaluation Service.
Linea Guida per la (2019). Linea Guida per l’identificazione, la qualificazione ed il controllo di accettazione di compositi fibrorinforzati a matrice inorganica (FRCM) da utilizzarsi per il consolidamento strutturale di costruzioni esistenti. Published by the Italian Ministry of Public Works, 2019.
Malena, M., Sangirardi, M., Roscini, F., and de Felice, G. (2019). Numerical Modelling of the Experimental Response of SRG Systems. Key Eng. Mater. 817, 37–43.
Mazzucco, G., D’Antino, T., Pellegrino, C., and Salomoni, V. (2018). Three-dimensional finite element modeling of inorganic-matrix composite materials using a mesoscale approach. Composites Part B 143, 75–85.
Monaco, A. (2016). Numerical prediction of the shear response of semi-prefabricated steel-concrete trussed beams. Constr. Build. Mater. 124, 462–474.
Monaco, A., D’Anna, J., Oddo, M. C., Minafò, G., and La Mendola, L. (2019). Numerical Modelling of the Tensile Behavior of BFRCM Strips. Key Eng. Mater. 817, 15–22.
Rilem Technical Committee (2016). 232-TDT (Wolfgang Brameshuber). Mater. Struct. 49:4923. doi: 10.1617/s115270160839z
Sargin, M. (1971). Stress-Strain Relationship for Concrete and the Analysis of Structural Concrete Sections. Study 4, Solid Mechanics Division. Waterloo: University of Waterloo.
Keywords: FRCM, tensile behavior, numerical modeling, experimental tests, interface modeling
Citation: Monaco A, Minafò G, D’Anna J, Oddo MC and La Mendola L (2020) Constitutive Numerical Model of FRCM Strips Under Traction. Front. Built Environ. 6:60. doi: 10.3389/fbuil.2020.00060
Received: 09 October 2019; Accepted: 14 April 2020;
Published: 11 May 2020.
Edited by:
Massimo Latour, University of Salerno, ItalyReviewed by:
Antonio Caggiano, Darmstadt University of Technology, GermanyGabriele Milani, Politecnico of Milan, Italy
Copyright © 2020 Monaco, Minafò, D’Anna, Oddo and La Mendola. This is an open-access article distributed under the terms of the Creative Commons Attribution License (CC BY). The use, distribution or reproduction in other forums is permitted, provided the original author(s) and the copyright owner(s) are credited and that the original publication in this journal is cited, in accordance with accepted academic practice. No use, distribution or reproduction is permitted which does not comply with these terms.
*Correspondence: Alessia Monaco, YWxlc3NpYS5tb25hY29AcG9saXRvLml0