 Adel Francis
- Department of Construction Engineering, École de Technologie Supérieure (ÉTS), Montreal, QC, Canada
Resource management, regardless of the work location, is inefficient and can sometimes lead to a misleading schedule. Resources cannot be used, even if available, beyond the capacity of workplaces. Otherwise, congestion of workspaces will negatively affect the movement of people and materials and may reduce the productivity at construction sites. Traditional planning methods focus on tasks and constraints; thus, they are difficult to adapt to model spaces on a construction site. The main goal of this research is to model the progress of construction operations to ensure linear planning and facilitate the monitoring of the project site. The aim is to link the site plan and operation with the temporal aspects. This will ensure suitable rotation of the workforce among different spaces. The modeling strategy is based on the design of artifacts that show the dynamic evolution of the occupation of different areas and floors of the site of the building project. The dynamic representation of the occupancy rate of the construction site will ensure a good balance of the use of spaces throughout the project. The paper gives an example that applies three modeling approaches—namely, site-spatial-temporal modeling, Chrono-Allocation, and Chrono-Location—and explains the Chronographical scheduling modeling process. The site-spatial-temporal modeling of the construction operations presented in this paper belongs to the Chronographic modeling family. It presents the implementation of the schedule on the project site plan.
Introduction
Resource management, regardless of the work location, is inefficient and can sometimes lead to a misleading schedule. Resources cannot be used, even if available, beyond the capacity of workplaces. Otherwise, congestion of workspaces will negatively affect the movement of people and materials and may reduce the productivity at construction sites. Thomas and Smith (1990) defined a minimum required space of 19 m2 per person and 30.2 m2 for optimal productivity. They also specified that for the use of a machine, a safety space must be provided. The interaction between variables such as availability of labor and equipment, management of limited workspaces, and circulation and flow of materials dictates the project duration. Letting traffic occur randomly, without foresight or control, results in loss of time and money caused by congestion and waiting times (Francis, 2019). Effective attribution methods should therefore consider all these aspects.
Traditional planning methods focus on tasks and constraints; thus, they are hard to adapt to model spaces on a construction site. Kazi et al. (2009) cited that one of the major issues with traditional project management tools is that they do not convey workspace occupation or space availability and needs as the project progresses.
The growing need to track and locate the different resources on a construction site has led to the development of many space planning methodologies over the years. Winch and North (2006) defined spaces by their occupation status (vacant or occupied). In 1997, Riley and Sanvido developed the space planning method, a method that focuses on the division of workspaces and the sequencing of activities to define the order of occupation of the zones. Thus, it is possible to better anticipate conflicts in the workspaces. Other researchers (Thabet, 1992; Tommelein et al., 1992; Thabet and Beliveau, 1994; Riley and Sanvido, 1997) introduced site layout management for planning space-constrained and resource-constrained work for multistory buildings. Zouein and Tommelein (1994) presented a MoveSchedule model that characterizes changing resource space needs over time and uses a heuristic procedure to construct a dynamic layout automatically while allowing space reuse. Choo and Tommelein (1999) presented the WorkMovePlan database system that includes a 2-D interface to keep track of space needs, timing and location. Akinci and Fischer (2000) formalize space templates to capture the spatial requirements of different trades within their construction method description. Akinci et al. (2002) automatically generate the project-specific workspaces from a generic workspace ontology and a 4D production model. Seppänen and Kenley (2005) adapt the Earned Value Analysis to a location-based method for planning and controlling work. Seppänen et al. (2014) assess the use of a location-based management system (LBMS) to plan and control production and manage an effective response to deviations in production for construction projects. The Chronographical modeling concept (Francis, 2004, 2013, 2016) involves studying the modalities of information representation to enable site operations modeling using a multitude of compatible approaches. The model permits grouping information by location, teams or tasks or representing them on the construction site. The planner can also alternate from one visual approach to another via the manipulation of parameters. Visual communication can also be improved through layering, sheeting, juxtaposition, alterations and permutations, allowing for groupings, hierarchies, and classification of project information. In this way, graphic representation becomes a living, transformable image, assisting planners in solving problems of a variable nature, and simplifying site management while simultaneously utilizing the visual space as efficiently as possible (Francis, 2013). Winch and North (2006) developed critical space analysis (CSA) to link the spatial and temporal aspects of a project. This method allows the association of a space to a task by checking for the existence of conflicts between the critical path and the critical space on site. Dawood and Mallasi (2006) presented a critical space-time analysis that organizes the product's coordinates into the required execution sequence, assigns workspaces using layering within the AutoCAD model and then links workspaces to activities to provide a 4-D construction simulation of processes. Moon et al. (2009) classified and allocated workspaces using a semiautomatic generation method based on resource requirements. Wu and Chiu (2010) presented a 4-D model for workspace conflict detection.
Stabilization of Production
One observation that emerges when comparing the progress of operations between the manufacturing industry and the construction industry is the lack of stability and visibility in the medium and long term of the construction industry. Indeed, managers are generally so busy managing immediate obstacles that they do not have time for anticipation (Ballard, 2000). The planning is contaminated by emergencies because the sequence of activities to be carried out is chosen without checking the availability of the resources necessary for the realization (Alarcon and Ashley, 1999). Improvements in operations are possible only once the work environment is stabilized. Cost and time savings then become possible.
Based on these observations, several lean methods have been developed to stabilize the work on the sites, notably the Last Planner System (LPS) (Ballard, 2000). The LPS sets out what it should, could and would be doing. The planning process is designed on four levels of detail from a long-term schedule (master and phase) to the short term, namely the look-ahead schedule and the weekly work plan. In contrast to the old method of hiding problems and acting as if things are correct (Liker, 2004), the standardization of tasks and visual management are based on the development of visual controls by making it intuitive and quickly understandable by better communication, increased visibility, consistency, unique convention to communicate, faster detection of defects, and prevention of failure.
Scheduling and monitoring construction projects must also be adapted to facilitate the work stabilization and the visual management. Frandson and Tommelein (2014) applied the “Takt time” to a hospital project by defining a fixed duration of staff turnover in the different spaces. The goal is to find a better balance of teams to improve productivity and avoid congestion in work areas. Francis developed the spatiotemporal model (Francis and Morin-Pepin, 2017) and spatiotemporal optimization (Francis, 2019). The proposed spatiotemporal concept demonstrates the construction operations on the foreground and site spaces on the schedule background. This concept permits calculation of the occupancy rate, ensuring a smooth linear production and better use of the construction site.
Research Goal, Methodology, and Limitations
The main goal of this research is to model the progress of the construction operations to ensure linear planning for teams as well as facilitating the monitoring of the project site occupation. The aim is to link the site plan and operation with the temporal aspects. This link will ensure suitable rotation of the workforce in different spaces.
The design model is based on the process developed by Steenkamp and McCord (2007). This process specify the following steps:
1) The context of use
The context of this research is related to the numerous problems encountered on construction sites that monitor projects using the traditional “Gantt-Precedence” scheduling technique, a method that hardly takes into account the impact of circulation and the site occupancy by operations and intermediate storage to calculate the project's schedule and the critical path. The research proposal responds graphically in a visual manner to the questions of what needs to be done, by whom, how, when, and where, questions usually posed by the different actors on construction sites in order to avoid congestion or underuse of workspace. The objective is to maintain a suitable rotation of the workforce between the different spaces and a good balance of use of the spaces in order to ensure an optimal occupancy rate throughout the project.
2) The need for new artifacts
The methodology is based on design science research for the development and performance of artifacts. Research in design science helps managers understand a problematic area by building and applying artifacts (Hevner and Ram, 2004) and developing the knowledge needed to design solutions to problems in the field (Van Aken, 2005). The modeling strategy is based on the design of the artifacts needed, with the explicit aim of improving the modeling, optimization and decision-making processes during the planning and monitoring phases. Artifacts show the dynamic evolution of the occupation of different areas and floors of the building project.
3) The structural specifications and the prototype
The conceptualization structure and the prototype of these artifacts are based on the chronographical approach and entities (Francis, 2013), the graphical protocol and conceptual model (Francis, 2016) and spatiotemporal optimization (Francis, 2019). The relationships and constraints are based on the chronographical mathematical model, point-to-point relations (Francis and Miresco, 2006) and Chronographic Allocation Techniques (Francis, 2017). The next sections will explain in more detail these elements, structures and prototypes.
4) The implementation and the evaluation
An applied example, presented at the end of this paper, of site-spatial-temporal modeling will demonstrate the implementation and evaluation of the process.
The principal strength of the proposed method is related to its modeling ability that facilitates communication of information between the site stakeholders on the construction site. The dynamic representation of the occupancy rate on the site using adapted artifacts will improve the visualization of the schedule, ensure a good balance of the use of spaces throughout the project, and will act as a decision-making support system. The combination of space and Takt-time planning techniques will help to achieve this goal.
This paper contributes to the existing body of knowledge by extending site monitoring from a simple Gantt chart representation to a hybrid solution based on Chronographical spatiotemporal modeling. This hybrid spatiotemporal approach combines the use of construction site spaces, execution teams, materials, and activities. This research is limited to building construction projects. The suggested model will yield better results in the case of repetitive building projects.
Chronographical Modeling
The Chronographic method (Francis, 2004, 2013) models the site operations elements, including work, crews, materials and spaces, through various compatible graphical approaches. Each approach organizes the needed information using specific organizational means of distinction, association, scales, and attributes. The planner can alternate from one approach to another through the manipulation of graphics parameters. Visual communication is then improved through layering, sheeting, juxtaposition, alterations and permutations, allowing for groupings, hierarchies, and the classifying of project information. In this way, graphical representation becomes a living, transformable image. The comprehensive results of this method can be found in the work of Francis (2013, 2016).
Chronographic modeling involves seven (7) stages of building construction implementation, namely the creation of spaces (e.g., addition of new floors), the systems (e.g., ventilation ducts, plumbing,), the envelope (e.g., roofing), the division of spaces (e.g., partitions), the finishing (e.g., painting), the closing of spaces (e.g., by adding flooring) and the exterior works. These stages are modeled by creating seven graphical layers. Each can be subdivided into zones according to the rotation of work between the successive teams.
The Modeling Elements
Chronographical modeling represents all elements required to perform the construction operations, namely, the work locations, the renewable resources, the activities, and the consumable resources. The graphical protocol of these elements uses shapes, fill colors, texture patterns and symbols, and codes and texts.
Work Locations
Work locations management is the least considered aspect of traditional scheduling methods. These traditional methods rely primarily on scheduling the activities sequence to calculate the project schedule and the critical path. Conversely, in space planning methods, locations are considered the main element. The critical path is replaced by a critical space strategy that studies, independently for each zone, the constraints between the activities. This logic also ensures a smooth rotation of site operations (teams and activities) between the different site zones.
The characteristics of the work locations are defined according to (i) their hierarchy level, (ii) their limits (area or perimeter), (iii) their shapes (surface or linear), (iv) their positions (floor, ceiling, wall, etc.), (v) their states (free or busy), (vi) their types of occupation (temporary, whether by activity or stock, or permanently by a finished product), or (vii) the type of their access points (doors, openings in a wall, in the floor, or in the ceiling).
Chronographic modeling suggests using a location breakdown structure (LBS) with five (5) levels of detail: (i) project, (ii) buildings or sections, (iii) floors, (iv) stage of implementation, and (v) zones. Seven major successive stages of the implementation are proposed as cited before.
Renewable Resources
Because the vast majority of work in building projects is performed by subcontractors, the general contractor only has a few human resources. For that, his role is mainly limited to coordinating between the teams in different areas. He has to predefine the main direction of work execution, as well as the rhythm of rotation between the successive teams. By layer and by zone, it is necessary to define the minimum and the optimal space required per crew; the exclusivity and the degree of inclusiveness of occupation of the zones; the rate of production by activity type; and the limits of procurement of the intermediate stocks required per period.
Equipment is also a renewable resource that must be coordinated between the different spaces. Three categories of equipment are to be considered: operators, carriers, and handling. The planner must consider their type of movement, their footprint and their capacity. The general contractor coordinates these teams and equipment to ensure the highest security level on the site and an adequate rotation of the workforce among different spaces.
Consumable Resources
The management of consumable resources includes several processes: (1) the relationships with suppliers and manufacturers (shops and industrial); (2) the different procurement processes, namely custom-delivered materials and prefabrications (including shop drawings, approval, manufacturing); (3) the delivery system, including the fluidity of the movement of materials and intermediate stocks; (4) the storage capacity (size and weight) at the site and on the floors; (5) the mobility of stocks on the site; and (6) the coordination with the project schedule.
The Graphical Protocol
(Figure 1) demonstrates the graphical protocol that is used to model the progress of the construction operations:
1. The Physical Elements:
a) Resources (specialties) are represented graphically by a range of dark-colored form fills;
b) Work locations (zones) are represented graphically by a range of light-colored form fills; and
c) Floors are represented graphically by a range of dark colors for the form's borders.
2. Scales:
a) Time scales are represented graphically by a range of hot/cold fill colors. Close dates are demonstrated by hot colors. These colors gradually cool more as the date moves away from the current date or the start of the project (or phase), according to the planner's need;
b) The occupation rate of each date of the site is represented by a range of hot/cold fill colors;
c) Each zone has a code, and the relative weight has to be indicated;
d) Each zone has its own time scale that demonstrates the temporal occupation of the zone. A dot also shows the current date.
3. Process:
a) operation progress is represented graphically as follows: (i) a diamond that defines the start or end of the work of a specialty; (ii) the arrow shows the direction of execution of the work. A thin arrow to demonstrate the displacement of the previously executed work (dashed lines) or the work to be executed (solid lines) from zone to zone; (iii) a thick vertical arrow to indicate the movement of the operations from floor to floor.
b) The operations state is distinguished graphically between the works already done, the works in progress and those to come.
c) The quality control demonstrates whether checkpoints are done before the work execution, to indicate a Go-no Go state; during the work in progress, to monitor the execution quality or take samples where appropriate; or after the execution, to verify the quality of the executed work.
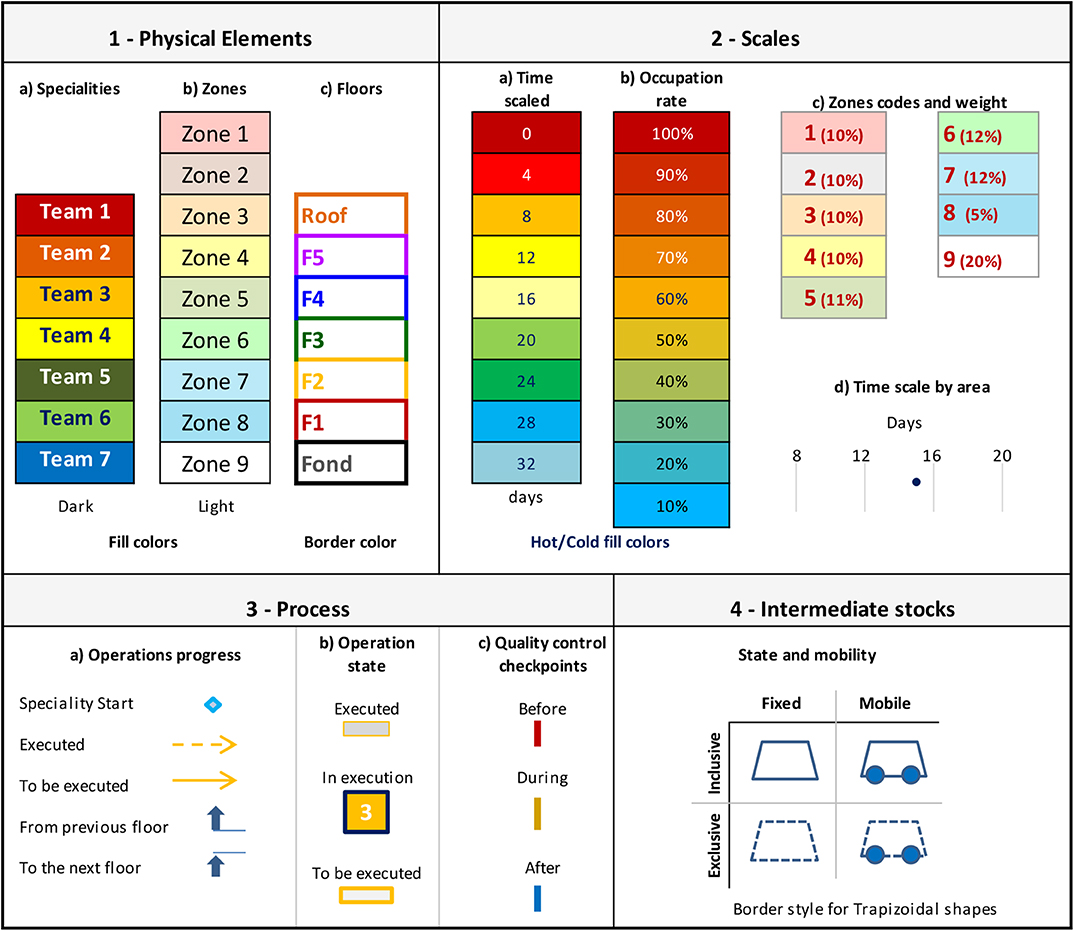
Figure 1. The construction operations graphical protocol.
The intermediate stocks can include their fixed or mobile state and the exclusivity or inclusivity of occupation of the work area. These intermediate stocks are represented by the border style of a trapezoidal shape.
The Site-Spatial-Temporal Modeling of the Construction Operations
The site-spatial-temporal modeling of the construction operations presented in this paper belongs to the Chronographic modeling family. It presents the implementation of the schedule on the project site plan. It is an inverse of the time-based spatial-temporal modeling presented by Francis (2019) in which the spaces of the site are represented as a background of a time-based schedule. This section presents the scheduling modeling process and an example that applies this model.
The Scheduling Modeling Process
The scheduling modeling process (Figure 2) is as follows (for more information, see (Francis and Morin-Pepin, 2017; Francis, 2019):
1. - Preparation process
1 For each floor, define the layers that demonstrate the construction steps (creation of spaces, systems, divisions, finishes, and closing of zones);
2 For the common layers such as the envelope and exterior works, define the layers that demonstrate their construction steps;
3 Divide each layer into zones that ensure a Takt production;
4 Define a general direction for the sequence of work between the zones of the same layer and define the connection point(s) between the floors, if applicable.
2. - Scheduling process
5 In each zone, define the required specialty works. Indicate if the work occupies the zone exclusively or is inclusive and could share the zone with other activities or intermediate stocks. In this second case, define its necessary area and shape, as well as the occupancy rate of the zone;
6 In each zone, establish the logical execution constraints between the different specialty works based on the Chronographical mathematical model and point-to point relations and the Chronographic Allocation Techniques;
7 For each specialty, define the sequence of work by linking the activities of the specialty between the different areas, respecting the predefined working direction;
8 Impose, if necessary, Takt relationships between successive activities to ensure continuity of execution by delaying predecessors when successor activities are driven by other constraints. Takt links impose zero free margins or flexible free margins that have a value between x and y units of time (e.g., between 0 and 2 days).
3. - Optimization process
The optimization aims to ensure the linearity of execution of works and the continuous presence of the various teams on the site. It also aims at the optimal use of the site. A low occupancy rate unnecessarily delays the project. Conversely, occupying the site beyond its capacity obstructs traffic and increases conflicts and disputes between teams. For that, the optimization is a cyclical process of relaxation or compression of production, generally between a minimum and a predefined maximum according to several constraints, including the availability of resources. The optimization process uses a forward/backward process of compression or relaxation according to the occupancy rates, as defined by Francis (2019). During this forward/backward process, a layer, a zone or an activity can be revisited several times to relax or compress it.
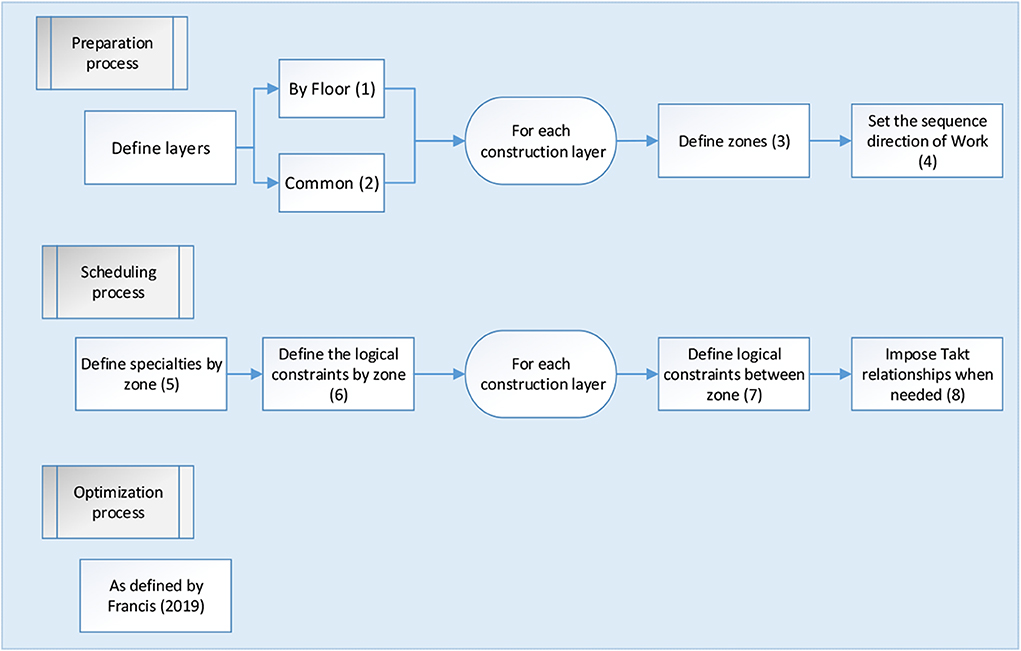
Figure 2. The construction operations scheduling process.
Applied Example for the Site-Spatial-Temporal Modeling
The applied example is carried out on the computer prototype developed on VBA-Excel in our laboratory. The different graphical approaches of presentation, of this prototype, are interactive. Thus, the planner carries out his planning on the approach, which suits him best. The other approaches are generated automatically to demonstrate the project information on different points of view. These approaches help planners to present valuable information in a clear and comprehensible manner, to optimize the process, to solve various problems, and to facilitate site management. In this way, the planning process does not require more planning effort, but rather, because of its visualization and graphic optimization assistance capabilities, it becomes a common tool on the job site for communicating information. Thus, reducing the coordination time of the work.
Although it is possible to see all the seven (7) stages of building construction implementation simultaneously (this has been demonstrated on several previous publications, in particular, Francis and Morin-Pepin, 2017; Francis, 2019), the current example only demonstrates the finishing layer and the different teams and activities of this layer. (Figure 3) demonstrates an example that applies three presentation approaches from the Chronographic modeling for the finishing layer of a building project:
1 - Site-spatial-temporal modeling
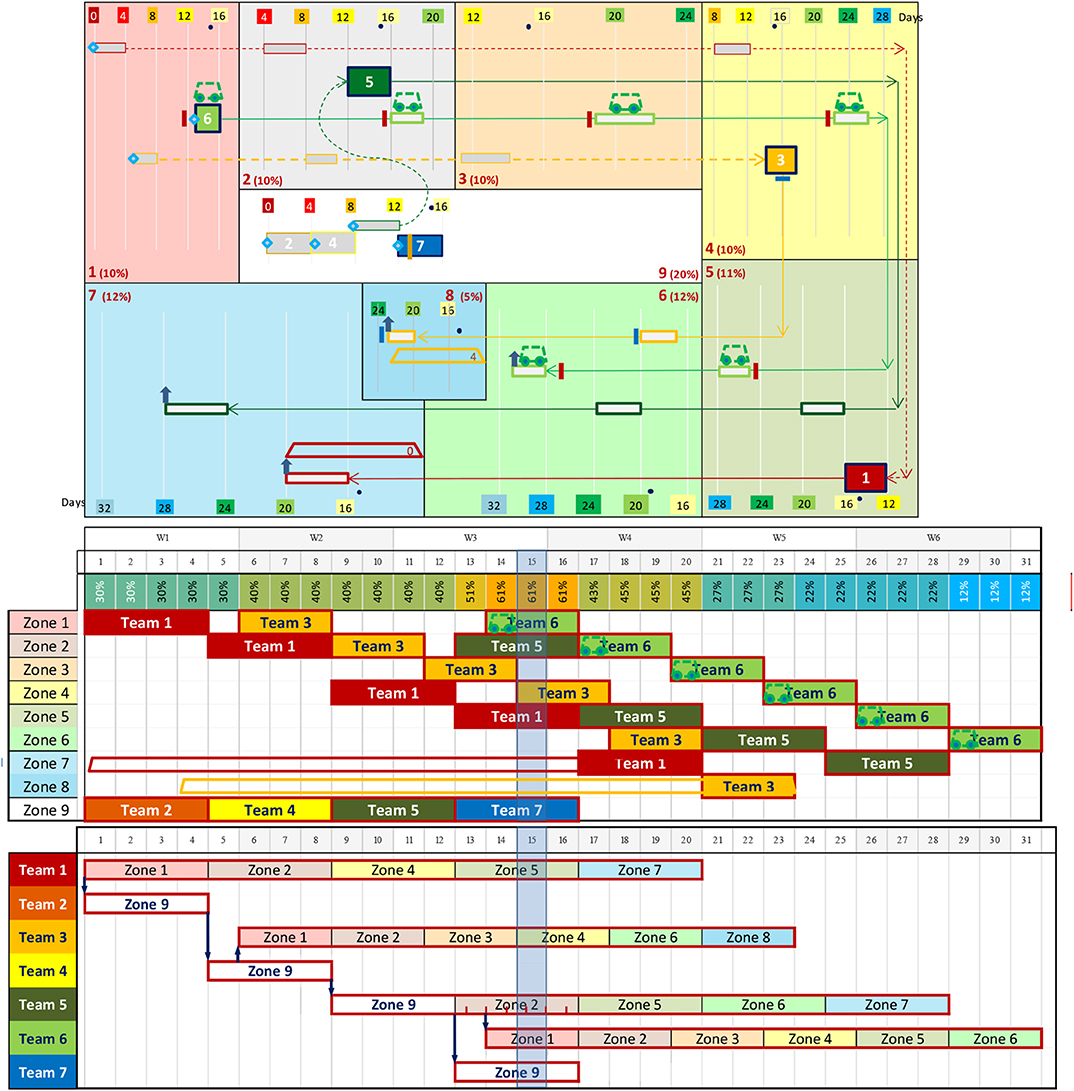
Figure 3. Applied example for the site-spatial-temporal modeling.
This model presents the implementation of the schedule on the project site plan. Each zone is identified with a specific light color. In each zone, the planner will define the required activities (specialties) to be executed and the constraints between them. After that, the manager has to define, for each layer, a general direction for the sequence of work between the zones of the same floor, as well as define the connection point(s) between the floors. Takt relationships are then drawn, when needed, between the activities of the same specialty in different areas.
For each area, a calendar is drawn that demonstrates the period over which activities are performed. As an example, in the central zone “9,” the four activities 2, 4, 5, and 7 are executed successively between the first and the 16th day. The calendar therefore shows this period as a calendar that use a Hot/cold colors. Because the current date is day 15, the focus is on activity 7 that is currently running. The other three activities already performed are drawn with lighter colors to indicate that they are completed. Activity 7 also has a control point during its execution, illustrated by the orange vertical line at the center of the activity.
A specific team can also track its activities in the different zones. For example, Team 1 has to execute four activities in zones 1, 2, 4, and 7 in 20 days. Because the current date is day 15, the focus is on the activity in zone 5. The previous activities are shown with lighter colors, and the last one, in zone 7, is drawn in a darker color to indicate that this activity has to be done in the future.
In (Figure 4), the focus is on the activities that are currently being executed, as well on the execution directions. All other details are omitted. This means that the planner can choose what information he wants to reveal and what information he wants to mask to facilitate the management and communication of the scheduling information.
2 - Chrono-Allocation modeling
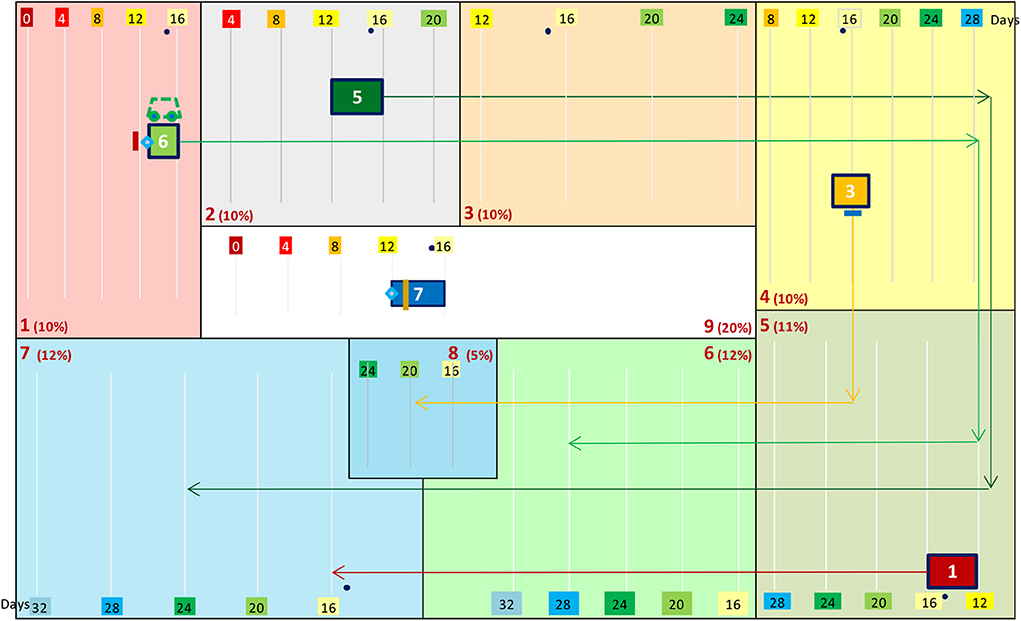
Figure 4. Site-spatial-temporal modeling current work.
This model uses time as the main direction and the resources as a second direction. The site location becomes the activity attribute. This representation favors continuous work for each team and leveling by avoiding inactive or over-processed periods. This example uses eight (8) teams. These teams are shown in this figure in eight (8) different dark colors.
3 - Chrono-Location modeling
This model uses time as the main direction and the site locations as a second direction. The resources become the activity attributes. This representation favors the resource linearity and rotation between zones. This example uses nine (9) zones. These zones are identified in this figure in nine (9) different light colors.
The relational constraints between activities use internal divisions and point-to-point connections. Divisions can be related to external or internal scales. The external scales usually represent the time, while the internal scale usually represents the quantities. Relation points could be related to the external scale (relation between 1 day after the start date of Zone 9 and Zone 1 start) or to the internal scale (relation between Zone 2 s internal division and Zone 1 start).
Conclusion
It is indisputable that clear and effective communication of a project's scheduling information through graphical means will help the project succeed. Traditional scheduling methods hardly represent spatiotemporal constraints. This limitation results in non-optimal use of the available site space, which affects the project's duration and cost.
The proposed site-spatial-temporal modeling considers a balance of work across teams, floors, zones and procurement processes. One can conclude that the integration of spaces, operations and temporal aspects promotes efficient use of building sites and helps managers maximize the site occupancy rates, ensure suitable rotation of the workforce between zones and support linear productions of spaces and teams. The result is a schedule presented directly on the project site, complementary to a variety of compatible Chronographical approaches. This approach prioritizes the critical space on the critical path of activities. The validation process was performed through case studies that evaluate the visual data and assess the mental effort necessary to find information on the schedule.
Despite its advantages, the proposed process has its limitations. One of the main challenges arises from the additional effort needed to create and follow the schedule. However, the use of the LPS can easily mitigate this gap and even facilitate the management of work. It should be specified that this additional effort must be made, in all cases on the site, by the manager, without any visual support. A second restriction is the absence of commercial software that applies these strategies. Despite this, the presented method remains attractive and offers a visual communication that meets the needs of planners and resolves the limitations of existing methods.
Data Availability Statement
All datasets generated for this study are included in the article/supplementary material.
Author Contributions
The author confirms being the sole contributor of this work and has approved it for publication.
Conflict of Interest
The author declares that the research was conducted in the absence of any commercial or financial relationships that could be construed as a potential conflict of interest.
References
Akinci, B., and Fischer, M. (2000). “An automated approach for accounting for spaces required by construction activities,” in Construction Congress IV (Orlando, FL: ASCE). doi: 10.1061/40475(278)1
Akinci, B., Fischer, M., and Kunz, J. (2002). Automated generation of work spaces required by construction activities. J. Constr. Eng. Manag. 128, 306–315. doi: 10.1061/(ASCE)0733-9364(2002)128:4(306)
Alarcon, L. F., and Ashley, D. B. (1999). “Playing games: evaluating the impact of lean production strategies on project cost and schedule,” in Proceedings of the 7th Annual Conference of the International Group for Lean Construction IGLC-7, (Berkeley, CA), 263–274.
Ballard, G. (2000). The Last Planner System of production control (PhD thesis). Department of Civil Engineering, University of Birmingham, Birmingham, United Kingdom.
Choo, H. J., and Tommelein, I. D. (1999). “Space scheduling using flow analysis,” in Proceedings of the 7th Annual Conference of the International Group for Lean Construction (Berkeley, CA: (IGLC-7))), 299–311.
Dawood, N., and Mallasi, Z. (2006). Construction workspace planning: assignment and analysis utilizing 4D visualization technology. Comput. Aid. Civil Infrastruc. Eng. 21, 498–513. doi: 10.1111/j.1467-8667.2006.00454.x
Francis, A. (2004). The chronographical method for construction project planning (Ph.D. thesis) École de Technologie Supérieure, Montreal, QC, University of Quebec. Available online at: http://espace.etsmtl.ca/692/ (accessed December 05, 2019). (in French).
Francis, A. (2013). “The chronographical approach for construction project modelling,” in Proceedings of the Institution of Civil Engineers - Management, Procurement and Law, Vol. 166 (ICE Publishing), 188–204. doi: 10.1680/mpal.12.00009
Francis, A. (2016). “A chronographic protocol for modelling construction projects,” in Proceedings of the Institution of Civil Engineers - Management, Procurement and Law, Vol. 169, 168–77. doi: 10.1680/jmapl.15.00039
Francis, A. (2017). Chronographic allocation techniques for construction projects. JCES 6, 24–36. doi: 10.5963/JCES0601003
Francis, A. (2019) Chronographical spatiotemporal scheduling optimization for building projects. Front. Built Environ. 5:36. doi: 10.3389/fbuil.2019.00036.
Francis, A., and Miresco, E. T. (2006). A chronographic method for construction project planning. Can. J. Civ. Eng. 33, 1547–1557. doi: 10.1139/l06-148
Francis, A., and Morin-Pepin, S. (2017). “The concept of float calculation based on the site occupation using the chronographical logic,” in Procedia Engineering, Vol. 196 (Primosten: Elsevier), 690–97. doi: 10.1016/j.proeng.2017.07.235
Frandson, A., and Tommelein, I. D. (2014). “Development of a takt-time plan: a case study,” in Construction Research Congress 2014: Construction in a Global Network - Proceedings of the 2014 Construction Research Congress, (Atlanta, GA), 1646–1655. doi: 10.1061/9780784413517.168
Hevner, A. R., March, S. T., Park, J., and Ram, S. (2004). Design science in information systems research. MIS Q. 28, 75–106. doi: 10.2307/25148625
Kazi, A. S., Aouad, G., and Baldwin, A. (2009). Towards minimizing space-time conflicts between site activities using simple generic algorithm - the best execution strategy. J. Inform. Technol. Construct. 14, 154–179. Available online at: https://www.itcon.org/papers/2009_14.content.05799.pdf
Liker, J. K. (2004). The Toyota Way: 14 Management Principles from the World's Greatest Manufacturer. Business & Economics. (McGraw Hill Professional) 350.
Moon, H., Kang, L., Dawood, N., and Ji, S. (2009). Configuration Method of Health and Safety Rule for Improving Productivity in Construction Space by Multi-Dimension CAD System. Jeju: ICCEM/ICCPM.
Riley, D. R., and Sanvido, V. E. (1997). Space planning method for multistory building construction. J. Construct. Eng. Manag. ASCE 123, 171–180. doi: 10.1061/(ASCE)0733-9364(1997)123:2(171)
Seppänen, O., Evinger, J., and Mouflard, C. (2014). Effects of the location-based management system on production rates and productivity. Constr. Manag. Econ. 32, 608–624. doi: 10.1080/01446193.2013.853881
Seppänen, O., and Kenley, R. (2005). “Using location-based techniques for cost control,” in 13th Annual Conference of the International Group for Lean Construction (Sydney, NSW: IGLC).
Steenkamp, A. L., and McCord, S. A. (2007). Approach to teaching research methodology for information technology. J. Inform. Syst. Educ. 18, 255–266.
Thabet, W. Y. (1992). A space-constrained resource-constrained scheduling system for multi-story buildings. Virginia Polytechnic Institute and State University, Virginia, United States, 684.
Thabet, W. Y., and Beliveau, Y. J. (1994). Modeling work space to schedule repetitive floors in multistory buildings. J. Constr. Eng. Manag. 120, 96–116. doi: 10.1061/(ASCE)0733-9364(1994)120:1(96)
Thomas, H. R. Jr., and Smith, G. R. (1990). Loss of Construction Labor Productivity Due to Inefficiencies and Disruptions: The Weight of Expert Opinion. PTI Report 9019. Pennsylvania Transportation Institute, Pennsylvania State University.
Tommelein, I. D., Levitt, R. E., and Hayes-Roth, B. (1992). SightPlan model for site layout. J. Constr. Eng. Manag. ASCE 118, 749–766. doi: 10.1061/(ASCE)0733-9364(1992)118:4(749)
Van Aken, J. E. (2005). Management research as a design science: Articulating the research products of mode 2 knowledge production in management. Br. J. Manag. 16, 19–36. doi: 10.1111/j.1467-8551.2005.00437.x
Winch, G. M., and North, S. (2006). Critical space analysis. J. Constr. Eng. Manag. 132, 473–481. doi: 10.1061/(ASCE)0733-9364(2006)132:5(473)
Wu, I., and Chiu, Y. (2010). “4D workspace conflict detection and analysis system,” in Proceedings of the 10th International Conference on Construction Applications of Virtual Reality, (Sendai), 95–102.
Keywords: chronographic, construction, project, site, spatiotemporal, BIM, 4D, scheduling
Citation: Francis A (2020) Chronographical Site-Spatial-Temporal Modeling of Construction Operations. Front. Built Environ. 6:67. doi: 10.3389/fbuil.2020.00067
Received: 12 December 2019; Accepted: 20 April 2020;
Published: 12 May 2020.
Edited by:
Olli Seppänen, Aalto University, FinlandReviewed by:
Tomoyuki Gondo, The University of Tokyo, JapanShuichi Ishida, Tohoku University, Japan
Serdar Durdyev, Ara Institute of Canterbury, New Zealand
Copyright © 2020 Francis. This is an open-access article distributed under the terms of the Creative Commons Attribution License (CC BY). The use, distribution or reproduction in other forums is permitted, provided the original author(s) and the copyright owner(s) are credited and that the original publication in this journal is cited, in accordance with accepted academic practice. No use, distribution or reproduction is permitted which does not comply with these terms.
*Correspondence: Adel Francis, YWRlbC5mcmFuY2lzQGV0c210bC5jYQ==