- Department of Civil and Environmental Engineering, Western University, London, ON, Canada
Today's complex modern infrastructure requires robust and autonomous condition assessment as they continue to age with increasing operational loads and extreme climatic events. Structural Health Monitoring (SHM) has recently gained significant interests in inspection and maintenance of large-scale structures. However, a large amount of raw data resulting from the data logger of these SHM systems require appropriate tools to visualize and diagnose the data systematically. Building Information Modeling (BIM) is a powerful data management tool that can be utilized as a base platform to analyze and visualize long-term SHM data. Current BIM-based approaches have the capabilities of facilitating design, production, and construction management of structures. BIM models in such approaches can serve as static information that contains as-built data. The objective of this paper is to take one step forward from static toward dynamic BIM by representing and visualizing real-time SHM data. The proposed framework developed in this study features an online visualization of data, real-time system identification, and efficient decision-making. In this paper, a steel bridge located in London, Ontario (Canada), is utilized as a case study where both BIM and SHM are integrated with a unified fashion. The proposed framework attempts to improve the visualization of SHM data and facilitates infrastructure owners in real-time tracking of critical transport infrastructure.
Introduction
Civil infrastructure such as bridges, buildings, dams, wind turbines, and pipelines are prone to deterioration as they age. Keeping track of their usage, performance, and integrity provides impetus to maintain public safety and achieve improved satisfaction to the infrastructure owners and end-users. In the past, numerous catastrophic failures occurred world-wide; most of these tragedies were due to progressive deterioration of structures over the years (Mirza and Shafqat Ali, 2017; Cawley, 2018), demanding an immediate need for systematic monitoring of structures based on their current condition. Structural Health Monitoring (SHM) offers attractive strategies to retain public safety, undertake rapid infrastructure management, and recover a structure from its critical state in ease (Durager et al., 2013; Newhook and Edalatmanesh, 2013). Changes in structural performances can be identified by detailed SHM assessments (Okasha and Frangopol, 2012; Miao et al., 2018).
SHM offers robust diagnostic and prognostic tools that can detect critical responses of a structure and evaluate any unusual symptoms, serviceability, and safety concerns (Carden and Fanning, 2004; Wu and Jahanshahi, 2018). Most of the conventional inspection methods require visual inspection by maintenance engineers. Recently developed SHM techniques utilized the measured data acquired by sophisticated sensors (Ellenberg et al., 2014; Sankarasrinivasan et al., 2015; Chen et al., 2016; Na and Baek, 2017; Sadhu, 2017; Sony et al., 2019) which can expedite the accuracy of damage detection as compared to visual inspection (Abe, 1998) using continuously monitored data. An SHM system, with the aid of long-term monitored data, can evaluate the structural integrity and perform accurate damage assessment (Aktan and Grimmelsman, 1999; Somwanshi and Gawalwad, 2016; Sadhu et al., 2017). Most of these techniques (Farrar and Worden, 2013) are data-driven in nature, where either modal (e.g., natural frequency, damping and mode shapes) or physical (e.g., stiffness and mass) parameters are estimated or tracked based on the measured data. Any discrete or progressive changes in these parameters are considered as the potential condition indicators for damage identification.
Figure 1 shows a typical representation of an SHM system where the sensors are connected to a data acquisition (DAQ) system, and send the acquired raw data to a central unit or a computer. The following post-processing phase includes sorting and de-noising of the data, and determines the vital information, including critical deflections and modal parameters such as frequency, damping ratio, and mode shapes, etc. Once such parameters are studied and documented from the measured structural response over a long period, automated alerts can be set up using the appropriate thresholds for safe and reliable use of the public infrastructure. However, the interpretation of long-term data collected from continuous monitoring can be overwhelming due to the processing of an enormous amount of data. Automated processing and visualization of data facilitate accurate decision making in a timely manner. Building Information Modeling (BIM) is a digital representation of physical and functional characteristics of a structure (Ren et al., 2019), which is utilized here for structural monitoring and maintenance.
BIM is not only a computer-aided-design tool but also a three-dimensional (3D) modeling and information management tool that can aid the stakeholders and infrastructure owners in monitoring projects remotely. Traditional BIM aims at design and life-cycle analysis of a new building and its construction (Arayici and Aouad, 2010; Grilo and Jardim-Goncalves, 2010; Liu et al., 2014; Singh and Sadhu, 2019). BIM is capable of integrating various engineering aspects through 3D spatial representation. Capabilities of BIM are not only limited to being a software environment, but it also serves as a visualization tool providing a better understanding of the project and helping designers to convey the design information and ideas to the project owners (Ivson et al., 2019). With all the information about each component being in one place in a single model, it enables end-users to access such information at any time during its lifecycle. Such capability of big data inventory is utilized in this study and explored how it can provide a real-time representation of SHM data to the end-users. During long-term monitoring of structure, raw and preprocessed data can add up to hundreds of gigabytes of data, which makes the process of data retrieval prone to errors (Alampalli et al., 2016; Cremona and Santos, 2018; Almasri et al., 2019). Damage detection can be visualized in the model by assimilating the sensor data within the BIM model. BIM uses a static data source to assess the structure. Therefore, the sensor data, while linked to BIM, can extend the application of BIM model from static to a dynamic model as it can feature real-time data retrieval and interpret the current performance of the structure.
Recently, there have been several efforts to develop BIM-based SHM strategies. For example, (Zhang and Bai, 2015) created a low-cost structural condition assessment device that used BIM computing environment for automated health management of structures (Chen et al., 2014) developed a dynamic BIM framework by developing a prototype to insert real-time data into the BIM model. The dynamic BIM model developed in the study represented real-time building information via connecting the sensor data with the BIM model. A geothermal bridge deck de-icing system monitored with embedded sensors was used as a case study (Delgado et al., 2017) formulated a standard data model to include and visualize SHM data directly to BIM models. A case study was conducted in a pre-stressed concrete girder bridge featuring a fiber-optic based SHM system. The goal to accurately represent the SHM sensory system, including damage sensitive features in the object properties, was achieved by Grosso et al. (2017). The authors demonstrated the linking of data to sensor representations within the BIM model.
The viability of bridge information modeling with different modules of bridge management systems was explored by Marzouk and Hisham (2011). (Huston et al., 2016) worked on the integration of BIM and decision-making systems with SHM involving collection, storage, transmission, and processing of information obtained from sensor data and design documents. The extended Industry Foundation Classes (IFC) schema, referred to as IFC Monitor was formulated by Theiler et al. (2017) to facilitate the documentation of SHM systems since the current schema was unable to support the full description of modeling related information. The automatic generation of parametric building models of SHM systems and efficient integration with other data sets was enabled by Delgado et al. (2018). Recently, Boddupalli et al. (2019) developed a data visualization tool for systematic decision making using the computing environment of BIM as a primary platform.
The significant limitations of these studies are the lack of a single standardized neutral exchange format for sharing information among the various data software. The problem arises when attempting to extract data from sensors in many different protocols. The handling of large volumes of data requires high-performance hardware. Lack of interoperability is another challenge in the seamless integration of an SHM system with the BIM platform. There is a lot of software commercially available for modeling and development of structures. However, the development of various computational tools such as add-ins or plug-ins is undertaken in a standalone fashion, which is also inefficient to address the complications arising from multiple data sources. The existing BIM-based SHM tools lack interoperability and information sharing with other software and technology (Grilo and Jardim-Goncalves, 2010; Cemesova et al., 2015; Karan and Irizarry, 2015; Tomasi et al., 2015). Moreover, the capability of system identification and evolution of structural parameters over time are not available in the existing visualization tools in the literature, which forms the main focus of the proposed research.
After a basic introduction of BIM and SHM techniques and identification of the limitations in the current literature, the proposed method is discussed in the next section. The proposed framework is finally illustrated using a case study consisting of visualization of the bridge SHM data followed by results and conclusions.
Proposed Framework
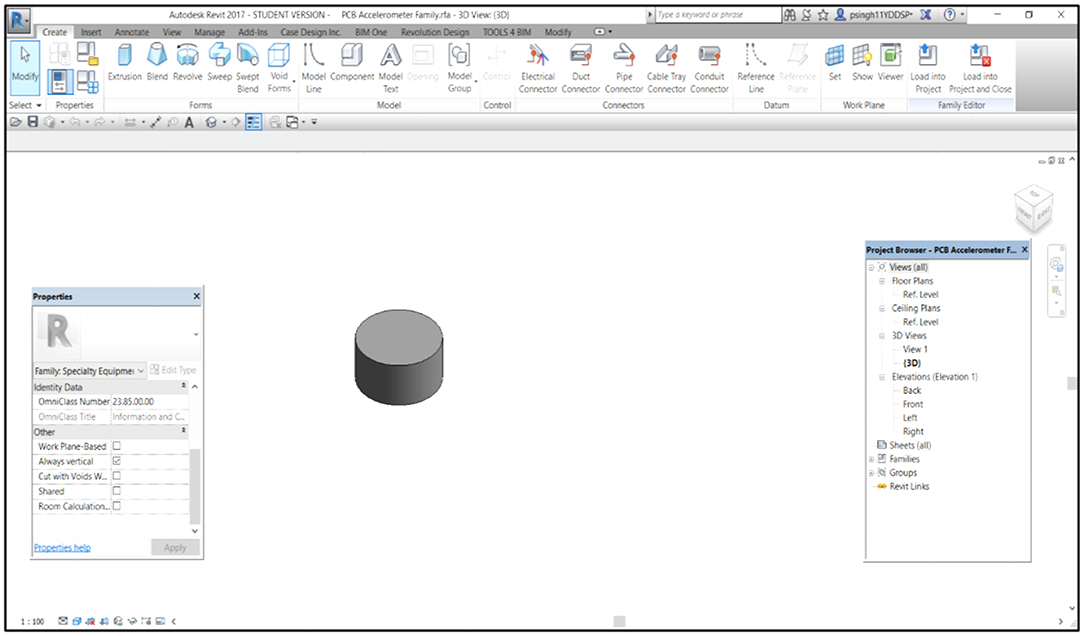
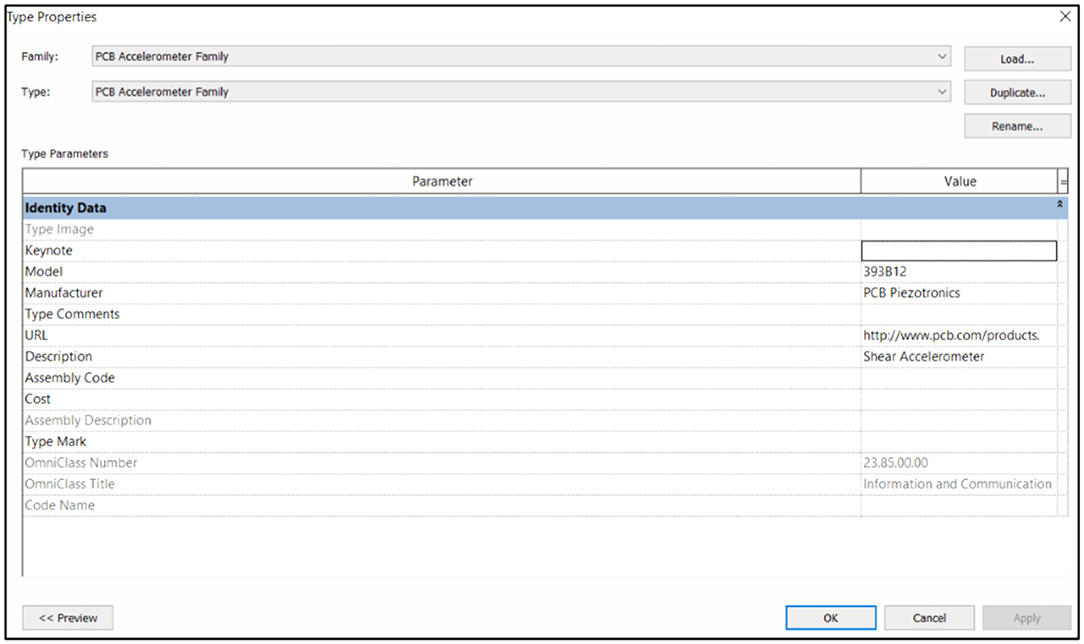
This section provides an overview of the proposed methodology implemented to visualize SHM information within BIM through Autodesk REVIT®. The proposed framework utilizes the relative merits of SHM and BIM to develop a visualization tool for monitoring of large-scale infrastructure. This study uses REVIT and MATLAB (MathWorks, 2018) online portal to integrate the sensor information with condition data and diagnostic results. Virtual sensors in this study are used to visualize the monitoring related information in the BIM environment. Accelerometer sensors used for vibration data collection are modeled in the REVIT as a new class of family, as shown in Figure 2. Sensor metadata is used to create a sensor family and can be accessed by highlighting any sensor from the BIM model. The dynamic behavior of the structure is analyzed using the sensor data in MATLAB.
Virtual Sensors
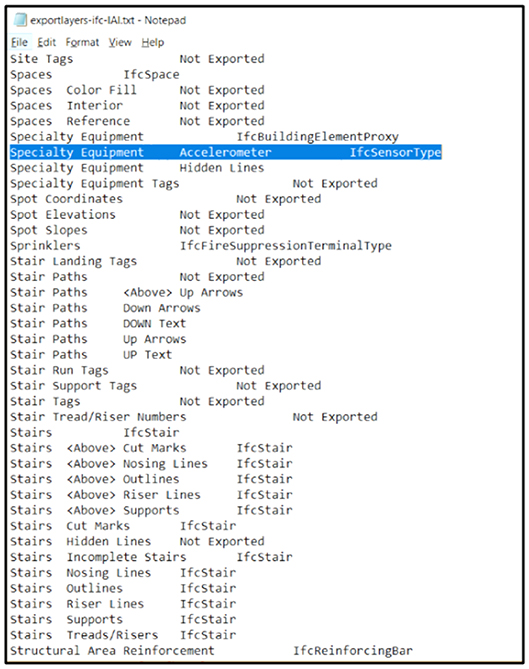
Virtual sensors used in this study to mimic the sensors installed on a real structure are created as a new REVIT family using the IFC standard of data exchange shown in Figure 3. IFC is used by building-model based applications to exchange data with each other, and it constitutes a specification that can describe model data related to all phases of the life-cycle of a project (Augenbroe et al., 2004; Rio et al., 2013). The IFC model represents tangible building elements such as doors, walls, ceilings, beams, etc. and even more abstract entities such as time, schedule, space, cost, organization, etc. There are different IFC classes for each element, while the sensors are included in the IFCBuildingControls domain module. There are two classes associated with sensors; IFCSensor and IFCSensorType. As the sensors are defined in the BIM environment, sensor information can be accessed using the properties box of each sensor. The link to MATLAB is also connected with the properties box. By clicking the MATLAB link, the user is taken to the MATLAB online portal, where system identification scripts can be run. Subsequently, the system identification results can be analyzed for decision-making.
System Identification
The data and system identification information of SHM is embedded within the BIM software such that long-term health monitoring information can be visualized. A wide range of system identification methods (Dessi and Camerlengo, 2015; Perez-ramirez et al., 2016; Pappalardo and Guida, 2018; Barbosh et al., 2018; Mao et al., 2019) were developed by the researchers to estimate modal parameters from the measured vibration data. Most of these techniques are suitable where all critical locations of the structure are instrumented. For the visualization purpose, each sensor installed in a real structure corresponds to a virtual sensor in the BIM model. Therefore, while visualizing a particular virtual sensor, each sensor creates a time history that requires a system identification method that is capable of using only a single channel measurement. In this study, a newer time-frequency method, time-varying filter-based empirical mode decomposition (TVF-EMD) (Li et al., 2017; Lazhari and Sadhu, 2019) is used to conduct system identification using single-channel measurement.
Consider a linear with n degrees-of-freedom (DOFs), damped and discrete lumped-mass structural system, subjected to a random input force, u(t):
where, M, C, and K are mass, damping, and stiffness matrices, respectively, and y(t) is a displacement response vector at various available DOFs. A state-space model can be used to find the solution for a dynamical system given above:
where A is state matrix, B is the input matrix, is the output matrix, and D is the transmission matrix. Under excitation u(t), the resulting solution can be written in terms of expansion of vibration modes:
where y and η are response and modeshape matrix, respectively. φmxn is the mode transformation matrix. n and m are the number of modal responses and measurements, respectively. The measurement at k-th DOF (k=1,2,….,m) from the above equation can be expressed as:
TVF-EMD is capable of eliminating the mode-mixing or end-effects under the presence of closely spaced modes or measurement noise. This method performs local cut-off filtering where a signal is filtered into local high-pass and low-pass frequency components and decomposed into narrowband signal components called Intrinsic Mode Functions (IMFs). By performing TVF-EMD of the kth measurement yk(t) in terms of IMFs (i.e., ikj), one can get (Lazhari and Sadhu, 2019):
By comparing the above two equations, we get:
By taking the ratio of above equations for k-th and l-th DOF, the normalized mode shape ordinates at k-th DOF w.r.t. l-th DOF can be found as:
The details of TVF-EMD method can be found in Lazhari and Sadhu (2019) and are not repeated here. TVF-EMD uses the root-mean-square (RMS) value of the resulting IMFs to extract the modal responses. However, all the frequencies with energy higher than the average RMS value cannot be utilized to differentiate the actual structural frequencies from the background noise. To automate the identification step, it is proposed that when the difference between the respective Fourier peaks in an IMF is more than a specific percent (say, 70%) of the higher peak value, then the IMF represents a structural modal response rather than mixed modal response.
Proposed Visualization and Decision-Making
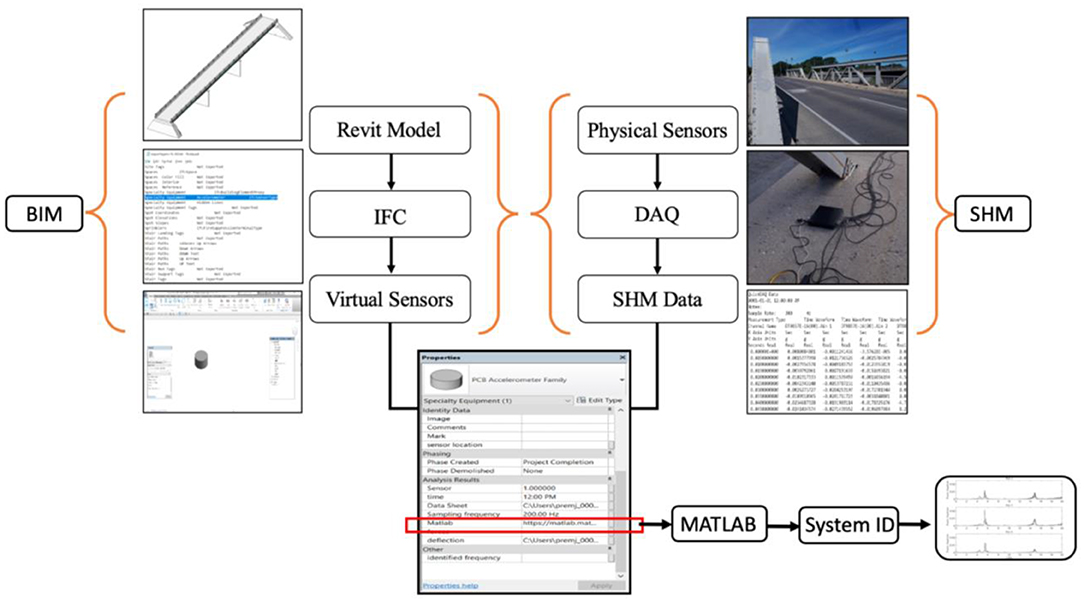
The proposed framework has three-fold advantages of online visualization of data, real-time system identification, and decision making by tracking the system identification results obtained from the measured data. Figure 4 shows the proposed framework that can automate system identification and visualization of SHM data in the BIM environment. First, a parametric 3D model of the structure is developed in Autodesk REVIT. Since the virtual sensors are not predefined elements in the REVIT library, these are manually created using a new REVIT family and IFC attributes. On the other hand, physical sensors, which are connected to a DAQ system, record the SHM data for structural condition assessment. Therefore, accelerometers are used to collect the SHM data, and virtual sensors are created in the BIM environment using IFC (as shown in Figure 3) to mimic the physical sensors on site. Data file from each physical sensor is associated with the respective virtual sensor in REVIT. System identification is performed using the TVF-EMD algorithm, which is integrated with REVIT through an online MATLAB portal linked via the “Properties” box of the virtual sensor in the BIM model. Owing to its capability of analyzing a single sensor data associated with a virtual sensor, the TVF-EMD is adopted to undertake system identification from single-channel data. It is automated and can be implemented in real-time for condition assessment of structures within the BIM platform. A case study is presented next to demonstrate the implementation of the developed framework.
Case Study
The proposed framework is validated using a 300 feet pony-truss bridge in London, Ontario, shown in Figure 5A. This section demonstrates the application of the proposed visualization tool developed in this study. Bridge vibrations were monitored while different numbers of vehicles traveled over the bridge. A virtual model for the bridge was developed in REVIT and sensor data was integrated with the virtual sensors. System identification results from the SHM data were shown in a user-friendly format integrated with the visualization platform of REVIT.
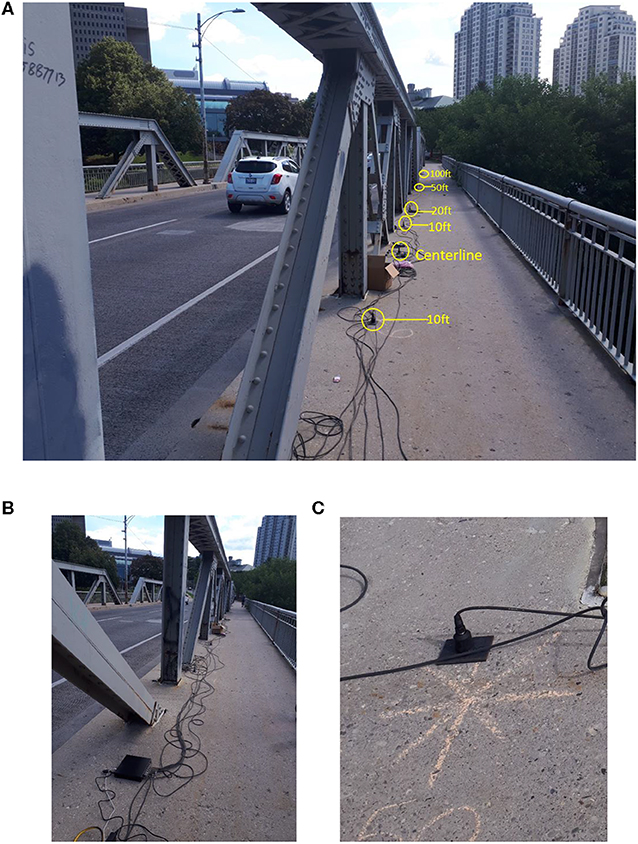
Figure 5. (A) Sensor instrumentation of steel bridge in London, Ontario, (B) data acquisition system, and (C) sensor.
BIM Model
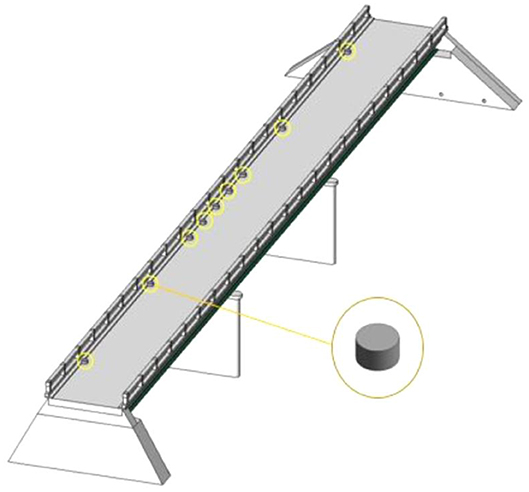
For the framework presented in this study, a structural model is developed that closely represents the real bridge. The data attributes define the physical, geometrical and abstract properties of the structure. REVIT is used as a BIM tool to visualize the bridge virtually. With the help of 2D drawings provided by the City engineers, a virtual model of the bridge is developed into a 3D model with the generic parameters and properties using REVIT shown in Figure 6.
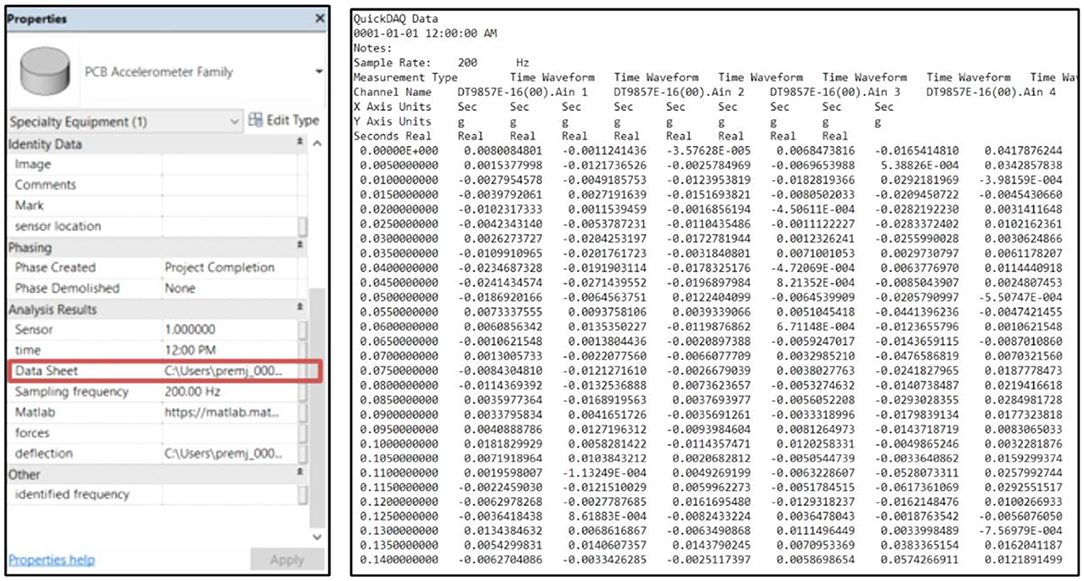
This model is used to define the real-time dynamic behavior of the bridge that can be used for visualization of long-term monitored SHM data. Sensors feed the vibration data to DAQ, which was connected to a computer. The raw data file generated by the DAQ system was used to perform system identification and served as a link to connect the BIM model with the MATLAB online portal. Virtual sensors that were not pre-defined in Autodesk REVIT were manually created in the BIM model. A new REVIT family was used to create the accelerometer sensor virtually and IFC exchange format was used to define the virtual sensor attributes shown in Figures 2, 3, respectively. Figure 6 shows the virtual sensors placed in the virtual BIM model of the bridge. Properties related to sensors used for this particular study were defined in REVIT shown in Figure 7. Upon selecting a particular virtual sensor in the bridge, its properties box shows all the data associated with that specific sensor, including sampling frequency, raw datasheet location, sensor serial and location, MATLAB link for system identification, etc.
Instrumentation
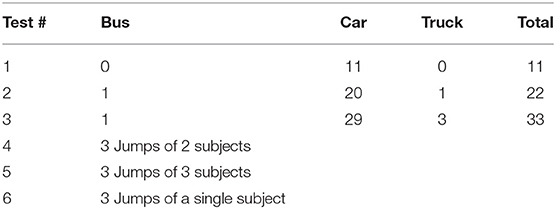
The bridge was instrumented with accelerometers to evaluate its modal parameters and analyze and predict the structural health of the bridge. Nine high-sensitive sensors were placed along the walkway of the bridge, and the sensors were set up to measure uniaxial vertical vibration. The sensors used for the testing had a sensitivity of 10 V/g. A sampling frequency of 200 Hz was used. Sensors were placed at a distance of 10, 20, 50, and 100 feet on both sides from the centerline of the bridge shown in Figure 5A. The data collection was performed through the DAQ system by connecting it with sensors using BNC cables and a laptop using a USB cable shown in Figures 5B,C. Test details regarding the number and class of vehicles during each test run are tabulated in Table 1. The duration of each test was between 30 s to 5 min. Tests 4, 5, and 6 include the free vibration response recorded during jumping of a single subject near the center of the bridge.
Implementation of Proposed Visualization Tool
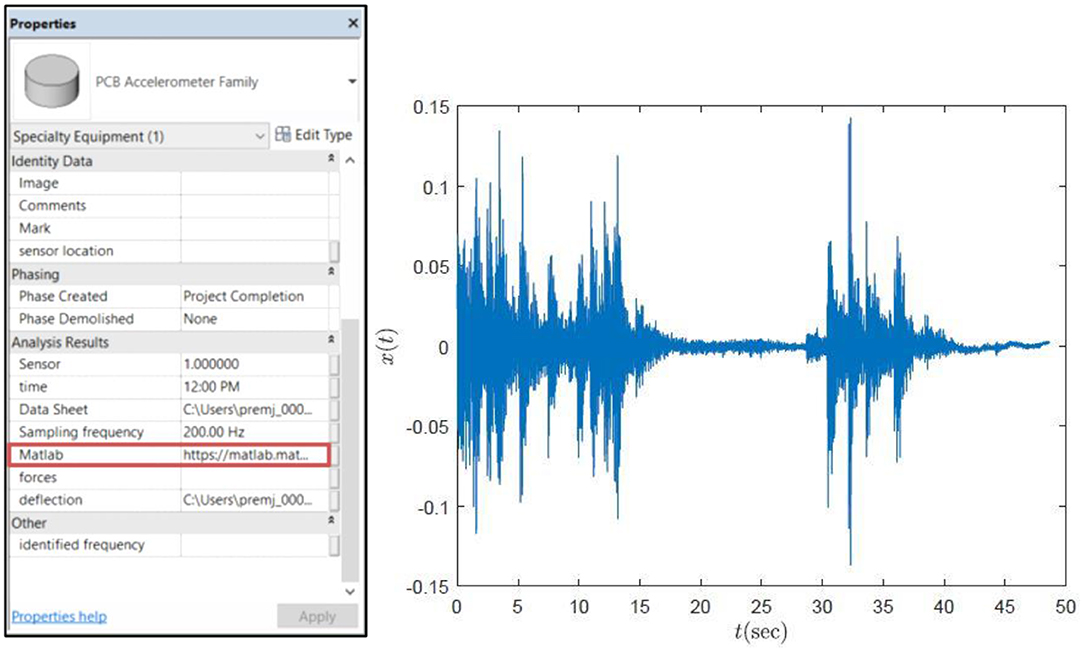
The data collected from the building and MATLAB scripts (MathWorks, 2018) were linked with the virtual sensors that were modeled in REVIT shown in Figures 2, 7. By selecting a sensor, its related properties are shown in the properties box, including serial number, date, time, sensor location, sampling frequency, datasheet link, MATLAB link, etc. The properties box for a highlighted sensor is shown in Figure 8. After clicking on the MATLAB link for a particular sensor, the user is taken to the MATLAB online portal, which performs the system identification using the datasheet assigned to the specific sensor. The DAQ file, containing the raw and unprocessed data collected by the sensors, is saved as a text file and is shown in Figure 8.
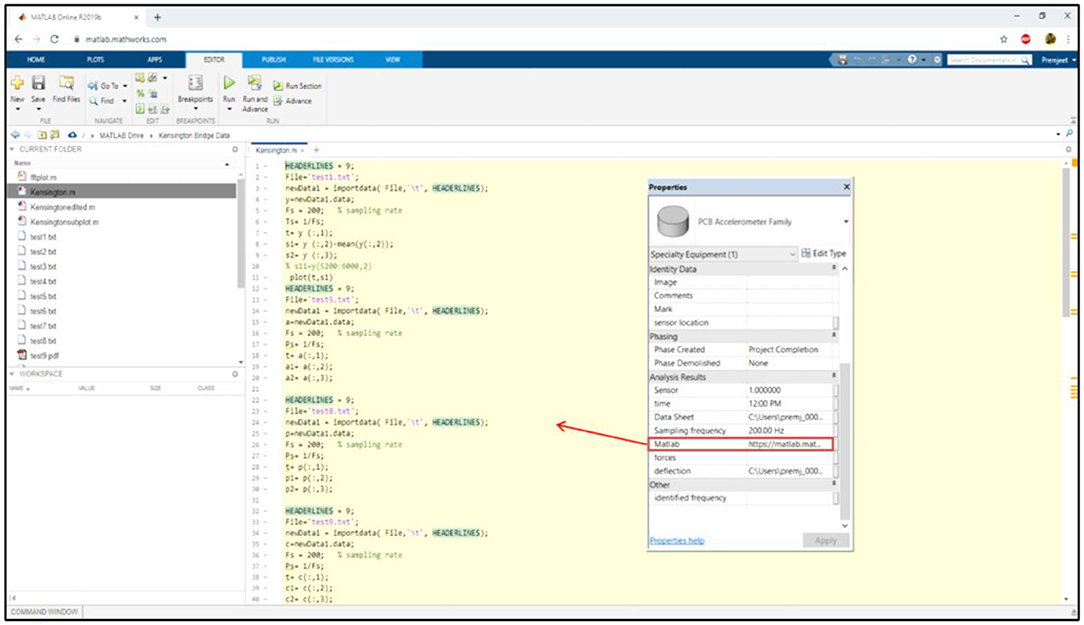
This file is linked with the virtual sensor of the BIM model of the bridge and can be accessed by clicking on the datasheet link on the properties box of the virtual sensor. This text file is also uploaded on the MATLAB online compiler along with the scripts of the TVF-EMD method. By clicking on a sensor in the BIM model, the respective sensor gets highlighted, and a Property box shows up in the REVIT window, and all necessary sensor information is contained in this icon shown in Figure 8. By clicking on the datasheet link in the properties box, the user is taken to the raw data file linked to that particular sensor containing unprocessed data. By clicking the MATLAB link, highlighted in Figure 9, the user is taken to MATLAB online portal. In the portal, by executing the MATLAB scripts, system identification results can be generated using single-channel measurement through the TVF-EMD method.
The framework presented in this study is used to perform modal identification using a single sensor measurement. The time history of the physical response of the bridge is shown in Figure 10. The method used in this study successfully extracts the mono-component modal responses. The resulting IMFs (i.e., extracted modal responses) are separated by the TVF-EMD algorithm. The resulting mono-component responses and the identified structural frequencies are discussed below.
Free Vibration
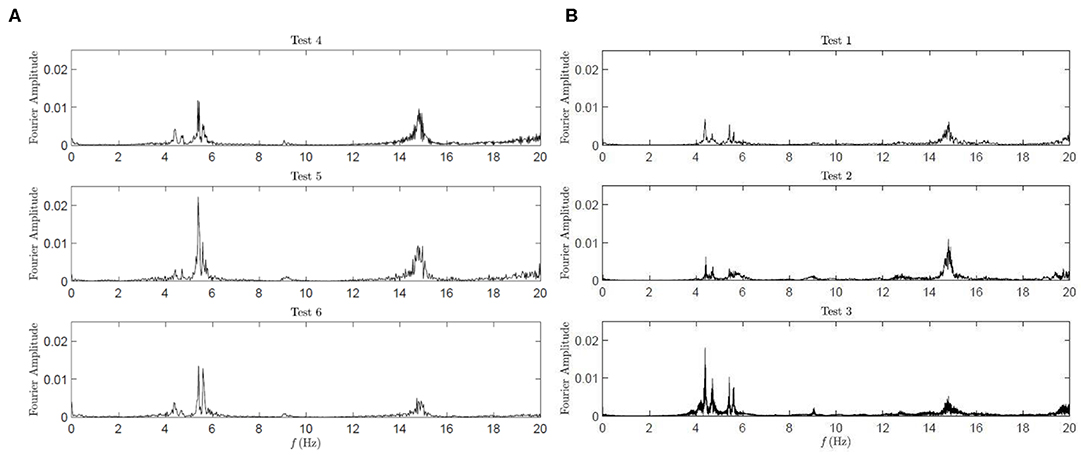
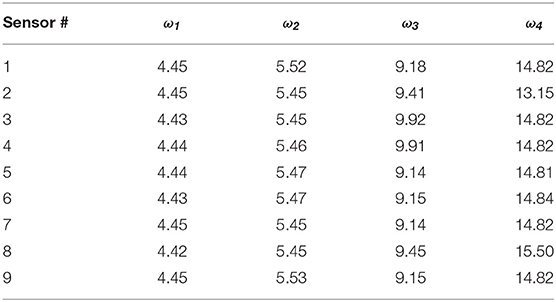
Free vibration tests were conducted to estimate the natural frequencies of the bridge. To achieve this, the bridge was excited by jumping of a subject at the center of the bridge. This test has another significance of mimicking the pedestrian activity (walking or running) on the bridge. As shown in Figure 11A and Table 2, around four Fourier peaks can be observed between 0 and 20 Hz, indicating four natural frequencies of the bridge in this range, which are consistent with traffic-induced vibration.
Traffic-Induced Vibration
Test runs are selected for analysis in such a way that represents live traffic conditions. All the test runs except 4, 5, and 6 include the structural response generated by passing vehicles over the bridge. Test 1, 2, and 3 are selected for further analysis as their vehicle count is 11, 22, and 31, respectively, which represent a wide range of vehicles passing over the bridge. Figure 11B shows the processed data from the first three tests, which cover most of the range of vehicle count. As seen in the figure, Fourier amplitudes have higher values with an increasing number of vehicles in the bridge.
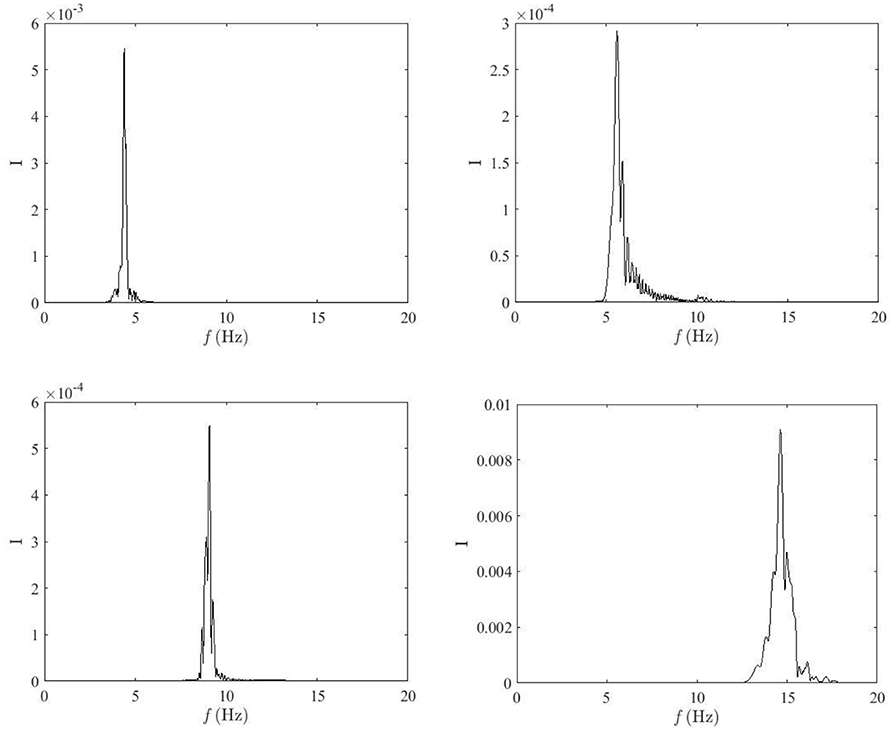
TVF-EMD is used to acquire the bridge frequencies from the single-channel measurement or vibration response generated by a bus driving over the bridge, and the results are shown in Figure 12. The resulting IMFs are separated by the TVF-EMD method. The mono-component responses and the identified structural frequencies are shown in Figure 12. Table 3 contains the modal frequencies obtained from different sensors generated using the proposed framework.
Conclusions
This study investigated the potential of BIM in data management and maintenance of infrastructure using a web-based workflow. The use of different data formats can be omitted since the process is web-based and features real-time integration of sensor data with the BIM model. The proposed framework enhances software interoperability and frequent communication, which are required on civil infrastructure projects. The extension of the BIM model from static to dynamic enables the real-time link between the data-driven SHM techniques and BIM software. The web-based approach can be utilized to identify the modal frequencies from the sensor data using TVF-EMD method used in this study. In this way, system identification is integrated within the BIM model which can be beneficial for better interpretation of SHM data. By linking the real sensory data with the virtual sensor, this study extends the BIM model from static to dynamic and provides an effective management and visualization tool for engineers and project owners at large by providing them with updated, monitored information.
In this paper, it is attempted to integrate system identification within the framework of BIM. The authors used a single-sensor based modal identification technique, which enabled visualization of the bridge frequencies at given sensor location for different periods of time. State-of-the-art SHM methods (Farrar and Worden, 2013) use modal (frequencies, damping and mode shapes) or physical (stiffness or mass) parameters as the condition indicators. In this study, the authors limited their focus only to the dynamic representation of frequency estimation. The inclusion of other parameters (such as mode shape) within the BIM model requires further advances and is reserved for future research.
The proposed tool will allow a bridge engineer to virtually monitor a bridge and visualize both raw data as well as system identification results of different periods in a systematic manner, which will save time and eliminate any source of human errors of manual inspection of large data. Unlike conventional SHM data management, the developed BIM model enables real-time digital representation of SHM information throughout the life-cycle of infrastructure, enhancing the quality and assessment of infrastructure. By linking a single-sensor based system identification within the BIM model, it is possible to diagnose the bridge frequencies using the data from different periods of time from a selected node. Future research is reserved to utilize Augmented or Virtual Reality, and automate the digital representation of SHM from multiple sensors simultaneously.
Data Availability Statement
The raw data supporting the conclusions of this article will be made available by the authors, without undue reservation, to any qualified researcher.
Author Contributions
All authors listed have made a substantial, direct and intellectual contribution to the work, and approved it for publication.
Funding
The proposed research was funded by the Natural Sciences and Engineering Research Council (NSERC) of Canada through the last author's Discovery Grant.
Conflict of Interest
The authors declare that the research was conducted in the absence of any commercial or financial relationships that could be construed as a potential conflict of interest.
Acknowledgments
We would like to thank the engineers of City of London, Jane Fullick, and Karl Grabowski, for their valuable collaboration and assistance during the data collection in the City bridge, and members of AS research team for their active participation in the bridge instrumentation.
References
Abe, M. (1998). “Structural monitoring of civil structures using vibration measurement: current practice and future,” in Artificial Intelligence in Structural Engineering. ed I. Smith (Berlin, Heidelberg:Springer), 1–18. doi: 10.1007/BFb0030439
Aktan, A. E., and Grimmelsman, K. A. (1999). “The role of nde in bridge health monitoring,” in Non-destructive Evaluation of Bridges and Event: Nondestructive Evaluation Techniques for Aging Infrastructures and Manufacturing (Newport Beach, CA, United States), 3587, 2–15. doi: 10.1117/12.339911
Alampalli, S., Alampalli, S., and Ettouney, M. (2016). “Big-data and high-performance analytics in structural health monitoring for bridge management in Proceedings of the SPIE Smart Structures /NDE Conference (Las Vegas, NV: Sensors and Smart Structures Technologies for Civil, Mechanical, and Aerospace Systems). doi: 10.1117/12.2219406
Almasri, N., Sadhu, A., and Chaudhuri, S. R. (2019). Towards compressed sensing of structural monitoring data using building information modeling. ASCE J. Comput. Civil Eng. 34:04019041. doi: 10.1061/(ASCE)CP.1943-5487.0000855
Arayici, Y., and Aouad, G. (2010). Building Information Modelling (BIM) For Construction Lifecycle Management. New York, USA: Construction and Building: Design, Materials and Construction, Nova Science Publishers. 1, 99–118.
Augenbroe, G. P., Wilde, D., Moon, H. J., and Malkawi, A. (2004). An interoperability workbench for design analysis integration. Energy Build. 36, 737–748. doi: 10.1016/j.enbuild.2004.01.049
Barbosh, M., Sadhu, A., and Vogrig, M. (2018). Multi sensor-based hybrid empirical mode decomposition method towards system identification of structures. Struct. Control Health Monitor. 25:e2147. doi: 10.1002/stc.2147
Boddupalli, C., Sadhu, A., Azar, E. A., and Pattyson, S. (2019). Improved visualization of infrastructure monitoring data using building information modeling. Struct. Infrastruct. Eng. 15, 1247–1263. doi: 10.1080/15732479.2019.1602150
Carden, E. P., and Fanning, P. (2004). Vibration based condition monitoring: a review. Struct. Health Monitor. 3, 355–377. doi: 10.1177/1475921704047500
Cawley, P. (2018). Structural health monitoring: closing the gap between research and industrial deployment. Struct. Health Monitor. 17, 1225–1244. doi: 10.1177/1475921717750047
Cemesova, A., Hopfe, C. J., and Mcleod, R. S. (2015). PassiveBIM: enhancing interoperability between BIM and low energy design software. Autom. Construct. 57, 17–32. doi: 10.1016/j.autcon.2015.04.014
Chen, J., Bulbul, T., Taylor, J., and Olgun, J. (2014). “A case study of embedding real-time infrastructure sensor data to BIM,” in Construction Research Congress 2014 (Atlanta, GA: ASCE), 1, 269–278. doi: 10.1061/9780784413517.028
Chen, J. G., Davis, A., Wadhwa, N., Durand, F., Freeman, W. T., and Büyüköztürk, O. (2016). Video camera–based vibration measurement for civil infrastructure applications. J. Infrastruct. Syst. 23:B4016013. doi: 10.1061/(ASCE)IS.1943-555X.0000348
Cremona, C., and Santos, J. P. (2018). Structural health monitoring as a big-data problem. Struct. Eng. Int. 28, 243–254. doi: 10.1080/10168664.2018.1461536
Delgado, J. M. D., Butler, L. J., Brilakis, I., Elshafie, M. Z., and Middleton, C. R. (2018). Structural performance monitoring using A dynamic data-driven BIM environment. J. Comput. Civil Eng. 32. doi: 10.1061/(ASCE)CP.1943-5487.0000749
Delgado, J. M. D., Butler, L. J., Gibbons, N., Brilakis, I., Elshafie, M. Z. E. B., and Middleton, C. (2017). Management of structural monitoring data of bridges using BIM. Inst. Civil Eng. Bridge Eng. 170, 204–218. doi: 10.1680/jbren.16.00013
Dessi, D., and Camerlengo, G. (2015). Damage identification techniques via modal curvature analysis: overview and comparison. Mech. Syst. Signal Process. 52-53, 181–205. doi: 10.1016/j.ymssp.2014.05.031
Durager, C., Heinzelmann, A., and Riederer, D. (2013). A wireless sensor system for structural health monitoring with guided ultrasonic waves and piezoelectric transducers. Struct. Infrastruct. Eng. 9, 1177–1186. doi: 10.1080/15732479.2012.671833
Ellenberg, A., Branco, L., Krick, A., Bartoli, I., and Kontos, A. (2014). Use of unmanned aerial vehicle for quantitative infrastructure evaluation. J. Infrastruct. Syst. 21:04014054. doi: 10.1061/(ASCE)IS.1943-555X.0000246
Farrar, C. R., and Worden, K. (2013). Structural Health Monitoring: A Machine Learning Perspective. West Sussex: Wiley. doi: 10.1002/9781118443118
Grilo, A., and Jardim-Goncalves, R. (2010). Value proposition on interoperability of BIM and collaborative working environments. Autom. Construct. 19, 522–530. doi: 10.1016/j.autcon.2009.11.003
Grosso, A. D., Basso, P., Ruffini, L., Figini, F., and Cademartori, M. (2017). “Infrastructure management integrating SHM and BIM procedures,” in 4th Conference on Smart Monitoring, Assessment and Rehabilitation of Civil Structures (Zurich), 13.
Huston, D., Burns, D., and Razinger, J. (2016). “Structural health monitoring and maintenance aided by building information modelling and repair information tools,” in 11th International Conference on Urban Regeneration and Sustainability (Alicante), 12, 897–907. doi: 10.2495/SC160731
Ivson, P., Moreira, A., Queiroz, F., Santos, W., and Celes, W. (2019). “A systematic review of visualization in building information modeling,” in IEEE Transactions on Visualization and Computer Graphics, 1–20. doi: 10.1109/TVCG.2019.2907583
Karan, E. P., and Irizarry, J. (2015). Extending BIM interoperability to preconstruction operations using geospatial analyses and semantic web services. Autom. Construct. 53, 1–12. doi: 10.1016/j.autcon.2015.02.012
Lazhari, M., and Sadhu, A. (2019). Decentralized modal identification of structures using an adaptive empirical mode decomposition. J. Sound Vibrat. 447, 20–41. doi: 10.1016/j.jsv.2019.01.049
Li, H., Li, Z., and Mo, W. (2017). A time varying filter approach for empirical mode decomposition. Signal Process. 138, 146–158. doi: 10.1016/j.sigpro.2017.03.019
Liu, W., Guo, H., Li, H., and Li, Y. (2014). Using BIM to improve the design and construction of bridge projects: a case study of a long span steel-box arc bridge project. Int. J. Adv. Robot. Syst. 11:1. doi: 10.5772/58442
Mao, Q., Mazzotti, M., DeVitis, J., Braley, J., Young, C., Sjoblom, K., et al. (2019). Structural condition assessment of a bridge pier: a case study using experimental modal analysis and finite element model updating. Struct. Control Health Monitor. 26:e2273. doi: 10.1002/stc.2273
Marzouk, M. M., and Hisham, M. (2011). “Bridge information modeling in sustainable bridge management,” in International Conference on Sustainable Design and Construction (ICSDC) 2011 (Kansas City, Missouri) doi: 10.1061/41204(426)57
MathWorks (2018). Signal Processing Toolbox: User's Guide (R2018b). Available online at: https://www.mathworks.com/help/pdf_doc/signal/signal_tb.pdf. (accessed January 4, 2019).
Miao, Y., Sadhu, A., and Liu, K. (2018). Condition assessment of structures with tuned mass damper using empirical wavelet transform. J. Vibrat. Control 24, 4850–4867. doi: 10.1177/1077546317736433
Mirza, S., and Shafqat Ali, M. (2017). Infrastructure crisis — a proposed national infrastructure policy for Canada. Can. J. Civil Eng. 44, 539–548. doi: 10.1139/cjce-2016-0468
Na, W. S., and Baek, J. (2017). Impedance-based non-destructive testing method combined with unmanned aerial vehicle for structural health monitoring of civil infrastructures. Appl. Sci. 7:15. doi: 10.3390/app7010015
Newhook, J. P., and Edalatmanesh, R. (2013). Integrating reliability and structural health monitoring in the fatigue assessment of concrete bridge decks. Struct. Infrast. Eng. 9, 619–633. doi: 10.1080/15732479.2011.601745
Okasha, N. D., and Frangopol, D. M. (2012). Integration of structural health monitoring in a system performance based life-cycle bridge management framework. Struct. Infrastruct. Eng. 8, 999–1016. doi: 10.1080/15732479.2010.485726
Pappalardo, C. M., and Guida, D. (2018). System identification and experimental modal analysis of a frame structure. Eng. Lett. 26, 56–68.
Perez-ramirez, C. A., Amezquita-Sanchez, J. P., Adeli, H., Valtierra-rodriguez, M., Romero-Troncoso, R. D. J., Dominguez-Gonzalez, A., et al. (2016). Time-frequency techniques for modal parameters identification of civil structures from acquired dynamic signals. J. Vibroeng. 18, 3164–3185. doi: 10.21595/jve.2016.17220
Ren, X., Fan, W., Li, J., and Chen, J. (2019). Building information model-based finite element analysis of high-rise building community subjected to extreme earthquakes. Adv. Struct. Eng. 22, 971–981. doi: 10.1177/1369433218780484
Rio, J., Ferreira, B., and Pocas-Martins, J. (2013). Expansion of IFC model with structural sensors. Informes de la Construccion Portugal 530, 219–228. doi: 10.3989/ic.12.043
Sadhu, A. (2017). An integrated multivariate empirical mode decomposition method towards modal identification of structures. J. Vibrat. Control 23, 2727–2741. doi: 10.1177/1077546315621207
Sadhu, A., Narasimhan, S., and Antoni, J. (2017). A review of output-only structural mode identification literature employing blind source separation method. Mech. Syst. Signal Process. 94, 415–431. doi: 10.1016/j.ymssp.2017.03.001
Sankarasrinivasan, S., Balasubramanian, E., Karthik, K., Chandrasekar, U., and Gupta, R. (2015). Health monitoring of civil structures with integrated UAV and image processing system. Proc. Comput. Sci. 54, 508–515. doi: 10.1016/j.procs.2015.06.058
Singh, P., and Sadhu, A. (2019). Multicomponent energy assessment of buildings using building information modeling. Sustain. Cities Soc. 49:101603. doi: 10.1016/j.scs.2019.101603
Somwanshi, S., and Gawalwad, B. (2016). Monitoring civil structures with a smart wireless sensor network. Int. J. Eng. Appl. Sci. 3, 34–39.
Sony, S., Laventure, S., and Sadhu, A. (2019). A literature review of next-generation smart sensing technology in structural health monitoring. Struct. Control Health Monitor. 26:e2321. doi: 10.1002/stc.2321
Theiler, M., Dragos, K., and Smarly, K. (2017). “BIM-based design of structural health monitoring systems,” in 11th International Workshop on Structural Health Monitoring (Stanford, CA). doi: 10.12783/shm2017/13941
Tomasi, R., Sottile, F., Pastrone, C., Mozumdar, M. M. R., Osello, A., and Lavagno, L. (2015). Leveraging BIM interoperability for UWB-based WSN planning. IEEE Sensors J. 15, 5988–5996. doi: 10.1109/JSEN.2015.2451736
Wu, R. T., and Jahanshahi, M. R. (2018). Data fusion approaches for structural health monitoring and system identification: past, present, and future. Struct. Health Monitor. 19:147592171879876. doi: 10.1177/1475921718798769
Keywords: structural health monitoring, building information modeling, visualization, long-term monitoring, system identification, Autodesk, TVF-EMD, bridge management systems
Citation: Singh P and Sadhu A (2020) System Identification-Enhanced Visualization Tool for Infrastructure Monitoring and Maintenance. Front. Built Environ. 6:76. doi: 10.3389/fbuil.2020.00076
Received: 04 December 2019; Accepted: 01 May 2020;
Published: 28 May 2020.
Edited by:
Eleni N. Chatzi, ETH Zürich, SwitzerlandReviewed by:
Saeed Eftekhar Azam, University of Nebraska System, United StatesYi-Qing Ni, Hong Kong Polytechnic University, Hong Kong
Copyright © 2020 Singh and Sadhu. This is an open-access article distributed under the terms of the Creative Commons Attribution License (CC BY). The use, distribution or reproduction in other forums is permitted, provided the original author(s) and the copyright owner(s) are credited and that the original publication in this journal is cited, in accordance with accepted academic practice. No use, distribution or reproduction is permitted which does not comply with these terms.
*Correspondence: Ayan Sadhu, YXNhZGh1QHV3by5jYQ==
 Premjeet Singh
 Ayan Sadhu
