 Fadi Alsaleem
 Mehari K. Tesfay
 Mostafa Rafaie1
- 1Durham School of Architectural and Construction Engineering, University of Nebraska-Lincoln, Lincoln, NE, United States
- 2DunAn Microstaq, Inc., Austin, TX, United States
Humans spend more than 90% of their day in buildings, where their health and productivity are demonstrably linked to thermal comfort. Building thermal comfort systems account for the largest share of U.S energy consumption. Despite this high-energy cost, due to building design complexity and the variety of building occupant needs, addressing thermal comfort in buildings remains a difficult problem. To overcome this challenge, this paper presents an Internet of Things (IoT) approach to efficiently model and control comfort in buildings. In the model phase, a method to access and exploit wearable device data to build a personal thermal comfort model has been presented. Various supervised machine-learning algorithms are evaluated to produce accurate personal thermal comfort models for each building occupant that exhibit superior performance compared to a general model for all occupants. The developed comfort models were used to simulate an intelligent comfort controller that uses the particle swarm optimization(PSO) method to search for optimal control parameter values to achieve maximum comfort. Finally, a framework for experimental validation of the new proposed comfort controller that interactively works with the HVAC element has been introduced.
Introduction
Nowadays, in developed countries, people spend more than 90% of their time in indoor spaces (Höppe and Martinac, 1998; Frontczak and Wargocki, 2011). Most of these indoors are conditioned with different types of HVAC systems that consume about 50% of primary energy in the building (Pérez-Lombard et al., 2008) to ensure occupant thermal satisfaction (Wagner et al., 2007) and health (Allen et al., 2015). While the impact of thermal satisfaction on productivity in workplaces is well-established (Leaman and Bordass, 1999; Salonen et al., 2016), there is a misconception that considers air temperature as an accurate indicator of thermal comfort, as opposed to including the variability in each individual's thermal responses. Thus, common practices in buildings are limited to setting universal temperature set points that may take seasonal changes into account but without including the human in the control loop. These practices simply may result in a violation of the recommendation of many health organizations such as the Health and Safety Executive (UK) for establishing the minimum requirement of a reasonable comfort environment [i.e., at least 80% of the indoor occupants are feeling comfortable (Contributors, 2016)].
The conventional comfort model is the Predicted Mean Vote model (PMV model) (Fanger, 1970). The PMV model, the most commonly used comfort model adapted into ASHRAE Standard 55-Thermal Environmental Conditions for Human Occupancy (ANSI/ASHRAE Standard 55-2013, 2013), is meant to estimate the average thermal sensation that a group of people would report when occupying a space. It correlates multiple environmental parameters (air temperature, air velocity, relative humidity, and radiant temperature) and personal parameters (metabolism and clothing) to different levels of comfort based on a rating between −3 and 3, where −3 means the body thermal sensation is very cold and 3 means the body thermal sensation is very hot. The PMV value can be directly calculated using a system of highly non-linear and iterative equations. One of the key challenges of the PMV model is that it cannot be applied to estimate the personal comfort level because it is built to estimate the statistical average thermal sensation of a large population of people. Moreover, our recent sensitivity analysis for the PMV model revealed that the PMV model thermal comfort prediction is very sensitive to its personal parameters (metabolism and clothing) (Hasan et al., 2016). Ironically, the PMV in real implementation uses the predefined constant values for its personal parameters with no feedback from occupants (Van Hoof, 2008; Auffenberg et al., 2015). All these limitations, led to significant error and high occupant's comfort dissatisfaction when adapting the PMV model to model and control comfort in buildings.
To address the PMV limitations, the study in Kim et al. (2018) reviewed the new developments in comfort modeling during the last 10 years and categorized the researches into two groups. The first group is a data-driven approach to model and predicts the thermal comfort of a general population (Chen et al., 2015; Dai et al., 2017) and the second group is using the synthetic data to model personal comfort (Ari et al., 2008; Zhang et al., 2018). For the model output, most studies used the 3-point thermal preferences (warmer/no change/cooler) or ASHRAE 7-point thermal sensation scale. Indoor air temperature, mean radiant temperature, and relative humidity along with individual information such as metabolism and rated skin temperature were used mostly as the model input in this study (Peng and Hsieh, 2017).
Recently, machine learning methods have been used extensively in modeling thermal comfort. For example, in Zhang et al. (2018) a deep neural network (DNN) was used to model and control thermal comfort. In Chaudhuri et al. (2017), a machine learning-based prediction model of thermal comfort in buildings of Singapore was performed in real-time. The model was trained using environmental and human factors such as the six Fanger's factors and newly proposed factors such as age, gender, and outdoor weather. While the proposed model requires many sensors data, it was shown to offer high computational speed compared to the PMV model. Kim et al. (2018), developed personal comfort models to predict individuals' thermal preference using six different machine learning algorithms. A median accuracy of 0.73 was archived for the best performing algorithm. A new work (Gao et al., 2019) proposed a deep reinforcement learning-based framework for controlling the comfort in buildings while minimizing the energy consumption of the HVAC systems. To achieve this goal, a deep neural network was used for predicting the occupants' thermal comfort, and a deep deterministic policy gradients (DDPG) approach was used for learning the thermal control policy.
A recent work (Jung et al., 2019) used machine learning to create a heat flux sensing model to infer personal thermal comfort under transient ambient conditions. Finally, an online learning approach was introduced in Ghahramani et al. (2015) for modeling personalized thermal comfort via stochastic modeling. In this model, a Bayesian network is used to create a personalized comfort model from multiple probability distribution comfort models.
Very few studies explored the use of wearable biometric data to enhance modeling comfort (Huang et al., 2015; Hasan et al., 2016; Rafaie et al., 2017). This reduces the need for having many building sensors to model comfort in buildings. For example, in our work (Hasan et al., 2016; Rafaie et al., 2017) we have shown the use of wearable device biometric data to augment the PMV comfort model with continuous feedback for the personal parameter data. The work of (Huang et al., 2015) built a single generalized/global comfort model (GM) from wearable devices sensing data and comfort votes for eleven human subjects. As the differences among people are poorly captured in a single model, the global model leads to high error in predicting individual comfort for these 11 human subjects. Thus, a much higher prediction error is expected when the population size of the occupant is very large, i.e., the case when the comfort management system is deployed in a large building, and when trying to predict comfort for new users that their data were not used in training the GM model.
From the aforementioned literature review, it is concluded that using machine learning methods for modeling thermal comfort is gaining great attention recently. However, most of these models were trained using many conventional building sensors data. In real life implementation, these sensors are assumed to be fully integrated. Thus, increasing the sensors installation complexity and cost. Wearable devices, however, offer an affordable alternative to provide most of the required data for training machine learning comfort models. However, their potential to accurately train personalized comfort models has not been fully explored in the literature. To fill this research gap, in this paper we develop a wearable-based personalized comfort model, which exploits machine learning schemes to infer and predict the comfort level of each person by fusing multi-dimensional sensing data including (1) minimum environment sensing data from static sensors deployed in the building, (2) the human biometric data from the wearable devices, and (3) the direct subjective feedback from the occupants.
The organization of the paper is as follows. In section The Thermal Comfort Framework, an overall thermal comfort framework is discussed in detail. In this section, the wearable, as well as indoor ambient sensory employed in this work, are presented. Moreover, the machine learning algorithms used for comfort modeling and intelligent control approaches are introduced and potential improvement in human thermal comfort is presented. In section Future and Ongoing Work, our ongoing and future experimental works on studying the impact of the new comfort controller on HVAC energy use are briefly presented. In section Conclusions, the conclusions of the paper are presented.
The Thermal Comfort Framework
The general setup of the comfort control framework is shown in Figure 1. The figure shows the framework three major components; (1) data collection through wearable devices and indoor ambient thermal condition sensors, (2) thermal comfort modeling module, and (3) intelligent control module. Next, we provide more details on each of these components.
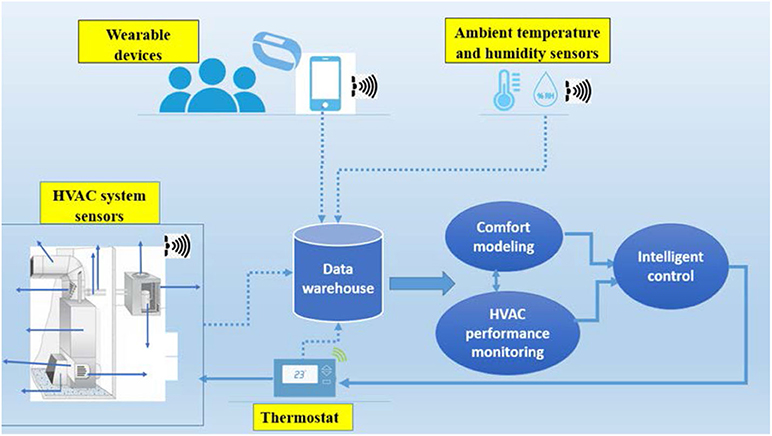
Figure 1. A schematic for the comfort control framework.
Data Collection Through Wearable Devices and Indoor Ambient Conditions Sensors
The second generation of the Microsoft smart band (Microsoft Band 2) was selected in this study for collecting occupants' biometric data. The band combines multiple features from a smart band, a smartwatch, and an activity tracker. Similar to the other smart-bands in the market, the band uses Bluetooth connection to pair with a phone and interact with the cloud service. Figure 2 shows a picture of the band including numbers referring to some sensors and features in the band. The band has 11 sensors, listed in Table 1, and has a microphone (numbered 6 in the figure) to speak with the Microsoft Personal Digital Assistant (Cortana). This feature helps to operate some voice commands like sending texts. Mobile applications were implemented to collect the Microsoft band biometric data and participant feedback. The collected data were pre-processed before the application of different machine learning classifiers as explained in the next section. In addition to the Microsoft Smart Band 2, Hobo Data Logger UX100 with wireless temperature and humidity sensors to be carried by users throughout the day to measure ambient thermal conditions.
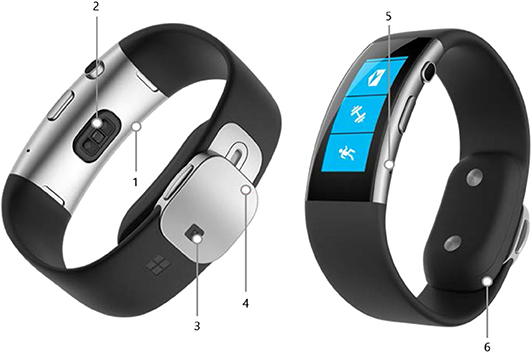
Figure 2. A picture for the Microsoft Band 2. In the Figure 1, refers to the Barometer, 2 to the Heart rate monitor, 3 to the UV sensor, 4 to the Charging port, 5 to the Microphone, and 6 to the Galvanic skin response (GSR) sensor.
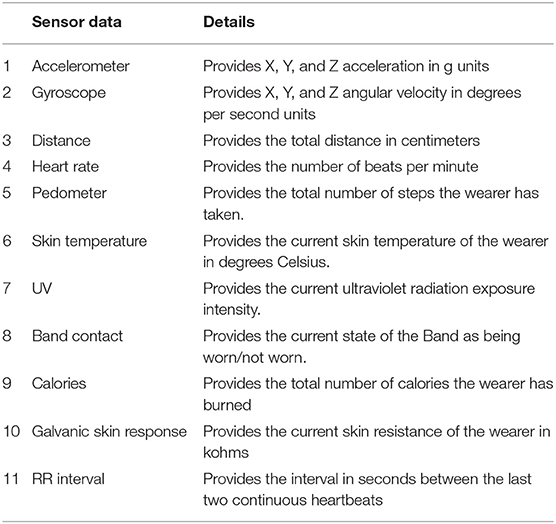
Table 1. List of data collected from the Microsoft Smart Band 2.
Figure 3 summarizes the data flow and mobile application architecture implemented for data collection. The mobile application is an Android application capable of connecting to the Microsoft Smart band 2 and receives the sensor data in a customized fashion as shown in Figure 4. The application was designed to allow the user to enter his clothing conditions (the clo value). A feedback of the thermal comfort of a user is received as a number (called comfort vote here). The user vote and their bio-information data are stored and labeled with an accurate date-time. A notification in the mobile application was another customizable functionality built to remind the user of entering his/her current thermal votes. The voting scale was initially chosen to be twice the PMV range from −6 to 6, with 6 being very hot, −6 being very cold, and 0 being comfortable. While this scale offers a large amount of variation, it was determined that people struggle to distinguish between minimal differences on this scale such as that between 5 and 6, introducing unnecessary human error. For this reason, an alternative scale was created as shown in Table 2. In this scale, the values from +/− 6 to +/−2 were classified as +/− 1 respectively, while values from−1 to 1 were classified as 0.
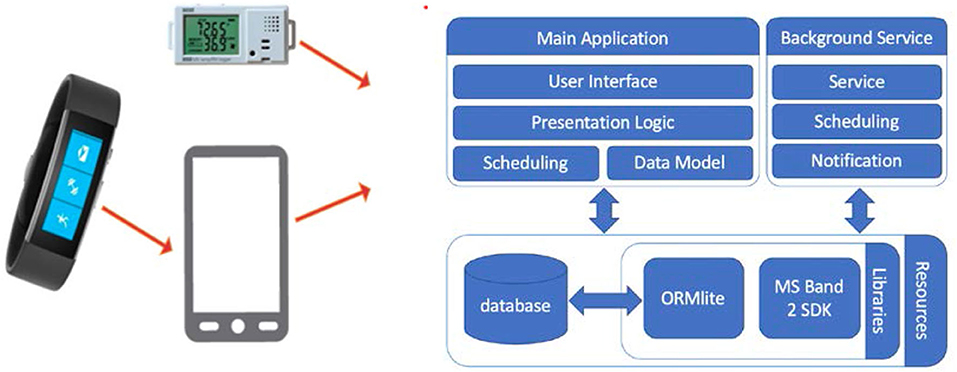
Figure 3. Mobile application architecture.
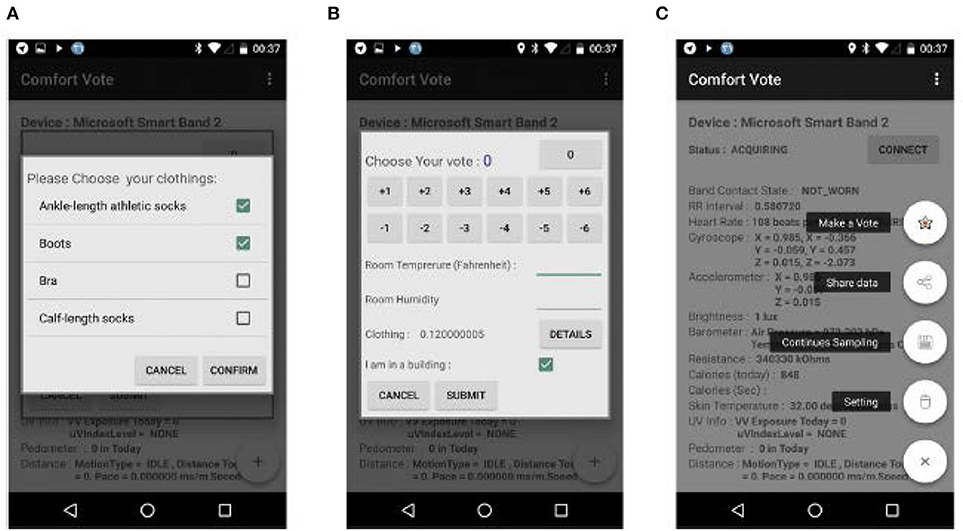
Figure 4. The Comfort Vote mobile application showing screenshots of (A) collecting the clothing information. (B) Displaying the voting page. (C) The available options in the application.
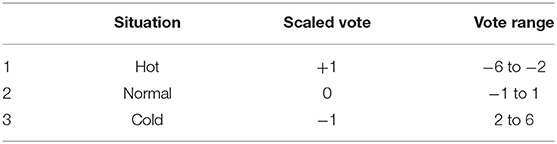
Table 2. Three group definition vote.
Comfort Modeling
The wearable-based personalized comfort model, designed to take into account the subjective nature of thermal comfort, initially takes both biometric (such as heart rate and skin temperature) and environmental sensing data (temperature and humidity) and the human direct vote/feedback and gradually create the mapping between the features (i.e., temperature, heart rate,.) and the predicted comfort level for each person. Then, the model can infer the comfort level of each person without asking for his subjective and direct comfort votes/feedbacks. A small experiment was conducted to provide some preliminary results for this comfort model. Three individuals, their descriptions described below (Table 3), were invited to take part in this study. These individuals were periodically prompted to vote for their thermal comfort throughout the day.
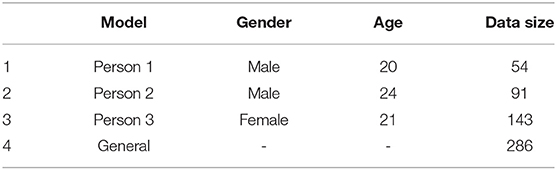
Table 3. Occupants data description.
For the completion of this task, five of the most prominent machine learning algorithms were applied to create three personalized models for each occupant and one general model for the combined data for the three occupants as described in Table 3. The used machine learning algorithms are decision tree (Freund and Schapire, 1995; Quinlan, 2006), adaptive boosting classifier (Mason et al., 2000), gradient boosting classifier (Vezhnevets and Barinova, 2007), random forest classifier (Ho, 1998), and support vector machines (Chang et al., 2010). Next, we briefly introduce these algorithms.
Decision Tree
The decision tree algorithm is a non-parametric supervised learning method and is one of the simplest and yet most successful forms of machine learning for classification and regression. It has the tree-like graph representation that can be trained as a classifier to decide from multiple possible choices. The depth of the tree is one of the main parameters that can be tuned to enhance learning performance.
Adaptive Boosting
Known as AdaBoost, is a learning method that is designed to select a collection, or ensemble, of hypotheses from the hypothesis space and combine their predictions. In our investigation, for one of the AdaBoost tuning parameters; the estimator count N, we varied its value from five to a thousand with the step of five.
Gradient Boosting Classifier
The Gradient Boosting Classifier is another ensemble learning technique used for classification and regression. This classifier is known as a robust method to avoid overfitting. While it is found that for this method that higher estimator counts generate better performance in this study, we employed the same estimator counts used for AdaBoost.
Random Forest Classifier
Random Forest classifier is based on utilizing the aggregation of decision trees built from various sub-samples of the datasets and their averages to improve the predictive accuracy Similar to the previous classifiers, it was employed while varying the estimator count to achieve better accuracy.
Support Vector Machines
Known as SVM, is the most popular approach for “off-the-shelf” supervised learning. Besides the linear classification approach, it adopts the kernel approach to perform non-linear classification. Linear, Poly, Radial basis function (RBF), Sigmoid, and Precomputed are the main kernels. In this work, we have utilized the RBF. SVM with the RBF kernel can be tuned with a variable called C. In this investigation, we varied the C parameter with values from 0.1 to 35. The advantages and limitations of the five algorithms are summarized in Table 4.
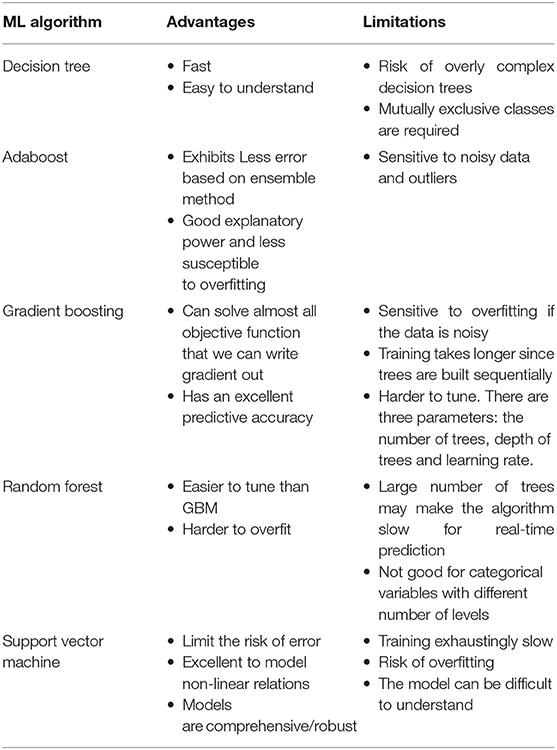
Table 4. The advantages and limitations of the five selected machine learning algorithms.
The scikit-learn package (Pedregosa et al., 2011) has been used to simulate the above machine learning methods. The scikit-learn is a Python-based program, built on top of SciPy and distributed under the 3-Clause BSD license. The Holland Super Computing Center at the State University of Nebraska was used to carry out the heavy calculation needed in this investigation. To evaluate the accuracy of the five machine learning algorithms, a cross-validation method has been used (random parts of the data used for learning and evaluation). Each of these algorithms was applied to 45 feature groups (lists) as shown in Table 5. These groups consisted of different combinations of the predictors (variables). When creating these groups, it was required that all groups have a minimum of one piece of external data (temperature and relative humidity), and one piece of wearable data (such as heart rate, metabolism, and skin temperature). The significance of creating these groups was to allow individual variables to be separated from one another and for their individual effects to be studied.
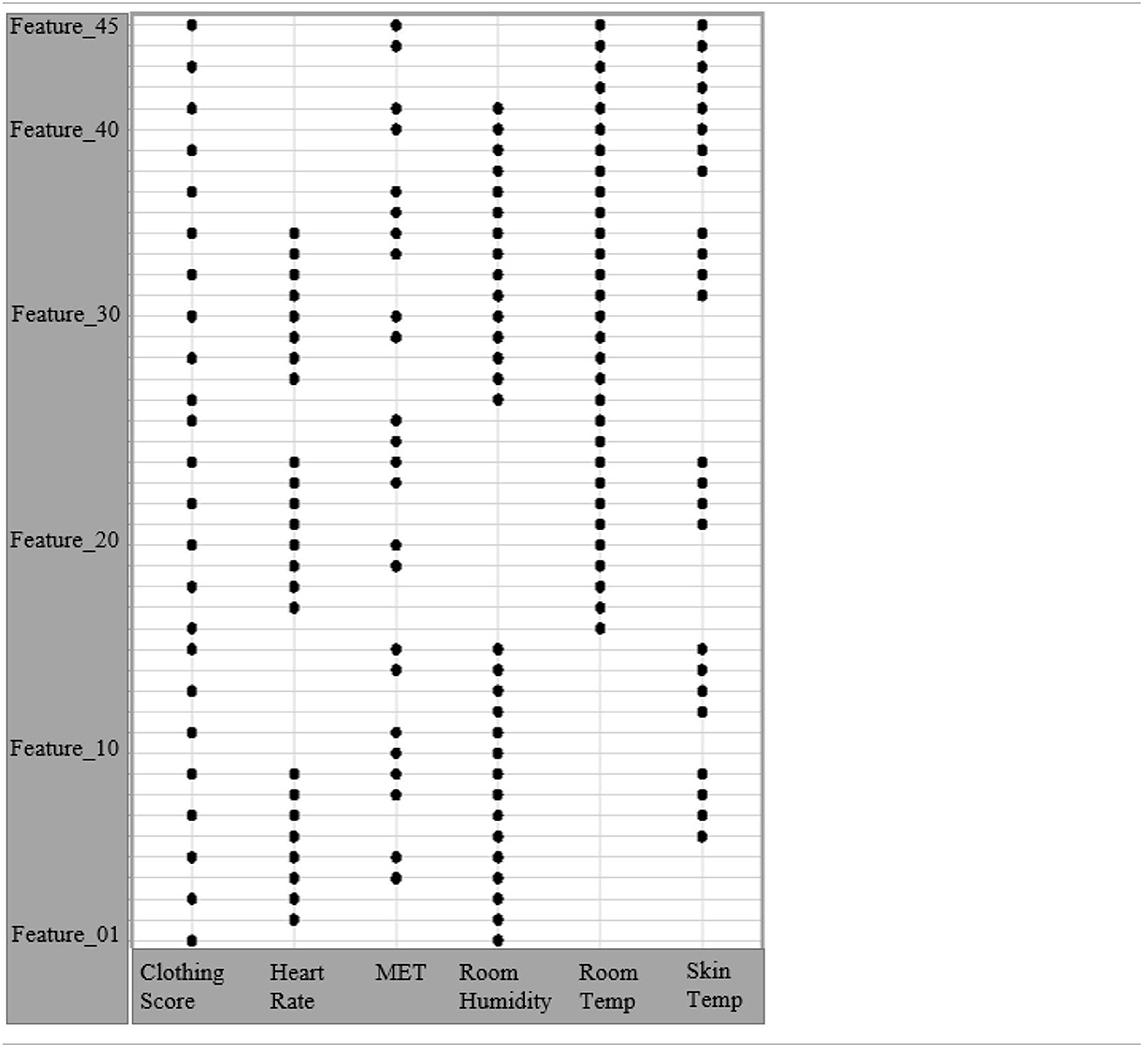
Table 5. The definition of feature list based on different sensor types.
Table 6 shows the top 15 feature lists with the highest median accuracy and Table 7 shows different machine learning methods accuracy when the best features list are considered. Table 6 shows that 12 of the 15 most accurate feature lists include room temperature, 8 include metabolism, and 9 include skin temperature. Meanwhile, only one feature list includes CLO. Therefore, it seems likely that using room and skin temperatures and metabolism to predict thermal comfort will give a relatively accurate thermal comfort prediction while using the clothing insulation will result in a less accurate prediction. As we believe clothing is an important factor in human comfort, one can argue that skin temperature might have better representation for that factor compared to the individual's self-reporting of their clothing status. The result of the heart rate is less conclusive. While 10 of the 15 most accurate feature lists include the heart rate; this variable is not seen in any of the top 3 most accurate feature lists. While less conclusive, it seems using the heart rate is relatively accurate at predicting thermal comfort. Finally, Table 7 shows that SVC is the most accurate machine learning method.
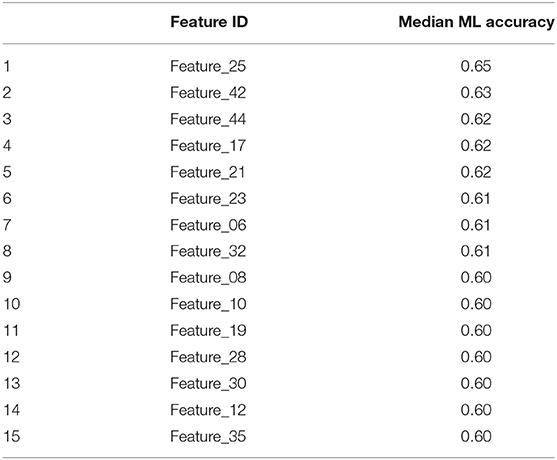
Table 6. Feature lists with the highest median accuracy considering all other variations (e.g., machine model type).
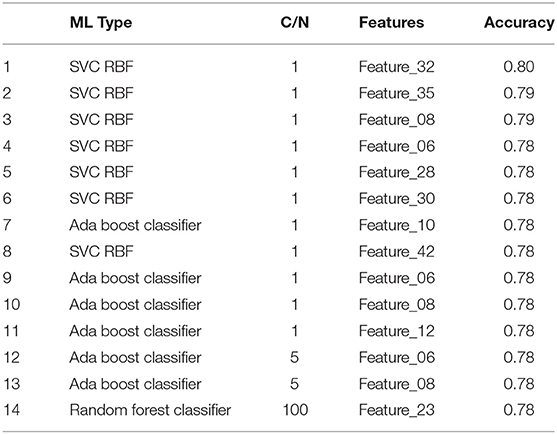
Table 7. Median of a specific ML accuracy for the best feature list, where C/N refers to a tuning parameter in the machine learning.
As mentioned above, our initial analysis revealed that, as one would intuitively predict, indoor temperature and skin temperature have been found as the most salient features that capture the thermal comfort level of occupants. However, while the above results were generated using one general model that lumped all the three users' data in one model, it is worth to compare these results with results obtained from machine learning models for each user (personalized model). Moreover, while doing this work, it has been observed that the galvanic skin resistance (GSR) also referred to as skin conductance, which usually is ignored in comfort modeling, plays a vital role in improving the accuracy of thermal comfort modeling. To shed more light on these observations, next we investigate the performance of personalizing the machine learning algorithms as well as the relevance of GSR in determining an accurate comfort model.
Figures 5–9 compare the performance of the generalized comfort model with the personalized comfort model for each occupant for each of the five machine learning methods while varying a model parameter in the machine learning method with and without GSR. The figures show, in almost all cases, the models that were built by considering skin conductance are more accurate. In the same fashion, it is evident that the private models appear to be more representative of the comfort level of an individual compared to the general models. Another interesting finding from Figures 5–9 is they confirm the fact that thermal comfort is a highly subjective matter that is may attribute to other factors. Three people sitting in similar room conditions exhibit different responsiveness characteristics as evidently seen in the differences in the accuracy level of the study subjects. Specifically, the same machine-learning algorithm generates different performance levels for each individual, which is mainly due to the reason that comfort depends on many physiological and biological factors.
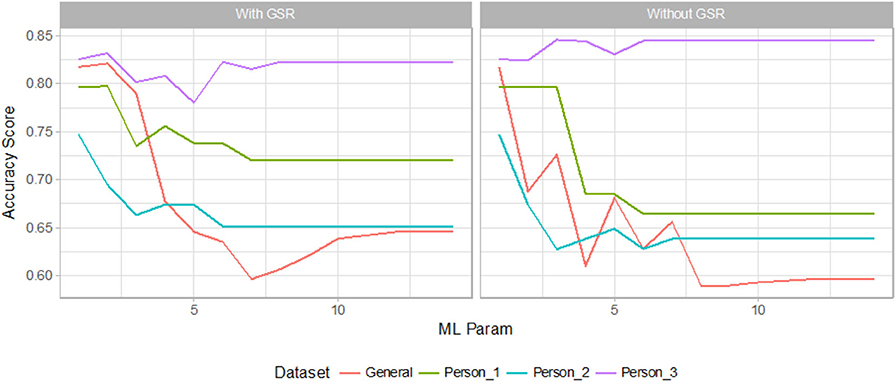
Figure 5. Decision tree performance.
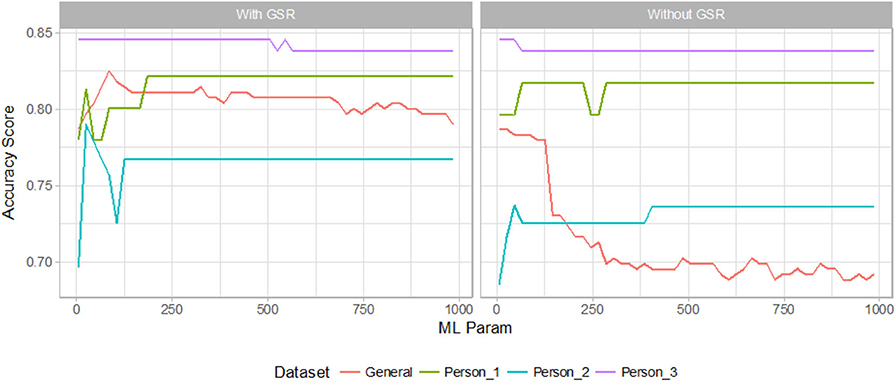
Figure 6. AdaBoost classifier performance.
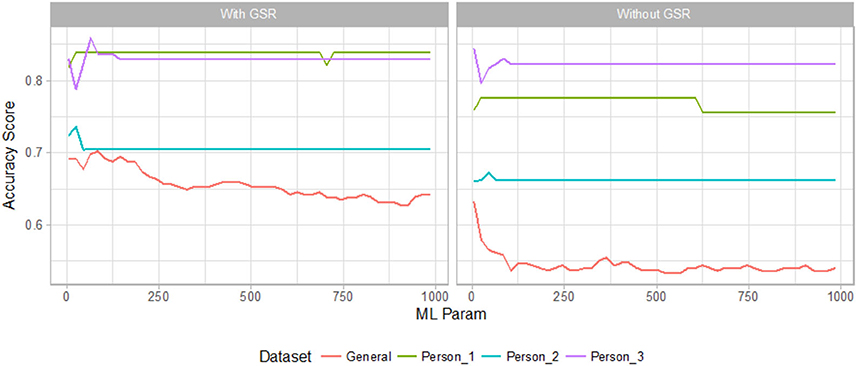
Figure 7. Gradient boosting classifier performance.
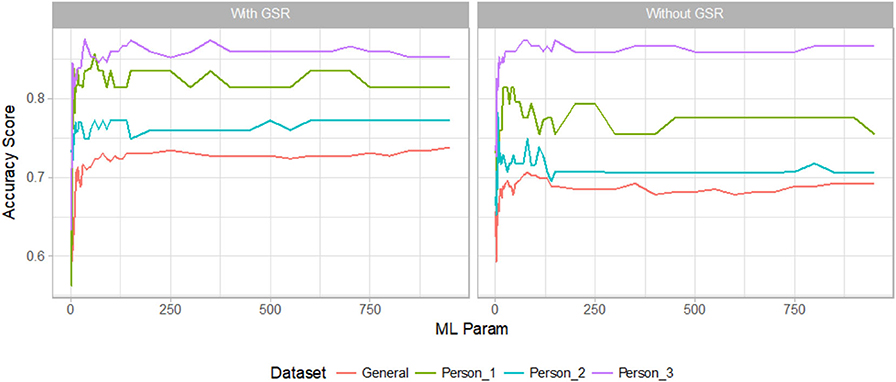
Figure 8. Random forest classifier performance.
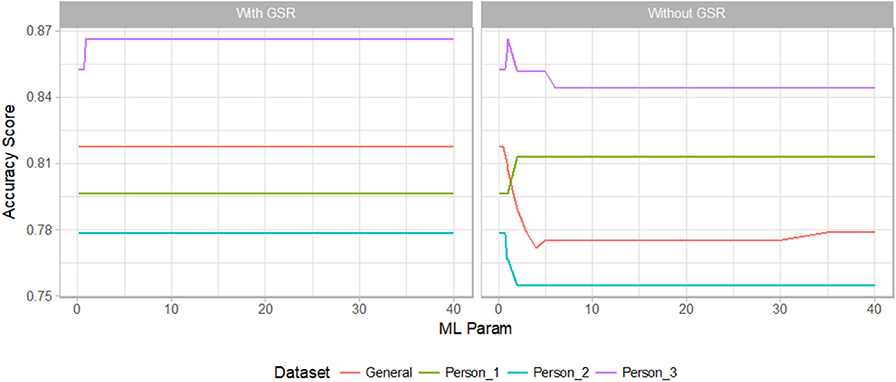
Figure 9. Support vector machine with RBF kernel performance.
Table 8 summarized our findings in Figures 5–9. The table presents a comprehensive performance measure of the five best performing machine learning algorithms used on the data from the three subjects. Except for a few exceptions where data collected from an individual is limited, the private models outperform the general model that was trained with no regard to the identity of the person reporting the comfort feedback data. The private comfort models for Person 3, with the biggest reported data size, are shown to have better accuracy levels than the other individuals on all machine learning techniques applied.
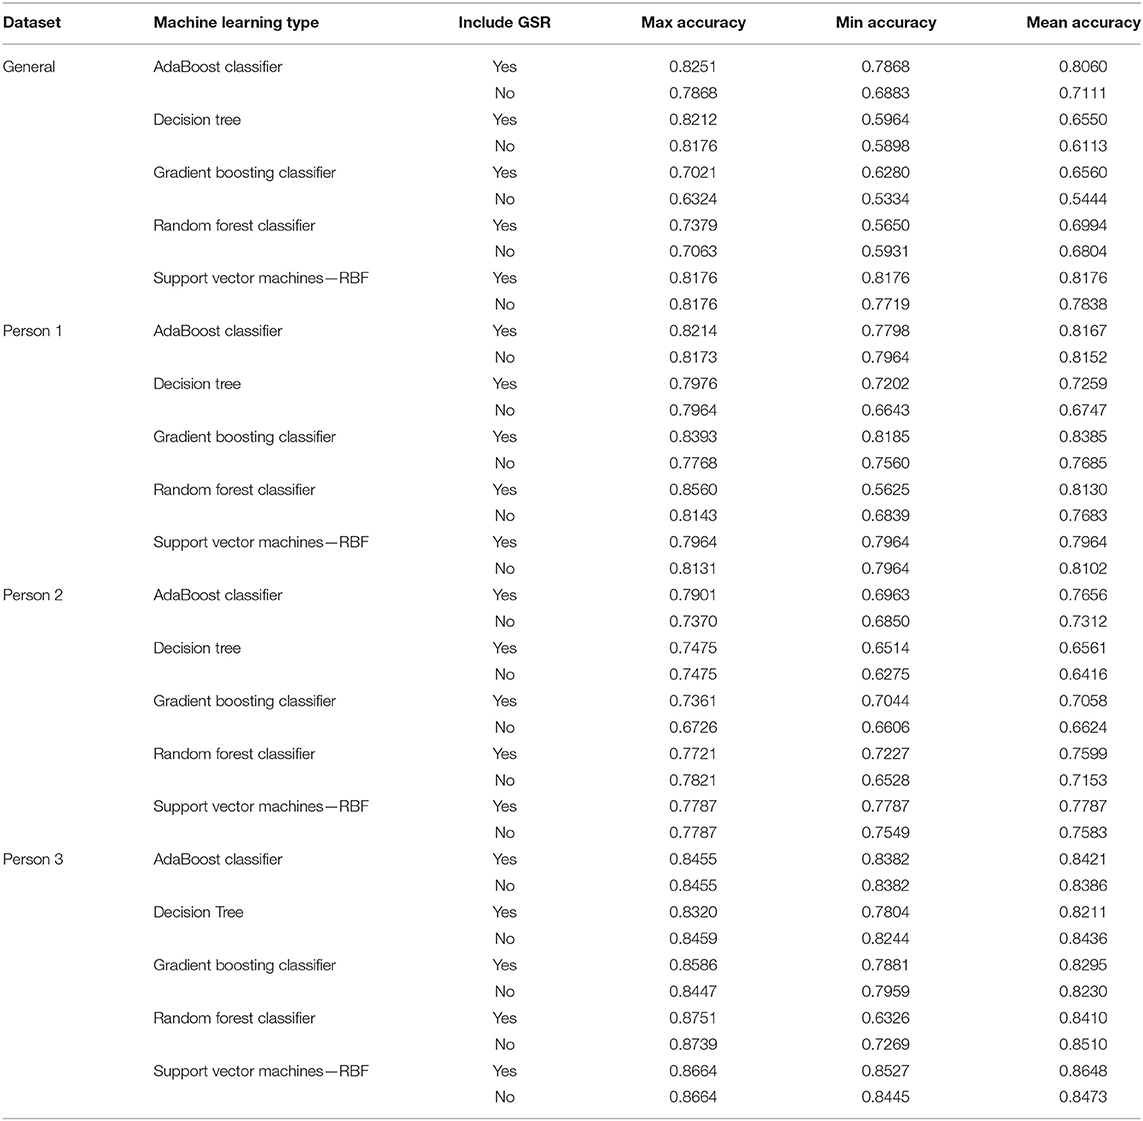
Table 8. Details of the performance review of machine learning for all the datasets.
In conclusion, our findings presented in the tables and figures in this section can be summarized as follows:
• The accuracy of the personalized models are in most cases higher than the general model.
• Including the GSR sensor data in most of the cases improves both the personalized and general models accuracy.
• The random forest classifier exhibits a one time best accuracy of about 88% compared to other machine learning. Overall, SVM-RBF outperforms the others in mean accuracy.
Intelligent Thermal Comfort Control
An accurate individual comfort model is the first necessity for providing thermal comfort in a building. The next challenge is determining how information from this model can be integrated with the building HVAC system controller (e.g., building thermostat). Typically, the thermal conditions are set to a temperature set-point, that a typical building occupant tends to change dramatically in response to temporary cold or hot situations; resulting in more discomfort and high energy cost. Ideally, the control parameter set-point should be automatically selected to satisfy occupant comfort, and it should address the conflicting comfort preferences of different people in one conditioned space. To achieve these, we show next how to integrate our new comfort models with the building's HVAC controls by inferring an adaptive set-point from occupants' comfort information. In particular, the comfort level of each occupant in a building is to be calculated from his learned comfort model. Then, the particle swarm optimization technique (PSO) will search for the optimal control parameters set-points to resolve any comfort conflicts by solving the comfort model inverse problem. The PSO; developed through attempts to model bird flocks, treats each moving particle as a potential solution and records its current and the group's best positions over iterations. The velocity of each particle in the swarm can be updated by:
where the ith particle position is then updated by:
where i is the particle index, k is a discrete-time index, v is the velocity of ith particle, x is position of ith particle, p is the best position found by ith particle (personal best), G is the best position found by swarm (global best), γ1, 2 is a random number on the interval [0,1] applied to ith particle. Inertial and acceleration weights could also be included to improve the algorithm convergence. The PSO supports multiple-dimension optimization. Hence, the comfort model can be simultaneously searched for a set of control parameters (such as ambient temperature, humidity level, and air velocity) to achieve a certain comfort level for the building occupants. Preliminary simulations were performed to evaluate the use of the PSO method to search for optimal control parameter values to achieve maximum comfort. For example, Figure 10A shows the use of PSO to find the optimal temperature (input 1) and humidity (input 2) to move a user comfort level from −3 (very cold) to 0. The initial temperature and humidity values were 15°C and 70% and the suggested set-points by the PSO are 20°C and 67%. The simulation was obtained assuming a metabolism value of 1.1 MET. Figure 10B shows an example of expanding PSO use to negotiate comfort differences among multiple users sharing the same conditioned space. To simulate personal comfort difference, a metabolism value of 2.0 MET was assumed for another user. Figure 10B shows that an ambient temperature of 20°C and a humidity ratio of 46% are the suggested set-points to make both users comfortable.

Figure 10. Simulation example for the PSO to search for the best comfort control parameters for: (A) one user, (B) two users. Blue circles represent the particles, green circles are the local best particles, and the red circle is the best global particle.
With respect to comfort control, Table 9 (second column) summarizes some of our preliminary results for the comfort improvement for the three different human subjects. In this 24 h test, we have used the wearable-based comfort model to select the right thermostat set-point compared to using an average thermostat set-point. Table 9 (third column) shows comfort improvement while negotiating their comfort preferences when all are to present at the same conditioned place. While comfort improvement in Table 9 is less than in Table 8, the multi-occupant case demonstrates a more practical use of the algorithm as most homes will have more than one occupant with conflicting needs.
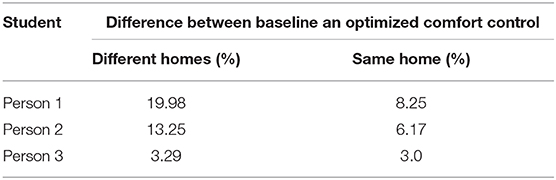
Table 9. Comfort improvement using the proposed comfort control compared to baseline.
Future and Ongoing Work
Wearable device sensor accuracy, our new comfort app usability, and the small data size for issues of overfitting as well as other factors remains to be the limitations of the private thermal comfort model work. Moreover, as a continuation of this work, we plan to validate the thermal comfort control impact on energy use using experimental data from a real HVAC system. Toward this goal and as shown in Figure 11, we have heavily instrumented an HVAC packaged rooftop unit that its status will be controlled by the new thermal comfort model. The unit has two separate cooling circuits allowing a two-stage capacity modulation with a partial load of 7.5 ton and a full load of 12.5 ton. Multiple universal superheat controllers produced by DunAn Microstaq, Inc. will be used to log the temperature and pressure values of both cooling circuits. Users can utilize the MODBUS RTU communication protocol or a Windows-based graphical user interface to communicate with the superheat controller and retrieve the measured data.
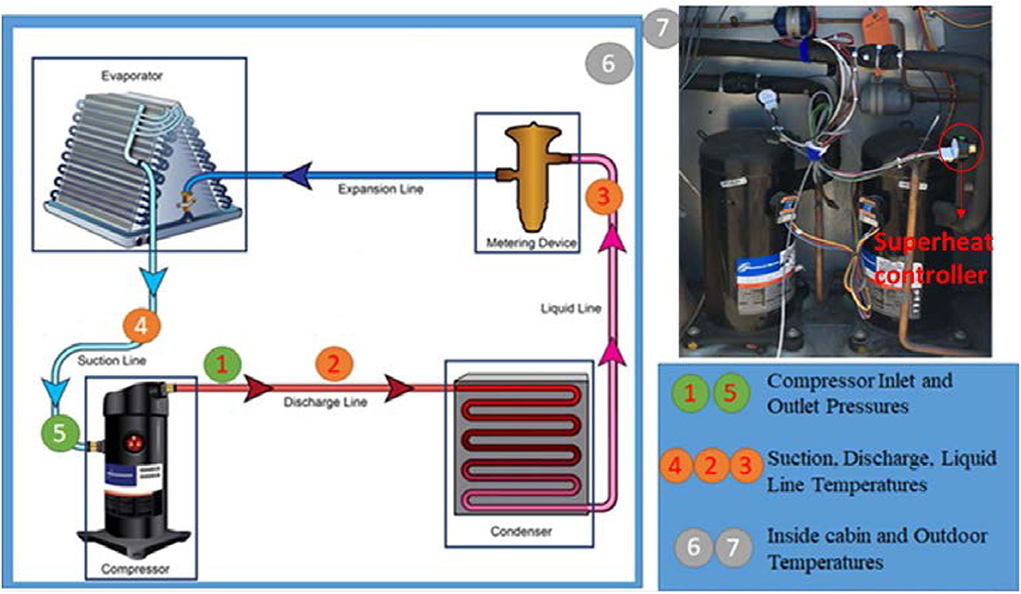
Figure 11. The HVAC system planned to be used in the experimental validation of the new comfort controller will be heavily instrumented so its operation can be integrated and controlled by the new comfort controller.
The measured data will be used to evaluate the HVAC system runtime before and after applying the new comfort controller. For example, Figure 12 shows the HVAC system cooling run time for more than 10 months before applying the comfort controller (baseline). Data will be collected for a similar duration when the comfort controller is applied. As these durations are long, a typical HVAC system might experience some faults or wrong operation. Thus, in our work, the online pressure and temperature measurements as shown in Figure 11 will be used to evaluate the system health and factor out any excessive run time due to these faulty operations that might bias our comparison. For example, as shown in Figure 13 the very low suction temperature and the inlet compressor pressure values indicate an evaporator frost event that occurred, as indicated in the figure, due to running the HVAC system at low outside temperature. This frost event has resulted in a very excessive HVAC run time that should be ignored in our planed comparison.
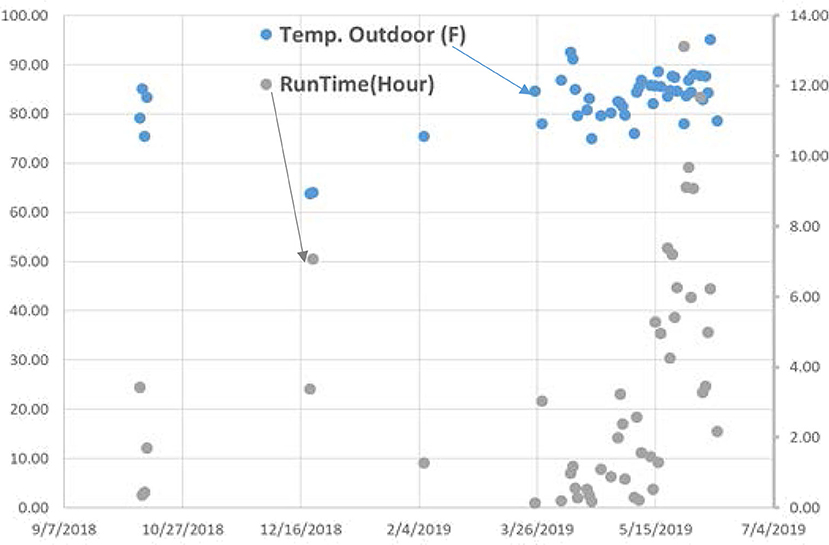
Figure 12. The baseline run time of the HVAC system.
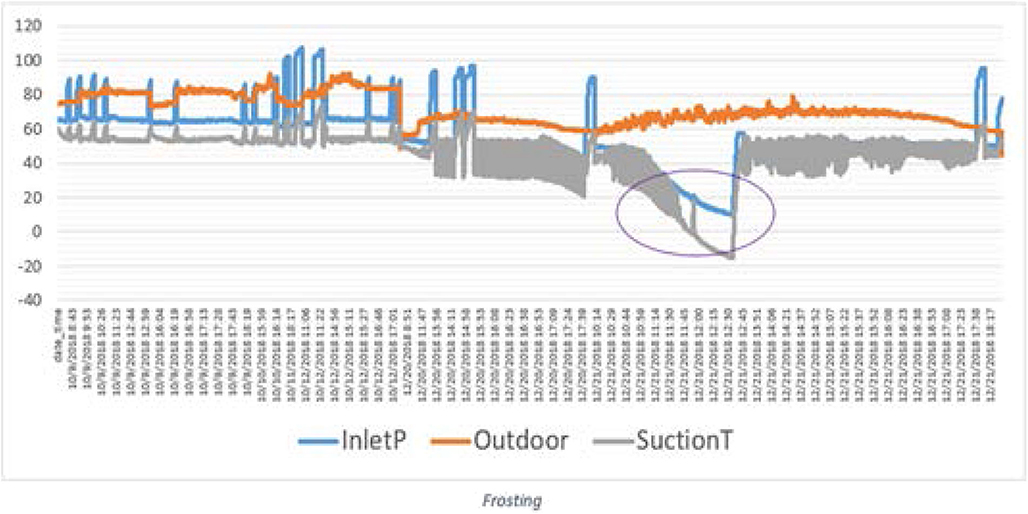
Figure 13. An example of an excessive run time that was detected using the HVAC system pressure and temperature measurements.
Conclusions
In this work, we have presented a framework for modeling and controlling thermal comfort in buildings. Specifically, an improved private comfort model has been developed from biometric data gathered via wearable devices. In this model, we have addressed the model accuracy to the features used to learn the model and the machine learning type and its tuning parameters. Thus, the best features that capture the comfort characteristics and the best machine learning method and parameter to model human comfort has been identified. Apart from the typical bio-metric sensors that were proposed in the literature to model thermal comfort such as skin temperature, skin conductance has been introduced and it has been observed that it is an important feature in creating a private comfort model. The difference in the accuracies of three private models of the individuals presented in this work shows that comfort is a subjective state of being. While the general comfort model failed to guarantee an accurate and reliable model that is representative of the study subjects, limited data size was the main limitation of the private comfort models.
Finally, we have presented an intelligent control approach that utilized the newly developed comfort model to control thermal comfort in a building. Simulation results for using the SOP algorithm were presented showing a superior performance compared to use an average thermostat set-point. A framework for experimental validation of this new comfort controller has been developed along with a new HVAC setup.
Data Availability Statement
The datasets generated for this study are available on request to the corresponding author.
Author Contributions
FA developed the idea and managed the work and performed the full edit for the paper. PA provided the idea and the wireless infrastructure integration for the future work section. DB implemented the wireless infrastructure and data collection for the experimental HVAC system data. KS provided the real-time data with thermostat API and weather station API data for the future work section that include the HVAC system run time. MR developed the machine learning models. MT wrote the initial version of the paper and perform the data cleaning and simulation. All authors contributed to the article and approved the submitted version.
Funding
Part of this project was funded by DunAn Microstaq, Inc.
Conflict of Interest
PA, KS, and DB were employed by company DunAn Microstaq, Inc.
The authors declare that this study received funding from DunAn Microstaq, Inc. The funder had provided access to complete unfiltered real-time remote access to building thermostat data and HVAC system performance data.
References
Allen, J. G., MacNaughton, P., Laurent, J. G. C., Flanigan, S. S., Eitland, E. S., and Spengler, J. D. (2015). Green buildings and health. Curr. Environ. Health Rep. 2, 250–258. doi: 10.1007/s40572-015-0063-y
ANSI/ASHRAE Standard 55-2013 (2013). Thermal Environmental Conditions for Human Occupancy. ANSI/ASHRAE Standard 55-2013.
Ari, S., Wilcoxen, P., Khalifa, H. E., Dannenhoffer, J. F., and Isik, C. (2008). “A practical approach to individual thermal comfort and energy optimization problem,” Paper Presented at the NAFIPS 2008-2008 Annual Meeting of the North American Fuzzy Information Processing Society (Berlin), 1–6. doi: 10.1109/NAFIPS.2008.4531261
Auffenberg, F., Stein, S., and Rogers, A. (2015). “A personalised thermal comfort model using a bayesian network,” Paper Presented at the Twenty-Fourth International Joint Conference on Artificial Intelligence (Buenos Aires).
Chang, Y., Hsieh, C., Chang, K., Ringgaard, M., and Lin, C. (2010). Training and testing low-degree polynomial data mappings via linear SVM. J. Mach. Learn. Res. 11, 1471–1490.
Chaudhuri, T., Soh, Y. C., Li, H., and Xie, L. (2017). “Machine learning based prediction of thermal comfort in buildings of equatorial Singapore,” in 2017 IEEE International Conference on Smart Grid and Smart Cities (ICSGSC) (IEEE), 72–77. doi: 10.1109/ICSGSC.2017.8038552
Chen, X., Wang, Q., and Srebric, J. (2015). A data-driven state-space model of indoor thermal sensation using occupant feedback for low-energy buildings. Energy Build. 91, 187–198. doi: 10.1016/j.enbuild.2015.01.038
Contributors, W. (2016). Health and Safety Executive HSE - Designing Buildings Wiki. Retrieved from: https://www.designingbuildings.co.uk/wiki/Health_and_Safety_Executive_HSE
Dai, C., Zhang, H., Arens, E., and Lian, Z. (2017). Machine learning approaches to predict thermal demands using skin temperatures: steady-state conditions. Build. Environ. 114, 1–10. doi: 10.1016/j.buildenv.2016.12.005
Fanger, P. O. (1970). Thermal Comfort. Analysis and Applications in Environmental Engineering. Copenhagen: Danish Technical Press.
Freund, Y., and Schapire, R. E. (1995). “A desicion-theoretic generalization of on-line learning and an application to boosting,” Paper Presented at the European Conference on Computational Learning Theory (Barcelona), 23–37. doi: 10.1007/3-540-59119-2_166
Frontczak, M., and Wargocki, P. (2011). Literature survey on how different factors influence human comfort in indoor environments. Build. Environ. 46, 922–937. doi: 10.1016/j.buildenv.2010.10.021
Gao, G., Li, J., and Wen, Y. (2019). Energy-efficient thermal comfort control in smart buildings via deep reinforcement learning. arXiv Preprint arXiv:1901.04693 doi: 10.1109/JIOT.2020.2992117
Ghahramani, A., Tang, C., and Becerik-Gerber, B. (2015). An online learning approach for quantifying personalized thermal comfort via adaptive stochastic modeling. Build. Environ. 92, 86–96. doi: 10.1016/j.buildenv.2015.04.017
Hasan, M. H., Alsaleem, F., and Rafaie, M. (2016). Sensitivity study for the PMV thermal comfort model and the use of wearable devices biometric data for metabolic rate estimation. Build. Environ. 110, 173–183. doi: 10.1016/j.buildenv.2016.10.007
Ho, T. K. (1998). The random subspace method for constructing decision forests. IEEE Trans. Pattern Anal. Mach. Intell. 20, 832–844. doi: 10.1109/34.709601
Höppe, P., and Martinac, I. (1998). Indoor climate and air quality. Int. J. Biometeorol. 42, 1–7. doi: 10.1007/s004840050075
Huang, C., Yang, R., and Newman, M. W. (2015). “The potential and challenges of inferring thermal comfort at home using commodity sensors,” Paper Presented at the Proceedings of the 2015 ACM International Joint Conference on Pervasive and Ubiquitous Computing (Ann Arbor, MI), 1089–1100. doi: 10.1145/2750858.2805831
Jung, W., Jazizadeh, F., and Diller, T. E. (2019). Heat flux sensing for machine-learning-based personal thermal comfort modeling. Sensors 19:3691. doi: 10.3390/s19173691
Kim, J., Schiavon, S., and Brager, G. (2018). Personal comfort models–A new paradigm in thermal comfort for occupant-centric environmental control. Build. Environ. 132, 114–124. doi: 10.1016/j.buildenv.2018.01.023
Leaman, A., and Bordass, B. (1999). Productivity in buildings: the ‘killer'variables. Build. Res. Inform. 27, 4–19. doi: 10.1080/096132199369615
Mason, L., Baxter, J., Bartlett, P. L., and Frean, M. R. (2000). “Boosting algorithms as gradient descent,” in Paper Presented at the Advances in Neural Information Processing Systems (Denver, CO), 512–518.
Pedregosa, F., Varoquaux, G., Gramfort, A., Michel, V., Thirion, B., Grisel, O., et al. (2011). Scikit-learn: Machine learning in python. J. Mach. Learn. Res. 12, 2825–2830.
Peng, B., and Hsieh, S.-J. (2017). Data-Driven Thermal Comfort Prediction With Support Vector Machine.” P. V003T04A044 in Volume 3: Manufacturing Equipment and Systems. ASME doi: 10.1115/MSEC2017-3003
Pérez-Lombard, L., Ortiz, J., and Pout, C. (2008). A review on buildings energy consumption information. Energy Build. 40, 394–398. doi: 10.1016/j.enbuild.2007.03.007
Quinlan, J. R. (2006). Simplifying decision trees. Int. J. 27, 221–234. doi: 10.1016/S0020-7373(87)80053-6
Rafaie, M., Alsaleem, F., and Holthaus, A. (2017). “Data fusion application in predicting human comfort,” in Structural Health Monitoring 2017: Real-Time Material State Awareness and Data-Driven Safety Assurance - Proceedings of the 11th International Workshop on Structural Health Monitoring (Stanford, CA: IWSHM). doi: 10.12783/shm2017/14170
Salonen, H., Kurnitski, J., Kosonen, R., Hellgren, U., Lappalainen, S., Peltokorpi, A., et al. (2016). “The effects of the thermal environment on occupants' responses in health care facilities: A literature review,” in 9th International Conference on Indoor Air Quality, Ventilation & Energy Conservation in Buildings (IAQVEC2016) (Seoul). Retrieved from: http://www.iaqvec2016.org/download/Files/1276.pdf (accessed March 19, 2018).
Vezhnevets, A., and Barinova, O. (2007). “Avoiding boosting overfitting by removing confusing samples,” in Paper Presented at the 18th European Conference on Machine Learning (Warsaw), 430–441.
Wagner, A., Gossauer, E., Moosmann, C., Gropp, T., and Leonhart, R. (2007). Thermal comfort and workplace occupant satisfaction—Results of field studies in german low energy office buildings. Energy Build. 39, 758–769. doi: 10.1016/j.enbuild.2007.02.013
Keywords: machine learning, comfort, HVAC, wearable devices, galvanic skin response, private model, PMV
Citation: Alsaleem F, Tesfay MK, Rafaie M, Sinkar K, Besarla D and Arunasalam P (2020) An IoT Framework for Modeling and Controlling Thermal Comfort in Buildings. Front. Built Environ. 6:87. doi: 10.3389/fbuil.2020.00087
Received: 30 June 2019; Accepted: 11 May 2020;
Published: 23 June 2020.
Edited by:
Monjur Mourshed, Cardiff University, United KingdomReviewed by:
Ali Ghahramani, National University of Singapore, SingaporeHaiguo Yin, Xi'an University of Architecture and Technology, China
Copyright © 2020 Alsaleem, Tesfay, Rafaie, Sinkar, Besarla and Arunasalam. This is an open-access article distributed under the terms of the Creative Commons Attribution License (CC BY). The use, distribution or reproduction in other forums is permitted, provided the original author(s) and the copyright owner(s) are credited and that the original publication in this journal is cited, in accordance with accepted academic practice. No use, distribution or reproduction is permitted which does not comply with these terms.
*Correspondence: Fadi Alsaleem, ZmFsc2FsZWVtMkB1bmwuZWR1