 Michael Stoner
 Weichiang Pang
- Glenn Department of Civil Engineering, Clemson University, Clemson, SC, United States
Tornadoes are some of the most severe and devastating natural events and cause significant damage to structures in the United States. Light-frame wood residential structures have shown vulnerabilities to these events, but they are not explicitly addressed in the design requirements due to their infrequent occurrence, relatively small impact area (compared to hurricanes), and complex wind profile. This paper explores the potential of Cross-Laminated Timber (CLT) to serve as a residential building material, specifically with regards to its performance in tornado events. CLT is an engineered wood product made when orthogonal layers of dimensioned lumber are glued to create panels. To compare the tornado performance of CLT buildings, six archetype residential buildings were each designed using CLT and light-frame wood in accordance to the appropriate US building code provisions and engineering principles. The capacity of each of the structural components was simulated using Monte Carlo Simulation based on the panel spans and connections of the panel boundaries. In addition, the resistance to structure sliding and combined uplift and overturning was simulated using engineering principles based on the load path of a CLT residential structure. Analysis of tornado induced wind loading was performed using recommendations from the 2016 ASCE-7 commentary and applicable literature that attempts to account for the wind-induced pressures caused by tornadoes. Fragility analysis was performed to determine the probability of failure for a given estimated tornado wind-speed. When compared to the wind speeds of the Enhanced Fujita (EF) scale, the CLT residential archetypes showed wind speeds resulting in 10% probability of failure were in the range of EF-4 level events. Factors such as the connection spacing, and roof panel spans had the most significant effect on the simulated performance of the residential archetypes. Thicker panels, more robust connections, or tighter connection spacing could also lead to residential CLT structures that withstand EF-5 level events.
Introduction
As Cross-Laminated Timber (CLT) becomes a more widely used and readily available building material, its uses and performance continue to be studied. CLT was developed as a structural building material in Europe in the 1990's (Podesto, 2011). Each panel is created by pressing orthogonal layers of dimensional lumber to create large panels that can be manufactured with a great deal of precision (Karacabeyli and Douglas, 2013). CLT panels are cut to dimension using computer navigated cutting (CNC) which ensures both precision and customization. Due to the cross-laminations, CLT panels exhibit stiffness in both planar directions. This property ensures ease of installation as well as dimensional stability when subject to changes in moisture. While compared to light-frame construction, there is relatively more lumber used in CLT panels, their increased structural properties may be beneficial when subject to extreme natural hazards such as tornadoes.
Tornadoes have seen an increase in the insured and total losses due to their violent nature and lack of warning time, as the average lead time before a tornado hits can be as low as 15 min (Kroll Brand Rating Agency, 2019), and unlike hurricanes, the affected area from a tornado is relatively small. Over the past 20 years, around 1,200 tornadoes occur annually and cause ~75 deaths in the United States (Insurance Information Institute, 2019). A significant amount of the insured and uninsured loss in tornado events comes from damage to residential structures primarily built using wood framing techniques (Ellingwood and Rosowsky, 2004). The hazards associated with tornadoes can take the form of wind-induced pressures and debris impact loads. The wind speeds in excess of 89.4 m/s (200 mph) combined with the drop in atmospheric pressure in the center of the tornado vortex can impart pressures well above the capacity of light-frame residential structures. In the event of a tornado, hazardous material can be transported by the wind at speeds approaching 44.7 m/s (100 mph) and impact the exterior of a structure, endangering the occupants and potentially compromising the structural system. In addition to the economic damages, deaths due to tornadoes are most likely to occur in mobile homes and permanent residential structures (Ashley, 2007).
Studies have attempted to quantify the performance of residential structures constructed using wood framing techniques when subjected to tornado hazards. Some have relied heavily on empirical data (Standohar-Alfano et al., 2015; Roueche et al., 2017) while other have performed detailed analysis of archetype residential structures using engineering principles that assume a load path through the structure (Amini and van de Lindt, 2013). Empirically derived fragility curves by Roueche et al. (2017) exhibit a higher degree of uncertainty than those numerically derived by Amini and van de Lindt (2013). The resulting fragility curves referenced specific building geometries with general assumptions made about load path, construction techniques, and member spacing, while those developed by Roueche et al. (2017) were based on the observations in a post storm event. Conclusions from these studies indicate that, in general, light-frame wood construction using typical practices and hardware would experience moderate damage during EF-2 level events and expect failure of the main wind force resisting system (MWFRS) in EF-3 level events.
Following the methodologies by previous analytical studies, the expected performance of a series of residential CLT structures was quantified following the damage states outlined by Amini and van de Lindt (2013). The damage states including loss of roof sheathing material great than 25% and failure of systems due to wall racking and uplift. The design of the archetype structures used in this study was based on the guidelines of the National Design Specification for Wood Construction (AWC, 2018) and the recommendation of the CLT handbook (Karacabeyli and Douglas, 2013). Archetypes like those developed by Amini and van de Lindt (2013) for residential light-frame construction and the model developed by Raymond (2019) for CLT were used as a set of archetype structures. Using assumptions about the structural load path, analysis of wind-induced pressures, and Monte Carlo Simulations, fragility curves were developed. These fragility curves were examined to determine the vulnerabilities of the CLT residential archetypes as well as the expected performance given a tornado event.
Design of CLT Residential Archetypes
In order to compare the performance of a CLT structure to that constructed using light-frame wood, a series of five archetype structures were taken from Amini and van de Lindt (2013) and the single structure developed by Raymond (2019). These structures were developed to generalize the performance of residential structures and give an indication of the variation of performance based on various building geometries. Each of the six structures are shown with arrows indicating the span of the CLT elements in Figure 1, summarized in Table 1, and were designed using CLT panels for the roof and wall structure. Each of the residential archetypes developed by Amini and van de Lindt were used to generalize the performance of different structures geometries. The archetype developed by Raymond was developed specifically to maximize the efficiencies and performance of the CLT elements in a tornado event. For this study, the five light-frame archetypes were used as a comparison to the performance of light-frame residential structures, while the CLT archetype was used to investigate the potential for CLT to resist tornadoes when tornado wind design was considered in the panel layout and overall structural geometry. The development of each of the archetypes using CLT followed gravity and straight-line wind design with a wind speed of 67 m/s (150 mph) outlined in ASCE 7-16 (ASCE, 2016). The wind design only controlled the connection spacing in the CLT archetypes as the panel geometry and layout was controlled by the gravity design. The design wind speed is higher than that used in the design of light-frame buildings for inland regions of the U.S. which corresponds to ~40–50 m/s (90–115 mph) but represents a design that is achievable with typical connection spacing.
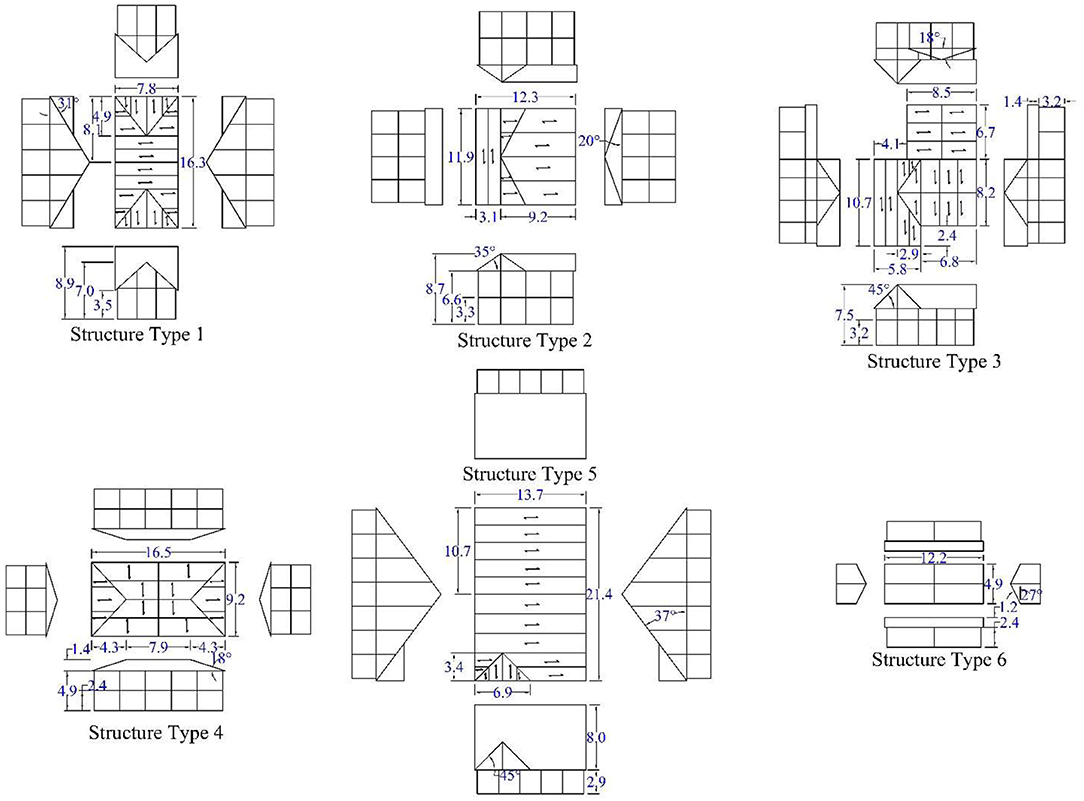
Figure 1. Archetypes used in study of CLT residential structures (dimensions in m).
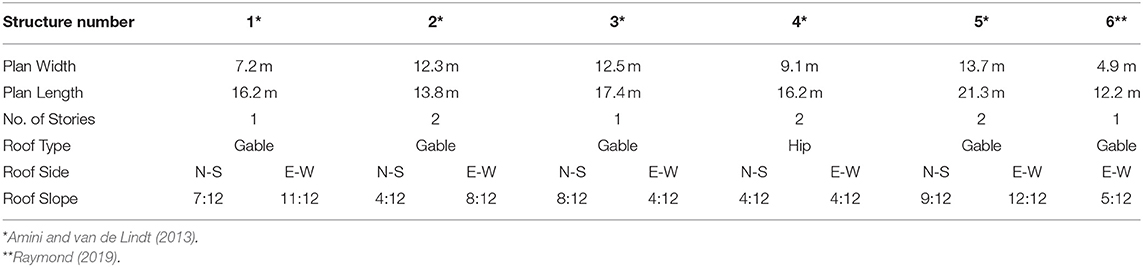
Table 1. Description of residential archetypes.
The roof and wall assemblies for each of the structure types were designed based on the guidance of the CLT handbook (Karacabeyli and Douglas, 2013) for shear, moment, and deflection due to dead load and roof loading. Design of panels for vibration and fire were not considered. In addition, panel dimensions were limited by maximum panel dimensions of 3.05 m by 12.2 m (10 feet by 40 feet) due to shipping limitations and typical CLT press sizes. CLT panels were assumed to bear on exterior walls, and where supported by interior member, glulam beams were utilized. These members would be typical where changes in roof pitch occur as well as in locations where double or triple span conditions exist. These additional supporting elements were not designed for each archetype, nor were they considered for the fragility analysis of this study as they were assumed to have the capacity to develop the strength required to support the CLT panels. In addition, 70% of the exterior CLT walls was assumed to be full height CLT walls, consistent with the assumptions of Amini and van de Lindt (2013). For the purpose of the analysis of CLT structures, the percentage of full-length wall affected the number of connections at the base of each wall line. The original spacing of the connectors was determined based on the straight-line wind analysis of with a wind speed of 67 m/s (150 mph). The spacing was varied in the Monte Carlo Simulation to determine the spacing's effect on the performance of the archetypes.
A three-layer CLT panel was assumed for all roof and wall elements where each layer measured 35 mm (1.375 inches) and the total panel depth measured 105 mm (4.125 inches). The panel's structural properties were taken for a V3 layup where all longitudinal layers are No. 2 Southern pine lumber and all transverse layers are No. 3 Southern pine lumber (APA, 2018). The bending strength of the CLT panel is given by Equation 1 where the maximum bending moment, Mb, is a function of the effective section modulus, Seff, and the allowable or ultimate bending stress, Fb, multiplied by all applicable adjustment factors present in Chapter 10 of the National Design Specification (AWC, 2018).
The effective section modulus was taken from the effective bending stiffness, EIeff, and was calculated using one of several mechanical models used to predict the stiffness of composite elements. The shear analogy method described in Kreuzinger (1995) was used in this study to calculate the effective section properties of the composite CLT section. In this method, the effective bending stiffness is reduced to account for to shear deformations when calculating deflections. A summary of the strength properties and adjustment factors used for design and the resulting Allowable Stress Design (ASD) values and limiting spans are described in Table 2. Using the span limitations, CLT panels were arranged to minimize the number of panels and necessary interior supports. Where possible, double and triple span configurations were used. An example of the layout for panel walls (numbers) and roof (letters) is shown in Figure 2. Each panel is labeled individually based on geometry and unique loading due to tornado induced forces.
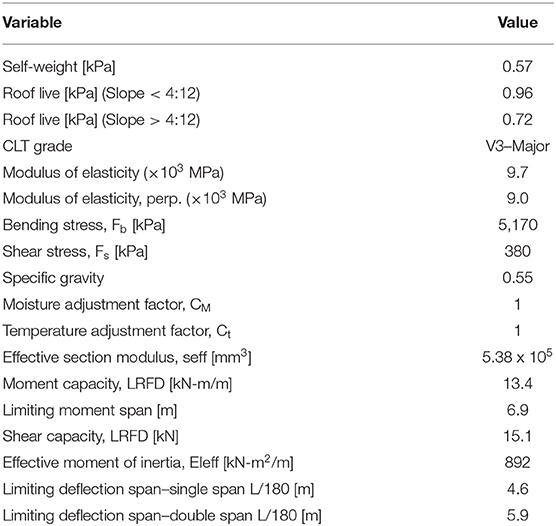
Table 2. Material properties used for structural design of CLT elements.
Figure 2. Panel layout of structure 1.
Determination of Tornado Wind Forces
The current state of codified wind design in the United States describes procedures to only consider straight line winds; however, methods for considering the wind-induced loads from tornado events are provided in the Commentary of ASCE 7-16 (ASCE, 2016). The two methods that are presented are termed the Extended Method and the Simplified Method. The Extended Method modifies the directional procedure present in Chapter 27 of ASCE 7-16 shown in Equations 2 and 3.
In Equations 2, 3, Kz = velocity pressures exposure coefficient, Kzt = topographic factor, Kd = wind directionality factor, Ke = ground elevation factor, V = basic wind speed (m/s), and qz = velocity pressure at height z (N/m2). In Equation 3, the design wind pressure p (N/m2), is calculated from the velocity pressures q evaluated at either height z or mean roof height h depending on which walls/roof elements are being considered. In addition, G = the gust-effect factor, Cp = the external pressure coefficient, and GCpi = the product of the gust-effect factor and the internal pressure coefficient.
The commentary addresses the differences in wind-induced pressures from tornado winds and the wind-induced pressures from other windstorms by increasing the directionality factor, Kd, from 0.85 to 1.0 and increasing the gust-effect factor, G, from 0.85 to 0.90. The increase in the directionality factor results from the rotational winds in a tornado increasing the likelihood that at the building will experience the maximum wind velocity at the same time it experiences the worst-case wind direction. The increase in the gust-effect factor to remove the 0.925 calibration factor used to derive G = 0.85 for rigid buildings (ASCE, 2016). It is also recommended that component and cladding (C&C) loads be decreased by 10%, due to the short duration of tornado events (Kopp and Morrison, 2011). Finally, the internal pressure coefficient, GCpi, be set to ±0.55 to account for the likelihood that there is damage to the building envelope increasing the internal pressure.
The Simplified Method considers tornado induced wind loading by modifying the traditional equation for the calculation of design wind pressures by a Tornado Factor, TF, as shown in Equation 4. The Tornado Factor is meant to address the changes in pressure due to the central pressure drop measured by Haan et al. (2010). In this research, a 9.14 × 9.14 m (30-ft by 30-ft) building with a mean roof height of 6.71 m (22-ft) and gable roof angle of 35° was studied in a tornado simulator. The tornado simulator created vortices simulating the wind behavior associated with tornadoes on a 1:100 scale model of the structure. These studies were performed with the explicit goal of comparing the pressures measured on the model to those calculated by straight-line wind provisions in ASCE 7-10. The resulting ratio between measured pressure and calculated pressures range from 1.1 to 2.5 based on enclosure and exposure category. In this equation, the velocity pressure, qi, is multiplied by the product of the external pressure coefficient and gust factor, GCp, combined with the internal pressure coefficient, GCpi, to give the design wind pressure, p.
For this study, the Extended Method was utilized in determining the forces that result from tornado events.
Wind load statistics used in the simulation of the forces on structural elements were taken from ASCE as well as literature relevant to the study of the performance of structures in tornadoes. Values for Kzt, Kd, and Ke were set to unity, while values for Kz, GCp, and GCpi were normally distributed with coefficients of variation (CoV) based on work done by Lee and Rosowsky (2005) summarized in Table 3. The panel's dead load with mean of 0.575 kPa (12 psf) and superimposed dead load with mean of 0.575 kPa (12 psf) was also simulated using a normal distribution and a CoV of 0.10. Values of external pressure coefficients were calculated based on a weighted average approach for the various zones of pressure present on wall and roof panels. CLT wall and roof panels and their boundary connections were subjected to the C&C pressure coefficients referenced by ASCE 7 Chapter 30. For system level failures such as uplift, overturning, and sliding, forces were calculated using pressure coefficients associated with the MWFRS). Examples of the pressure coefficients calculated for CLT wall and roof panels are shown in Table 4 for structure Type 1. The CoV used for all GCP-values was 0.12. For each of the values of the velocity pressure coefficient, Kz, and external pressure coefficients, GCP, a nominal-to-mean ratio of 1.05 consistent with studies by Lee and Rosowsky (2005) and Amini and van de Lindt (2013).
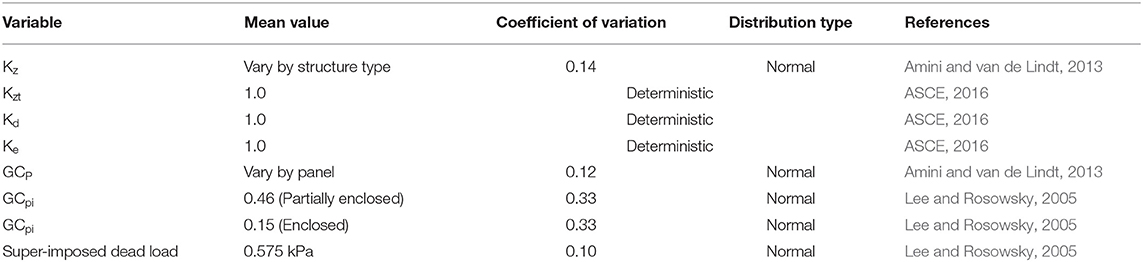
Table 3. Summary of values used in wind analysis.
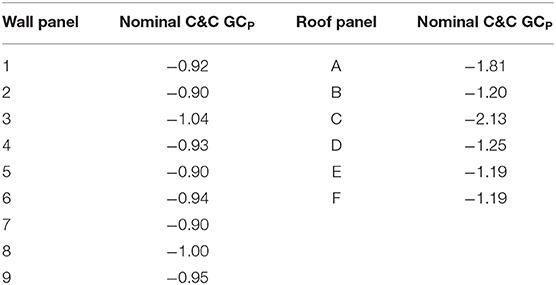
Table 4. External pressure coefficients, GCP, used in wind analysis for structure Type 1.
For design purposes, it is recommended that due to the likelihood of breach of building envelope caused by windborne debris, a partially enclosed internal pressure coefficient be used to calculate the wind-induced forces on a structure. Using CLT as the exterior of the residential structures would provide more resistance to windborne debris impact; however, vulnerable areas including building fenestrations are likely to limit the enclosure classification. In order to study the potential improvement the added resistance of CLT would have on the residential structure, debris impacts were considered parametrically. The debris impact performance (or fragility) of 3-ply CLT was experimentally determined in a previous study that subjected CLT panels to windborne debris impacts in the form of a 2 × 4 dimension lumber (Stoner and Pang, 2019). The mass and velocity of the simulated debris corresponded to the debris found in EF-2 and EF-3 level events as defined by FEMA P-361 (FEMA, 2015). The experimental data collected in Stoner and Pang (2019) was fit to a lognormally distributed fragility curve, which relates the debris speed of a 6.8 kg (15-lb) 2 × 4 lumber to impact failure probability. The relationship between wind speed and debris speed was estimated using the recommendations of FEMA P-361 where the debris speed is listed for a given design tornado wind speed. These debris speeds give an indication of the maximum hazard from windborne debris that can be expected in a tornado event. Using the lognormal distribution parameters from the study, the response to debris impact of the CLT structures was simulated where surviving structures used an enclosed internal pressure coefficient, and structures that experienced failure due to debris impact used a partially enclosed internal pressure coefficient. The response to debris impact loads relies heavily on assumptions made about the number and severity of debris that impact a structure during a tornado event both of which are functions of the surrounding terrain and available debris. To study the effect of such debris, the number of impacts each structure was exposed to during a single event simulation was varied between 0 and 5 for a 6.8 kg (15-lb) 2 × 4. Results from this analysis would give an indication of the performance of a CLT structure if both the fenestrations were protected and the performance of the CLT wall and roof assemblies was considered. For all other simulations, the structure was assumed to be partially enclosed for all wind speeds.
Resistance of CLT Archetypes and Load Path Assumptions
In order to determine the performance of residential CLT structures, the CLT panel strength and connection strength was determined. The true mean bending capacity of the panels used in this study was calculated based on the required characteristic value referenced in PRG-320, Standard for Performance-Rated Cross-Laminated Timber (APA, 2018). This standard provides guidance regarding the performance of CLT used in the United States and Canada including the required characteristic values derived from the 5th percentile with 75% confidence of an experimental test series representing the population. To arrive at the ASD design value reported by manufacturers, the characteristic test values are taken from the statistical analysis of the test results and divided by a factor of 2.1 per PRG-320. To ratio of mean value to characteristic value was taken from tests by Gu (2017) on Southern Yellow Pine CLT where this ratio was found to be 1.4. Combining the ratios (1.4 × 2.1 = 2.94) gives an estimate of the ratio between the true mean capacity and the published ASD value. Simulations of the capacity of CLT panels utilized this factor to predict the bending strength of a 3-ply V3 CLT panel.
Connections between wall and roof panels used screws that measured 5.6 × 203 mm (0.22 × 8 in). These connections were also used between perpendicular wall panels at the corners of the residential structures. The spacing of the screws significantly affects the capacity of the structure in both uplift and shear and was varied between 15.2 and 30.5 cm (6 and 12 in) in this study. The average screw spacing of 22.9 cm (9 in) was based on a straight-line wind design of 67 m/s (150 mph). Reference allowable withdrawal and shear values were taken from literature provided by screw manufacturers (Simpson Strong Tie, 2019). The reference allowable withdrawal load for southern pine was given as 47.5 N/mm of penetration into the main member (214 lb/in) with a maximum value of 2,600 N (590 lb). The reference allowable shear value for southern pine was 1.76 kN (395 lb) for a side member thickness of 105 mm (4.125 in). For both withdrawal and shear, the calculated design value was multiplied by a factor of 3 to estimate the mean strength value from a design level strength.
Connections between CLT walls and floor or foundations were made using bracket style connectors, namely Simpson Strong-Tie AE 116 brackets measuring 90 × 48 × 116 mm (3.5 × 1.9 × 4.6 in) and 3 mm thick (0.12 in). The vertical face of the bracket-type connector is fastened using (18) screws measuring 3.1 × 63.5 mm (0.122” × 2.5”). The horizontal face was fastened using (7) screws when attaching two CLT surfaces and (3) 12.7 mm (0.5 in) bolts when attaching to the foundation at the first floor as shown in Figure 3. The ASD capacities in each direction are given in Table 5. No hold downs were assumed to be present in the structures as the gravity load and uplift capacity of the bracket-type connectors were assumed to resist the uplift loads associated with the straight-line wind design. Bracket-type fasteners were assumed to be connected on the inside of the exterior walls where forces resulting from positive wind pressures would be compared to the value, F3 in Figure 3 and forces from negative wind pressures would be compared to the value F2 in Figure 3. Like the screwed connection between perpendicular elements, the bracket style connection used a ratio of 3 to calculate the mean strength for values of F1, F2, and F3from the ASD capacity published by the manufacturer. Experimental testing was used to determine the behavior of the connection in uplift, F4. In addition, connections were assigned a coefficient of variation of 0.15 consistent with testing of similar various configurations of bracket-type connectors (Gavric et al., 2014; Schneider et al., 2015; Liu and Lam, 2018; Mahdavifar et al., 2019).
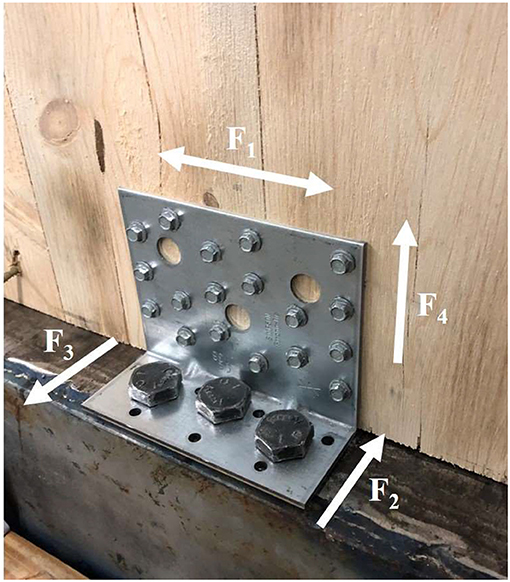
Figure 3. Representation of bracket-type connections used in simulations.
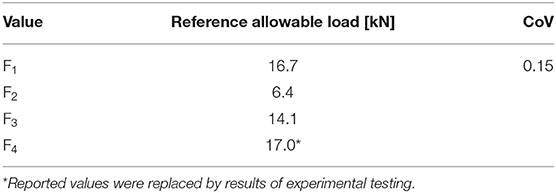
Table 5. Reference ASD loads for bracket-type connector.
In addition to the failure of CLT components and their connections, the failure of the structure due to sliding, and combined uplift and overturning was considered. For the sliding of each structure, exterior walls were assumed to resist all the base shear demand produced by the wind-induced pressures. Principles of tributary area were used to determine the out-of-plane demand for each connector. The out-of-plane and in-plane walls were analyzed separately to determine their resistance to the shear forces generated from MWFRS pressure coefficients on the entire structure.
The total uplift on the structure was divided between the exterior walls and interior supports by tributary area. The percentage of the uplift tributary to each of the exterior wall lines was determined and assumed to act uniformly on each of the bracket-type connectors present at the base of each wall. In addition, the contribution of overturning to the vertical component of the force on each connector was determined by assuming a percentage of the overall overturning moment be resisted by the in-plane walls. Analytical models have been developed to predict the stiffness contribution due to out-of-plane walls (Shahnewaz et al., 2019); however, there is little information on the strength contribution of out-of-plane walls to the overturning resistance of a platform framed CLT structure. For this study, the ratio of global overturning moment taken by the in-plane walls was defined as the overturning ratio. It was assumed that all remaining overturning moment was taken by the out-of-plane walls. The overturning ratio resisted by the in-plane walls was varied between 50 and 100% to determine the affect this assumption had on the predicted performance of the structure. It is understood that there will be some contribution by the out-of-plane walls which relies heavily on the connection between in-plane and out-of-plane walls. For the baseline structural model, it was assumed that 75% of the overturning ratio was taken by the in-plane walls.
Many methods have been developed for determining the strength of CLT shear walls that assume different contributions due to bending, shear, sliding, and rocking (Popovski et al., 2011; Pei et al., 2013; Reynolds et al., 2017; Shahnewaz et al., 2018; Lukacs et al., 2019). Ultimately, a simplified kinematic model presented in the CLT Handbook (Popovski et al., 2011) was utilized in determining the strength of the in-plane CLT walls. In this method, the CLT panels are assumed to rotate about their corner and all lateral forces are resisted by the connections at the base as a function of their distance from the point of rotation. This model is represented by Equation 5 where the lateral force, F, and resulting deformation, D, is resisted by the force in each connector, fi. The force in each connector is calculated based on its distance to the point of rotation, li, and deformation, di. In addition, the contribution of the gravity load on each panel is assumed to resist the rocking action based on the length of the CLT panel, L, and height of panel, H.
This kinematic model assumes pure rotation about the bottom corner and neglects the compressive stresses and associated deformations due to rocking. In addition, panel-to-panel connections were assumed to resist the required shear demand between panels. The lateral strength of the CLT walls was controlled by the length of wall and the vertical capacity of the bracket-type connectors used in each exterior wall. In order to determine the strength of the wall, information about the force-deformation response of the bracket-type connectors present at the base of the wall was required. To obtain a more detailed understanding of the performance of the connectors in uplift, a series of connection tests were performed to further quantify the vertical force-displacement behavior, F4. Based on a series of monotonic and cyclic uplift tests of the bracket-type connections, this response was quantified on the connection level. The one-sided response of the bracket-type connection was quantified using the Modified Stewart (MSTEW) model, also commonly known as the CUREE hysteresis model (Folz and Filiatrault, 2001), shown in Figure 4. For full cyclic data, the MSTEW model uses a 10-parameter model to describe the hysteresis behavior. Where only the backbone is described by the hysteretic model, only 5 parameters are required, K0, r1, r2, F0, and Δu. The backbone parameters fit to the test results are shown in Figure 4.
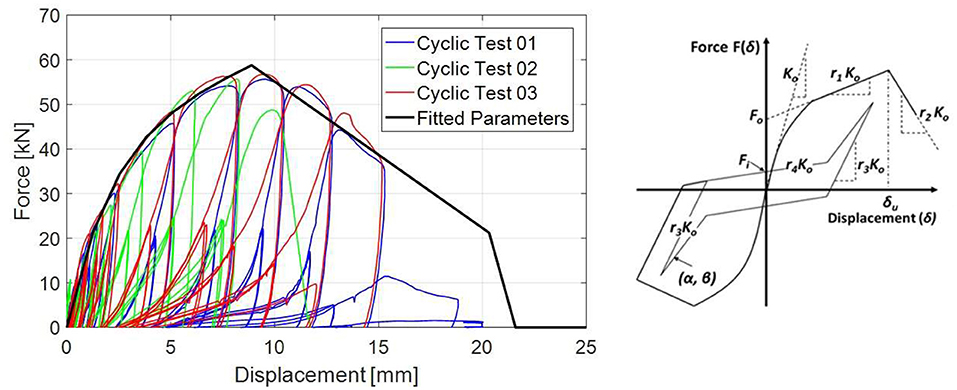
Figure 4. Experimental uplift test data (Left) and MSTEW hysteretic model rules (Right).
Using the force-displacement relationship of the bracket-type connections derived from experimental testing, the strength of the exterior walls of the residential archetypes could be calculated and simulated. For each of the exterior walls, the peak capacity of each connector was estimated with a mean directly taken from the experimental testing and CoV of 0.15.
Fragility Analysis of Residential Archetypes
Fragility functions have been used to quantify the variability in structural performance most often using a lognormal cumulative distribution function to relate the probability an event occurs given the occurrence of a specific intensity measure. The lognormal fragility function is represented in Equation 6 where the probability of exceeding a damage threshold, Pf, given an estimated tornado wind speed, WS, is a function of the standard normal cumulative distribution function, Φ, and lognormal distribution parameters representing the logarithmic mean, μ, and logarithmic standard deviation, σ. The lognormality of the fragilities was verified after all the limit states were defined.
Figure 5 represents the procedures used to develop the fragility functions for each of the components in the structural system and the total structure fragility. Once the building geometry, panel layouts, and connection spacing was determined, the wind load statistics were calculated, the design wind pressure could be simulated. In the case of the study on the potential influence of debris impact resistant wall assembly on the structural performance, the debris was simulated in order to calculate the wind load statistics and the design wind pressures. For each wall and roof panel, fragilities were calculated for failure due to exceeding the moment capacity of the panel as well as connection failures at the panel boundaries. These fragilities were used to develop overall roof fragilities based on 25% failure of the roof by area and wall fragilities based on the failure of any wall panel. In addition, systems level failures such as sliding and combined rocking and uplift were calculated.
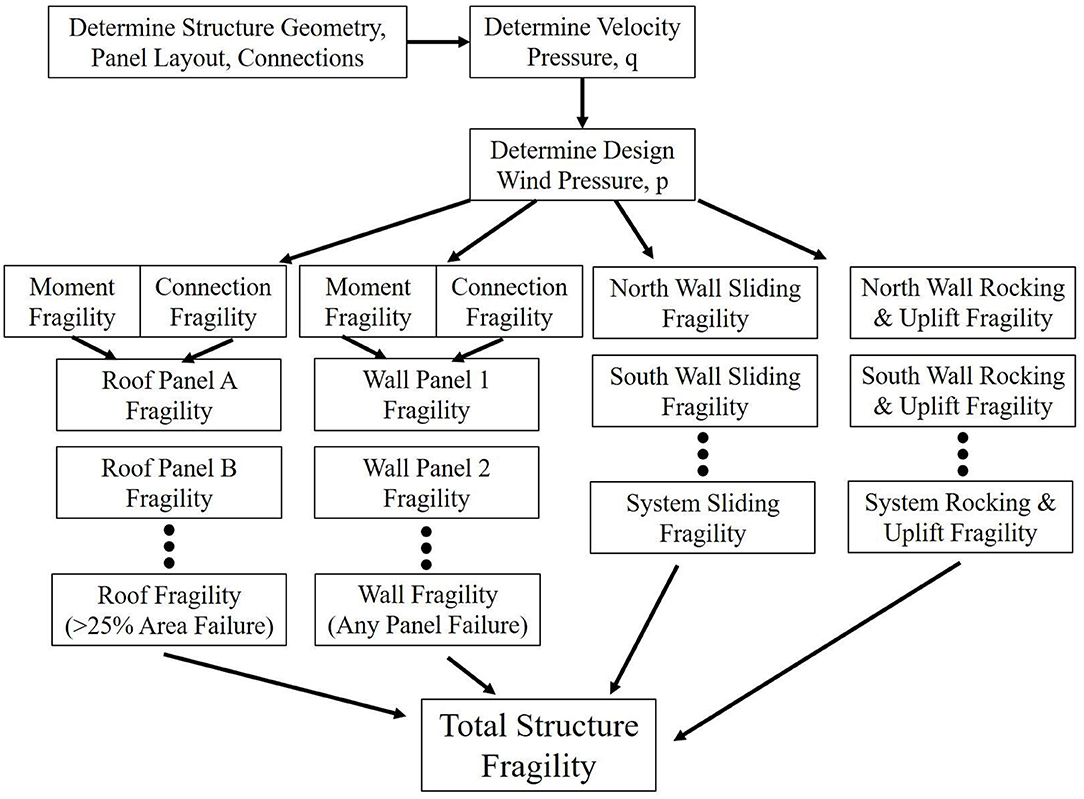
Figure 5. Framework for development of fragility functions.
Flexural Failure of Wall and Roof Elements
Failure of the CLT roof and wall panels in flexure due to uplift forces was determined through the limit state function given in Equation 7 where the limit state, gflexure(WS), is given by the difference in the simulated moment capacity, Mcap, and simulated demand, Mdemand, with added moment due to the dead load of the panel, MDL. Dead load was only considered in the fragility functions for roof elements. In addition, the positive wind pressure was checked where the moment due to dead load, MDL, was added to the positive wind pressure. Each panel was assumed to span in the direction of its strong axis. For triangular panels, the longest span was assumed to calculate the moment capacity, demand, and moment due to dead load.
Lognormal fragility curves were developed for each CLT panel and its boundary connections by simulating the pressure resulting from a given estimated tornado wind speed, WS.
Connection Failure of Wall and Roof Elements
The connection capacity of each CLT panel was taken as the total capacity the connections on the panel's perimeter to supporting elements. For roof panels, this included screws in withdrawal, while for wall panels, this was composed of a combination of screws in withdrawal and/or shear and bracket-type connections in shear. The out-of-plane capacity of the panel-to-panel connection was neglected in the estimation of the connection capacity. If a significant pressure differential existed between adjacent panels, it is not likely that the panel would transmit a significant amount of force through the panel-to-panel connection which is not designed to resist such loading. It is noted that there could be damage to the panel-to-panel connection compromising its ability to transmit shear forces to adjacent panels but was neglected from these limit state definitions. The limit state for panel failure due to negative pressure connection failure, gconnection(WS), is demonstrated in Equation 8 where the capacity is given by the capacity of a connector in shear, Fshear, times the number of connectors in shear, nshear, and the capacity of a connector in withdrawal, Fwith, times the number of connectors in withdrawal, nwith. The capacity is compared to the total suction force on the panel, Fsuction.
Structure Sliding Failure
In addition to the component fragilities for each panel in the residential archetypes, the system level limit states of sliding and combined uplift and rocking were analyzed. The limit state function for sliding was determined by comparing the shear from wind-induced pressure, V(WS), to the shear capacity of the bracket-type connection at each perimeter wall given as Fi, where there exist n exterior walls (Equation 9).
Structure Uplift and Overturning Failure
The limit state function for panel combined uplift and rocking was determined through Equation 10 where the capacity of each connector in uplift, Fi, was compared to the forces generated by uplift, Fuplift, and rocking, Frocking. Uplift forces were determined through the contribution of overall uplift taken by each of the exterior walls. The rocking forces were determined by calculating the peak force developed in the connectors based on Equation 10 assuming rocking behavior of the in-plane walls.
The demand on the system level limit states changed with wind direction due to the geometry of the structure archetypes; therefore, each of the cardinal wind directions was simulated through Monte Carlo Simulation.
Calculating Total Structure Fragilities
To determine the component fragilities for each wall/roof panel, the limit states of connection failure and moment failure were combined to determine its probability of failure by either negative pressure connection failure or flexural failure by Equation 11. The compliment of the flexural limit state for panel i, gflexure, i is multiplied by the compliment of the connection limit state, gconnection, i, and subtracted from 1.
Where there were multiple wall panels with the same limit state function, the compliment of the limit state function was raised to the power, np, representing the number of panels in the structure with the given limit state and n unique panels in the structure as shown in Equation 12.
In the case of roof panels, the probability of failure exceeding 25% of the roof area was used as the threshold for “failure,” which was calculated through Monte Carlo Simulation and fit to a lognormal distribution function to determine the limit state groof. The threshold for failure of 25% roof failure by area was used to match the threshold for light-frame structures in the analysis by Amini and van de Lindt (2013). For wall panels, any wall failure was considered to exceed the damage threshold associated with “failure.”
The performance of a structure considering all limit states, G(WS), was determined using Equation 13 where the limit state function for limit state functions for roof panels, wall panels, system sliding, and system rocking and uplift are combined by multiplying their compliments and subtracting the result from 1.
The lognormality of the limit state fragilities was verified by comparing the sum of the squared error terms for a lognormal distribution to that of a normal and Weibull distribution. In the case of each panel component fragility and system failure fragility, the failures simulated by the limit state equations were fit to a lognormal distribution, a normal distribution, and a Weibull distribution. The sum of the squared error terms for each distribution type was the primary measure of fit. In all cases, the lognormal distribution produced the least error and was considered appropriate to describe the fragility function. The total lognormal error was 17 and 2% of the normal error and Weibull error, respectively.
Results of Fragility Analysis
Fragility analysis of each of the residential CLT archetypes gave insight into not only the expected performance in the event of a tornado, but also the most susceptible components and effect specific load path assumptions had on the resulting performance of the structure. A baseline structure connection spacing and set of assumptions was used to compare the influence of assumptions including the overturning ratio (75% of overturning taken by in-plane walls) and connector spacing (23 cm for screws, 91.4 cm for bracket-type connectors).
Examples of the component fragilities calculated for structure Type 1 are shown in Figure 6. Each panel had a fragility developed for moment and connection failure from wind-induced pressures. The panels experienced variations in predicted performance due to the change in external pressure coefficients, maximum span, and connection at the perimeter. Panel 2 was the most vulnerable wall panel due to the connections only at the base to the foundation and above to the floor plate. Similarly, Panel E was the most vulnerable roof panel due to its large span (3.9 m).
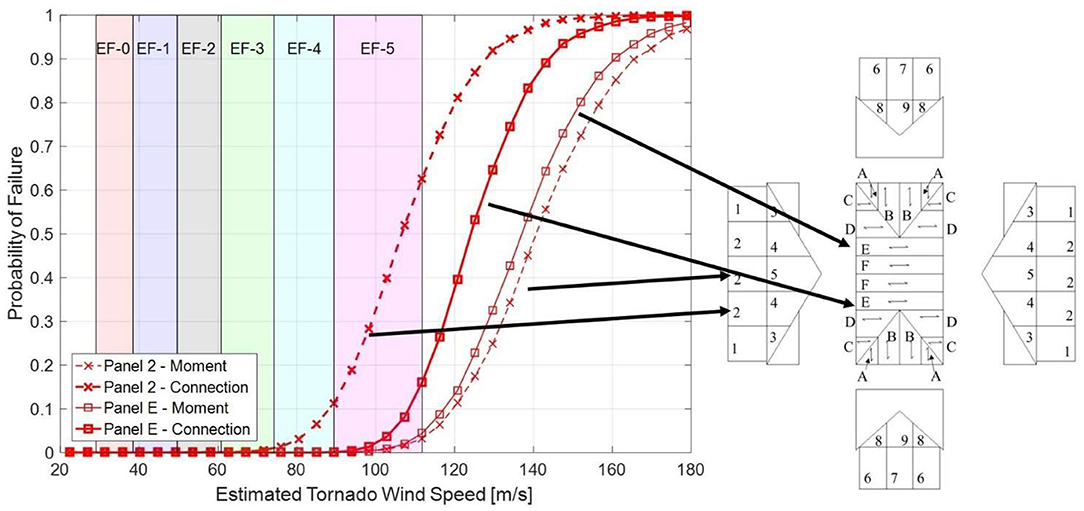
Figure 6. Examples of panel fragilities developed for structure 1.
The total structure fragility for each structure type was plotted along with the wall, roof, sliding, and combined uplift and overturning fragilities in Figure 7 where the shaded areas represent the estimated wind speed for each of the levels on the EF scale 0–5. The performance of each of the six archetype structures was dominated primarily by failures of the wall and roof panels (due to bending and negative pressure connection failures) and sliding failure. Structure Types 1, 2, and 3 were controlled largely by the wall component fragilities, while structure Types 4 and 5 were controlled by the roof fragilities. System level failures associated with sliding were a contributing failure mechanism for Structure Types 1, 3, and 5.
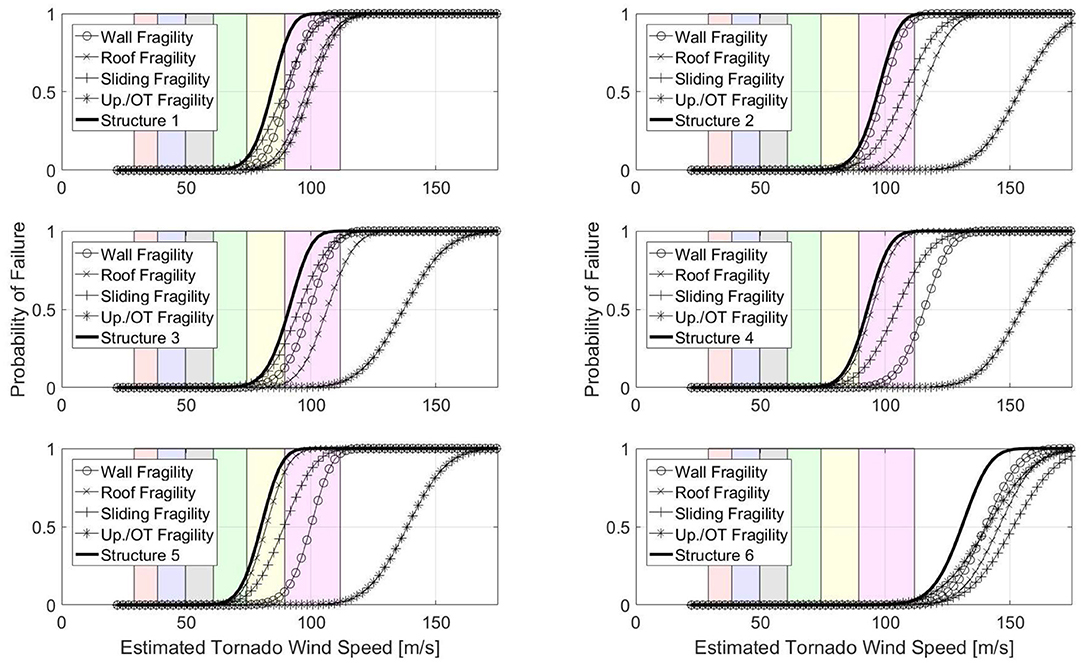
Figure 7. Wall, roof, and system fragilities for each structure type.
The bracket-type connector spacing was found to have a significant impact on the simulated performance as shown in Figure 8 for Structure 1. The windspeed resulting in 10% probability of failure increased from 65.8 m/s (147 mph) to 86.0 m/s (193 mph) when the spacing decreased from 122 cm (48 in) to 61 cm (24 in). An increase of 32 and 29% in windspeed resulting in 10% probability of failure probability was also experienced for structure Types 2 and 3 where spacing of connection in wall elements had a more significant impact on the performance of the entire structure. Increases in median failure probability for structure Types 4 and 5 was only in the range of 9-10% where the failure was controlled more by the screw connection at the roof.
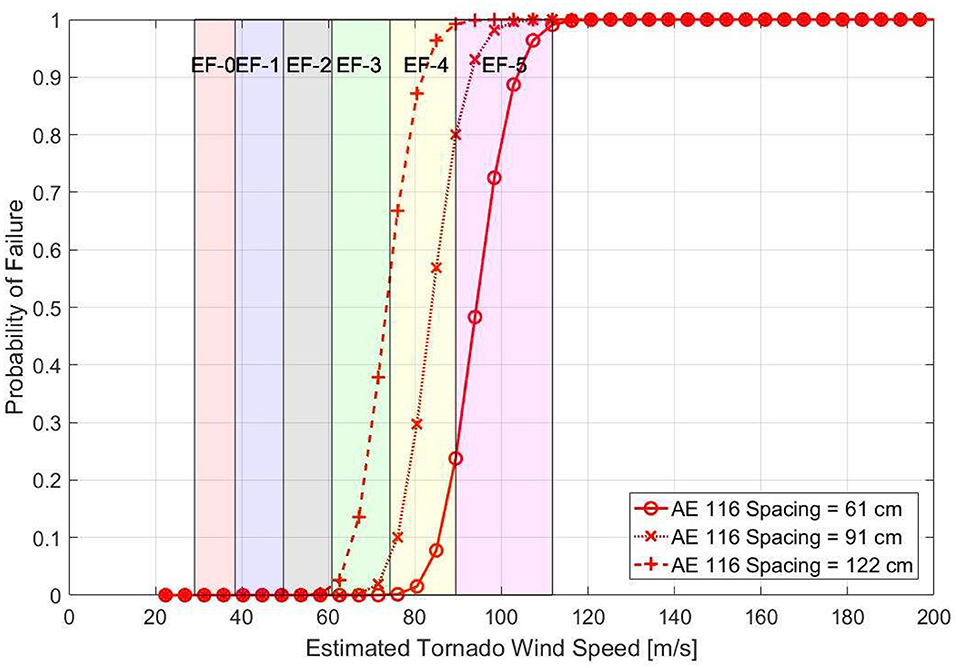
Figure 8. Variation in performance based on change in spacing of bracket-type connections for structure 1.
Where failure of the roof components played greater role in the simulated performance of the structure, the spacing of the boundary screw connections had a more significant impact on the simulated performance as with structure Types 4, 5, and 6. The variation in simulated performance of structure Type 4 is shown in Figure 9 where there was an increase in the windspeed resulting in 10% probability of failure from 74.9 m/s (168 mph) to 90.8 m/s (203 mph) when the screw spacing decreased from 30.5 cm (12 in) to 15.2 cm (6 in). Other archetypes experienced increases in the windspeed resulting in 10% probability of failure probability of failure that ranged from 1% for structure Types 1, 2, and 3 to 21% for structure Types 4, 5, and 6.
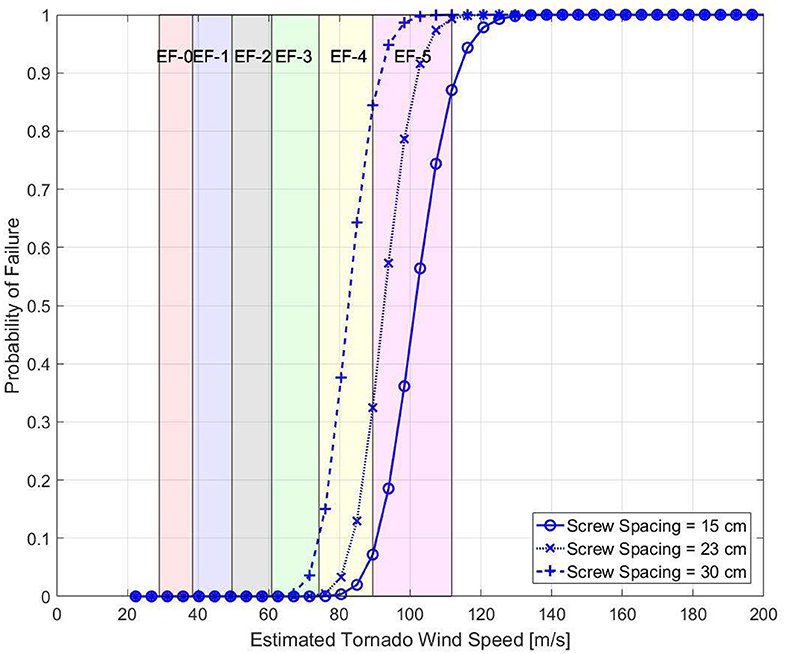
Figure 9. Variation in performance based on change in spacing of screw connections for structure 4.
The debris impact performance of the CLT structures was considered by assuming the internal pressure coefficient be enclosed for the portion of the analysis where the CLT elements resisted simulated debris impacts. The windspeed resulting in 10% probability of failure decreased by 10–15% between the simulations with 0 debris impacts and 1 debris impact. Increasing the number of debris impacts to 2 caused an additional 1–2% reduction in the windspeed resulting in 10% probability of failure. After 3 severe impacts to the structure, the performance of the archetypes remains largely unchanged with additional simulated impacts. Furthermore, simulations where the internal pressure classification was set to partially enclosed for the entirety of the simulation showed little difference compared those where 3–5 debris impacts were simulated. This indicates that while the debris impact performance may reduce the direct hazard to occupants of a structure, it may not significantly influence structural performance when only the internal pressure coefficient is considered. The response to debris impact loads may also have a negative effect on the connection or panel capacities, but were neglected in this study. Vulnerabilities such as building fenestrations may also lead to a partially enclosed structure. If sufficient coverings were applied to building fenestrations and the performance of 3-ply CLT was considered, an increase of up to 10–15% could be achieved.
Assumptions about the amount of overturning taken by the in-plane walls as a percentage of the total global overturning moment were found to have a small effect on the overall simulated performance of the structure. This is in large part due to the dominance of the component fragilities in the simulated response of the structures. When the overturning ratio was varied between 50 and 100% the change in the windspeed resulting in 10% probability of failure was only between 2 and 4% for all archetypes. This is likely because system overturning was not the most significant failure mechanism for any of the archetypes due to the relatively high ratio between the building plan dimensions and structural height. Taller, more slender structures would likely exhibit a higher vulnerability to rocking and uplift failure.
The results of the fragility analysis comparing the entire structure are shown in Figure 10 and indicate that structure Type 5 is most vulnerable to tornado events with a windspeed resulting in 10% probability of failure of 71.9 m/s (161 mph) while structure Type 6 is least vulnerable with a windspeed resulting in 10% probability of failure of 119 m/s (266 mph). Windspeed resulting in 10% probabilities of failure were found to be in the range of EF-4 level events. The increased performance observed for structure Type 6 was due to the small footprint, low roof height, relatively small panel spans, and large number of base connections per square foot. In addition, this archetype was developed specifically to maximize the performance of a CLT residential structure and demonstrates the potential for peak levels of safety achievable with CLT. The performance of all archetype structures was significantly linked to the panel spans and connection spacing associated with the structural layout. Consequently, design considerations and architectural preferences would likely have an impact on the performance of residential structures constructed using CLT.
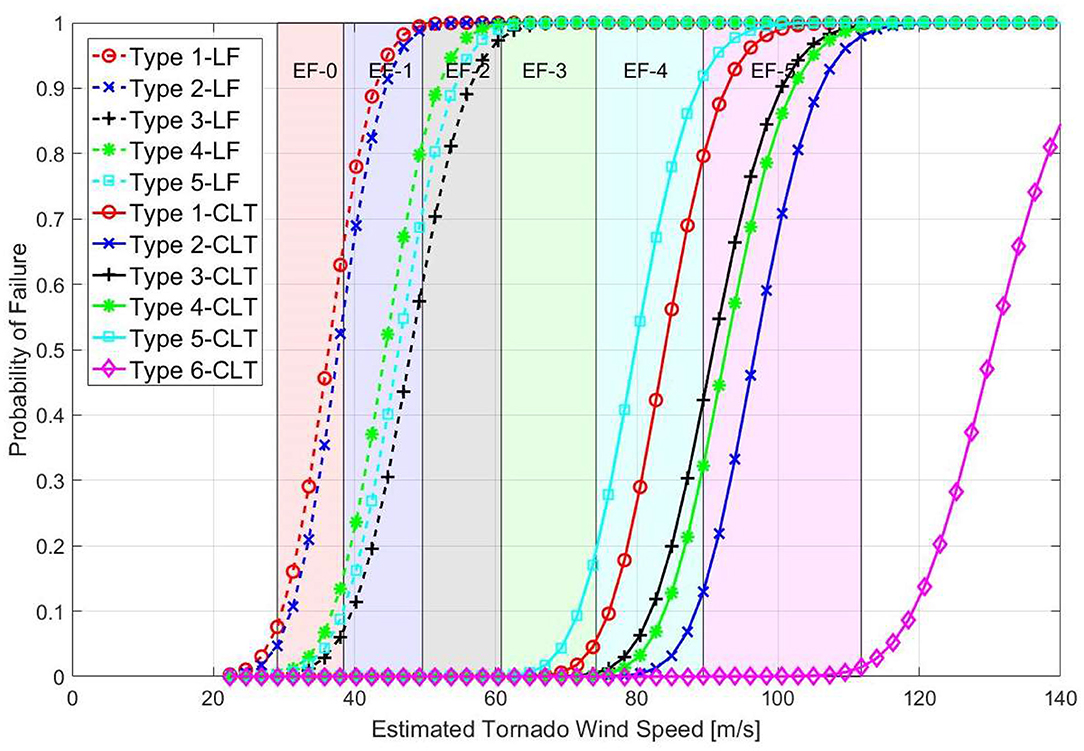
Figure 10. Simulated performance of all structure types compared to light-frame construction.
In addition to the performance of CLT archetypes, the performance of light-frame construction archetypes was plotted in Figure 10 for comparison. In the plotted fragilities, the archetypes considered 8d nails with 150 mm/150 mm (6 in/6 in) spacing and hurricane clip connections between roof trusses and wall elements with fragility parameters taken directly from the study by Amini and van de Lindt (2013). The windspeed resulting in 10% probabilities of failure increased from EF-0 and EF-1 levels to EF-4 when built with CLT instead of light-frame construction. This increase is to be expected as the volume of wood and production costs of CLT increase the overall cost of a CLT residential structure compared to one built using light-frame construction techniques. Studies concerning the feasibility of residential CLT construction estimate a 20–30% increase in the upfront cost of CLT based on the current market state of mass timber in the Denver, CO area (Burback and Pei, 2017). An analysis of the likelihood of tornado hazards would indicate whether such a premium on CLT construction would be offset by the improvement in performance.
Summary and Conclusions
The purpose of this study was to determine the potential improvement in expected performance of residential structures built using Cross-Laminated Timber subject to tornado hazards. In order to compare to previous studies on light-frame residential archetypes, a set of consistent archetypes was used to simulate a portion of the residential building stock. The design of the envelope of these structures followed applicable design standards for both gravity load and straight-line wind to produce spans and panel layouts that attempt to maximize the efficiency CLT as a panelized product. This design approach neglected the vibration and fire design of the CLT elements. Using typical connections, the probability of failure in the event of tornadoes was simulated through Monte Carlo Simulation and tornado wind analysis consistent with the procedures outlined in design recommendations was performed. Failure was controlled largely by the roof and wall components, their connections. In addition, the sliding failure played a role in the performance of the structures. Overturning and uplift of the structure did not play a significant role due to the geometry and aspect ratios of the archetypes. With taller and more slender structures, overturning and uplift would likely be a more significant failure mode. Studying the potential increases in resistance to debris impact loads associated with CLT by simulating the internal pressure coefficient (enclosed or partially enclosed based on simulation results) showed an improvement in the performance of the structures of ~10%. Analysis of the uplift and overturning fragilities showed that the amount of overturning taken by the in-plane walls as a percentage of the overall overturning moment had little effect on the final simulated fragilities. This is due to the fact that the dominant failure mechanisms were the components of the wall and roof structure as well as system sliding. Other residential structure geometries and connection types and spacings could have a higher vulnerability to system level failures of uplift and overturning.
Ultimately, the CLT archetypes used in the study were found to have experience ~10% probability of failure during EF-4 level events as compared to EF-0 and EF-1 for light-frame residential structures. By limiting spans and increasing the number of connections, performance of the residential archetypes could be further improved. The improvement in performance can be explained by the additional attention to wind design and spacing of connections as well as the inherent material properties of CLT. As much as improved performance is to be expected, the cost of CLT would be higher than traditional light-frame building techniques. Further study of the economics of CLT as a residential construction material coupled with the improved structural performance and geographic variations in hazard would give additional information about the applicability of such construction materials and techniques. In addition, empirical evidence of the performance of such structures, whether through full-scale testing or post-storm events, would be needed to further confirm Cross-Laminated Timber's performance as a residential building material subject to tornadoes.
Data Availability Statement
The datasets generated for this study are available on request to the corresponding author.
Author Contributions
This study was a collaboration between the two authors. MS performed the design, analysis, and simulation as well as conducted the experimental connection tests presented in this paper. WP oversaw the development of the simulation model and provided recommendations regarding the assumptions of the load path used in the structural modeling. All authors contributed to the article and approved the submitted version.
Funding
The authors would like to acknowledge the assistance of the United States Forest Service Grant No. 16-DG-11083150-054 and the National Science Foundation Graduate Research Fellowship Program (Grant No. 201509393) for their sponsorship of this research. Any opinions, findings, and conclusions or recommendations expressed in this material are those of the authors and do not necessarily reflect the views of the United States Forest Service or the National Science Foundation.
Conflict of Interest
The authors declare that the research was conducted in the absence of any commercial or financial relationships that could be construed as a potential conflict of interest.
References
Amini, M., and van de Lindt, J. (2013). Quantitative insight into rational tornado design wind speeds for residential wood-frame structures using fragility approach. J. Struct. Eng. 140:04014033. doi: 10.1061/(ASCE)ST.1943-541X.0000914
APA-The Engineered Wood Association (2018). Standard for Performance Rated Cross Laminated Timber. Tacoma, WA: ANSI/APA PRG, 320.
ASCE (2016). Minimum Design Loads for Buildings and Other Structures. Reston, VA: Structural Engineering Institute.
Ashley, W. S. (2007). Spatial and temporal analysis of tornado fatalities in the United States: 1880–2005. Weather Forecast. 22, 1214–1228. doi: 10.1175/2007WAF2007004.1
AWC (2018). National Design Specification for Wood Constructions (NDS). Leesburg, VA: Forest Product Association.
Burback, B., and Pei, S. (2017). Cross-laminated timber for single-family residential construction: comparative cost study. J. Build. Eng. 23:06017002. doi: 10.1061/(ASCE)AE.1943-5568.0000267
Ellingwood, B. R., and Rosowsky, D. V. (2004). Fragility assessment of structural systems in light-frame residential construction subjected to natural hazards. Structures, 130:1921–1930. doi: 10.1061/40700(2004)119
FEMA, (2015). Design and Construction Guidance for Community Safe Rooms. 2nd Edn. (Washington, DC: FEMA P-361. Federal Emergency Management Association), 374.
Folz, B., and Filiatrault, A. (2001). Cyclic analysis of wood shear walls. J. Struct. Eng. 127, 433–441. doi: 10.1061/(ASCE)0733-9445(2001)127:4(433)
Gavric, I., Fragiacomo, M., and Ceccotti, A. (2014). Cyclic behaviour of typical metal connectors for cross-laminated (CLT) structures. Mater. Struct. 48, 1841–1857. doi: 10.1617/s11527-014-0278-7
Gu, M. (2017). Strength and Serviceability Performances of Southern Yellow Pine Cross-Laminated Timber (CLT) and CLT-Glulam Composite Beam. Ph. D. Dissertation, Civil Engineering, Clemson University.
Haan, F. L., Balaramudu, V. K., and Sarkar, P. P. (2010). Tornado-induced wind loads on a low-rise building. J. Struct. Eng. 136, 106–116. doi: 10.1061/(ASCE)ST.1943-541X.0000093
Insurance Information Institute (2019). Facts + Statistics: Tornadoes and Thunderstorms. Available online at: https://www.iii.org/fact-statistic/facts-statistics-tornadoes-and-thunderstorms
Karacabeyli, E., and Douglas, B. (2013). CLT Handbook: Cross-Laminated Timber. Pointe-Claire, QC: FP Innovations.
Kopp, G. A., and Morrison, M. J. (2011). Discussion of “Tornado-induced wind loads on low-rise buildings” by F. L. Haan, V. K. Balaramudu, and P. P. Sarkar. J. Struct. Eng. 137, 1620–1622. doi: 10.1061/(ASCE)ST.1943-541X.0000309
Kreuzinger, H. (1995). “Mechanically jointed beams and columns,” in Timber Engineering – STEP 1, ed. H.J. Blaas (Almere: Centrum Hout).
Kroll Brand Rating Agency (2019). KBRA Releases Insurance Research: Insured Losses Rising for Tornadoes. Avaliable online at: https://www.marketwatch.com/press-release/kbra-releases-insurance-research-insured-losses-rising-for-tornadoes-2019-03-28 (accessed May 19, 2019).
Lee, K. H., and Rosowsky, D. V. (2005). Fragility assessment for roof sheathing failure in high wind regions. Eng. Struct. 27, 857–868. doi: 10.1016/j.engstruct.2004.12.017
Liu, J., and Lam, F. (2018). Experimental test of coupling effect on CLT angle bracket connections. Eng. Struct. 171, 862–873. doi: 10.1016/j.engstruct.2018.05.013
Lukacs, I., Björnfot, A., and Tomasi, R. (2019). Strength and stiffness of cross-laminated timber (CLT) shear walls: State-of-the-art of analytical approaches. Eng. Struct. 178, 136–14. doi: 10.1016/j.engstruct.2018.05.126
Mahdavifar, V., Barbosa, A. R., Sinha, A., Muszynski, L., Gupta, R., and Pryor, S. E. (2019). Hysteretic response of metal connections on hybrid cross-laminated timber panels. J. Struct. Eng. 145:04018237. doi: 10.1061/(ASCE)ST.1943-541X.0002222
Pei, S., Popovski, M., and Lindt, J. W. V. D. (2013). Analytical study on seismic force modification factors for cross-laminated timber buildings. Can. J. Civ. Eng. 40, 887–896. doi: 10.1139/cjce-2013-0021
Podesto, L. (2011). The coming of Cross-Laminated Timber. The Construction Specifier, Buffalo, NY, 45–55.
Popovski, M., Karacabeyli, E., and Ceccotti, A. (2011). “Seismic performance of cross-laminated timber buildings - Chapter 4,” in CLT Handbook - Cross-Laminated Timber, (Pointe-Claire, QC: FPInnovations Special Publication SP-528E, Canadian Edition).
Raymond, A. L. (2019). An exploration into tornado resistant residential CLT structures (All Theses). Clemson University. Available online at: https://tigerprints.clemson.edu/all_theses/3095
Reynolds, T., Foster, R., Bregulla, J., Chang, W.-S., Harris, R., and Ramage, M. (2017). Lateral-Load resistance of cross-laminated timber shear walls. J. Struct. Eng. 143:06017006. doi: 10.1061/(ASCE)ST.1943-541X.0001912
Roueche, D. B., Lombardo, F. T., and Prevatt, D. O. (2017). Empirical approach to evaluating the tornado fragility of residential structures. J. Struct. Eng. 143:04017123. doi: 10.1061/(ASCE)ST.1943-541X.0001854
Schneider, J., Shen, Y., Stiemer, S., and Tesfamariam, S. (2015). Assessment and comparison of experimental and numerical model studies of cross-laminated timber mechanical connections under cyclic loading. Constr. Build. Mater. 77, 197–212. doi: 10.1016/j.conbuildmat.2014.12.029
Shahnewaz, M., Popovski, M., and Tannert, T. (2019). Resistance of cross-laminated timber shear walls for platform-type construction. J. Struct. Eng. 145:04019149. doi: 10.1061/(ASCE)ST.1943-541X.0002413
Shahnewaz, M., Tannert, T., Popovski, M., and Alam, M. (2018). “Deflection of CLT Shear Wals in Platform Construction,” in Proceedings World Conference on Timber Engineering. (Seoul: WCTE).
Simpson Strong Tie (2019). Wood Construction Connectors. Avaliable online at: https://www.strongtie.com/resources/literature/wood-construction-connectors-catalog (accessed March 06, 2019).
Standohar-Alfano, C. D., Freyne, S., Graettinger, A. J., Floyd, R. W., and Dao, T. N. (2015). Performance of residential shelters during the May 20, 2013, Tornado in Moore, Oklahoma. J. Perform. Constr. Fac. 29:04014143. doi: 10.1061/(ASCE)CF.1943-5509.0000636
Keywords: tornado, cross-laminated timber, structural performance, load path, fragility analysis, residential construction
Citation: Stoner M and Pang W (2020) Simulated Performance of Cross-Laminated Timber Residential Structures Subject to Tornadoes. Front. Built Environ. 6:88. doi: 10.3389/fbuil.2020.00088
Received: 25 February 2020; Accepted: 14 May 2020;
Published: 23 June 2020.
Edited by:
Gregory Alan Kopp, University of Western Ontario, CanadaReviewed by:
David Brett Roueche, Auburn University, United StatesChristian Málaga-Chuquitaype, Imperial College London, United Kingdom
Copyright © 2020 Stoner and Pang. This is an open-access article distributed under the terms of the Creative Commons Attribution License (CC BY). The use, distribution or reproduction in other forums is permitted, provided the original author(s) and the copyright owner(s) are credited and that the original publication in this journal is cited, in accordance with accepted academic practice. No use, distribution or reproduction is permitted which does not comply with these terms.
*Correspondence: Weichiang Pang, d3BhbmdAY2xlbXNvbi5lZHU=