 Nipun D. Nath1
 Amir H. Behzadan2*
- 1Zachry Department of Civil Engineering, Texas A&M University, College Station, TX, United States
- 2Department of Construction Science, Texas A&M University, College Station, TX, United States
Sensing and reality capture devices are widely used in construction sites. Among different technologies, vision-based sensors are by far the most common and ubiquitous. A large volume of images and videos is collected from construction projects every day to track work progress, measure productivity, litigate claims, and monitor safety compliance. Manual interpretation of such colossal amounts of data, however, is non-trivial, error-prone, and resource-intensive. This has motivated new research on soft computing methods that utilize high-power data processing, computer vision, and deep learning (DL) in the form of convolutional neural networks (CNNs). A fundamental step toward machine-driven interpretation of construction site scenery is to accurately identify objects of interest for a particular problem. The accuracy requirement, however, may offset the computational speed of the candidate method. While lightweight DL algorithms (e.g., Mask R-CNN) can perform visual recognition with relatively high accuracy, they suffer from low processing efficacy, which hinders their use in real-time decision-making. One of the most promising DL algorithms that balance speed and accuracy is YOLO (you-only-look-once). This paper investigates YOLO-based CNN models in fast detection of construction objects. First, a large-scale image dataset, named Pictor-v2, is created, which contains about 3,500 images and approximately 11,500 instances of common construction site objects (e.g., building, equipment, worker). To assess the agility of object detection, transfer learning is used to train two variations of this model, namely, YOLO-v2 and YOLO-v3, and test them on different data combinations (crowdsourced, web-mined, or both). Results indicate that performance is higher if the model is trained on both crowdsourced and web-mined images. Additionally, YOLO-v3 outperforms YOLO-v2 by focusing on smaller, harder-to-detect objects. The best-performing YOLO-v3 model has a 78.2% mAP when tested on crowdsourced data. Sensitivity analysis of the output shows that the model's strong suit is in detecting larger objects in less crowded and well-lit spaces. The proposed methodology can also be extended to predict the relative distance of the detected objects with reliable accuracy. Findings of this work lay the foundation for further research on technology-assistive systems to augment human capacities in quickly and reliably interpreting visual data in complex environments.
Introduction
The emerging field of artificial intelligence (AI) has been disrupting the construction industry for several years. From planning to execution, the profound use of AI is steadily leading the industry toward automation and autonomous systems. Example includes but are not limited to machine-generated project planning for estimation of project cost (Cheng et al., 2010), or designing the site layout (Yahya and Saka, 2014), automated monitoring of construction activities and safety of workers (Ding et al., 2018; Nath et al., 2018, 2020), and deployment of robots to perform construction tasks (Bock, 2015). While new sensing techniques are used for collecting multi-modal data, digital photography (using cameras, or mobile devices such as smartphones and tablet computers) is by far one of the most common ways of documenting fieldwork. Given the content richness and visual diversity captured in photos or videos, visual data can be used to generate progress reports and request for information (RFI), conduct quality control, monitor crew productivity, manage resource deployment, perform safety training, and litigate claims. Traditionally, manual scanning and sorting by human experts has been the most common method of organizing and storing the large volume of construction imagery. However, with the advent of smartphones, drones, and other personal devices with network connectivity, the number of digital images and videos has exponentially increased, rendering traditional manual solutions extremely resource-intensive and inefficient. AI-assisted tools have the potential to address this problem with increased accuracy and timeliness. Examples include retrieving a particular set of images from a larger collection (a.k.a., content retrieval) based on user-defined criteria or visual cues (e.g., presence of a specific type of equipment). The key limitation of existing visual sensing technologies is that images captured from digital cameras contain only timestamp (date and time) data and sometimes geolocation tags that offer limited insight into the actual content of the captured scene. Enriching images with AI-generated metadata tags denoting content (e.g., object types and their interactions) and appearance (e.g., color, context) of the captured scene can significantly broaden the scope of content retrieval and the subsequent applications of digital imagery.
The ability to detect objects in a complex scene is the first and foremost important step in comprehending and analyzing the context (i.e., layout, structure) of the scene and determining spatial, functional, and semantic relationships among those objects. This process is also referred to as scene understanding (Li et al., 2009), which is the cornerstone of almost all machine-driven autonomous systems. For example, in autonomous construction, unmanned vehicles must identify and avoid obstacles to secure an accident-free path to their destinations. Similarly, robots performing construction tasks (e.g., lifting concrete blocks, tying rebar, laying bricks) need to identify specific objects (e.g., concrete block, rebar, brick) to lift and work with. In computer vision, object detection is defined as localizing an object in an image and classifying the region into one of the pre-defined categories. Previous research on object detection, particularly in the construction domain, has primarily focused on detecting only a limited number of objects for specific applications. Examples include the detection of guard rails (Kolar et al., 2018) and hard hats (Park et al., 2015; Shrestha et al., 2015).
This study aims at laying out a framework for detecting the most common types of construction objects, namely, buildings, equipment, and workers. The designed framework can provide a foundation for other applications. For instance, detecting a building envelope with high accuracy in an image or video frame can help narrow down the candidate region for searching for building components (e.g., beams, columns, walls) to monitor interior work progress, or to check structural integrity. Likewise, equipment and workers can be individually detected and analyzed over time to perform productivity analysis, resource allocation, and safety monitoring. While a detailed discussion on various innovative ways to utilize construction-related object detection is out of the scope of this study, a particular use case of utilizing the proposed object detection framework to predict the relative distance between objects from the video stream of a surveillance camera for safety monitoring is briefly discussed.
Evidently, in some applications, the ability to detect objects in “real-time” (or near real-time) is critical. For example, real-time detection of unsafe behavior such as a human crew working in close proximity of a site hazard (e.g., high voltage line) or moving object (e.g., truck, excavator) is of the essence to preventing potential accidents (Han et al., 2012; Li et al., 2015). Also, in order to track object movements in a live video feed, it is necessary to have an extremely fast algorithm that can repeatedly process each video frame and detect all objects of interest in the current frame before the next frame arrives. A good example is event-triggered safety alert systems that require close to zero lag from the time an unsafe behavior is observed (i.e., sensed) to when an alert is generated. Another practical example underlining the importance of real-time visual data handling is when the cost of offline data processing is high or there is not enough capacity to store all captured information for later processing. In many construction projects, a large volume of video data from multiple on-site cameras is continuously recorded to monitor safety and work progress (Chi and Caldas, 2011). To uninterruptedly analyze these videos and generate reports in a timely manner, substantial investment in computational and storage resources is required. In this case, processing collected data in real time (i.e., online) and upfront filtering of non-essential data are desired. A fast algorithm that is less dependent on heavy computing power can significantly reduce upfront costs while allowing users to run applications on mobile devices (e.g., smartphones, tablets) and lightweight drones (Kyrkou et al., 2018). In light of these practical considerations, the research presented in this paper prioritizes the algorithms that can perform real-time object detection.
A precursor to achieving the best results with fast and light AI algorithms is to train them on relevant and useful data. In supervised machine learning (ML), the quality of data is defined by how well it has been annotated for model training. Due to the scarcity of publicly available, large-scale, domain-specific, annotated dataset of construction imagery, this paper also introduces a systematic approach to visual data collection through crowdsourcing and web-mining and annotating the dataset for AI model training. To note, similar crowdsourcing methods have been successfully used to develop large-scale datasets such as ImageNet (Deng et al., 2009) and Visual Genome (Krishna et al., 2017). Since the AI model should be trained with a diverse dataset so that it can detect objects of different appearances in the real-world scenarios, the training and testing images are collected from diverse sources (e.g., from multiple real-world projects and numerous websites) so that the dataset covers a wide range of appearance of construction-related objects. The developed dataset, named Pictor-v2, contains instances of building, equipment, and worker objects. To promote and advance automation in construction, the crowdsourced portion of Pictor-v2 and the fully trained models are publicly available to other researchers and developers to build their own visual data-driven AI-based applications.
Literature Review
State-of-the-Art Techniques
Past research on construction object/material detection mostly relies on hand-crafted features extracted from digital images to identify specific visual contents. Examples include Zou and Kim (2007) who used the hue, saturation, and value (HSV) color space to detect excavators in construction site images. In particular, a threshold value for saturation was used to differentiate a relatively vibrant object (i.e., excavator) from the achromatic background (e.g., dark soil, or white snow). Brilakis et al. (2005) and Brilakis and Soibelman (2008) proposed a method to detect shapes (e.g., column, beam, wall) in an image and analyze the texture of the detected region to identify different construction materials (e.g., steel, concrete). Wu et al. (2009) applied Canny edge detection (Canny, 1987) and watershed transformation techniques (Beucher, 1992) to detect column edges, followed by an object reconstruction method, to locate and quantify the number of columns present in an image. Given a query image, Kim et al. (2016) employed scene-parsing technique (Liu et al., 2011) to find the best-matching candidate images from a database of labeled images and transfer the labels from the candidate images to the query image to identify different construction objects in the query image.
The introduction of ML algorithms considerably broadened the scope of object recognition applications in the construction domain. Examples include Dimitrov and Golparvar-Fard (2014) and Han and Golparvar-Fard (2015) who used one-vs-all multi-class support-vector-machine (SVM) (Weston and Watkins, 1998) to classify around 20 types of construction materials. To classify different moving objects (e.g., workers, loaders, backhoes), Chi and Caldas (2011) performed background subtraction (Li et al., 2003), followed by applying Naïve Bayes (NB), and neural network (NN) classifiers on the foreground region. Son et al. (2014) investigated a voting-based ensemble classifier combining several base classifiers (e.g., SVM, NN, NB, decision tree, logistic regression, and k-nearest neighbor) to identify construction materials (e.g., concrete, steel, wood) in an image.
Traditional ML algorithms require careful and meticulous engineering of fallible features that are only relevant to specific tasks and set of classes (Kolar et al., 2018). However, for content-rich construction photos that cover a large visual field containing diverse and complex categories of objects in various ambient conditions (e.g., lighting, landscape), automatic feature extraction methods are more practical. Particularly, convolutional neural network (CNN)-based deep learning (DL) algorithms are gaining more traction due to their ability to self-learn features from a given dataset without demanding exorbitant computational power (LeCun et al., 1998; Kolar et al., 2018). A precursor to the modern CNN algorithms was proposed by LeCun et al. (1998) to recognize handwritten digits in an image. More recent CNN models are capable of classifying images into 1000 different categories (Krizhevsky et al., 2012; Simonyan and Zisserman, 2014) or identifying 9000 different object types in images (Redmon and Farhadi, 2017). Nonetheless, these models are limited to detecting only everyday objects (e.g., French fries, printer, umbrella, bicycle, dog). Within the construction domain, the existing literature that has documented the use of CNN for visual recognition is primarily focused on construction safety. Examples include Kolar et al. (2018) who used CNN to detect safety guardrails, Siddula et al. (2016) who combined the Gaussian mixture model (GMM) (Zivkovic, 2004) with CNN to detect objects in roof construction, and Ding et al. (2018) who integrated the long short-term memory (LSTM) model (Hochreiter and Schmidhuber, 1997) with CNN to recognize unsafe behavior (e.g., climbing a ladder) of construction workers. However, to date, there are only limited studies that have investigated the problem of detecting common construction objects for general applications. This research aims at developing a CNN-based methodology for high-accuracy detection of three general object classes (e.g., building, equipment, and worker) in complex construction scenes.
Overview of Fast Object Detection Algorithms
Region-based CNN (a.k.a. R-CNN) (Girshick et al., 2014) is among the most prevailing examples of state-of-the-art algorithms for object detection. R-CNN uses selective search to identify regions of interest (RoI), followed by using CNN to extract features from each region, and finally applying SVM to classify the object in that region (Girshick et al., 2014; Girshick, 2015). However, due to excessive time and space requirements to run this algorithm, faster variants of it, e.g., Fast R-CNN (Girshick, 2015) and Faster R-CNN (Ren et al., 2017) have been proposed. Faster R-CNN is composed of a Region Proposal Network (RPN), which is a fully convolutional network for proposing ROIs, followed by Fast R-CNN for final object detection (Ren et al., 2017). While R-CNN and Fast/Faster R-CNN output rectangular bounding box for each detected object, another variant of R-CNN, namely, Mask R-CNN (He et al., 2017), can output segmentation masks of irregular shape. In particular, Mask R-CNN has an extra branch to output the segmentation masks in addition to the existing branches of Faster R-CNN that output classification labels and bounding boxes (He et al., 2017). Another variant, namely, region-based fully convolutional network (R-FCN), eliminates computationally extravagant fully connected layers and uses only convolution for faster yet accurate detection of objects (Dai et al., 2016). Kim et al. (2018) used R-FCN to detect different types of construction equipment. Unlike region proposal-based methods, YOLO (You-Only-Look-Once) (Redmon et al., 2016) and SSD (Single Shot MultiBox Detector) (Liu et al., 2016) algorithms couple the classification and localization tasks into a single neural network, thus significantly reducing the computational burden. Accordingly, a comparison of the performance of different algorithms performed by Liu et al. (2016) reveals that only the YOLO (Redmon et al., 2016; Redmon and Farhadi, 2017) algorithm can perform detection in real time and, hence, fulfills the implementation requirements of this study. In the construction domain, YOLO is used for detecting construction machines (e.g., truck and excavator) (Xiao and Kang, 2019) and personal protective equipment (e.g., hard hat and vest) (Nath et al., 2020).
As illustrated in Figure 1, YOLO first divides the input image into an S × S grid and predicts M bounding boxes of different shapes (a.k.a., anchor boxes) for each grid cell, each defined by N+5 values where N is the number of classes. The values tx, ty, tw, and th are associated with x- and y-coordinates of the center, as well as the width and height of the box. The value p0 (a.k.a., objectness score) represents the probability of the presence of an object inside the bounding box. The remaining values are N conditional probabilities, P(Ci|object), each indicating the probability that an object belongs to a class Ci where i = 1, .., N, if such object is present inside the box. In total, the algorithm outputs S × S × M boxes (Redmon et al., 2016). However, often multiple output boxes represent the same object in the input image. Therefore, to eliminate duplication in the inference phase, YOLO uses a non-maximum suppression (NMS) technique (Girshick et al., 2014; Redmon et al., 2016; Redmon and Farhadi, 2017) to discard redundant boxes with lower confidence levels but higher percentage of overlapping, and preserving a single bounding box for a single corresponding object.
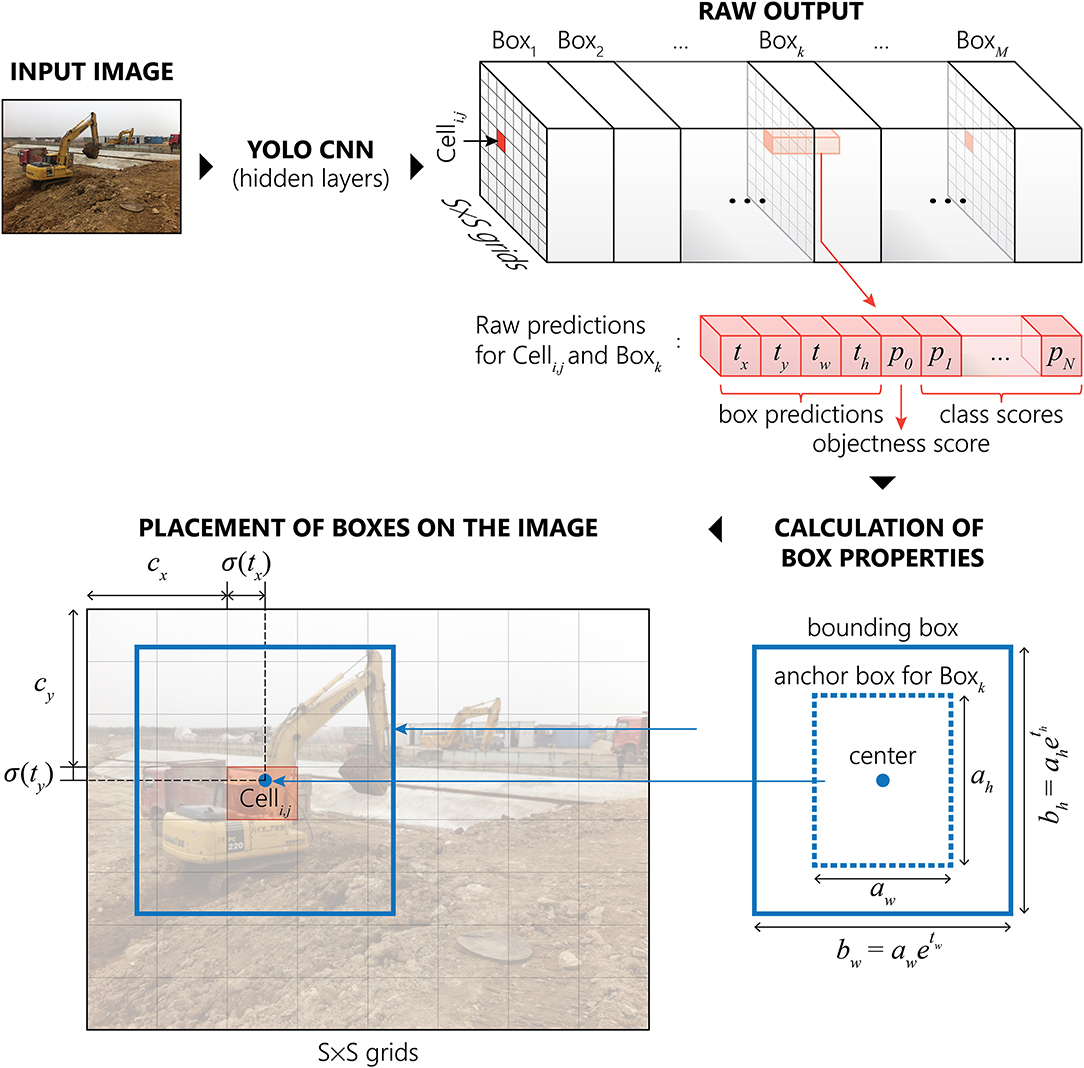
Figure 1. Schematic diagram of the YOLO algorithm.
In this study, the authors use two different variations of the YOLO architecture, namely, YOLO-v2 (Redmon and Farhadi, 2017) and YOLO-v3 (Redmon and Farhadi, 2018). Both models take a 416 × 416 RGB image as input. However, YOLO-v2 has one output layer, and it divides the input image into 13 × 13 grids and predicts five anchor boxes for each grid cell. In contrast, YOLO-v3 has three output layers for three different scales of objects (large, medium, and small), each dividing the input images into 13 × 13 grids (for large objects), 26 × 26 grids (for medium objects), and 52 × 52 grids (for small objects), respectively. Each of the three output layers predicts three anchor boxes for each grid cell in the corresponding layers, resulting in a total of nine anchor boxes.
Image Dataset
There are a number of publicly available large-scale datasets that contain annotated images of common everyday objects. For example, the ImageNet dataset contains 3.2 million images of 5,247 categories of objects (Deng et al., 2009). The PASCAL (pattern analysis, statistical modeling, and computational learning) VOC (visual object class) 2012 dataset (Everingham et al., 2010) contains 20 categories of objects in ~21,000 images. Microsoft's COCO (common objects in context) dataset contains 328,000 images with 2.5 million instances of 91 different types of objects (Chen et al., 2015). However, there are few (relatively smaller) image datasets that are specific to the construction domain. For example, Chi and Caldas (2011) used 750 images for training and 1,282 images for testing. Dimitrov and Golparvar-Fard (2014) developed a dataset of 3,000 material samples, and Kim et al. (2016) used 169 images for training and 42 images for testing.
Although object classes (i.e., categories) in large-scale publicly available datasets (e.g., ImageNet, VOC, COCO) might not be relevant to construction applications, the dataset itself is knowingly useful, particularly for transfer learning. In this method, a DL model is pre-trained on a larger dataset (a.k.a., source dataset), potentially with different labels, and then retrained with some constraints for a new and, generally, smaller dataset (a.k.a., target dataset) (Oquab et al., 2014). Transfer learning is widely used across various DL-based applications and yields significantly better results despite the potential difference between the inputs (image and class labels) of source and target datasets (Oquab et al., 2014). In particular, transfer learning allows a model to learn mid-level features (e.g., edges, shapes, colors) from the source dataset that are likewise relevant and useful for distinguishing different classes in the target dataset (Oquab et al., 2014). In this paper, the authors utilize transfer learning by pre-training all models on a large-scale image dataset. The COCO dataset (Chen et al., 2015) is of particular interest since it contains classes (e.g., person, truck) and contexts (e.g., outdoor) that are visually similar to some of the target classes (e.g., worker, equipment) and the environment conditions present in many construction site images.
Problem Statement and Contributions to the Body of Knowledge
The review of literature highlights the limited number of studies that have investigated the problem of detecting common construction objects for general applications. Moreover, current research in this area lacks a thorough investigation of crowdsourced image collection (in addition to web mining) to build training data for DL models. Furthermore, the trade-off between detection speed and accuracy needs to be thoroughly investigated since a faster model (i.e., YOLO) may pose weaknesses especially when tested under different conditions. Understanding YOLO's strengths and weaknesses can help assess the practicality of using it in high-stake applications, e.g., construction safety. Moreover, it can also provide insight into ways to improve the performance of object detection task for particular domains. Therefore, this research aims at investigating these issues through developing an image dataset and a visual recognition methodology (based on YOLO) for high-accuracy detection of three general object classes (e.g., building, equipment, and worker) in complex construction scenes. Furthermore, since in some applications (e.g., construction safety) object distances (in absolute or relative terms) can add critical information, this study also presents a technique to estimate relative distances of detected objects by applying YOLO to monocular images. In summary, the contributions of this work are as follows:
1. Develop a large image dataset of construction objects through crowdsourcing and web-mining.
2. Restructure the YOLO model to detect three common classes of objects, e.g., building, equipment, and worker, in construction sites.
3. Compare the performance of YOLO-v2 and YOLO-v3, two versions of the YOLO algorithm.
4. Examine the outcome of combining crowdsourced and web-mined images to train and test the models.
5. Investigate the strengths and weaknesses of the YOLO model in detecting construction objects of different sizes and in environments with varying levels of crowdedness and lighting conditions.
6. Discuss potential ways to improve the performance of the YOLO model by taking into account the revealed weaknesses.
7. Propose and validate a methodology to predict relative distances of objects detected by the YOLO model in monocular images.
8. Publish the crowdsourced dataset and all trained models and make the training code open source for future research.
Methodology
The developed methodology is illustrated in Figure 2 and explained in the following subsections.
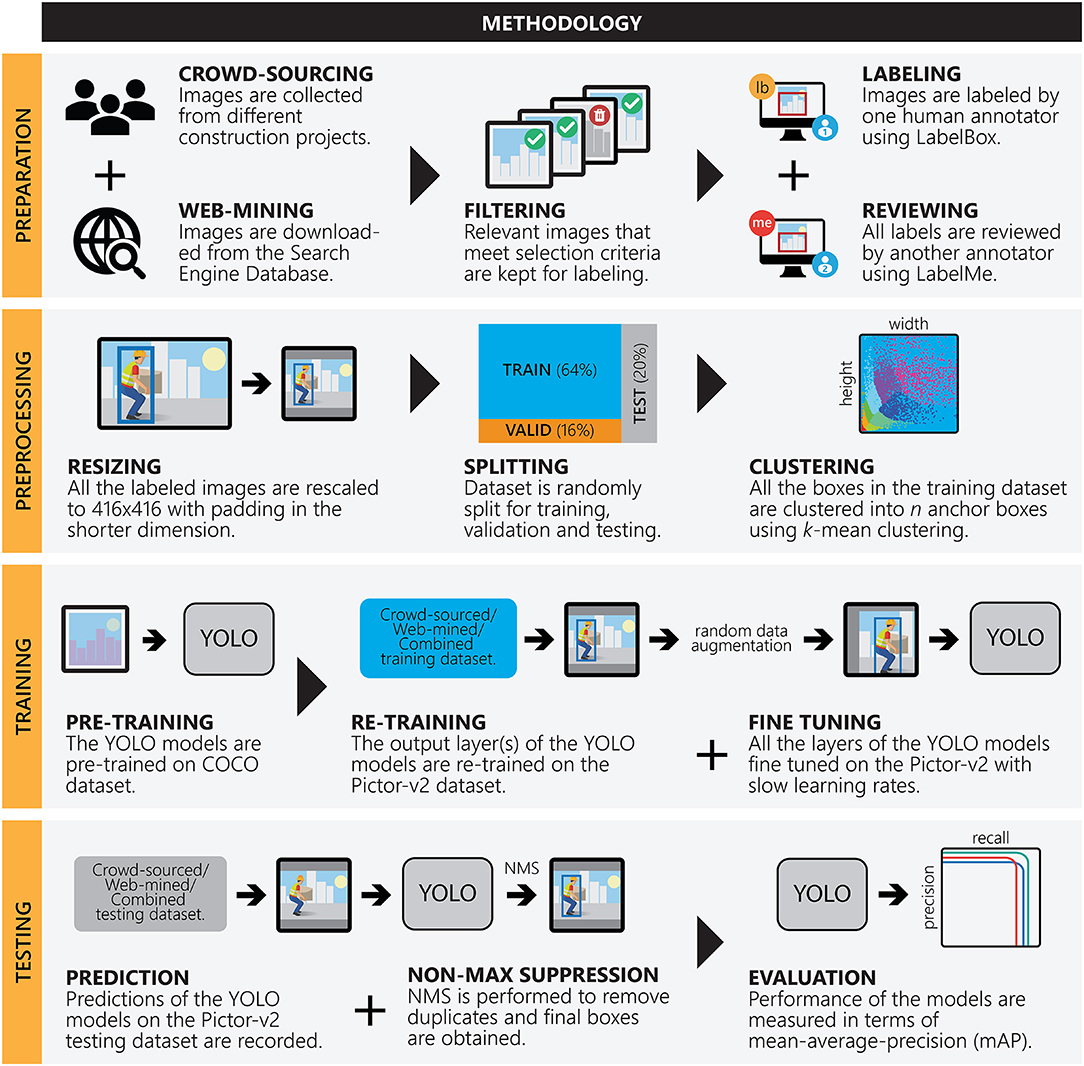
Figure 2. Schematic diagram of the designed framework.
Dataset Preparation
The annotated image dataset, Pictor-v2, used in this study contains buildings, equipment, and worker objects. This dataset is created by crowdsourcing (Yuen et al., 2011) and web-mining (Kosala and Blockeel, 2000). Crowdsourced images are collected from three different construction projects, and web-mined images are collected by scraping photos from Google Images (Deng et al., 2009). Keywords used for retrieving images from Google include “building under construction,” “construction equipment,” “truck,” “dozer,” “excavator,” “crane,” and “construction worker.” To obtain a cleaner dataset, irrelevant images are discarded and only relevant images are labeled by a human annotator using a web-based annotation toolbox, LabelBox (Labelbox, 2019). Next, following the VOC's annotation protocol (Everingham et al., 2010), all images are reviewed for completeness and all instances are revised for correctness (if necessary) by a second human annotator using an offline annotation toolbox, LabelMe (Russell et al., 2008). It must be noted that while the reason behind the employment of two human annotators is to minimize subjective bias, the choice of two different toolboxes is entirely based on annotators' personal preferences and does not influence the annotation outcome.
Dataset Pre-processing
Since YOLO takes 416 × 416 images as input, all images in the Pictor-v2 dataset are resized to 416 × 416 using bi-cubic interpolation (Zhang et al., 2011). During resizing, the original aspect ratio is preserved by padding the image equally in both sides along the shorter dimension. Next, each of the crowdsourced and web-mined datasets is randomly split into training, validation, and testing subsets containing mutually exclusive 64, 16, and 20% of the entire dataset, respectively. The corresponding subsets (training, validation, and testing) of crowdsourced and web-mined datasets are then merged to form the third combination, namely, the “combined” subset. Next, k-means clustering (Redmon and Farhadi, 2017) is performed on all the rectangular boxes in the training dataset of each combination to obtain the desired number of anchor boxes.
Dataset Description
Figure 3 shows the number of images and number of instances per class in the Pictor-v2 dataset. For example, a total of 1,105 crowdsourced images are collected; among them, 604 images contain building, 462 images contain equipment, and 822 images contain worker. Among the 604 images that contain building, 135 contain only building (no equipment or worker), 119 contain both building and equipment (no worker), 144 contain building and worker (no equipment), and 206 contain all three classes. Of note, a single image may contain multiple instances of building, equipment, or worker. In total, there are 1,821 instances of building, 1,180 instances of equipment, and 2,611 instances of worker in the crowdsourced images of the Pictor-v2 dataset. Also, as shown in Figure 3A, there are 2,110 instances of building, 1,593 instances of equipment, and 2,257 instances of worker in the web-mined images of the Pictor-v2 dataset. The number of images for each class in the randomly split training, validation, and testing subsets of the crowdsourced and web-mined Pictor-v2 dataset is shown in Figure 3B. For example, in a total of 604 crowdsourced images that contain the building class, 388 (64%), 93 (15%), and 123 (20%) images are used for training, validation, and testing, respectively.
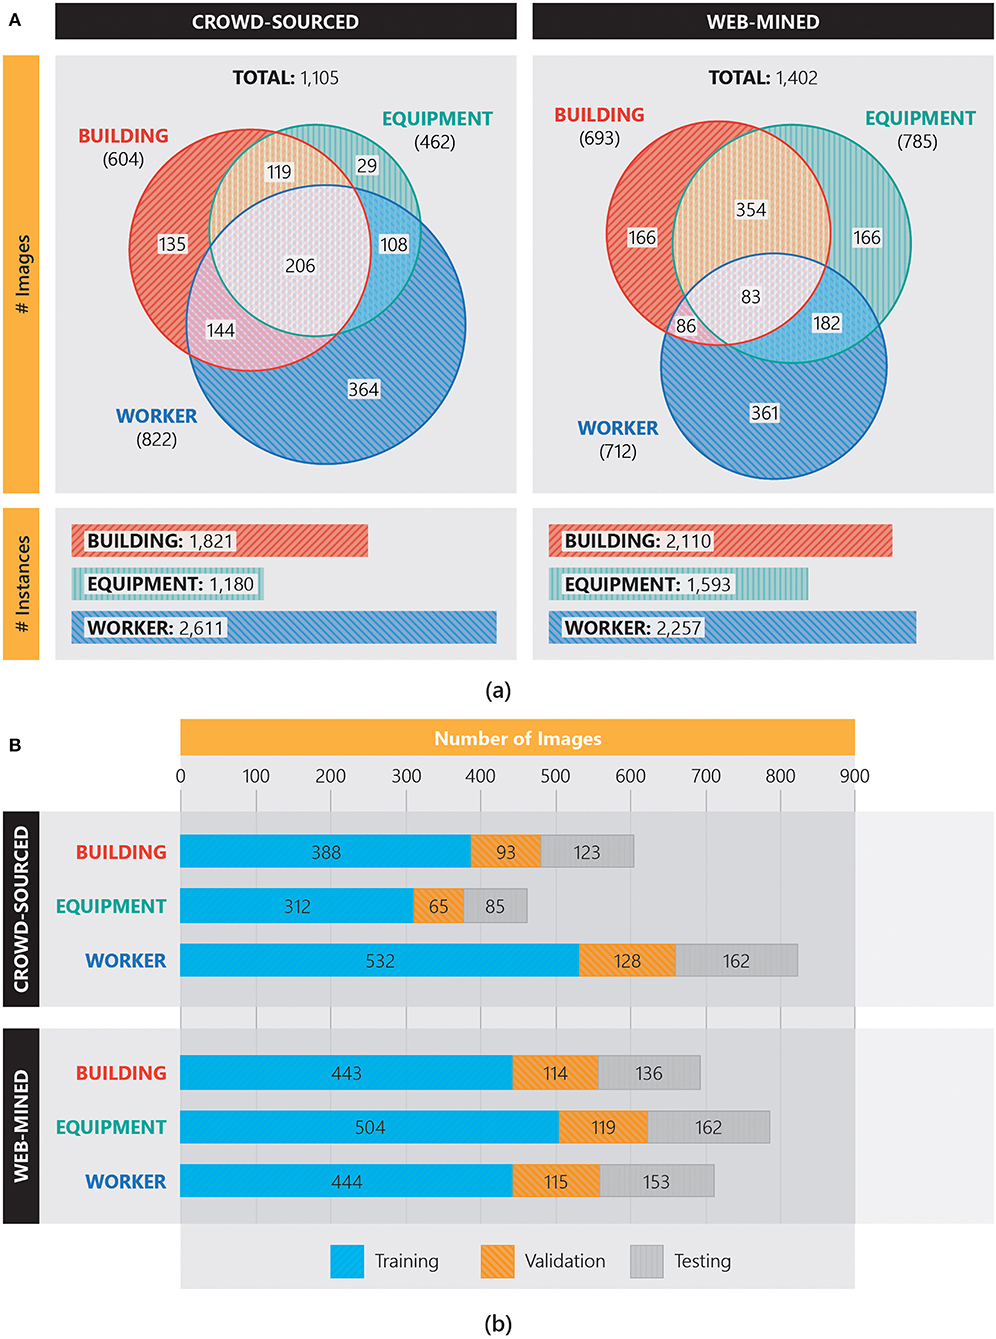
Figure 3. Number of images (A) per class labels retrieved through crowdsourcing and web-mining in the Pictor-v2 dataset, and (B) in the training, validation, and testing datasets.
Examples of annotated crowdsourced and web-mined images with ground-truth boxes are shown in Figure 4. As shown in this figure, the class “building” includes building under construction, fully constructed building, reinforced-concrete building, steel building, and timber building. Similarly, the class “equipment” contains excavator, dozer, truck, crane, and other miscellaneous types of equipment commonly found in construction sites. Also, any human (not necessarily construction worker) in the Pictor-v2 dataset is assigned to the “worker” class since anticipated applications (e.g., safety) developed using this dataset are expected to be used to detect any person present in the construction site.
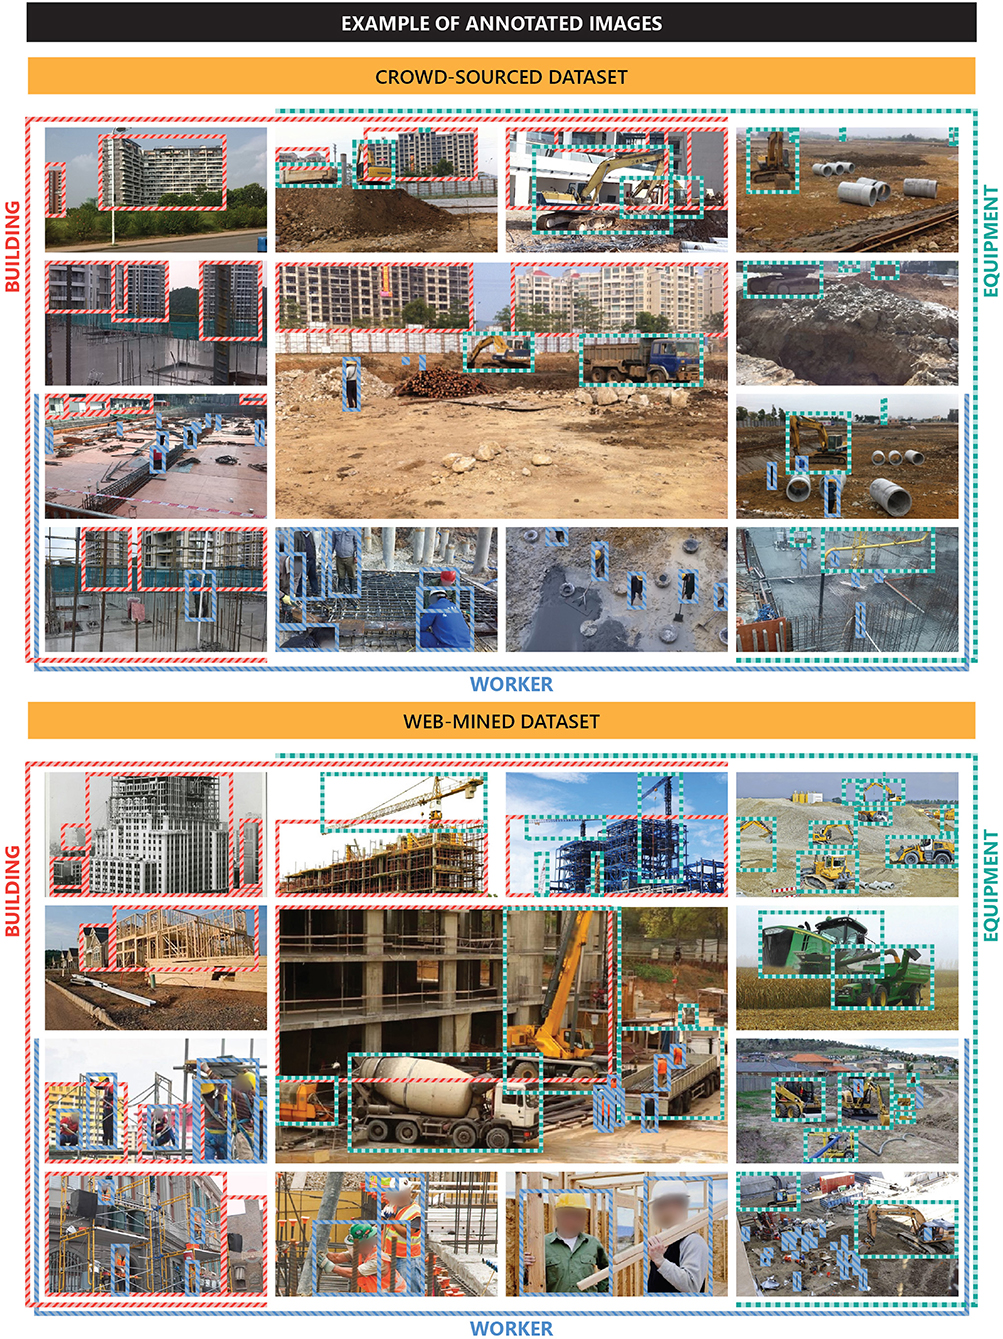
Figure 4. Sample crowdsourced and web-mined images with ground-truth boxes in the Pictor-v2 dataset.
Model Training
As previously stated, all YOLO models are pre-trained on the COCO dataset (Chen et al., 2015). Following pre-training, only output layer(s) of the models are retrained (while all other layers are frozen) on the training dataset of each combination for 25 epochs with a learning rate of 10−3 using Adam (Kingma and Ba, 2014) optimizer. Next, all layers are fine-tuned with a slower learning rate using the same optimizer. To avoid overfitting, during the fine-tuning phase, the loss on the validation data is continuously monitored and the learning rate is adjusted accordingly by maintaining the following protocol: the fine-tuning phase is started with an initial learning rate of 10−4; if the validation loss does not decrease for three consecutive epochs, the learning rate is reduced by half; if the validation loss does not decrease for 10 consecutive epochs, the training is stopped. Additionally, during the re-training and fine-tuning phases, traditional data augmentation (e.g., translation, zoom in/out, horizontal flipping, and change of hue, saturation, and brightness of the image) (Perez and Wang, 2017) is performed.
Model Testing
In the testing phase of each YOLO model, predicted values in the output layer(s) are converted to rectangular boxes, as shown in Figure 1, and subsequently, NMS (Girshick et al., 2014; Redmon et al., 2016; Redmon and Farhadi, 2017) is performed to eliminate redundant and duplicate boxes. Next, performance of each model is measured using a commonly used metric in object detection (and information retrieval), mean average precision (mAP), a single numerical value that represents the effectiveness of the entire system (Turpin and Scholer, 2006; Ren et al., 2017). To calculate mAP, first, intersection over union (IoU), i.e., the percentage of overlap between ground-truth boxes and predicted boxes (Nath et al., 2020), is measured using Equation (1) where G and P are the ground-truth and predicted boxes, respectively.
Next, all detections are ranked in order of their corresponding confidence level. This is followed by moving through the ranked sequence, from the highest to the lowest confidence level, and calculating the precision and recall values, using Equations (2) and (3), at each position for a particular class. TP, FP, and FN refer to true positive (correctly classified to the class), false positive (incorrectly classified to the class), and false negative (incorrectly classified to other class), respectively. In object detection, TP, FN, and FP are calculated by comparing the IoU against a threshold value (e.g., 50%) (Nath et al., 2020).
Next, for each class, average precision (AP) is calculated using Equation (4), where n is the total number of detections, i is the rank of a particular detection in the list sorted in descending order of confidence, p(i) is the precision of the sub-list ranged from 1st to ith detection, and r(i) is the change in recall from (i−1)th to ith detection. Finally, mAP is estimated by calculating the mean of APs of all possible classes.
Example of Model Deployment for Object Detection and Depth Estimation
As mentioned earlier, the model can be deployed in different ways to monitor progress and safety in construction sites. An example of such applications is predicting the relative distance of detected objects (e.g., equipment and workers). This distance can be further analyzed to identify imminent collisions between objects. Researchers have previously used stereo cameras, e.g., Microsoft Kinect (Smisek et al., 2013) and Vicon 3D (Pfister et al., 2014) (a.k.a. stereo-vision), or images captured from multiple views by a single camera or multiple cameras (a.k.a. multi-vision) to determine the distance between objects. Other applications of stereo- or multi-vision cameras include but are not limited to analyzing posture by detecting the positions of skeleton joints (Plantard et al., 2015), 3D reconstruction (Chen et al., 2019) of infrastructure (Brilakis et al., 2011) and deformed surfaces (Tang et al., 2019), matching construction resources (e.g., equipment and worker) that appeared in multiple camera views (Zhang et al., 2018), navigation of robots in rough terrains (Chilian and Hirschmüller, 2009), and simultaneous detection and tracking of multiple objects (e.g., equipment and worker) (Zhu et al., 2017). However, stereo cameras have a short range of view and may perform poorly in the presence of bright lights, low texture, occlusion, and surface reflection (Chen et al., 2014; O'Riordan et al., 2018). Therefore, more recent research has looked into ways to obtain an equivalent performance in 3D depth measurement from a single camera. For example, Godard et al. (2017) used DL models to generate depth maps from monocular images, and Kim et al. (2019) used homographic (i.e., perspective to orthographic) transformation of images captured by an unmanned aerial vehicle (UAV) to determine the proximity of objects.
One of the major challenges in training, deploying, and testing models for the purpose of safety monitoring is to obtain a high-quality, balanced (i.e., containing an equal number of samples for each possible scenarios) dataset that contains a large number of accurately labeled images (Wuest et al., 2016). For the specific case of safety monitoring, however, for reasons such as underreporting, privacy, and maintaining positive social and corporate image, there are significantly fewer public images of “unsafe” encounters than there are of “safe” encounters, making it a challenge to create balanced datasets representing both unsafe and safe encounters between workers and equipment. The literature suggests the use of synthetic images (i.e., overlaying 3D models on real-world images) as a potential remedy to this problem and to test model performance (Soltani et al., 2016). Building upon these studies, the authors generated synthetic images by plotting 3D models of workers at various positions of a real-world scene of a construction site (Figure 5A).
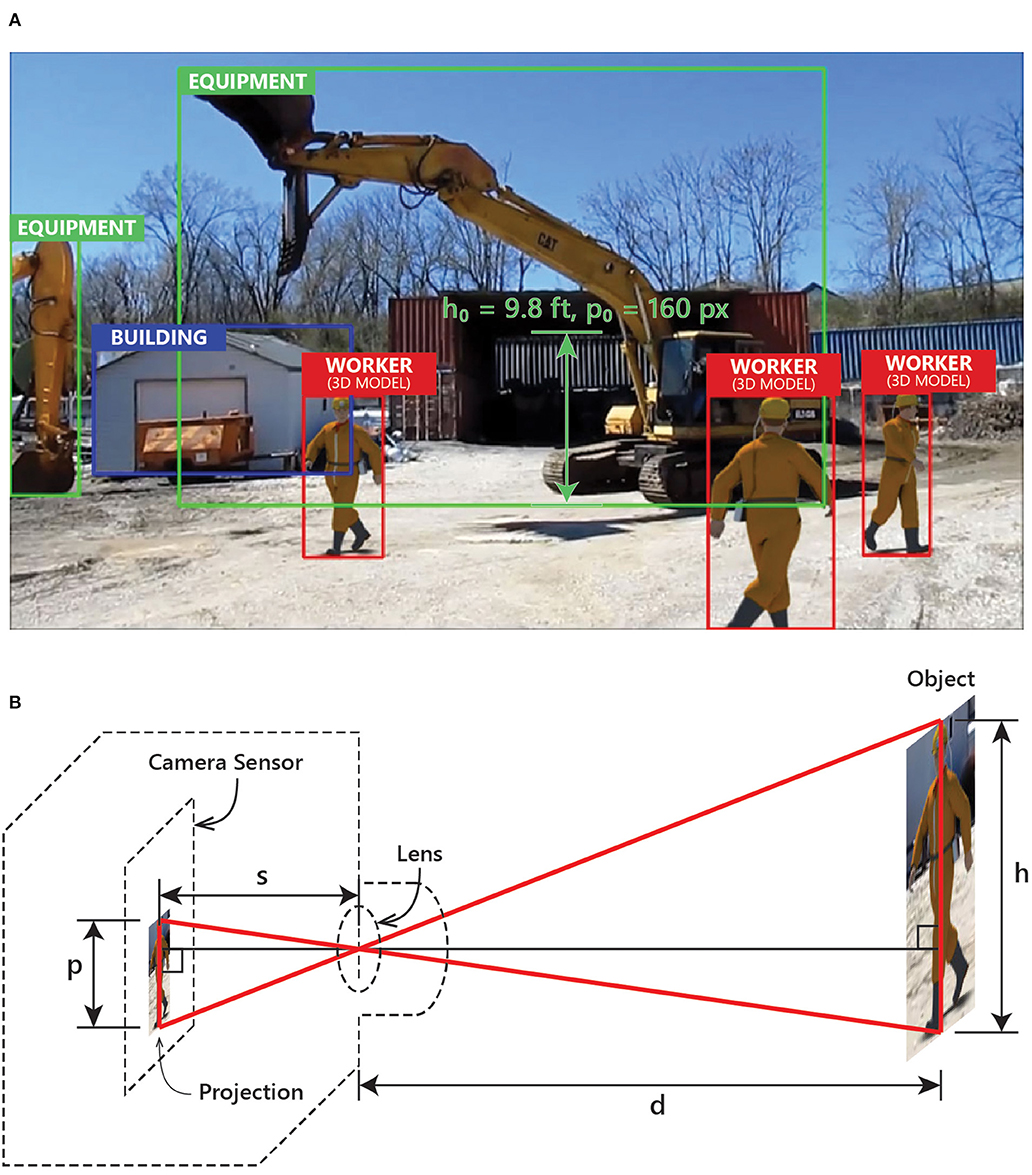
Figure 5. Example of (A) a synthetic image and (B) projection of an object on camera sensor.
The ground-truth relative distances of the objects are calculated from the optics, geometry, and physics of the camera. As shown in Figure 5B, if an object with height h at distance d from the camera's lens is projected as an object of height p on the camera's sensor which is located at distance s from the lens, from similar triangles, we can find a mathematical relationship between the variables, as expressed by Equation (5).
Assume, for an object (referred to as reference object) with known height h0 and distance d0, that the projected height is p0. For another object with known height h1 but unknown distance d1, the projected height is p1. From Equation (5), we can calculate the relative distance of the second object with respect to the first object, d1/d0, using Equation (6).
In this experiment, the excavator (Caterpillar EL240B), shown in Figure 5B, is used as the reference object. The cabin height from the ground (h0) is 9.8 ft, which is ~160 pixel (p0) in the image. Next, the distances (d1) of the 3D model of workers (h1 = 6.5 ft) are calculated using Equation (6) based on their height in pixel (p1) in the image. Using this process, a total of 580 labeled, synthetic images are generated. Randomly selected ~80% (460) of these images are used for training, and the remaining ~20% (120) are used for testing.
As shown in Figure 6, a neural network (NN) model is created to predict the relative distance of objects. The model takes the output of the YOLO model as input and contains two hidden layers (each with 12 nodes). The output layer consists of a single node that predicts the distance. During training, the mean-squared error between the ground-truth distances (dtrue) and the predicted distances (dpredicted) is used as loss function, as shown in Equation (7).
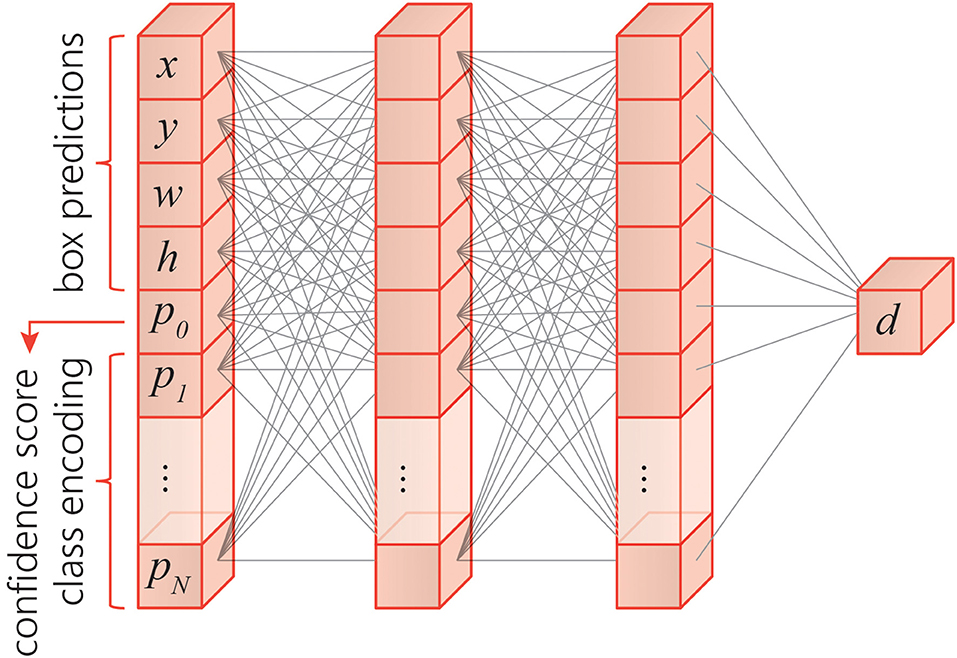
Figure 6. Neural network model for predicting the relative distance of objects.
Experimental Results and Discussion
Clustering
Since YOLO-v2 and YOLO-v3 models require five and nine anchor boxes, respectively, all the boxes in the training subset of each combination (crowdsourced, web-mined, and combined) of the Pictor-v2 dataset are clustered into five (Figure 7A) and nine (Figure 7B) groups, using k-means clustering (Redmon and Farhadi, 2017), and a representative (centroid) from each group is selected as anchor box. It is evident from the anchor boxes in these two figures that the size of anchor boxes in the web-mined dataset is larger than those in the crowdsourced dataset. This is rooted in the fact that web-mined images often contain a fewer number of objects, and the objects cover a larger visual field within the image. This setup imitates professional photographic arrangements where appearance of the objects is of particular interest. On the contrary, the crowdsourced images generally cover a larger field of view that captures more objects, each appearing smaller in the images. It also indicates that crowdsourced images prioritize the amount of information over the appearance of objects in the image. The figures also show that the anchor boxes in the five-cluster groups are slenderer than the anchor boxes in the nine-cluster groups. This observation uncovers that when boxes are clustered into a fewer number of groups, slender objects (e.g., tall buildings, cranes, standing human) dominate, indicating the presence of a larger number of slender objects in the dataset.
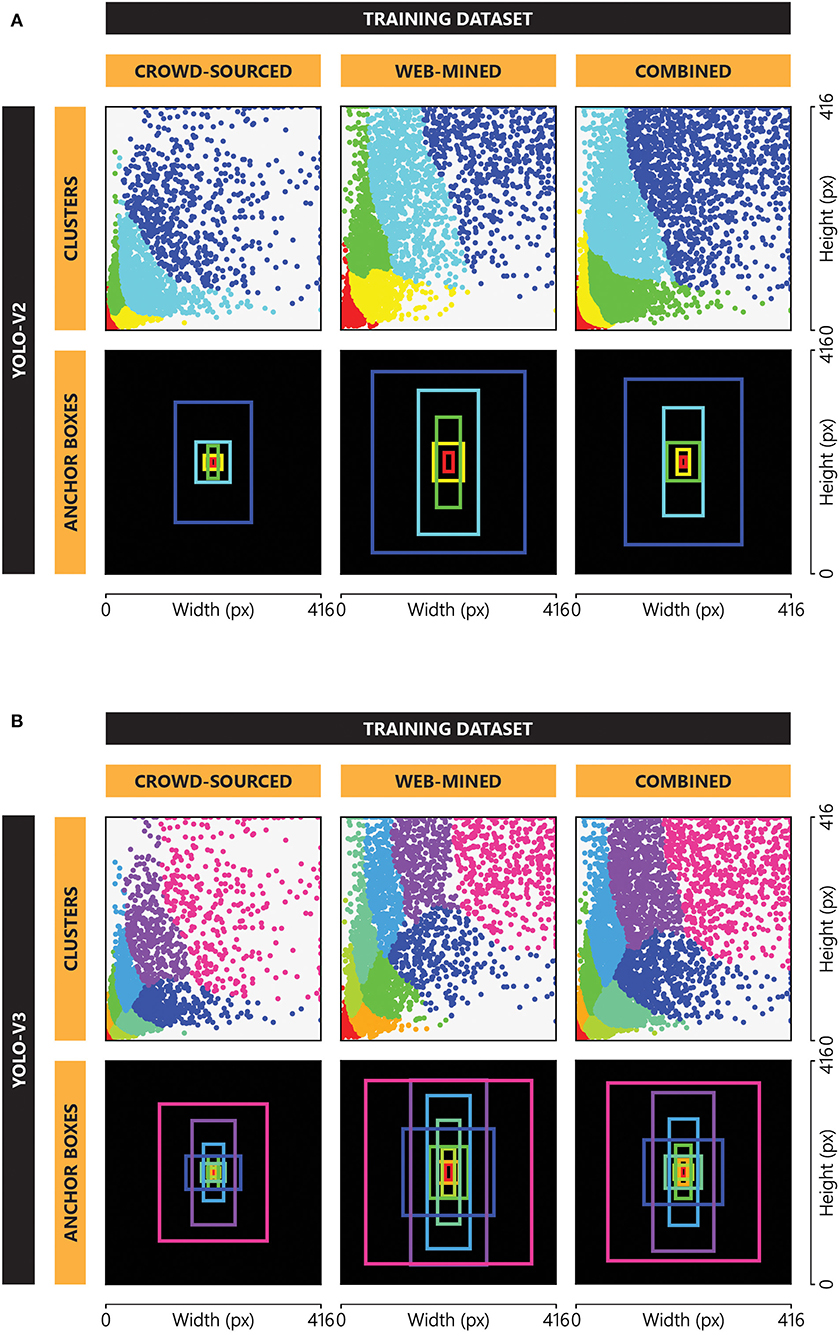
Figure 7. Clusters and corresponding anchor boxes for (A) YOLO-v2 and (B) YOLO-v3 implementation.
Training and Data Augmentation
In this research, three YOLO-v2 and three YOLO-v3 models are trained on the training subsets of the crowdsourced, web-mined, and combined Pictor-v2 dataset. During training, real-time data augmentation is performed to prevent overfitting. In particular, in every training step, each training image is randomly scaled up/down by ±30%, translated horizontally or vertically by ±30% (positive sign indicates translating to the right/downwards), and flipped in the horizontal direction in randomly selected 50% of the times. Also, hue, saturation, and value (brightness) of the training image are randomly changed (with uniform probability) in the range of [−10%, +10%], [−33%, 50%], and [−33%, 50%], respectively. Example of an actual image and generated images through random data augmentation are shown in Figure 8.
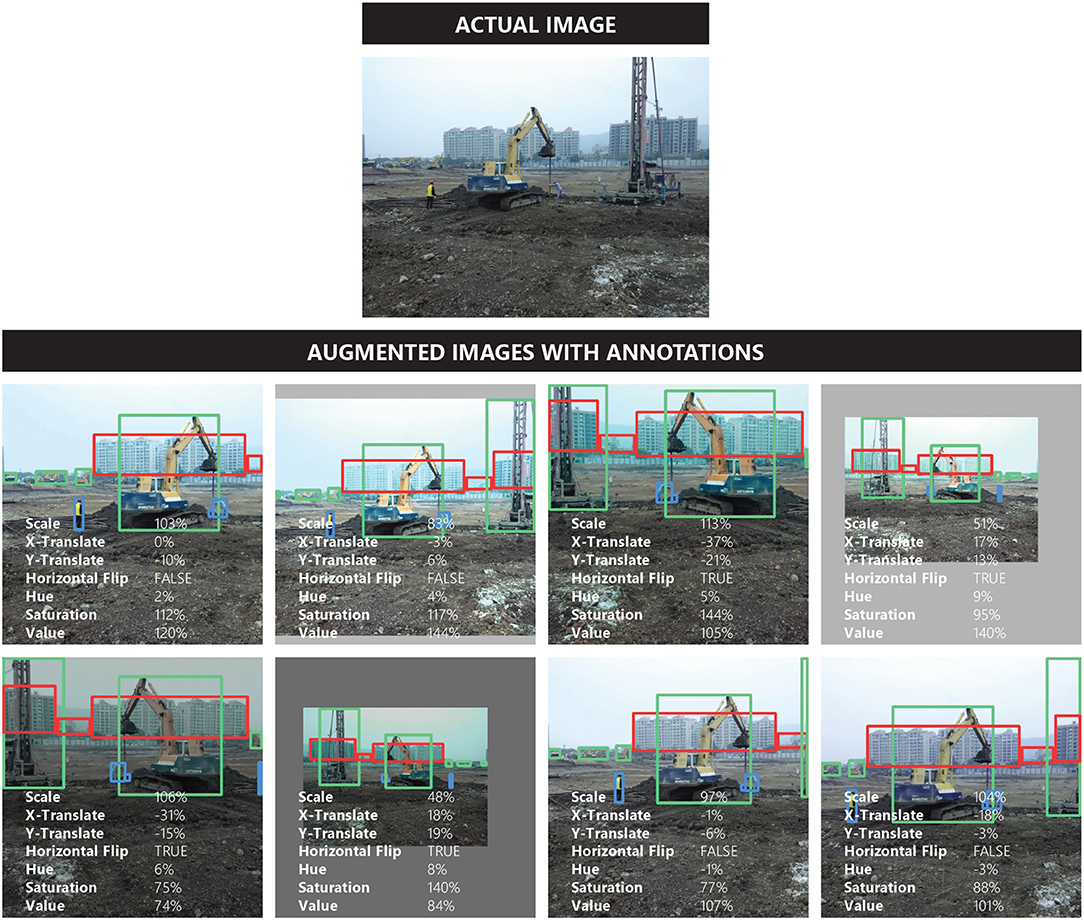
Figure 8. Example of actual and randomly augmented data.
To note, the YOLO-v2 models are trained on a Dell Precision 7530 laptop (Intel® CoreTM i7 8850H 6-core CPU, 16 GB RAM, NVIDIA Quadro P2000 4GB GPU, Windows 10) and YOLO-v3 models are trained on Texas A&M University's High Performance Research Computing (HPRC) Terra cluster (Intel Xeon E5-2680 14-core CPU, 128 GB RAM, NVIDIA K80 12 GB GPU, Linux CentOS 7) (https://hprc.tamu.edu/wiki/Terra). Furthermore, the dataset, training files, and trained weights are available at the authors' GitHub page: https://github.com/ciber-lab/pictor-yolo.
Testing
Performance of fully trained YOLO-v2 and YOLO-v3 models are shown in Figures 9, 10, respectively. According to these figures, models trained on crowdsourced training data perform better on crowdsourced testing data, while models trained on web-mined training data perform better on web-mined testing data. This observation is intuitive since models tend to perform better on the testing images that are visually consistent (in terms of saturation, brightness, environment, and object types) with the training images. It can also be observed that in both YOLO-v2 and YOLO-v3, models perform better when trained on combined data, which is in agreement with the authors' previous preliminary study (Nath and Behzadan, 2019). This can be attributed to the higher number of training samples in the combined data that allows the model to learn general features. Moreover, the counteracting balance of diverse and challenging crowdsourced images and well-structured web-mined images make the model more robust. Also, in general, models trained on crowdsourced or web-mined data are disproportionately better at detecting worker than building or equipment. This can be attributed to the use of transfer learning where the pre-trained dataset (COCO) contains a class (i.e., person) similar to the worker class in the Pictor-v2 dataset, allowing the models to “remember” and effectively “transfer” the learned features for that class from pre-training to training. This observation is in agreement with a previous study (Oquab et al., 2014) in which it was found that having overlapping classes between the source and target datasets could improve the transfer task. However, when models are trained on combined data, the other two classes (i.e., building and equipment) also tend to reach or exceed the level of accuracy of the worker class.
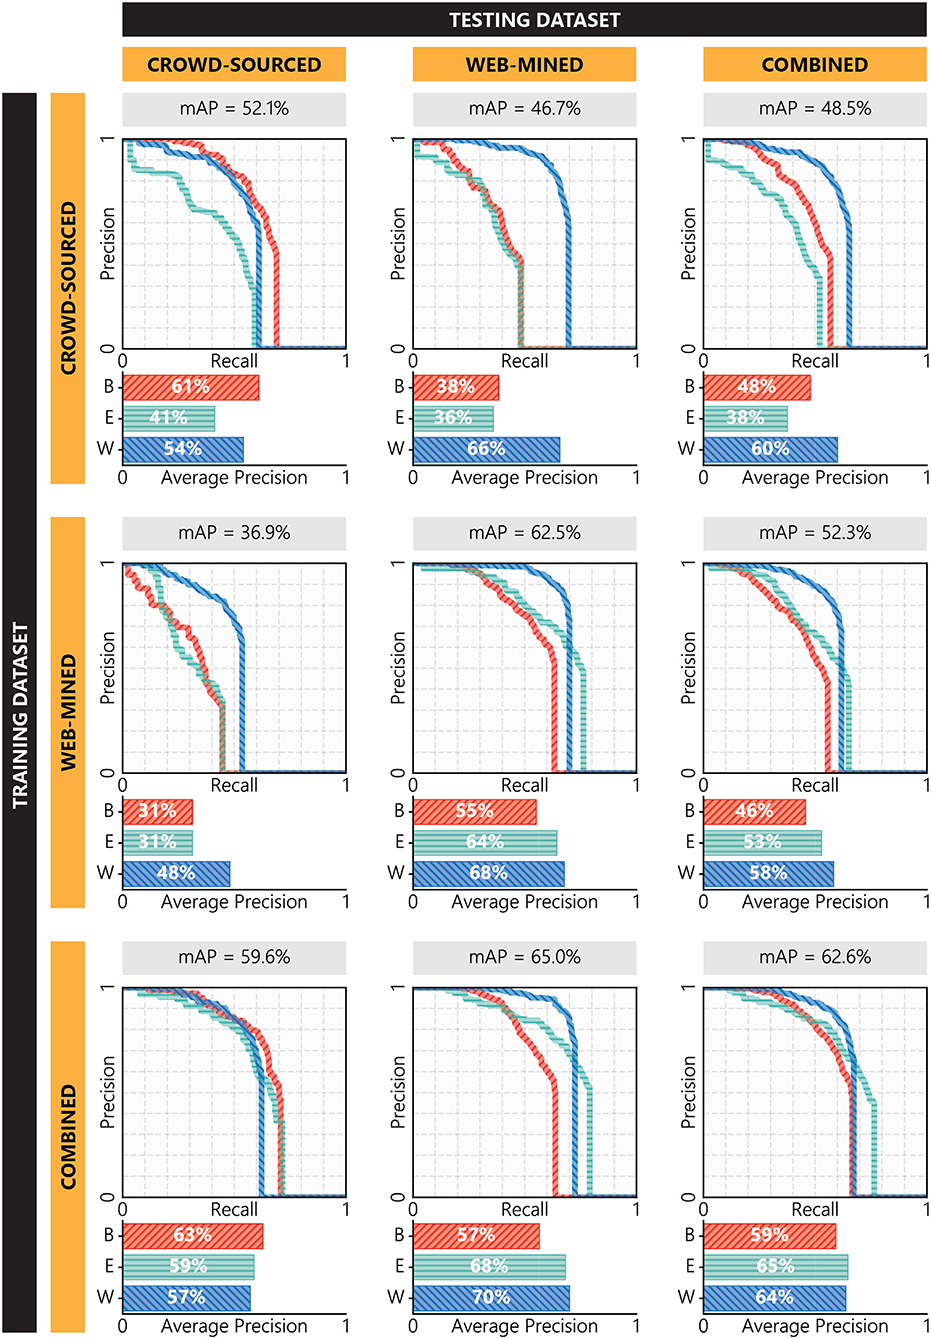
Figure 9. Performance of YOLO-v2 models trained and tested on different combinations of the Pictor-v2 dataset.
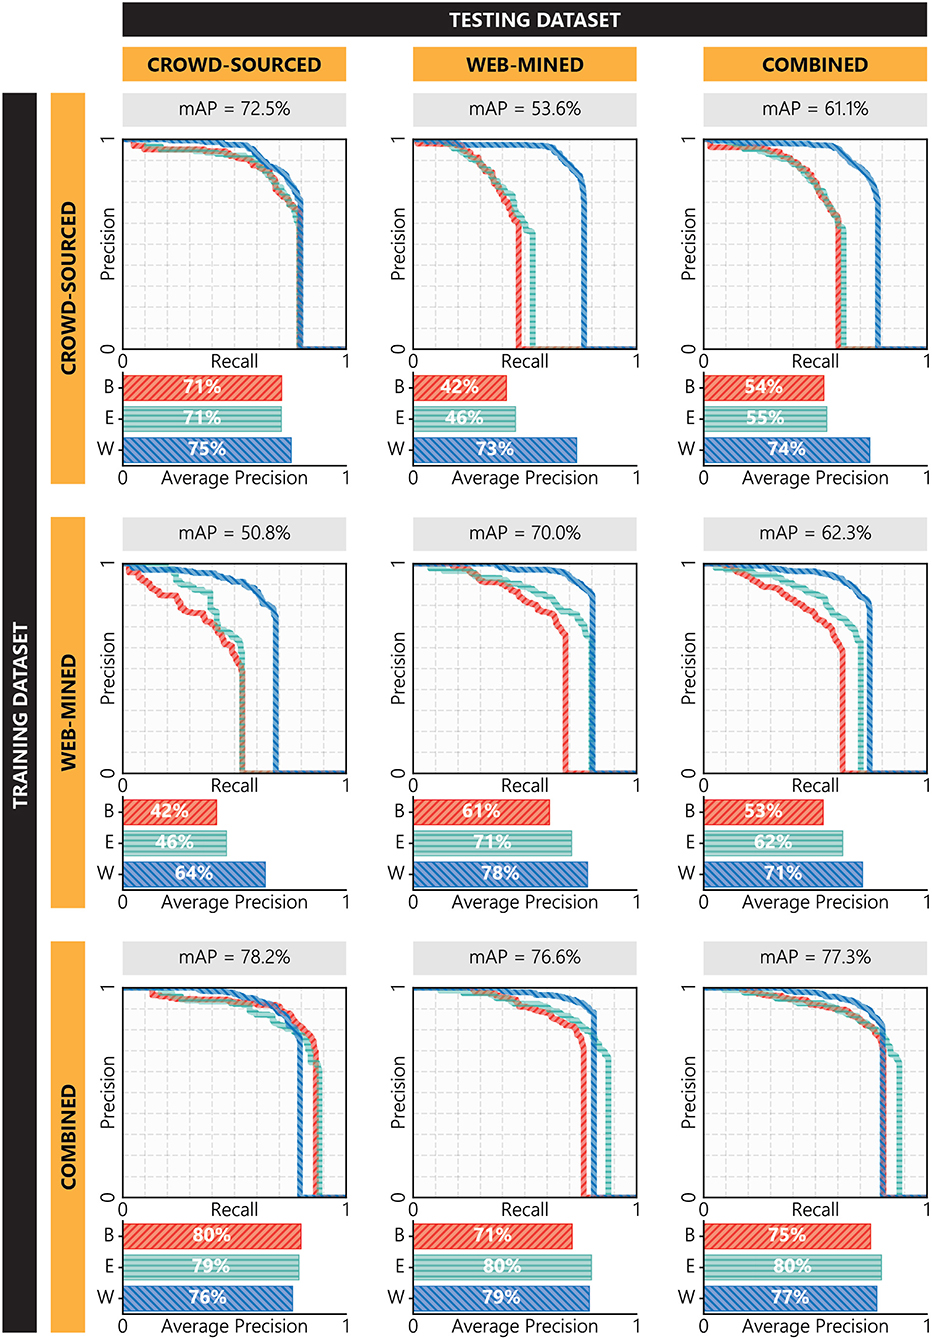
Figure 10. Performance of YOLO-v3 models trained and tested on different combinations of the Pictor-v2 dataset.
Also, it can be seen that in all combination of training and testing subsets, YOLO-v3 models perform better than YOLO-v2 models. The reason for this is the use of residual bocks in YOLO-v3, and the higher number of layers and anchor boxes that, altogether, allow the models to learn more generalizable and scalable features. However, the most prominent reason could be that YOLO-v3 models use three output layers for three different scales each individually focusing on small-, mid-, and large-sized objects in an input image. In particular, YOLO-v3 models are better than YOLO-v2 models in detecting small-sized objects. For example, the YOLO-v2 model trained on combined data struggles more to detect objects in crowdsourced images (59.6% mAP) than it does in web-mined images (65.0% mAP) since crowdsourced images mostly contain small-sized objects. On the contrary, the YOLO-v3 model trained on combined data performs better on crowdsourced images (78.2% mAP) than on web-mined images (76.6% mAP), indicating the model's strong suit in detecting small-sized instances.
Strength and Weakness of the Best-Performing Model
Comparing Figures 9, 10, it can be concluded that the best-performing model is YOLO-v3 when trained on the combined dataset. This model performs better than any other model while tested on any combination, i.e., crowdsourced (78.2% mAP), web-mined (76.6% mAP), and combined (77.3% mAP) data. The model's performance is on par with or higher than the state-of-the-art models, illustrating its reliability in detecting common construction-related objects. In this subsection, further analyses are performed to identify the model's strength and weakness in detecting objects with different constraints.
An object in the construction site imagery may appear in different sizes based on its actual size, distance to the camera, and occlusion. In the combined Pictor-v2 dataset, the median size of all objects is 21,608 square pixels (where the image size is 416 × 416 or 173,056 square pixels). Objects larger than the median size are considered as “larger” objects while the rest are considered as “smaller” objects. Moreover, construction sites generally consist of congested spaces and objects that are blocking or being blocked by other objects. This can hinder the ability of the model to accurately find objects of interest. Therefore, to understand how the best model performs in detecting objects in crowded scenes, any object that has a bounding box overlapping with the bounding box of another object (i.e., IoU > 0%) is considered as “more crowded” object. Furthermore, in many cases, construction sites may not be well-lit, and therefore images taken in such a poorly lit environment may not contain content-rich information (due to less brightness and contrast). The amount of useful information in an image can be measured by Shannon entropy (Wu et al., 2013). For reference, the median value of all Shannon entropies for the training boxes in the combined Pictor-v2 dataset is 7.31. Objects having a Shannon entropy larger than the median value are considered as “well-lit” objects, while the rest are considered as “poorly lit” objects. Examples of smaller vs. larger objects, more crowded vs. less crowded objects, and poorly lit vs. well-lit objects in the Pictor-v2 dataset are shown in Figure 11.
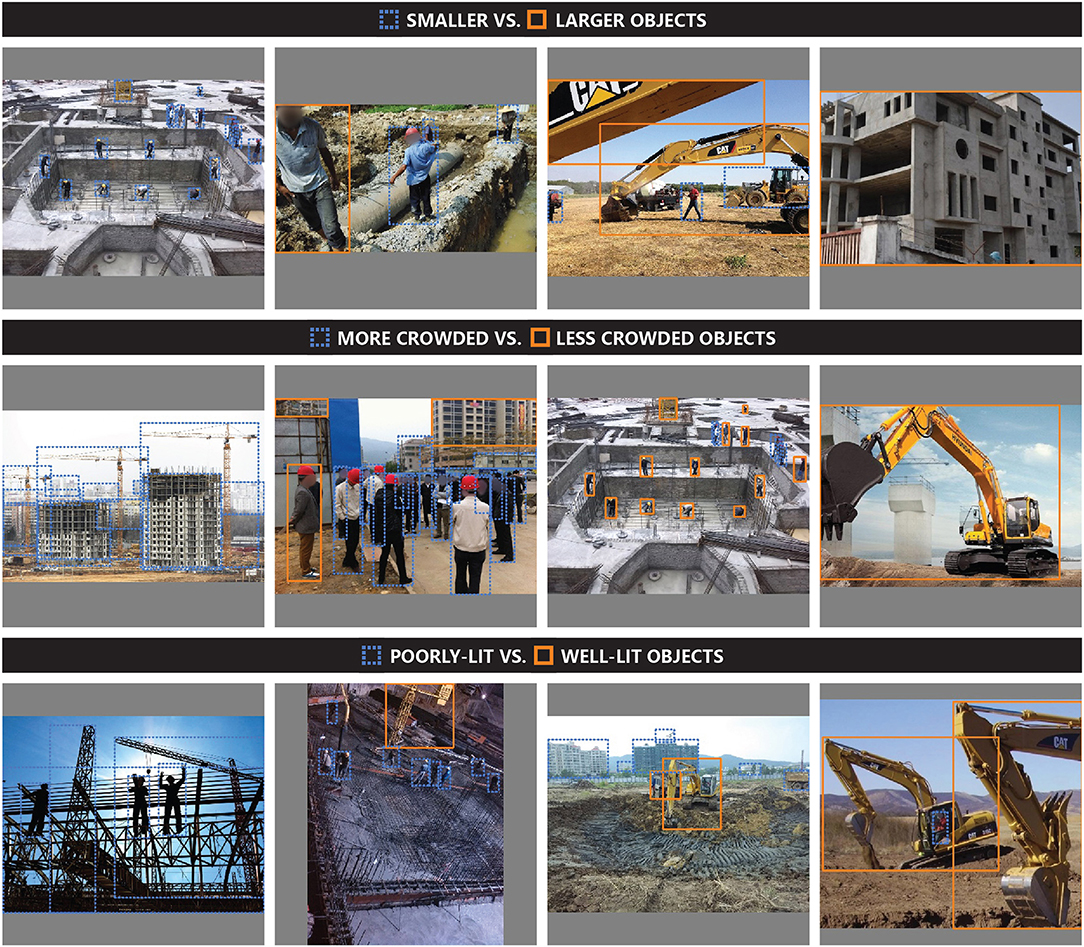
Figure 11. Examples of objects with different constraints (e.g., size, crowdedness, and lighting conditions) in the Pictor-v2 dataset.
As shown in Table 1, the best model performs significantly better in detecting large objects. In particular, the precision and recall of the model in detecting workers are 98%, indicating near human-level accuracy in detecting workers that appear larger in the image.
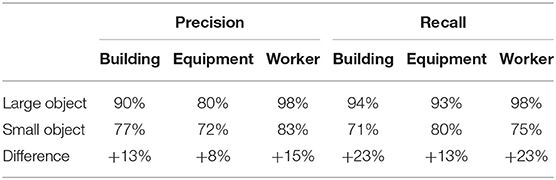
Table 1. Performance of the best model in detecting large and small objects.
The performance of the best model in detecting less and more crowded objects is shown in Table 2. Intuitively, the model detects less crowded objects more accurately. However, the difference is less significant compared to the model's performance in detecting objects of different sizes (Table 1).
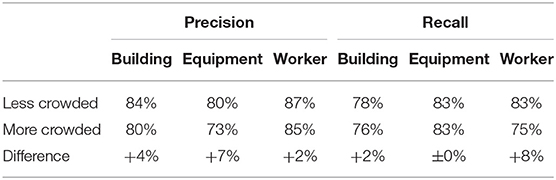
Table 2. Performance of the best model in detecting less and more crowded objects.
Table 3 shows the performance of the best model in detecting objects lit differently. In general, the model is better in detecting well-lit objects. Conversely, the model's recalls for detecting poorly lit building and worker are much lower, indicating the model's weakness in detecting these objects in poorly lit conditions. On the contrary, equipment is detected with similar recalls in well-lit and poorly lit conditions. This result indicates that if there is any equipment in the image, the model is equally likely to detect the equipment regardless of the lighting condition.
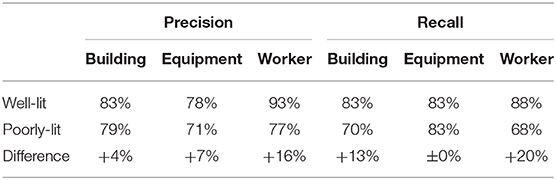
Table 3. Performance of the best model in detecting well-lit and poorly lit objects.
Prediction of Relative Distances
An independent YOLO-v3 model and a NN model are trained on synthetic images. The YOLO-v2 can detect the objects (building, equipment, worker) in the test synthetic images with 99.2% mAP. Figure 12A illustrates the ground-truth relative distances vs. the predicted relative distances of the object by the NN model (Figure 6) when applied to the testing dataset. The Pearson correlation (Benesty et al., 2009) between the ground-truth and predicted values is 0.975.
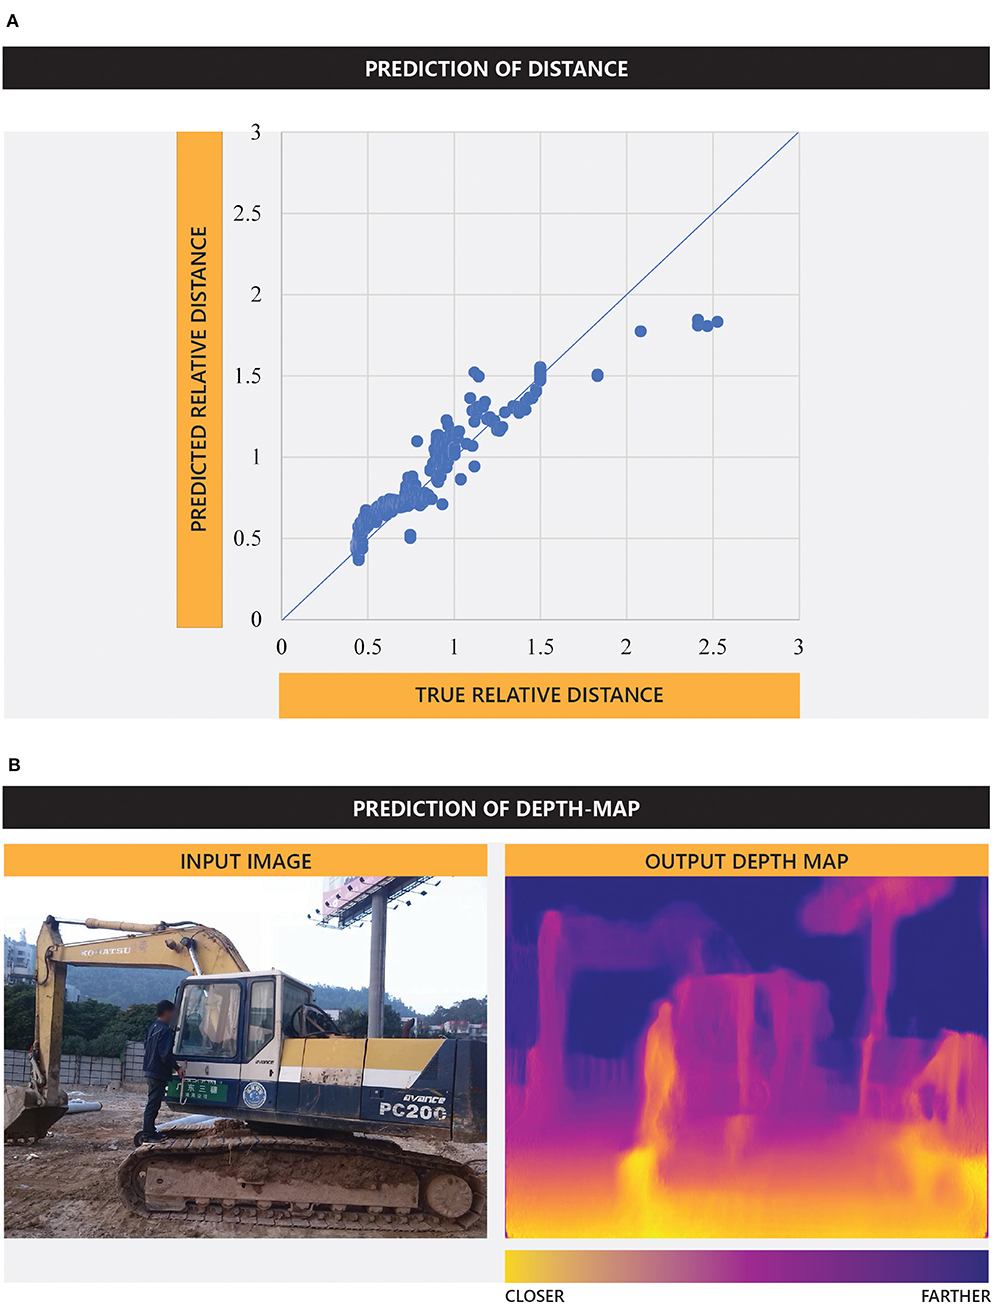
Figure 12. Prediction of (A) distance—true relative distance vs. predicted relative distance, and (B) depth map.
High quality and visual consistency of the training images can play a role in achieving this high performance. Although this experiment is performed on a limited scale and in a controlled environment with synthetic images, the high accuracy of the model in predicting distances indicates the potential of this approach. In particular, with large-scale real-world training images, a more sophisticated model can be built to accurately predict the relative distances of objects, even at the pixel level (a.k.a. depth map). An example is shown in Figure 12B where a CNN model trained on the KITTI dataset (Godard et al., 2017) is applied on a crowdsourced image of the Pictor-v2 dataset to generate a depth map. A detailed discussion of this approach is not within the scope of this study and can be found in other publications by the authors.
Potential Ways to Improve Performance of Object Detection
Investigation on the strengths and weaknesses of the YOLO model in detecting common construction-related objects reveals that the model struggles at detecting small and poorly lit objects especially in crowded scenes. To improve the model's performance at detecting these objects, one potential solution is to collect high-resolution images, divide each image into smaller grids, and apply the YOLO model to each grid cell representing a part of the original image (Unel et al., 2019). However, in many cases, it may not be possible to collect high-resolution images. To remedy this situation, a generative adversarial network (GAN) can be applied to first improve the resolution of the image (Ledig et al., 2017). Likewise, GAN can be applied to brighten a poorly lit image (Shin et al., 2018) although a more straightforward method could be to collect long-exposure or large-aperture images that contain more light information and thus appear brighter even in a low-light environment (Szeliski, 2010). On the other hand, crowded scenes in the Pictor dataset generally contain multiple objects that may be located at different distances from the camera, with closer objects occluding farther objects, thus creating the illusion of a crowded scene. Therefore, the authors speculate that incorporating depth information in the input of the object detection model could help the model properly differentiate objects in crowded scenes that are located at different distances from the camera lens. These methods are primarily conjectures proposed by the authors based on previous research, personal experience, and preliminary studies. As part of the future work in this research, more experiments will be conducted to validate the performance of these techniques.
Summary and Conclusion
This paper presented a dataset, named Pictor-v2, which contains 1,105 crowdsourced and 1,402 web-mined annotated images of building, equipment, and worker. This dataset was used to train, validate, and test DL-based YOLO algorithms for real-time detection of these three common object classes in construction imagery. Training and testing YOLO-v2 and YOLO-v3 models on different combinations of the dataset revealed that models perform best when trained on combined (crowdsourced and web-mined) data. It also indicated that models learned more general and scalable features from the larger and diverse dataset. Moreover, in all cases, YOLO-v3 models significantly outperformed their YOLO-v2 counterparts, particularly when tested on crowdsourced data, highlighting their stronger suit in detecting smaller objects. It was therefore concluded that YOLO-v3 models are more reliable in detecting construction-related objects in uncontrolled environments that occupy a larger field of view. In particular, the best-performing model, i.e., YOLO-v3 trained on combined data, achieved a 78.2% mAP, which is on par or higher than the cutting-edge algorithms in detecting everyday objects. The best model was also tested on detecting objects of different sizes and crowdedness and in diverse lighting conditions. It was found that, in general, the model could detect larger, less crowded, and well-lit objects more accurately. In particular, one of the model's notable strengths is that it could detect large-sized building and worker instances with remarkably high accuracy. However, the model tends to struggle to detect these objects in low-light conditions. Nonetheless, the high performance of the models indicates that the output can be integrated into various frameworks to broaden the scope and support other applications. For example, it was found that the YOLO model integrated with a NN model can predict the relative distances of objects in synthetic images from a single camera view with high accuracy. This finding motivates future experiments aimed at developing a robust methodology for generating depth maps from monocular images in real-world settings.
The DL-based object detection model introduced in this paper can be applied to construction images and videos to retrieve specific visual contents and generate metadata tags. Results can be used in a variety of applications such as construction automation, work progress monitoring, and safety inspection. Moreover, the model's ability to perform in real time can be of significant interest in developing applications that require instantaneous situational awareness. Examples include the detection of an impending collision between a worker and a piece of equipment. Furthermore, since the trained models effectively learned the features of most commonly available construction objects, the transfer learning scheme can be adapted to improve or develop various other DL-based tools for the construction practice. Finally, the crowdsourced Pictor-v2 dataset and the trained models are publicly available to encourage other research and development projects. In the future, the authors will add new classes (e.g., different materials) and sub-classes (e.g., different types of equipment) to the dataset, and develop AI-based methods to automatically generate image captions that describe objects, activities, and contexts in the scene in natural language.
Data Availability Statement
The dataset generated for this study and all trained models are available on the authors' GitHub page (https://github.com/ciber-lab/pictor-yolo). All inquiries regarding this content should be directed to the corresponding author.
Author Contributions
All authors contributed to the conception and design of the study, dataset generation, model training and testing, analysis of results and drafting, revising, and approving the contents of the manuscript.
Funding
The authors gratefully acknowledge the U.S. National Science Foundation (NSF) for supporting this project through Grant No. CMMI 1800957 and Mr. Yalong Pi for assisting in data preparation. Any opinions, findings, conclusions, and recommendations expressed in this paper are those of the authors and do not necessarily represent the views of the NSF or the individual named above.
Conflict of Interest
The authors declare that the research was conducted in the absence of any commercial or financial relationships that could be construed as a potential conflict of interest.
References
Benesty, J., Chen, J., Huang, Y., and Cohen, I. (2009). “Pearson correlation coefficient,” in Noise Reduction in Speech Processing (Berlin; Heidelberg: Springer), 1–4. doi: 10.1007/978-3-642-00296-0_5
Beucher, S. (1992). The watershed transformation applied to image segmentation. Scanning Microsc. Suppl. 6, 299−314.
Bock, T. (2015). The future of construction automation: technological disruption and the upcoming ubiquity of robotics. Autom. Constr. 59, 113–121. doi: 10.1016/j.autcon.2015.07.022
Brilakis, I., Fathi, H., and Rashidi, A. (2011). Progressive 3D reconstruction of infrastructure with videogrammetry. Autom. Constr. 20, 884–895. doi: 10.1016/j.autcon.2011.03.005
Brilakis, I., Soibelman, L., and Shinagawa, Y. (2005). Material-based construction site image retrieval. J. Comput. Civil Eng. 19, 341–355. doi: 10.1061/(ASCE)0887-3801(2005)19:4(341)
Brilakis, I. K., and Soibelman, L. (2008). Shape-based retrieval of construction site photographs. J. Comput. Civil Eng. 22, 14–20. doi: 10.1061/(ASCE)0887-3801(2008)22:1(14)
Canny, J. (1987). “A computational approach to edge detection,” in Readings in Computer Vision (Los Altos, CA: Morgan Kaufmann Publishers), 184–203. doi: 10.1016/B978-0-08-051581-6.50024-6
Chen, J., Ahn, C. R., and Han, S. (2014). “Detecting the hazards of lifting and carrying in construction through a coupled 3D sensing and IMUs sensing system,” in Computing in Civil and Building Engineering (Orlando, FL), 1110–1117. doi: 10.1061/9780784413616.138
Chen, M., Tang, Y., Zou, X., Huang, K., Li, L., and He, Y. (2019). High-accuracy multi-camera reconstruction enhanced by adaptive point cloud correction algorithm. Opt. Lasers Eng. 122, 170–183. doi: 10.1016/j.optlaseng.2019.06.011
Chen, X., Fang, H., Lin, T.-Y., Vedantam, R., Gupta, S., Dollár, P., and Zitnick, C. L. (2015). Microsoft COCO captions: data collection and evaluation server. arXiv preprint arXiv:1504.00325.
Cheng, M.-Y., Tsai, H.-C., and Sudjono, E. (2010). Conceptual cost estimates using evolutionary fuzzy hybrid neural network for projects in construction industry. Expert Syst. Appl. 37, 4224–4231. doi: 10.1016/j.eswa.2009.11.080
Chi, S., and Caldas, C. H. (2011). Automated object identification using optical video cameras on construction sites. Comput. Aided Civil Inf. Eng. 26, 368–380. doi: 10.1111/j.1467-8667.2010.00690.x
Chilian, A., and Hirschmüller, H. (2009). “Stereo camera based navigation of mobile robots on rough terrain,” in IEEE/RSJ International Conference on Intelligent Robots and Systems (St. Louis, MO), 4571–4576. doi: 10.1109/IROS.2009.5354535
Dai, J., Li, Y., He, K., and Sun, J. (2016). “R-FCN: object detection via region-based fully convolutional networks,” in Advances in Neural Information Processing Systems (Barcelona), 379–387.
Deng, J., Dong, W., Socher, R., Li, L.-J., Li, K., and Fei-Fei, L. (2009). “Imagenet: a large-scale hierarchical image database,” in IEEE Conference on Computer Vision and Pattern Recognition (2009) (Miami, FL), 248–255. doi: 10.1109/CVPR.2009.5206848
Dimitrov, A., and Golparvar-Fard, M. (2014). Vision-based material recognition for automated monitoring of construction progress and generating building information modeling from unordered site image collections. Adv. Eng. Inf. 28, 37–49. doi: 10.1016/j.aei.2013.11.002
Ding, L., Fang, W., Luo, H., Love, P. E., Zhong, B., and Ouyang, X. (2018). A deep hybrid learning model to detect unsafe behavior: integrating convolution neural networks and long short-term memory. Autom. Const. 86, 118–124. doi: 10.1016/j.autcon.2017.11.002
Everingham, M., Van Gool, L., Williams, C. K., Winn, J., and Zisserman, A. (2010). The pascal visual object classes (VOC) challenge. Int. J. Comput. Vision 88, 303–338. doi: 10.1007/s11263-009-0275-4
Girshick, R. (2015). “Fast R-CNN,” in IEEE International Conference on Computer Vision (Santiago), 1440–1448. doi: 10.1109/ICCV.2015.169
Girshick, R., Donahue, J., Darrell, T., and Malik, J. (2014). “Rich feature hierarchies for accurate object detection and semantic segmentation,” in IEEE Conference on Computer Vision and Pattern Recognition (Columbus, OH), 580–587. doi: 10.1109/CVPR.2014.81
Godard, C., Mac Aodha, O., and Brostow, G. J. (2017). “Unsupervised monocular depth estimation with left-right consistency,” in IEEE Conference on Computer Vision and Pattern Recognition (Honolulu, HI), 6602–6611. doi: 10.1109/CVPR.2017.699
Han, K. K., and Golparvar-Fard, M. (2015). Appearance-based material classification for monitoring of operation-level construction progress using 4D BIM and site photologs. Autom. Constr. 53, 44–57. doi: 10.1016/j.autcon.2015.02.007
Han, S., Lee, S., and Peña-Mora, F. (2012). Vision-based detection of unsafe actions of a construction worker: case study of ladder climbing. J. Comput. Civil Eng. 27, 635–644. doi: 10.1061/(ASCE)CP.1943-5487.0000279
He, K., Gkioxari, G., Dollár, P., and Girshick, R. (2017). “Mask R-CNN,” in IEEE International Conference on Computer Vision (ICCV) (Venice), 2961–2969. doi: 10.1109/ICCV.2017.322
Hochreiter, S., and Schmidhuber, J. (1997). Long short-term memory. Neural Comput. 9, 1735–1780. doi: 10.1162/neco.1997.9.8.1735
Kim, D., Liu, M., Lee, S., and Kamat, V. (2019). Remote proximity monitoring between mobile construction resources using camera-mounted UAVs. Autom. Constr. 99, 168–182. doi: 10.1016/j.autcon.2018.12.014
Kim, H., Kim, H., Hong, Y., and Byun, H. (2018). Detecting construction equipment using a region-based fully convolutional network and transfer learning. J. Comput. Civil Eng. 32:04017082. doi: 10.1061/(ASCE)CP.1943-5487.0000731
Kim, H., Kim, K., and Kim, H. (2016). Data-driven scene parsing method for recognizing construction site objects in the whole image. Autom. Constr. 71, 271–282. doi: 10.1016/j.autcon.2016.08.018
Kingma, D. P., and Ba, J. (2014). Adam: a method for stochastic optimization. arXiv preprint arXiv:1412.6980.
Kolar, Z., Chen, H., and Luo, X. (2018). Transfer learning and deep convolutional neural networks for safety guardrail detection in 2D images. Autom. Const. 89, 58–70. doi: 10.1016/j.autcon.2018.01.003
Kosala, R., and Blockeel, H. (2000). Web mining research: a survey. ACM SIGKDD Explor. Newsl. 2, 1–15. doi: 10.1145/360402.360406
Krishna, R., Zhu, Y., Groth, O., Johnson, J., Hata, K., Kravitz, J., et al. (2017). Visual genome: connecting language and vision using crowdsourced dense image annotations. Int. J. Comput. Vision 123, 32–73. doi: 10.1007/s11263-016-0981-7
Krizhevsky, A., Sutskever, I., and Hinton, G. E. (2012). ImageNet classification with deep convolutional neural networks. Adv. Neural Inf. Process. Syst. 25, 1097–1105. doi: 10.1145/3065386
Kyrkou, C., Plastiras, G., Theocharides, T., Venieris, S. I., and Bouganis, C.-S. (2018). “DroNet: efficient convolutional neural network detector for real-time UAV applications,” in Design, Automation and Test in Europe Conference and Exhibition (DATE) (Dresden), 967–972. doi: 10.23919/DATE.2018.8342149
Labelbox (2019). Labelbox. Available online at: www.labelbox.com (accessed March 02, 2020).
LeCun, Y., Bottou, L., Bengio, Y., and Haffner, P. (1998). Gradient-based learning applied to document recognition. Proc. IEEE 86, 2278–2324. doi: 10.1109/5.726791
Ledig, C., Theis, L., Huszár, F., Caballero, J., Cunningham, A., Acosta, A., et al. (2017). “Photo-realistic single image super-resolution using a generative adversarial network,” in IEEE Conference on Computer Vision and Pattern Recognition (Honolulu, HI), 4681–4690. doi: 10.1109/CVPR.2017.19
Li, H., Lu, M., Hsu, S.-C., Gray, M., and Huang, T. (2015). Proactive behavior-based safety management for construction safety improvement. Saf. Sci. 75, 107–117. doi: 10.1016/j.ssci.2015.01.013
Li, L., Huang, W., Gu, I. Y., and Tian, Q. (2003). “Foreground object detection from videos containing complex background,” in 11th ACM International Conference on Multimedia (Berkeley, CA), 2–10. doi: 10.1145/957013.957017
Li, L.-J., Socher, R., and Fei-Fei, L. (2009). “Towards total scene understanding: classification, annotation and segmentation in an automatic framework,” in IEEE Conference on Computer Vision and Pattern Recognition (Miami, FL), 2036–2043. doi: 10.1109/CVPR.2009.5206718
Liu, C., Yuen, J., and Torralba, A. (2011). Nonparametric scene parsing via label transfer. IEEE Trans. Pattern Anal. Mach. Intell. 33, 2368–2382. doi: 10.1109/TPAMI.2011.131
Liu, W., Anguelov, D., Erhan, D., Szegedy, C., Reed, S., Fu, C.-Y., et al. (2016). “SSD: single shot multibox detector,” in European Conference on Computer Vision (Amsterdam), 21–37. doi: 10.1007/978-3-319-46448-0_2
Nath, N., and Behzadan, A. (2019). “Deep learning models for content-based retrieval of construction visual data,” in International Conference on Computing in Civil Engineering (Atlanta, GA), 66–73. doi: 10.1061/9780784482438.009
Nath, N. D., Behzadan, A. H., and Paal, S. G. (2020). Deep learning for site safety: real-time detection of personal protective equipment. Autom. Constr. 112:103085. doi: 10.1016/j.autcon.2020.103085
Nath, N. D., Chaspari, T., and Behzadan, A. H. (2018). Automated ergonomic risk monitoring using body-mounted sensors and machine learning. Adv. Eng. Inf. 38, 514–526. doi: 10.1016/j.aei.2018.08.020
Oquab, M., Bottou, L., Laptev, I., and Sivic, J. (2014). “Learning and transferring mid-level image representations using convolutional neural networks,” in IEEE Conference on Computer Vision and Pattern Recognition (Columbus, OH), 1717–1724. doi: 10.1109/CVPR.2014.222
O'Riordan, A., Newe, T., Dooly, G., and Toal, D. (2018). “Stereo vision sensing: review of existing systems,” in 12th International Conference on Sensing Technology (ICST) (Limerick: IEEE), 178–184. doi: 10.1109/ICSensT.2018.8603605
Park, M.-W., Elsafty, N., and Zhu, Z. (2015). Hardhat-wearing detection for enhancing on-site safety of construction workers. J. Constr. Eng. Manage. 141:04015024. doi: 10.1061/(ASCE)CO.1943-7862.0000974
Perez, L., and Wang, J. (2017). The effectiveness of data augmentation in image classification using deep learning. arXiv preprint arXiv:1712.04621.
Pfister, A., West, A. M., Bronner, S., and Noah, J. A. (2014). Comparative abilities of Microsoft Kinect and Vicon 3D motion capture for gait analysis. J. Med. Eng. Technol. 38, 274–280. doi: 10.3109/03091902.2014.909540
Plantard, P., Auvinet, E., Pierres, A. S. L., and Multon, F. (2015). Pose estimation with a Kinect for ergonomic studies: evaluation of the accuracy using a virtual mannequin. Sensors 15, 1785–1803. doi: 10.3390/s150101785
Redmon, J., Divvala, S., Girshick, R., and Farhadi, A. (2016). “You only look once: unified, real-time object detection,” in IEEE Conference on Computer Vision and Pattern Recognition (Las Vegas, NV), 779–788. doi: 10.1109/CVPR.2016.91
Redmon, J., and Farhadi, A. (2017). “YOLO9000: better, faster, stronger,” in IEEE Conference on Computer Vision and Pattern Recognition (Honolulu, HI), 7263–7271. doi: 10.1109/CVPR.2017.690
Redmon, J., and Farhadi, A. (2018). YOLOv3: an incremental improvement. arXiv preprint arXiv:1804.02767.
Ren, S., He, K., Girshick, R., and Sun, J. (2017). Faster R-CNN: towards real-time object detection with region proposal networks. IEEE Trans. Pattern Anal. Mach. Intell. 39, 1137–1149. doi: 10.1109/TPAMI.2016.2577031
Russell, B. C., Torralba, A., Murphy, K. P., and Freeman, W. T. (2008). LabelMe: a database and web-based tool for image annotation. Int. J. Comput. Vision 77, 157–173. doi: 10.1007/s11263-007-0090-8
Shin, Y. G., Sagong, M. C., Yeo, Y. J., and Ko, S. J. (2018). “Adversarial context aggregation network for low-light image enhancement,” in Digital Image Computing: Techniques and Applications (DICTA) (Canberra, ACT), 1–5. doi: 10.1109/DICTA.2018.8615848
Shrestha, K., Shrestha, P. P., Bajracharya, D., and Yfantis, E. A. (2015). Hard-hat detection for construction safety visualization. J. Constr. Eng. 2015, 1–8. doi: 10.1155/2015/721380
Siddula, M., Dai, F., Ye, Y., and Fan, J. (2016). Unsupervised feature learning for objects of interest detection in cluttered construction roof site images. Proc. Eng. 145, 428–435. doi: 10.1016/j.proeng.2016.04.010
Simonyan, K., and Zisserman, A. (2014). Very deep convolutional networks for large-scale image recognition. arXiv preprint arXiv:1409.1556.
Smisek, J., Jancosek, M., and Pajdla, T. (2013). “3D with Kinect,” in Consumer Depth Cameras for Computer Vision (London: Springer), 3–25. doi: 10.1007/978-1-4471-4640-7_1
Soltani, M. M., Zhu, Z., and Hammad, A. (2016). Automated annotation for visual recognition of construction resources using synthetic images. Autom. Constr. 62, 14–23. doi: 10.1016/j.autcon.2015.10.002
Son, H., Kim, C., Hwang, N., Kim, C., and Kang, Y. (2014). Classification of major construction materials in construction environments using ensemble classifiers. Adv. Eng. Inf. 28, 1–10. doi: 10.1016/j.aei.2013.10.001
Szeliski, R. (2010). Computer Vision: Algorithms and Applications (Springer Science and Business Media). Available online at: http://szeliski.org/Book/ (accessed July 4, 2020).
Tang, Y., Li, L., Wang, C., Chen, M., Feng, W., Zou, X., and Huang, K. (2019). Real-time detection of surface deformation and strain in recycled aggregate concrete-filled steel tubular columns via four-ocular vision. Rob. Comput. Integr. Manuf. 59, 36–46. doi: 10.1016/j.rcim.2019.03.001
Turpin, A., and Scholer, F. (2006). “User performance versus precision measures for simple search tasks,” in 29th Annual International ACM SIGIR Conference on Research and Development in Information Retrieval (Seattle, WA), 11–18. doi: 10.1145/1148170.1148176
Unel, F. O., Ozkalayci, B. O., and Cigla, C. (2019). “The power of tiling for small object detection,” in IEEE Computer Vision and Pattern Recognition Workshop (Long Beach, CA). doi: 10.1109/CVPRW.2019.00084
Weston, J., and Watkins, C. (1998). Multi-class Support Vector Machines. Technical Report, CSD-TR-98-04. Department of Computer Science, Royal Holloway, University of London, United Kingdom.
Wu, Y., Kim, H., Kim, C., and Han, S. H. (2009). Object recognition in construction-site images using 3D CAD-based filtering. J. Comput. Civil Eng. 24, 56–64. doi: 10.1061/(ASCE)0887-3801(2010)24:1(56)
Wu, Y., Zhou, Y., Saveriades, G., Agaian, S., Noonan, J. P., and Natarajan, P. (2013). Local Shannon entropy measure with statistical tests for image randomness. Inf. Sci. 222, 323–342. doi: 10.1016/j.ins.2012.07.049
Wuest, T., Weimer, D., Irgens, C., and Thoben, K.-D. (2016). Machine learning in manufacturing: advantages, challenges, and applications. Prod. Manuf. Res. 4, 23–45. doi: 10.1080/21693277.2016.1192517
Xiao, B., and Kang, S. C. (2019). “Deep learning detection for real-time construction machine checking,” in 36th International Symposium on Automation and Robotics in Construction (ISARC) (Alberta), 1136–1141. doi: 10.22260/ISARC2019/0151
Yahya, M., and Saka, M. (2014). Construction site layout planning using multi-objective artificial bee colony algorithm with Levy flights. Automation in Construction. 38, 14–29. doi: 10.1016/j.autcon.2013.11.001
Yuen, M.-C., King, I., and Leung, K.-S. (2011). “A survey of crowdsourcing systems,” in IEEE Third International Conference on Privacy, Security, Risk and Trust and 2011 IEEE Third International Conference on Social Computing (Boston, MA), 766–773. doi: 10.1109/PASSAT/SocialCom.2011.203
Zhang, B., Zhu, Z., Hammad, A., and Aly, W. (2018). Automatic matching of construction onsite resources under camera views. Autom. Constr. 91, 206–215. doi: 10.1016/j.autcon.2018.03.011
Zhang, Y., Zhao, D., Zhang, J., Xiong, R., and Gao, W. (2011). Interpolation-dependent image downsampling. IEEE Trans. Image Process. 20, 3291–3296. doi: 10.1109/TIP.2011.2158226
Zhu, Z., Ren, X., and Chen, Z. (2017). Integrated detection and tracking of workforce and equipment from construction jobsite videos. Autom. Constr. 81, 161–171. doi: 10.1016/j.autcon.2017.05.005
Zivkovic, Z. (2004). “Improved adaptive Gaussian mixture model for background subtraction,” in 17th International Conference on Pattern Recognition (Cambridge). doi: 10.1109/ICPR.2004.1333992
Keywords: visual recognition, deep learning, object detection, computer vision, content retrieval
Citation: Nath ND and Behzadan AH (2020) Deep Convolutional Networks for Construction Object Detection Under Different Visual Conditions. Front. Built Environ. 6:97. doi: 10.3389/fbuil.2020.00097
Received: 04 February 2020; Accepted: 27 May 2020;
Published: 14 August 2020.
Edited by:
Benny Raphael, Indian Institute of Technology Madras, IndiaReviewed by:
Xiaowei Luo, City University of Hong Kong, Hong KongYunchao Tang, Zhongkai University of Agriculture and Engineering, China
Copyright © 2020 Nath and Behzadan. This is an open-access article distributed under the terms of the Creative Commons Attribution License (CC BY). The use, distribution or reproduction in other forums is permitted, provided the original author(s) and the copyright owner(s) are credited and that the original publication in this journal is cited, in accordance with accepted academic practice. No use, distribution or reproduction is permitted which does not comply with these terms.
*Correspondence: Amir H. Behzadan, YWJlaHphZGFuQHRhbXUuZWR1