 Majid Ebad Sichani1
 Katherine A. Anarde2
 Kendall M. Capshaw1
 Jamie E. Padgett1*
 Rachel A. Meidl3
 Pedram Hassanzadeh4,5
 Ted P. Loch-Temzelides3,6
 Philip B. Bedient1
- 1Department of Civil and Environmental Engineering, Rice University, Houston, TX, United States
- 2Department of Geological Sciences, University of North Carolina, Chapel Hill, NC, United States
- 3Baker Institute for Public Policy, Rice University, Houston, TX, United States
- 4Department of Mechanical Engineering, Rice University, Houston, TX, United States
- 5Department of Earth, Environmental and Planetary Sciences, Rice University, Houston, TX, United States
- 6Department of Economics, Rice University, Houston, TX, United States
Hurricanes threaten the petroleum industry in the United States and are expected to be influenced by climate change. This study presents an integrated framework for hurricane risk assessment of petroleum infrastructure under changing climatic conditions, calculating risk in terms of monetary loss. Variants of two synthetic probabilistic storms and one historical storm (Hurricane Ike) are simulated using the SWAN+ADCIRC model, representing a range of potential scenarios of impacts of a changing climate on hurricane forward speed and sea-level rise given uncertainties in climate projections. Model outputs inform an infrastructure impact and cascading economic loss analysis that incorporates various sources of uncertainty to estimate five types of losses sustained by petroleum facilities in surge events: land value loss, process-unit damage loss, cost of spill clean-up and repair of aboveground storage tanks, productivity loss, and civil fines. The proposed risk assessment framework is applied as a case study to seven refineries along the Houston Ship Channel (HSC), a densely-industrialized corridor in Texas. The results reveal that either an increase in mean sea level or a decrease in storm forward speed increases the maximum water elevations in the HSC for storms that produce maximum wind setup in Galveston Bay (FEMA 33 and FEMA 36), resulting in larger economic loss estimates. The role of refinery features such as storage capacity and average elevation of the refinery and its critical equipment in the refinery response to hurricane hazards is studied, and the probability distribution of refinery total loss and the loss risk profile in different hurricane scenarios are discussed. Loss estimates are presented, demonstrating the effects of hurricane forward speed and sea level on the losses for the refineries as well as the HSC. Such a framework can enable hurricane risk assessment and loss estimation for petroleum infrastructure to inform future policies and risk mitigation strategies. Potential policy implications for a region like the HSC are highlighted herein as an illustration.
Introduction
Many industries in the United States (U.S.), including manufacturing, mining, and farming, depend on petrochemical products (Deka et al., 2016). The U.S. petroleum industry relies heavily on infrastructures located in the Gulf of Mexico (Chow and Elkind, 2005) which houses more than 45% of the U.S. refinery capacity and about 51% of the U.S. natural gas processing capacity (U.S. Energy Information Administration, 2019b), producing about 30% of crude oil and more than 20% of natural gas in the U.S. (Dismukes, 2011). The Houston Ship Channel (HSC) is a critical component of the petroleum industry along the U.S. Gulf Coast, home to the second-largest petrochemical complex in the world. Businesses in the HSC account for more than 1.35 million jobs in the state of Texas and contribute more than $339 billion in revenue to the state economy (Port of Houston Authority, 2019).
Among various natural hazards, the petroleum industry, including the infrastructure along the Gulf Coast, is most vulnerable to hurricanes, strong winds, storm surge, flooding, and lightning (Cruz and Krausmann, 2013). A hurricane strikes the Houston/Galveston region, which encompasses the HSC, on average every 9 years, and a major hurricane (i.e., a Category 3 or higher intensity on the Saffir Simpson scale) impacts the region every 25 years (National Hurricane Center Central Pacific Hurricane Center, 2020). Research suggests that changing climate conditions might alter the characteristics of extreme weather events including the return period of extreme rainfall events (Emanuel, 2017; Patricola and Wehner, 2018), the intensity and size of hurricanes (Mudd et al., 2014a,b; Rosowsky et al., 2016; Ting et al., 2019), and forward speed of tropical cyclones (Gutmann et al., 2018; Kossin, 2018; Chan, 2019; Hall and Kossin, 2019; Lanzante, 2019; Moon et al., 2019; Hassanzadeh et al., 2020; Yamaguchi et al., 2020; Zhang et al., 2020). Emanuel (2017) showed that the return period of rainfalls in excess of 500 mm in Houston, Texas, decreases significantly under Representative Concentration Pathway 8.5 (RCP 8.5: the scenario corresponding to unmitigated emission of greenhouse gases), dropping from 2,000 years in the late 20th century to 100 years by the end of 21st century. Similarly, Patricola and Wehner (2018) showed that climate change increases the probability of extreme rainfall events. Mudd et al. (2014a,b) studied the effects of future climate conditions such as sea surface temperature and hurricane frequency on the hurricane wind hazard along the U.S. East Coast. They reported significant increases in the 50-year wind hazard due to increase in hurricane size (radius to maximum wind speed) and intensity (maximum wind speed) as a result of potential future change in hurricane frequency alone or along with change of sea surface temperature. Rosowsky et al. (2016) also reported an increase in hurricane intensity along the U.S. East Coast under RCP 8.5. Findings from previous research on the effect of climate change on hurricane forward speed are more uncertain, predicting both an increase (Chan, 2019; Hassanzadeh et al., 2020; Yamaguchi et al., 2020) and decrease (Gutmann et al., 2018; Zhang et al., 2020) in the forward speed due to increased greenhouse gases. These climate-induced changes in hurricane characteristics will likely influence storm surge generation (Marsooli et al., 2019) and therefore loading on infrastructure in hurricane-prone regions (Done et al., 2015). Many studies have shown that hurricane size (radius to maximum wind speed), maximum wind speed (intensity), and landfall location largely dictate the peak surge response at the coast with hurricane forward speed and angle of approach being secondary factors (Irish et al., 2008; Rego and Li, 2009; Bass et al., 2018). However, hurricane forward speed influences the storm duration over both open-ocean and embayed water bodies, which may influence time-variable surge dynamics at the coast, the total volumetric flux of surge into coastal bays (Bass et al., 2018), and therefore, the vulnerability of petroleum infrastructure.
Previous hurricanes have demonstrated the vulnerability of many types of petroleum infrastructure, including platforms, ports, refineries, and storage facilities, to these extreme events (Godoy, 2007; Hoffman et al., 2009; Dismukes, 2011; Horowitz and Disis, 2017). In addition to direct fiscal losses from physical damage, hurricane impacts to petroleum infrastructure can lead to secondary losses from local and global economic, environmental and societal consequences (Palinkas et al., 1993; Kingston, 2002; Lewis, 2009). Previous studies have either focused on qualitative evaluation of direct physical damage to the built environment such as buildings, bridges, levees, storage tanks, and utility distribution networks (Cauffman et al., 2006; Godoy, 2007) or the secondary losses or cascading consequences, such as impacts on communities' wellbeing and petrochemical spills into the environment (Wu et al., 2002; Pine, 2006; Adams et al., 2007; Frazier et al., 2010). Although risk assessment frameworks have been created to investigate the vulnerability of individual components of petroleum complexes during hurricane events [e.g., business vulnerability, infrastructure resilience, flood management, and hazardous material transport (Verter and Kara, 2001; Zhang et al., 2009; Kim et al., 2011; Qi and Altinakar, 2011; Francis and Bekera, 2014; Anarde et al., 2018)], studies that analyze losses of industrial complexes comprehensively are generally lacking (Burleson, 2015).
This study addresses current gaps in risk assessment and loss estimation to petroleum facilities by posing a multi-disciplinary framework that leverages models, data, and expertise across climate and hurricane hazard modeling, infrastructure risk assessment, and economic loss estimation, while also informing potential policy implications. The integrated risk assessment framework enables a first exploration of how the vulnerability of petroleum facilities and consequent direct and secondary fiscal losses from hurricane hazards may change in a future climate. The next section details the components of this risk assessment framework including potential impacts of a changing climate to hurricane characteristics in the Gulf of Mexico, a coupled surge and wave model for simulation of hurricane hazards, and quantification of risk in terms of financial loss due to direct physical damage, facility shutdowns, petrochemical spills and associated civil fines. Application of this framework is presented in the Results and Discussion section for a case study focused on the effects of multiple hurricane hazards including surge, wave, current and wind on aboveground storage tanks (ASTs) and refineries located along the HSC. Lastly, identification of the main risk factors for the HSC is discussed along with policy considerations, and the study conclusions are provided in the Conclusions section.
Overview of the Integrated Risk Assessment Framework
Figure 1 provides an overview of the framework presented herein for risk assessment of petroleum infrastructure located in hurricane-prone regions subjected to changing climate conditions. The HSC is selected to demonstrate the application of the framework to a highly-industrialized corridor with multiple refineries exposed to major hurricane hazard. As mentioned previously, the petroleum industry is highly vulnerable to storm surge and flooding during a hurricane event. This study explores the sensitivity of hurricane-induced surge and flood hazard at target petroleum infrastructures to two parameters: hurricane forward speed (Vf) and relative sea-level rise (SLR). The focus on these parameters is motivated by findings of recent studies [e.g., Gutmann et al., 2018; Chan, 2019; Hall and Kossin, 2019; Marsooli et al., 2019; Hassanzadeh et al., 2020; Yamaguchi et al., 2020; Zhang et al., 2020] and the purpose of this paper, which is to illustrate the application of the integrated framework to a test case.
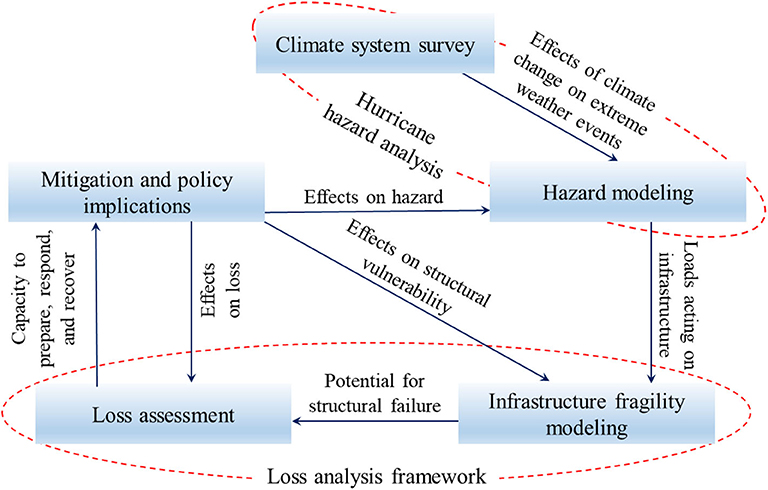
Figure 1. Overview of the integrated risk assessment framework.
The tightly coupled Simulating WAves Nearshore and ADVanced CIRCulation (SWAN+ADCIRC) model (Luettich, 2004; Dietrich et al., 2011) is then employed to simulate multiple hurricane hazards at the locations of ASTs and refineries including storm surge, currents, waves, and wind and determine the corresponding loads on infrastructure. Fragility analysis is conducted to determine the potential of structural failure of target infrastructure from these loads and inform a comprehensive analysis of direct and secondary fiscal losses. As a result, the risk to the target petroleum infrastructures is expressed in terms of monetary loss, providing useful insights on expected risk posed to petroleum facilities under current and potential future climate scenarios that may then be used to develop robust hazard mitigation strategies and policy interventions. It is noted that while this study focuses on a single case study region and therefore imposed future climate condition and petroleum infrastructures, the framework is adaptable to explore the effects of changing hurricane characteristics (e.g., hurricane size, intensity), hazards (e.g., pluvial flooding), and petroleum infrastructures (e.g., gas processing plants) elsewhere.
Hurricane Hazard Analysis
This study simulates a suite of synthetically modified historical and probabilistic hurricanes using the SWAN+ADCIRC model to capture changes in surge, wave, and wind response at target petroleum infrastructures due to potential impacts of a changing climate. SWAN+ADCIRC is a physics-based numerical model that can resolve the evolution of storm surge as well as wave generation, propagation, and dissipation both at the coast and into coastal bays, estuaries, and tributaries (Dietrich et al., 2012). The baseline storms selected for use in this study include FEMA Storms 33 and 36, two synthetic storms created for FEMA's comprehensive flood insurance study of the U.S. Gulf Coast (FEMA, 2013), and Hurricane Ike, a historical storm which made landfall at Galveston Island, Texas, in September 2008. The FEMA storms were developed using the vortex-planetary boundary layer model (FEMA, 2013) and correspond to 100- (FEMA 33) and 500-year (FEMA 36) return period still-water flood elevations in the HSC. Hurricane Ike generated significant surge in the region and is used in this study to contextualize the results of the probabilistic storm scenarios with a validated historical storm (Hope et al., 2013) derived from reliable wind and pressure fields [NOAA's Hurricane Research Wind Analysis System (Powell et al., 1998; Hope et al., 2013)].
Of the aforementioned projected impacts to hurricane characteristics, the parameters most likely to influence storm surge generation and therefore loading of petroleum infrastructure include changes to the forward translation speed (Gutmann et al., 2018; Kossin, 2018; Chan, 2019; Hall and Kossin, 2019; Lanzante, 2019; Moon et al., 2019; Hassanzadeh et al., 2020; Yamaguchi et al., 2020; Zhang et al., 2020), intensity (faster maximum winds), and hurricane size (radius to maximum wind speed) ((Mudd et al., 2014a,b; Rosowsky et al., 2016; Gutmann et al., 2018)). The influence of climate change on the forward translation speed of tropical cyclones both at a global and basin-wide scale is uncertain as modeling studies have shown both an increase (Chan, 2019; Hassanzadeh et al., 2020; Yamaguchi et al., 2020) and decrease (Gutmann et al., 2018; Zhang et al., 2020) in the forward speed of simulated future tropical cyclones. Specifically for Texas, using outputs of climate models and downscaling experiments, Hassanzadeh et al. (2020) found an increase in the northward steering winds and likelihood of faster-moving landfalling hurricanes under climate change. However, using simulations of Hurricane Ike under climate change, Gutmann et al. (2018) found a decrease in Hurricane Ike's forward speed.
Here, taking these climate projection uncertainties into account, the effect of changing forward speed, including both slower and faster hurricanes, on inland surge response is examined for a range of imposed mean sea levels. The forward translation speeds of the three baseline hurricanes (5.6, 5.6, and 6 m/s for FEMA 33, FEMA 36, and Hurricane Ike, respectively) are modified to values within the range of forward speeds typical of this region [3–12 m/s (Liu and Irish, 2019)] by altering the time component of the input wind and pressure fields. This approach generates synthetic variants of FEMA 33, FEMA 36, and Hurricane Ike with differing forward speeds but the same spatial characteristics (wind and pressure fields, track, and landfall location) as the baseline storm, which is similar in approach to the standardized modifications of synthetic and historical storms adopted in other surge response studies along the Gulf Coast (Sebastian et al., 2014; Bass et al., 2018). Three future sea levels are imposed for the slowest, fastest, and baseline storm scenarios (20, 96.5, and 173 cm above mean sea level), corresponding to the projected minimum, average, and maximum SLR in the Houston/Galveston region between 2,030 and 2,100 within the 95% confidence bounds (Kopp et al., 2014). The hurricane scenarios are analyzed in SWAN+ADCIRC simulations, and the resulting water elevations, current velocities, wind speeds, wave heights and wave periods at locations of interest are used in the loss analysis discussed in the next section.
Loss Analysis Framework
The loss analysis framework presented herein couples infrastructure fragility analysis with an economic loss analysis to quantify the monetary impact of hurricane hazards on petroleum infrastructure, namely ASTs and oil refineries. ASTs are widely used for storage of petrochemical materials at short-term storage facilities, refineries, and product terminals. Because of their light weight and thin steel shells, ASTs are vulnerable to dislocation and buckling during hurricane events (Kameshwar and Padgett, 2018b). Numerous instances of AST failures have been observed in the wake of past hurricanes (Godoy, 2007; Hyder, 2008; Sengul et al., 2012), resulting in recorded spills of more than 26.5 ml of petrochemicals for Hurricanes Katrina and Rita (Godoy, 2007) alone. Refineries are key facilities in the petroleum industry, which produce a wide range of petrochemicals from crude oil. In a hurricane event, refineries may cease operations as a result of storm surge inundation or flooding (Horowitz and Disis, 2017) and consequently suffer significant economic losses due to loss of production and inundation-induced damage. As detailed in the following sections, the total loss risk profile at a given refinery considers the following loss components: land value loss, process-unit damage loss, spill clean-up and AST repair cost, productivity loss, and civil fines. Refinery total loss is the summation of these loss components, and aggregated loss at a regional level equals the summation of the total losses of target facilities in the region.
The proposed loss analysis framework detailed below is applied to seven refineries (referred to as “Refinery 1–7” herein, as shown in Figure 2), and the ASTs located in these facilities' boundaries. All analyses conducted herein leverage only publicly accessible data for the inventory, damage, and loss estimation. Refined estimates with reduced uncertainty could leverage in-house data by owners. Information on refinery boundaries and process-units are derived from analysis of 2018 aerial imagery provided by the Houston-Galveston Area Council (H-GAC) (2018) and 2019 parcel data from Harris County Appraisal District (HCAD) (2019). The AST inventory developed by Bernier et al. (2017) is updated in this study through analysis of 2008 LiDAR data and 2018 aerial imagery from H-GAC [Houston-Galveston Area Council (H-GAC), 2018] to obtain the number, locations, and dimensions of the ASTs in the HSC in 2018. For ASTs identified in the 2018 aerial imagery of the region not present in the 2008 LiDAR data, the regression model proposed by Bernier et al. (2017) is used to estimate missing heights from AST diameters. Berm heights surrounding ASTs are also derived from the 2008 LiDAR data, and for tanks not present in 2008, berm heights are estimated based on those of other tanks at a facility of comparable size.
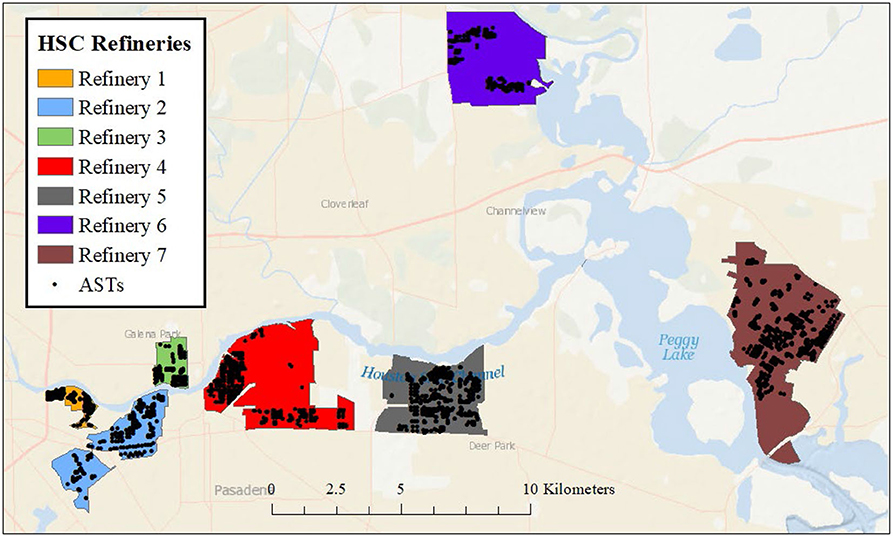
Figure 2. Refineries and ASTs in the HSC area considered in the case study.
Land Value Loss (L1)
Land value loss (L1) captures the loss of land value due to facility inundation and is here estimated based on the method proposed by Burleson (2015) as:
where VLand is the property-appraised value of land, and R1 is the land value loss ratio. As shown in Figure 3A, R1 is a function of the facility inundation ratio (IRF), which is estimated here as the ratio of wet land's area to the facility area using SWAN+ADCIRC results. Property land values for each refinery are obtained from tax assessor databases such as the HCAD (Harris County Appraisal District, 2019) and are presented in Table A1.
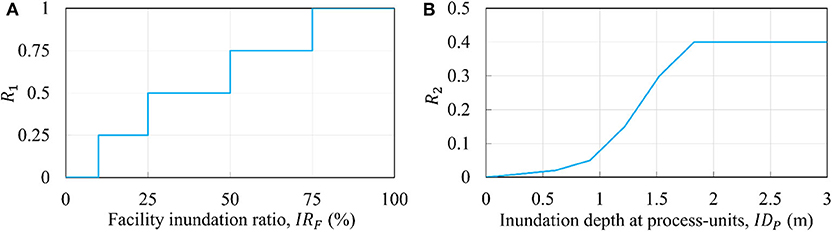
Figure 3. Function to (A) determine land value loss ratio (R1) [adopted from (Burleson, 2015)]; and (B) process-unit damage parameter (R2) [adopted from (Federal Emergency Management Agency (FEMA) Mitigation Division, 2018)].
Process-Unit Damage Loss (L2)
As proposed by Hazus (Federal Emergency Management Agency (FEMA) Mitigation Division, 2018), the loss due to inundation of process-units within each refinery is estimated by process-unit damage loss (L2 ):
where the economic loss is a function of the refinery value (VRef) and a damage parameter (R2). VRef is defined based on the refinery size, which for the refineries located along the HSC takes on a value of $750 million [Table A1 (Federal Emergency Management Agency (FEMA) Mitigation Division, 2018)] based on the Hazus classification as either a medium- or large-sized facility (A Barrel Full, 2019; U.S. Energy Information Administration, 2019b). As defined by Hazus [Federal Emergency Management Agency (FEMA) Mitigation Division, 2018], R2 is a function of inundation depth at the process-units (IDP) (Figure 3B).
Spill Clean-Up and AST Repair Cost (L3)
The methodology detailed in this section provides the probability distributions of AST repair cost, spill volume, and spill clean-up cost, considering uncertainties due to the friction coefficient at the AST base, internal liquid height, specific gravity of the internal liquid, and AST replacement cost. To determine the probability of failure for ASTs under concurrent surge, wave, and wind loading, this study utilizes parameterized fragility models for dislocation and buckling of ASTs developed by Bernier and Padgett (2019), informed by SWAN+ADCIRC outputs for surge, wave, current and wind forcing at each AST location. A parameterized fragility model is a mathematical function which determines the conditional probability of failure of an AST in terms of the applied loads and the AST geometric, structural and material parameters such as diameter (D), height (H), specific gravity (ρL) of the liquid content, internal liquid height (B), design stress value (Sd) of the steel shell, and friction coefficient (φ) at the AST base. In this study, AST dimensions are determined from the derived HSC inventory database, and the design stress value is assumed to be 160 MPa, the most common value for steel grade used in the U.S. for construction of ASTs. The internal liquid specific gravity, liquid height, and friction coefficient are treated as random variables with uniform distributions (Bernier et al., 2017). The ASTs are assumed to be unanchored, which is a common practice in facilities along the HSC (Bernier et al., 2017), and a series system is assumed for AST failure. The adopted approach for damage evaluation of ASTs, i.e., parameterized fragility models, accounts for common sources of structure-to-structure damage correlations by using the geometric, structural, and material properties of ASTs as predictors. However, additional sources of correlated damage, such as interference of adjacent ASTs on the loads or failure mechanisms, are not considered herein and should be implemented in future regional risk assessment studies.
To estimate the expected repair cost (E[CR]) of a failed AST, the framework developed by Kameshwar and Padgett (2018a) is employed, in which the AST repair cost is a fraction (α) of its replacement cost (CAST) and the failure mode and is calculated as:
where α varies uniformly between 0.8 and 1.0 [α ~ unif(0.8, 1.0)] if the AST fails due to dislocation, and in the case of buckling, it varies uniformly between 0.15 and 0.8 [α ~ unif(0.15, 0.8)] (Kameshwar and Padgett, 2018a). The replacement costs of the ASTs are determined from the Michigan tax assessor's manual (Michigan Department of Treasury, 2003) and converted to present values using the Nelson-Farrar Refinery Construction Index (Nelson-Farrar cost indexes, 2004, 2017). S, Hw, Tw, U, and W are surge height, wave height, wave period, current velocity, and wind speed at each AST location, respectively. Assuming a series-system assumption for the ASTs failure due to either dislocation or buckling, the maximum value estimated by the AST fragility models is used for the conditional probability of failure [P(Failure|D, H, ρL, B, Sd, φ, S, Hw, Tw, U, W)], and fφ(φ), fρL(ρL), and fB(b) are the probability density functions for friction coefficient at the AST base, the specific gravity of internal liquid, and internal liquid height, respectively, with the following lower and upper bounds 0.3 ≤ φ ≤ 0.7, 0.5 ≤ ρL ≤ 1, and 0 ≤ B ≤ 0.9H (Bernier and Padgett, 2019). fα(α) is the probability density function for α with the aforementioned lower and upper bounds (Kameshwar and Padgett, 2018a). To propagate uncertainty effects in the estimation of CR and the integral in Equation (3), a Monte Carlo simulation (MCS) is employed, which generates samples of the ASTs based on the aforementioned parameter distributions and estimates repair cost of each AST. For each sample in the MCS, the total repair cost (CRepair) equals the summation of the repair costs of all the failed ASTs at a target refinery:
where N is the total number of ASTs at the target refinery, and CR, i is the repair cost of each AST.
A similar approach is employed to calculate the expected spill volume. It is assumed that the ASTs completely spill their contents upon structural failure, although the internal liquid level is considered a random variable. While this assumption may result in conservative spill volumes, it is deemed acceptable due to the environmental and economic consequences of hazardous material spills (Bernier et al., 2018). The expected spill volume (E[SV]) of each AST under surge, wave, and wind loading is calculated as:
By regulation, containment berms are constructed at the perimeter of ASTs to contain hazardous material spills. In cases that the surge elevation is lower than the top of the berm, the surge does not reach the ASTs and the corresponding spill volume is zero. MCS is conducted to estimate the spill volumes for the ASTs, and for each sample in the MCS, the total clean-up cost (CClean−up) of petrochemical spills from all of the ASTs at a target refinery is calculated as:
where SVi is the spill volume for each AST (in liters), and β is the clean-up cost rate, which is taken here as an estimated $12/liter (U.S. Coast Guard (USCG), 2006). Finally, L3 is the summation of the total AST repair cost (Equation 4) and spill clean-up cost (Equation 6):
Productivity Loss (L4)
During hurricanes, refineries may need to shut down operations due to environmental concerns as well as the safety of their employees and neighboring communities. The losses incurred by refineries during this downtime are captured by productivity loss, which encompasses both losses from lack of production of new petrochemical products (LP) and the selling of existing products (LS). While the loss of production may not be compensated, the facilities can sell existing products after the hurricane has dissipated. To estimate LP and LS, the downtime duration, volumes of production and sale, production prices, and sale profits need to be determined. In this study, facility downtime (T) is estimated using the method proposed by Burleson (2015) where the total downtime at a facility is taken as a sum of the downtime attributed to three different factors:
where T1, T2, and T3 are time parameters that depend on the inundation ratio of the refinery, inundation ratio of the process-units (IRP), and spill volume at the refinery, respectively (Figure 4). It is acknowledged herein that these downtimes may be conservative as their computation implies compounding downtime over these factors rather than any parallel restoration efforts. The spill volume at each refinery (SVT) is determined by adding up the spills from individual ASTs:
It is noted that the MCS performed herein generates probability distributions for SVi and SVT, which, due to the dependency of downtime on the total spill volume, results in a probability distribution for downtime as well.
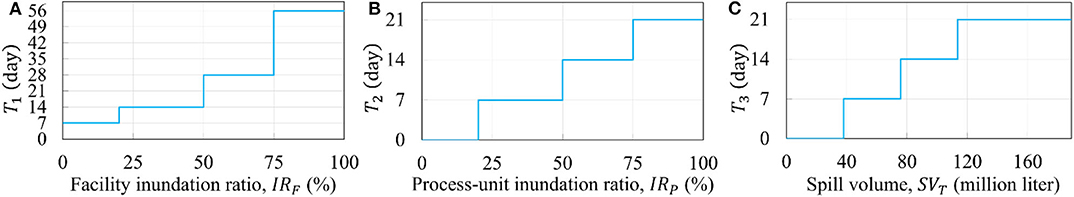
Figure 4. Time parameters in the estimation of refinery downtime due to (A) refinery inundation (B) process-units inundation and (C) petrochemical spill [adopted from (Burleson, 2015)].
Although oil refineries produce a wide range of petrochemicals, this study only estimates the productivity loss for gasoline and distillate fuel oils, which together represent more than 66% of petrochemicals produced at a typical refinery (U.S. Energy Information Administration, 2019c). Price data related to production volumes (VolP) and sale volumes (VolS) for gasoline and distillate fuel oils (Table A2) are collected from the U.S. Energy Information Administration (USEIA) databases for the Gulf Coast region (U.S. Energy Information Administration, 2019d) for three different time spans to encapsulate temporal variability in volumes and prices: average values for the 2018 calendar year, average values for the 2018 hurricane season (June-November), and average values for August and September of 2018 (peak hurricane season). The prices are assumed to be the same for the refineries along the HSC. The commodities produced at each refinery in the Gulf Coast are determined from (A Barrel Full, 2019), and the production and sale volumes for each target refinery are assumed to be proportional to the relative capacity of the refinery to the total capacity of the Gulf Coast refineries (Table A3). Production loss is then calculated as:
where j represents gasoline or distillate fuel oils, and is the production price of gasoline or distillate fuel oils, which are taken as 66% and 63% of their retail prices (), respectively (U.S. Energy Information Administration, 2019a):
Similarly, sale loss is calculated as:
where PtS is the sale profit that is determined by subtracting the wholesale price () and production price:
Finally, productivity loss (L4) is calculated by summation of production loss and sale loss of the two commodities:
Civil Fine (L5 )
Petroleum facilities are not only obligated to pay for spill clean-ups but are also subject to state and federal fines for petrochemical spills on land or in waterways. Civil penalties associated with petrochemical spills differ by state. For the state of Texas, civil penalties can include fines of up to $6.3/liter ($1,000/barrel) for any oil and gas liquid spill on land exceeding 795 liters (5 barrels) and any oil and gas liquid spill in state waterways causing a sheen (Texas Statutes, 2005; Texas Administrative Code, 2007). Given the nature of this study, spills larger than 795 liters are expected herein. Also, the maximum penalty limits are the same for spills on land or in state waterways, resulting in similar estimates for the state fines from the two categories. Therefore, only spills in state waterways are incorporated in the loss analysis framework. In addition to the state penalties, federal civil penalties include fines up to $6.92/liter ($1,100/barrel) spilled in any federal waters causing a sheen in the absence of negligence and up to $27/liter ($4,300/barrel) spilled if resulting from negligence (Clean Water Act, 1972). Here, absence of negligence and pursuit of fines by state/federal officials are assumed, and the facility is subject to either state fines, federal fines, or some combination of both. The maximum amount of fine is used herein in the analysis, modeled with a uniform probability distribution with $6.3 and $6.92 as the lower and upper bounds. The resulting civil fine (L5) is then estimated as:
where SVT (Equation 9) here is the spill volume in units of liters, and γ is the civil fine per unit volume, taken here as a uniform distribution with lower and upper bounds based on the estimates for state and federal penalties [γ ~ unif(6.3, 6.92)] in units of $/liter. It is noted that the MCS performed herein generates a probability distribution for SVT, which results in a probability distribution for the civil fine as well.
Refinery Total Loss (LT) and the HSC Aggregated Loss (LHSC )
Upon calculation of the loss components, refinery total (LT) loss is given by
and the HSC aggregated loss (LHSC) is calculated as:
where LT, k is the total loss at Refinery k.
As mentioned previously, the loss analysis framework employs MCS in which the effects of uncertainty sources such as the friction coefficient at the AST base, internal liquid height, specific gravity of the internal liquid, and AST replacement cost are propagated by generating 200,000 samples for each AST, assuring convergence of the expected values and coefficients of variation of the estimated parameters. As a result, some of the intermediate parameters and final loss estimates are evaluated probabilistically, while the rest of the parameters are calculated via a deterministic approach (Table 1). In the following sections, the deterministically-calculated parameters and expected values of the probabilistically-estimated parameters are presented, along with the probability distribution of refinery total loss estimates.
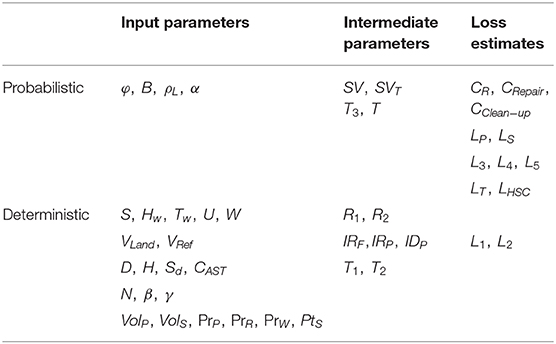
Table 1. Parameters and estimation methods used in the loss analysis framework.
Results and Discussion
In this study, the total loss incurred by a refinery during a hurricane event consists of five types of losses: land value loss, process-unit damage loss, spill clean-up and AST repair cost, productivity loss, and civil fine. The magnitude of each of these losses is primarily a function of the maximum water level at the facility location (i.e., storm surge). As explained in the Loss Analysis Framework section, the land value loss and process-unit damage loss depend on the facility inundation ratio (Equation 1 and Figure 3A) and inundation depth at process-units (Equation 2 and Figure 3B), respectively, which both depend on the depth of storm surge at the facility. Likewise, Bernier and Padgett (2019) showed that, while multi-hazard effects are important, storm surge is the most dominant load acting on ASTs during hurricane events; consequently, the modeled spill clean-up, AST repair cost, and civil fine (proportional to spill volume) are all driven by the maximum surge at each AST location. Lastly, productivity loss is dependent on the facility downtime (Equations 10, 12, and 14) which is a function of the facility inundation ratio, the process-unit inundation ratio, as well as the spill volume (Equation 8 and Figure 4), again, all of which are influenced by the water elevation. Given the importance of the maximum water elevation in the loss estimation, the results of the case study are organized to first identify large-scale changes in storm surge both regionally and within the HSC due to the simulated climate impacts and then investigate the sensitivity of monetary losses at the seven target refineries to the observed changes in hurricane hazards.
Hurricane Hazards
Figure 5 provides a regional overview of the maximum water elevations for the baseline Hurricane Ike, FEMA 33, and FEMA 36 simulations, as well as the upper and lower range of forward speeds simulated in this study for each storm (all with SLR = 0). The highest surge levels within the HSC are generated by the slowest variants of FEMA 33 and FEMA 36 (Vf = 3 m/s). Recalling that the baseline FEMA 33 and FEMA 36 storms (i.e., SLR = 0 and Vf = 5.6 m/s) correspond to ~100- and 500-year return period still-water flood elevations in the HSC, this landfall location west of Galveston Bay directs the most intense winds at the bay coastline and therefore ideal conditions to maximize surge generation (via wind setup) and propagation toward the Houston/Galveston region. In contrast, Hurricane Ike makes landfall directly over the bay which directs the most intense winds to the east of the Houston/Galveston region. Hence, Hurricane Ike does not produce large surge elevations within the HSC, and interestingly, surge elevations are larger for the original hurricane forward speed than the slower or faster modifications. Consistent with the findings of Bass et al. (2018), the surge response at the coast does not significantly vary with forward speed for all three storms, and thus the increase in peak surge as well as inundated area in the HSC due to the decreasing forward translation speed of FEMA 33 and FEMA 36 is likely a result of the increase in the storm residence time over Galveston Bay. Likewise, an increase in forward translation speed for FEMA 33 and FEMA 36 results in a decrease in storm residence time over the bay, producing a lower maximum surge and a smaller inundation extent within the HSC. Hence, the effect of changing hurricane forward speed on water levels in the HSC depends on both the storm track and landfall location.
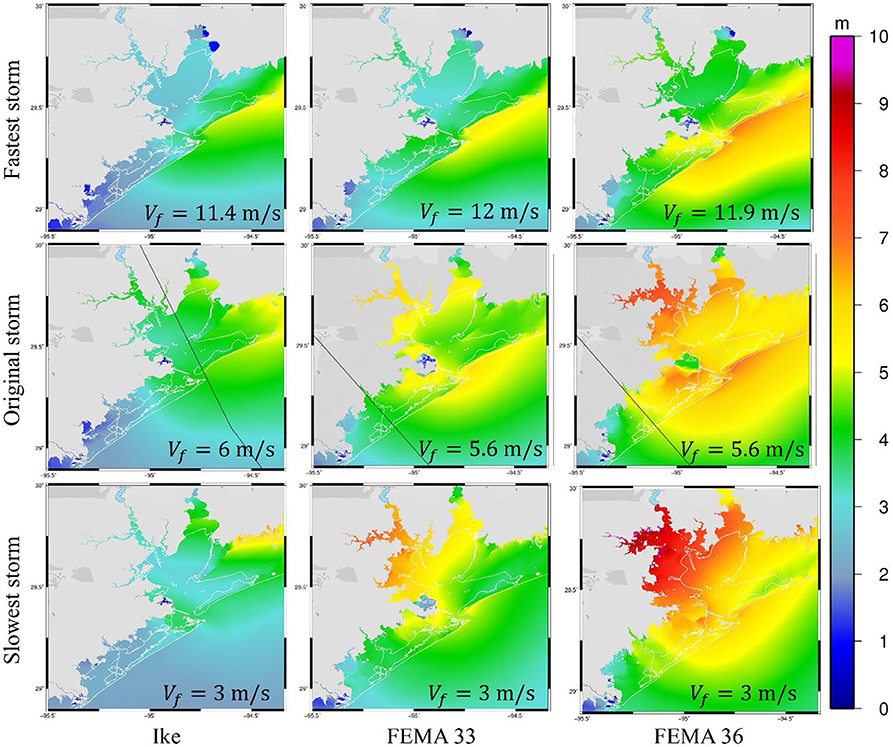
Figure 5. Maximum water elevations for the baseline, slowest and fastest hurricane scenarios (SLR = 0 cm).
The sensitivity of the maximum water elevation to both hurricane forward speed (increase and decrease) and SLR is shown in detail for the HSC in Figure 6. For simplicity, only FEMA 33 is shown in Figure 6 as Hurricane Ike and its simulated synthetic variants did not produce significant surge in the HSC and trends in maximum water levels were consistent between FEMA 33 and FEMA 36. For all storm scenarios, an increase in mean sea level results in higher maximum water levels in the HSC. In summary, the effect of the simulated climate impacts (i.e., increase in mean sea level and decrease in storm forward speed) on maximum water levels in the HSC are only significant for the probabilistic storms (FEMA 33 and FEMA 36) due to their landfall location, which as discussed in the following section, results in larger economic losses at the target refineries due to larger inundation depths.
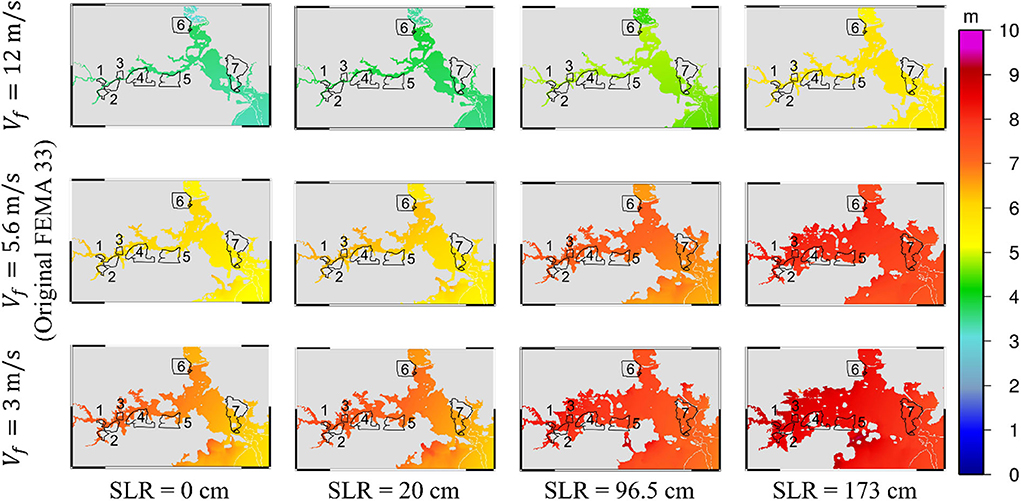
Figure 6. Effect of SLR and (select) forward speeds on the maximum water elevations of FEMA 33 in the HSC and the target refineries.
Economic Impacts
The hurricane hazard intensity measures, i.e., surge level, wave height, current velocity, and wind speed from the SWAN+ADCIRC simulations, are used to estimate economic losses in the HSC via calculation of intermediate parameters at the target refineries, including the facility inundation ratio, inundation depth at process-units, expected spill volume, and expected downtime. In the following section, the sensitivity of the intermediate parameters to variations in maximum water elevation is first presented, followed by a discussion of the role of refinery features. Estimates of the loss components, refinery total losses, and the HSC aggregated loss are presented, and the profile and probability distribution of refinery total loss are explained.
To study the effects of temporal variations of the refineries' production and sale volumes and prices, the data from three different time spans are used here: average values for the 2018 calendar year, average values for the 2018 hurricane season, and average values for August and September of 2018. The analysis results show that the difference between the maximum and minimum refinery total loss estimates for the time spans is <6% in the majority of the simulations and reaches 10% in a few cases. Accordingly, such differences are not discussed further in this paper, and only the loss estimates from the average values of production and sale volumes and prices in 2018 are reported.
Sensitivity of Intermediate Parameters to Changing Climate Forcing
The forward speed and SLR affect water elevations, and therefore, influence the intermediate parameters and loss estimates. Existing research predicts both an increase (Chan, 2019; Hassanzadeh et al., 2020; Yamaguchi et al., 2020) and decrease (Gutmann et al., 2018; Zhang et al., 2020) in the forward speed of hurricanes due to changing climate conditions. To account for the potential changes of this parameter, typical hurricane forward speeds for the case study region [3–12 m/s (Liu and Irish, 2019)] are investigated herein. Also, three future sea levels (20, 96.5, and 173 cm above mean sea level) are imposed for the slowest, fastest, and baseline storm scenarios, which correspond to the projected minimum, average, and maximum SLR in the study region between 2,030 and 2,100 within the 95% confidence bounds (Kopp et al., 2014). While FEMA 33 is used here to discuss such effects, similar patterns are observed for the other hurricanes. Figures 7, 8 show variations of the intermediate parameters due to the changes in forward speed of FEMA 33 and SLR, respectively. These figures reveal that the facility inundation ratio and inundation depth at process-units go up for slower forward speeds and larger SLR (Figures 7A,B, 8A,B). This can be attributed to higher water elevations across the HSC (Figure 6) in the case of slower speeds of FEMA 33 and higher SLR values. It is noted that the increase in the inundation depth at process-units due to an increase in sea level is non-linear, and in almost all cases is less than the amount of SLR (Figure 8B). Also, the hurricane scenarios with higher water elevations produce stronger impacts on more ASTs, leading to increased expected spill volume (Figures 7C, 8C). Downtime is a function of spill volume and inundation ratio of the facility and its process-units, which all increase due to higher water elevations. It is noted that downtime of a refinery is determined by the summation of three time parameters, i.e., T1, T2, and T3 (Equation 8 and Figure 4). Since these parameters are step functions of the intermediate parameters, expected downtime does not increase in some cases, in which it takes the minimum value of 7 days, e.g., Refinery 6 in Figures 7D, 8D. In such cases, inundation ratio of the process-units and expected spill volume are negligible, resulting in T2 = T3 = 0, and while the inundation ratio of the facility increases due to the variations in forward speed and SLR, it remains <20%, resulting in T1 = 7.
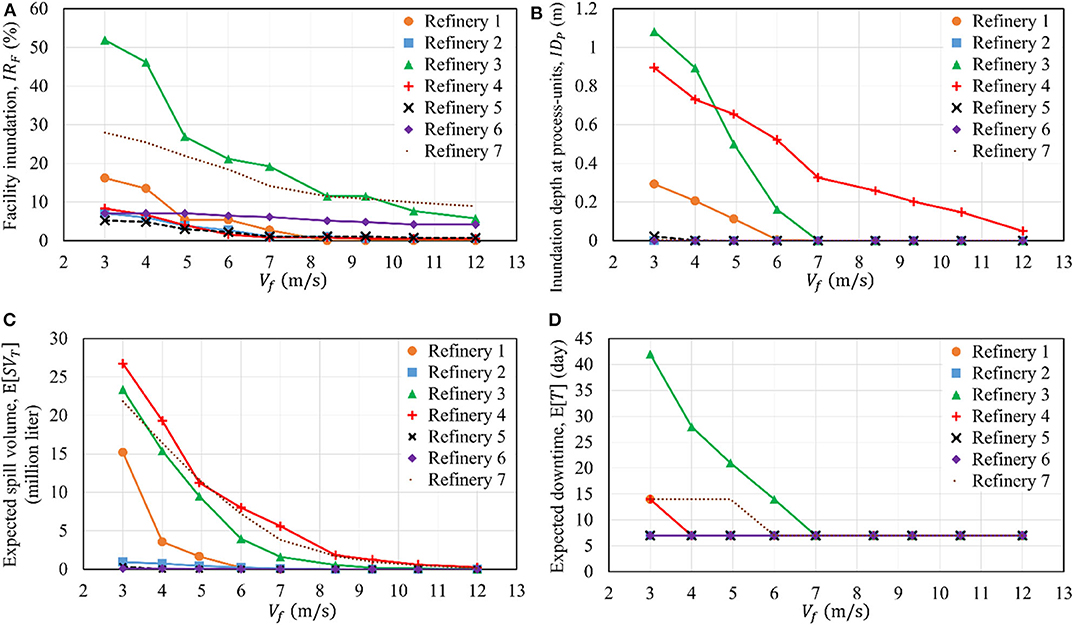
Figure 7. Effect of forward speed of FEMA 33 (SLR = 0 cm) on the intermediate parameters used in the loss analysis. (A) Facility inundation, (B) Process-units inundation, (C) Spill volume, (D) Refinery downtime.
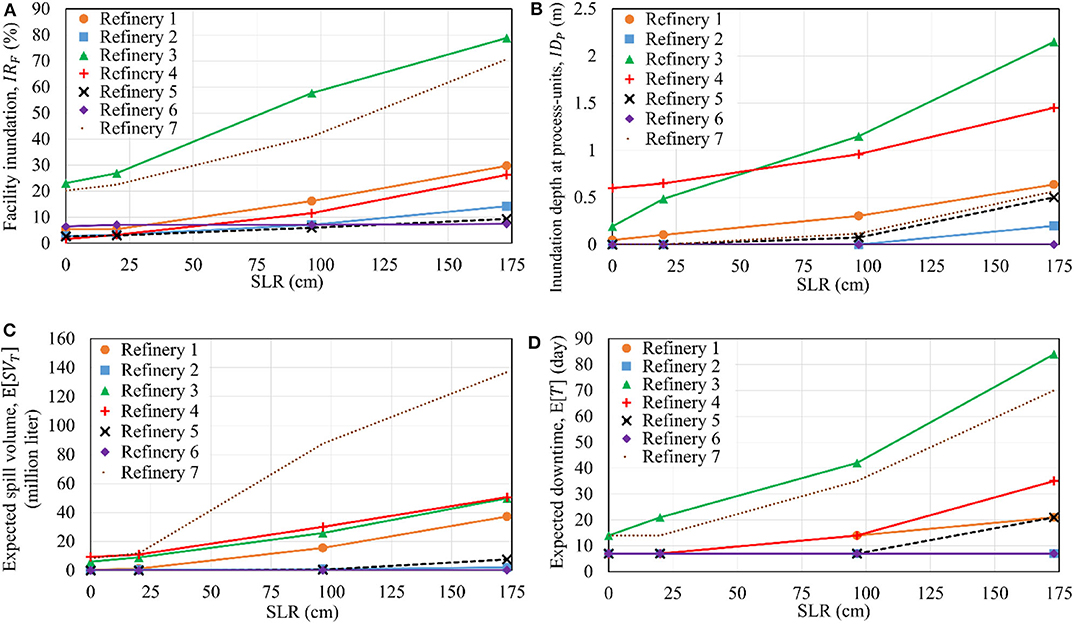
Figure 8. Effect of SLR of FEMA 33 (original forward speed, i.e., 5.6 m/s) on the intermediate parameters used in the loss analysis. (A) Facility inundation, (B) Process-units inundation, (C) Spill volume, (D) Refinery downtime.
Role of Refinery Features
As Figures 7, 8 show, the intermediate parameters at Refineries 1, 3, 4, and 7 are usually more sensitive to the changes in hurricane forward speed and SLR. The sensitivity is attributed to the refineries' features such as facility average elevation, process-unit average elevation, average elevation of ASTs, and storage capacity of refinery, which are compared for the seven refineries in Figure 9. As the figure shows, Refineries 1, 3, and 7 are always among the four facilities with the lowest elevation parameters. Accordingly, the facility inundation ratio and inundation depth at process-units are very sensitive to the water elevation at these refineries as influenced by changes in the forward speed and SLR. Similarly, the ASTs located at these three refineries are susceptible to storm surge and consequent damages. Refineries 2 and 6, on the other hand, are often the ones with the highest elevation parameters, making these two facilities less vulnerable to water level variations caused by the forward speed and SLR. Compared to the sensitive facilities, i.e., Refineries 1, 3, and 7, because of the higher elevation parameters of Refinery 5, this facility displays less sensitivity to the changes in the forward speed and SLR. Refinery 4 displays unique features. On one side, due to low average elevation of its process-units and ASTs and its considerable storage capacity, inundation depth at process-units and expected spill volume of Refinery 4 are very sensitive to variations of the forward speed and SLR. On the other side, Refinery 4 has the highest average facility elevation among the seven refineries. Therefore, <10% of Refinery 4 is inundated in hurricanes with relatively low water elevations (Figure 7A). However, the facility inundation ratio increases in more severe hurricanes (Figure 8A) due to its location relative to the HSC (Figure 2), which is significantly inundated as sea level increases (Figure 6).
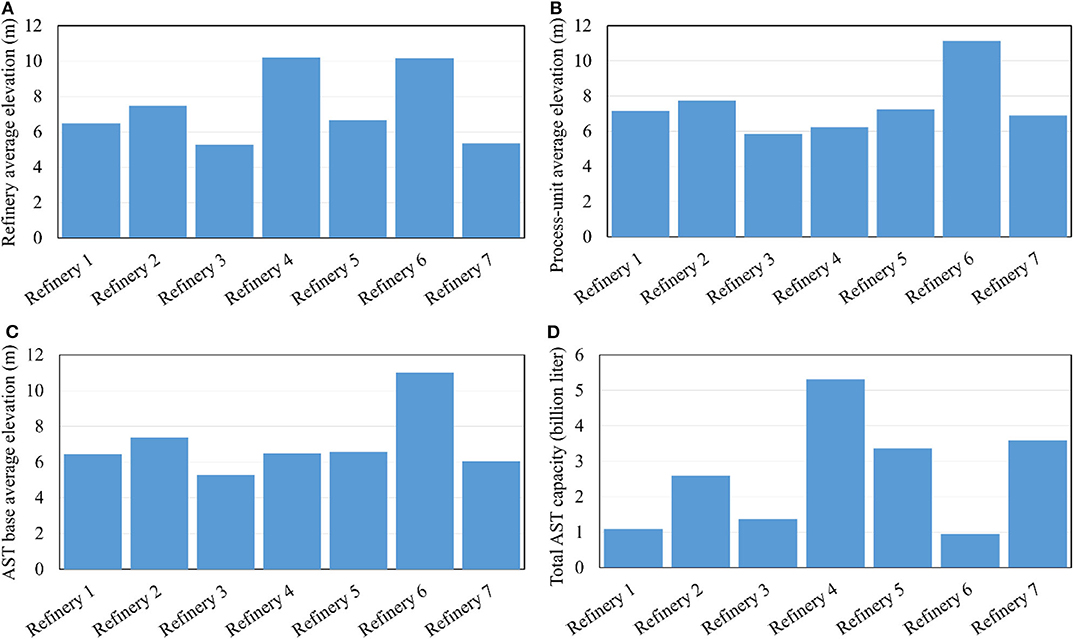
Figure 9. Comparison of the refineries' features: (A) Refinery average elevation, (B) Process-unit average elevation, (C) AST base average elevation, (D) storage capacity.
Estimates of the Loss Components and Loss Risk Profile
With a better understanding of the relative effect of different climate impacts (i.e., storm forward speed and SLR) on the intermediate parameters, this section presents estimated loss components to help understand the relative contribution of different loss components to the total loss, termed the loss risk profile. Moreover, the influence of climate impacts on these loss components is explored. Although all of the seven refineries display similar loss risk profiles, for expository purposes, the discussion here focuses on Refinery 7. Figure 10 displays estimates for the loss components at Refinery 7 subjected to FEMA 33, for which slower hurricanes and larger SLR result in higher water elevations. Along with the intermediate parameters (Figures 7, 8), the various loss components (Figure 10) increase as the forward speed of FEMA 33 decreases or when sea level increases. Different loss risk profiles are observed for different scenarios. That is, for hurricanes with low water elevations, AST damage and spill volume are insignificant, and the total loss is dominated by production loss. However, for hurricanes with higher water elevations, the AST damage and spill volume increase, considerably increasing the contribution of spill clean-up cost and civil fine to refinery total loss. In other words, depending on the hurricane severity, two general loss profiles exist: (a) hurricanes generating low water elevations, in which refinery total loss is dominated by production loss, often accounting for more than 70% of the total loss; (b) severe hurricanes with high water elevations, resulting in significant AST damage and spill, in which refinery total loss is dominated by production loss and spill clean-up cost. It should be noted that larger spill volumes not only increase the spill clean-up cost and civil fine but also lengthen the refinery downtime, which indirectly increases the production loss.
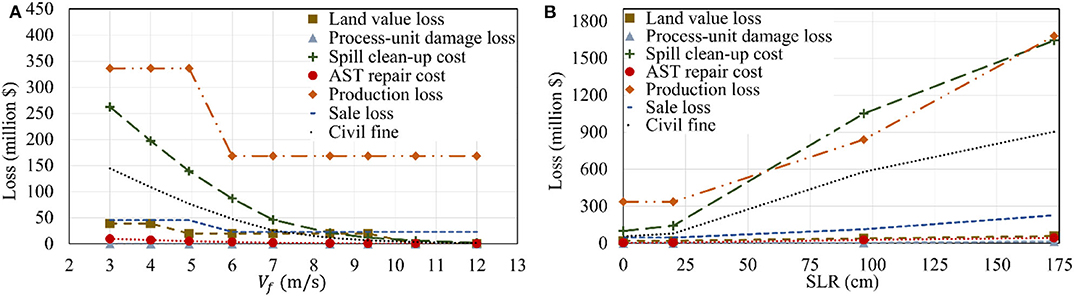
Figure 10. Effect of (A) the forward speed and (B) SLR of FEMA 33 on the loss components at Refinery 7.
In Figure 10A, production loss and sale loss resemble step functions. This is due to the definition of refinery downtime (Equation 8) and the step functions used in the determination of downtime (Figure 4). Comparison of the components of productivity loss shows that production loss is significantly larger than sale loss, which is attributed to relatively large production volumes and small sale volumes as reported in Table A3. In this regard, while the facilities lose the opportunity to produce petrochemicals during a shutdown, they are able to sell existing products once the refinery operations are resumed, which eventually reduces the contribution of the sale loss to the refinery total loss. Comparison of spill clean-up cost and AST repair cost provides additional insight, indicating that AST repair cost is considerably smaller and could be neglected without impacting the total loss estimates. Predictive modeling of AST performance, however, is essential to estimating facility level losses given their direct impact on estimated spill volumes and associated losses (e.g., clean-up cost, civil fines, and productivity loss).
Total Loss Estimates
The expected values of total loss estimates for each of the refineries subjected to Hurricane Ike, FEMA 33, and FEMA 36 are presented in Figure 11 for hurricanes with different forward speeds and in Figure 12 for different SLR values. As the figures show, the refineries' expected losses vary in a large range from $10 million to $8 billion, depending on the hurricane scenario. The expected value of the aggregated loss of the seven refineries varies from $600 million to $21.5 billion. The loss estimates generally follow the trend of maximum water elevations generated by the hurricanes, although facility and structural features can have a significant influence on the damage and subsequent losses. That is, in the case of Hurricane Ike without SLR (Figures 11A,B), the water elevations are maximum at Vf = 6 m/s. Similarly, the HSC aggregated loss is maximum at Vf = 6 m/s (Figure 11B). Although Refineries 4 and 7 follow the same pattern, the total loss at the rest of the refineries does not change with the forward speed. That is, in the case of Refineries 1, 2, 3, 5, and 6 subjected to Hurricane Ike without SLR, all of the expected loss components are negligible except for the productivity loss, which is proportional to the refinery downtime as well as the production and sale volumes. In this case, the refinery downtime takes the minimum value of 7 days, making the refinery total loss estimates proportional to the production and sale volumes provided in Table A3, which follow the same order as the one in Figure 11A. In the case of FEMA 33 and FEMA 36, the hurricanes create higher water elevations than Ike, causing additional losses and increasing the refinery total loss estimates. For these two hurricanes, the maximum water level is higher for slower hurricanes, and the loss estimates follow the same pattern as displayed in Figures 11C–F. Particularly, slower versions of FEMA 33 and FEMA 36 result in considerable spills at the refineries, which not only increase the total loss estimates, but also, depending on the refineries' features, change the order of the refinery total losses compared to Hurricane Ike (Figure 11A). For faster versions of FEMA 33 and FEMA 36, the order of refinery total loss is the same as the order observed for Hurricane Ike. As the figure shows, some of the refineries, e.g., Refineries 1, 3, 4, and 7, are more sensitive to the variations of forward speed for FEMA 33 and FEMA 36, a pattern similar to the one observed for the intermediate parameters in previous sections. In the case of Hurricane Ike, however, water elevations are often lower than FEMA 33 and FEMA 36, and effect of the refineries' features (i.e., storage capacity and the elevation parameters) is insignificant.
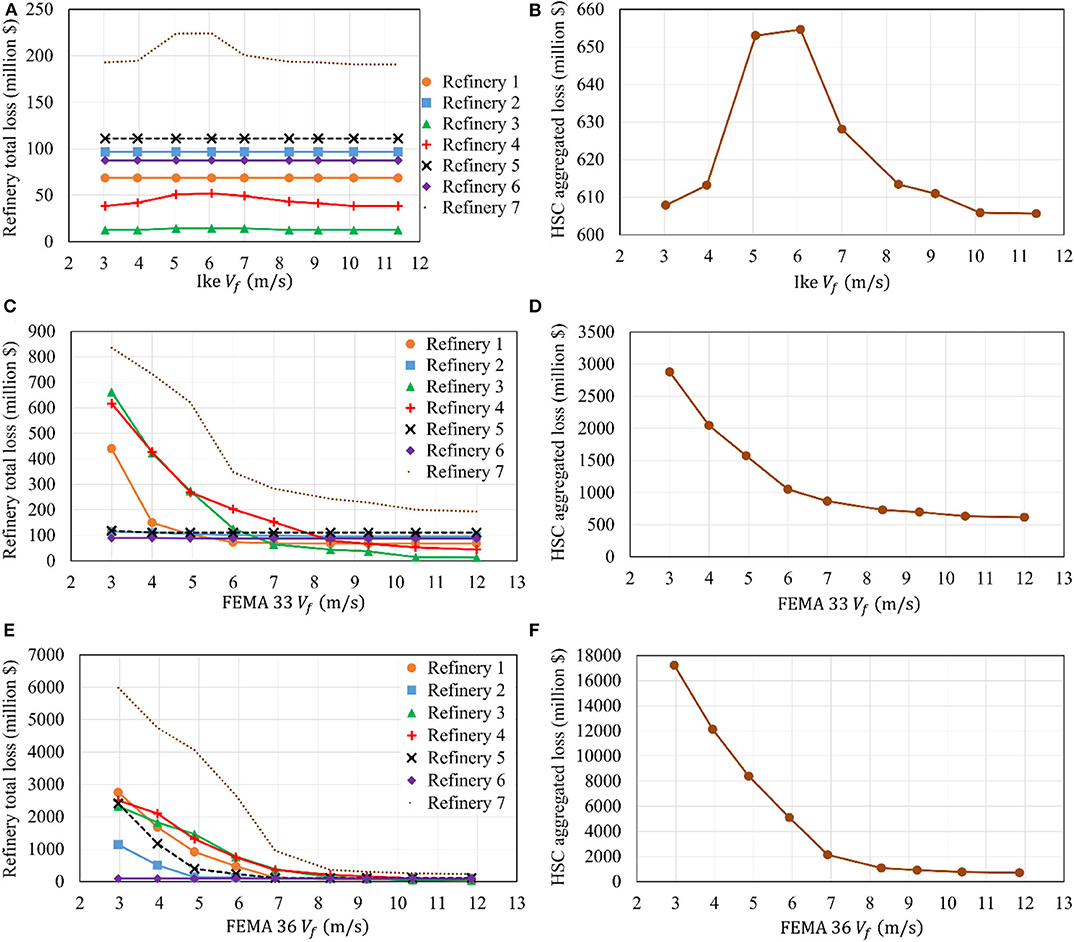
Figure 11. Effect of forward speed of Hurricane Ike, FEMA 33, and FEMA 36 on the refinery total losses and the HSC aggregated loss (SLR = 0 cm).
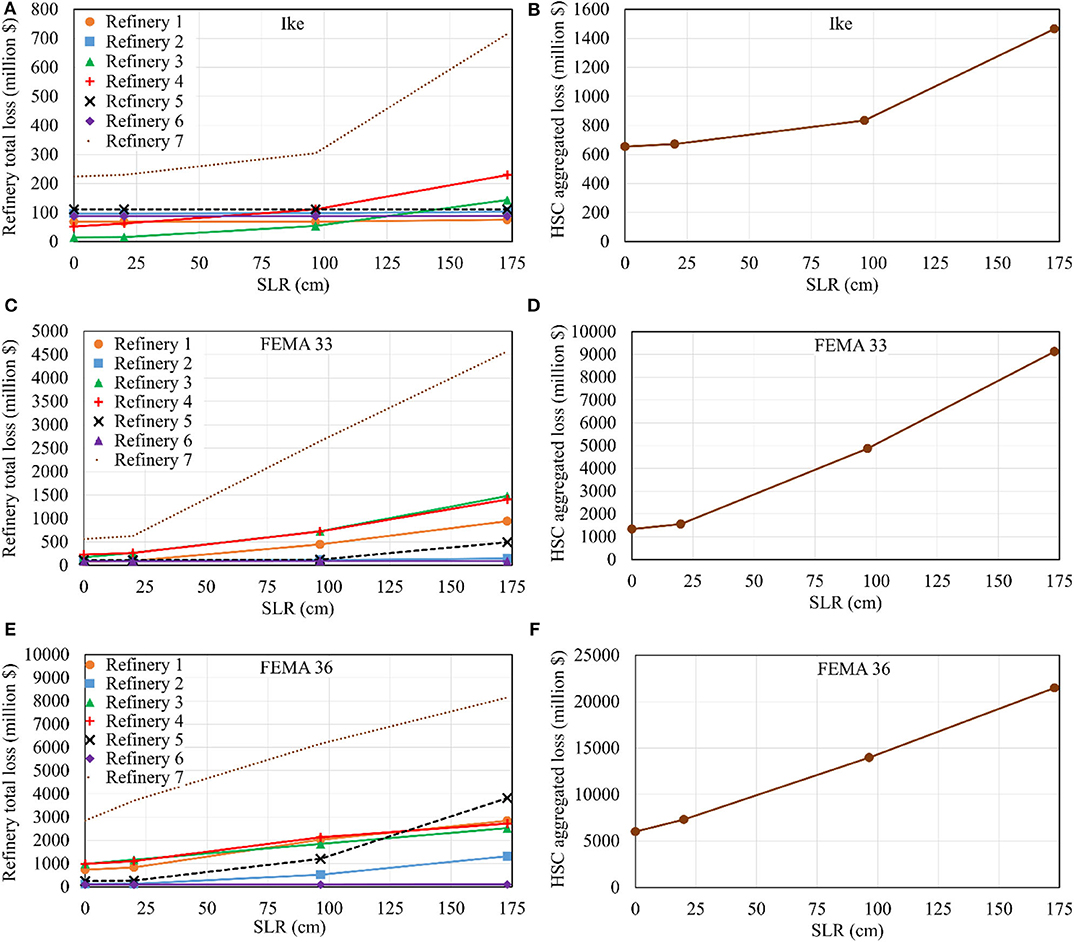
Figure 12. Effect of SLR on the refinery total losses and the HSC aggregated loss caused by Hurricane Ike, FEMA 33, and FEMA 36 with their original forward speed.
Figure 12 shows the effect of SLR on the estimates for the refineries' losses and the HSC aggregated loss. In this case, higher SLR produces higher water elevations which result in larger loss estimates. In other words, the refinery total loss estimates increase with SLR. However, variation of loss at some facilities, e.g., Refineries 1, 3, 4, and 7, is more sensitive to the sea level variations, which is attributed to the refineries' features such as the elevation parameters and storage capacity, displayed in Figure 9 and discussed in previous sections. The HSC aggregated loss follows the same pattern as the refinery total loss estimates and increases with SLR, almost linearly in the case of FEMA 33 and FEMA 36.
Probability Distribution of Refinery Total Loss
In addition to exploring the loss estimates and loss risk profile based on the expected losses in the prior sections, this section explores the uncertainty in that total loss per refinery, and the probability distribution of the total losses is evaluated. The uncertainties related to AST failure and spill volumes (which affect a number of loss components) are considered, such as the internal liquid height and consequently volume of contents, specific gravity of the internal liquid, AST replacement costs, and the friction coefficient at AST base. As discussed in the Loss Analysis Framework section, MCS with 200,000 samples is conducted to determine the probability distributions with converged estimates for the expected values and corresponding coefficients of variation.
As a result of probabilistic modeling, uncertainty is propagated in estimating the spill volume, AST repair cost, and refinery downtime, resulting in distributions for the spill clean-up cost, AST repair cost, productivity loss, and civil fine, while land value loss and process-unit damage loss are taken as deterministic for the present study. The uncertainties considered herein result in coefficients of variation for refinery total loss which are relatively low, and in a few cases reach up to 0.44 for refineries and 0.10 for the HSC aggregated loss. It is acknowledged that this study has not taken into account several potential sources of uncertainty such as those in the loading conditions, refineries' valuations, rate of clean-up cost, production and sale volumes and prices, and civil fines per unit volume of spill. Such uncertainties should be explored in the future to obtain a richer understanding of the distribution of total losses per refinery and uncertainty in the aggregate HSC losses.
For the proposed framework and included sources of uncertainty, the distribution of total losses is derived as presented in Figure 13 for Refinery 7. As this figure reveals, the total loss distribution varies based on severity of the hurricane scenario. For hurricanes with relatively low water elevation and consequently insignificant AST damage and spill volume (Figure 13A), the spill clean-up cost and AST repair cost are low and vary in a small range. Furthermore, the downtime due to spill and inundation of process-units is zero (T2 = T3 = 0) for these samples, and the refinery downtime takes on its minimum value, resulting in nearly deterministic productivity loss estimates. In such cases, the summation of land value loss, process-unit damage loss, and productivity loss yield a spike on the left side of the distribution, and samples with non-zero spill and AST damage result in higher and more variable total losses, although at much lower frequency. For other scenarios with higher water elevations, like Figure 13B, where uncertainties related to AST damage and spill volumes play a larger role and losses are generally higher, the total loss distribution tends toward a normal distribution. For extremely severe hurricanes, e.g., Figure 13C, uncertainties in the loss estimates increase and the loss distribution tends toward a bimodal or multimodal distribution. This can be attributed primarily to the adopted downtime model (Figure 4), where distinct downtime estimates are assumed per level of spill volume, coupled with the fact that larger yet uncertain spill volumes are estimated for such severe storms. While only Refinery 7 is presented here for illustration, the probability distribution of total loss at other refineries and the HSC aggregated loss generally follow the same pattern discussed in this section.
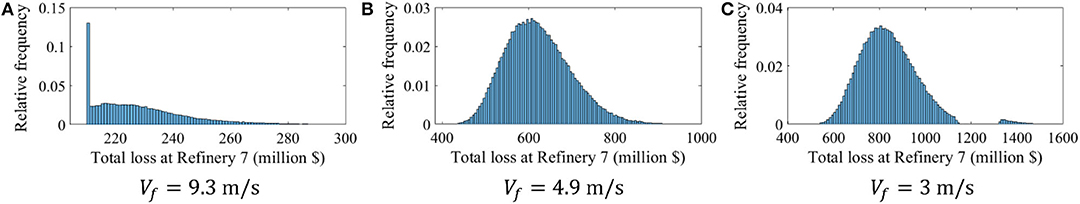
Figure 13. Histogram of the total loss at Refinery 7 subjected to FEMA 33 with different forward speeds and SLR = 0 cm.
Policy Considerations
The results in previous sections illustrate how the proposed framework can uncover the implications of climate risks to petroleum infrastructure including hazard impacts and losses. Such insights can support sustainability and resilience planning for facilities. Although theoretical expected outcomes from sustainability and resilience planning are seemingly straightforward, implementation of plans that comprehensively consider operational obligations is complex. While facilities tend to become multidimensional and interdependent, they also have to face rapidly-diversifying risks, making current risk assessment policies insufficient. To complement existing policies, a paradigm shift is required to integrate practices from all lines of business within a facility. In the hazardous industries, companies deal with numerous challenges and policy obligations from internal and external agencies (Center for Chemical Process Safety (CCPS), 1995, 1998; American Society of Civil Engineers, 2014). Although well-organized emergency plans result in less damage and quick resumption of operations in extreme events (FM Global, 2004), robust polices that prepare facilities for facing extreme weather events are generally lacking (U.S. Chemical Safety Hazard Investigation Board, 2018). The standards provided by the U.S. Occupational Safety Health Administration (2000) and the U.S. Environmental Protection Agency (1996) cover hazardous substances, however, the explicit requirements of these standards for flood and storm surge events are ambiguous. In this regard, state and federal policies and industry practices need to be improved, and gaps, overlaps, discrepancies, and redundancies within and between different agencies should be identified. Furthermore, future research can evaluate the policies that determine shutdown and startup of refineries in hurricane events, and the costs associated with different policies can be estimated using the framework developed in this study. Such avenues are ripe for future research contributions and benefit from the integration of quantifiable frameworks, such as that posed in this paper, within a more nuanced and often qualitative policy analysis that extends well beyond the risk metrics considered herein.
Conclusions
Vulnerability of the petroleum industry to hurricane events and expected effects due to a changing climate on hurricane characteristics such as return period, size, intensity, and forward speed influence the risk posed to petroleum infrastructures in hurricane-prone regions such as the Gulf Coast. This study developed an integrated risk assessment framework which considers the effects of future climate conditions on hurricanes and calculates the risk in storm surge events in terms of monetary losses. The framework consists of determining potential future hurricane scenarios, employment of SWAN+ADCIRC hydrodynamic models to simulate the hurricane scenarios, vulnerability assessment of target petroleum infrastructure subjected to the hurricanes effects, and estimation of loss, including land value loss, process-unit damage loss, spill clean-up and AST repair cost, productivity loss (comprised of production loss and sale loss), and civil fine.
In a case study, seven refineries along the HSC and the ASTs within the refineries' boundaries were studied subjected to three hurricane scenarios with different forward speeds and SLR. The selected hurricanes include Hurricane Ike, a historical surge event in the HSC area, and two synthetic hurricanes, i.e., FEMA Storm 33 and FEMA Storm 36, respectively, representing 100- and 500-year return period still-water flood elevations in the region. The information on the refineries, their process-units, ASTs, production and sale volumes and prices were collected from publicly accessible sources including the literature, H-GAC and HCAD, the USEIA databases. Refined estimates with reduced uncertainty could leverage in-house data by owners. Gasoline and distillate fuel oils were considered in the loss analysis, covering more than 66% of petrochemicals produced at a typical refinery. Furthermore, different sources of uncertainty such as friction coefficient at ASTs base, internal liquid height, specific gravity of the internal liquid, and ASTs replacement cost were considered in the analyses. To study the effects of temporal variations in production and sale volumes and prices, three different time spans were considered. Comparison of the mean loss estimates from different time spans (i.e., average values of 2018, average values for hurricane season of 2018, and average values for August and September of 2018) revealed very small differences between the maximum and minimum estimates, reaching up to 10% in a few cases only.
The hazard analysis showed that depending on the hurricane track, different forward speeds affect the maximum water elevations differently, providing new insight about the effects of hurricane forward speed on inland surge. In the case of FEMA 33 and FEMA 36 which follow a similar track, maximum water elevations in the HSC are higher for slower hurricanes. However, in the case of Hurricane Ike, water elevations are higher for the original hurricane than its slower or faster modifications. SLR influences water elevations consistently, producing higher water elevations due to higher SLR values. The loss analyses indicate that the maximum water elevation is a good indicator of the risk posed to the facilities, resulting in larger losses for hurricane scenarios with higher maximum water elevations. The intermediate parameters in the loss analysis framework, i.e., the facilities' inundation ratio, inundation depth, expected spill volume, and expected downtime, follow a similar pattern and increase with the maximum water elevations, resulting in a similar pattern for the loss components, refinery total loss, and the HSC aggregated loss. Some of the refineries, however, exhibit more sensitivity to the changes in maximum water elevations, which is attributed to the refineries' features such as storage capacity and the elevation parameters, i.e., average elevations of the facility, its process-units and its ASTs.
For the hurricane scenarios analyzed in this study, the refinery total loss estimates vary between $10 million and $8 billion, and the HSC aggregated loss varies between $600 million and $21.5 billion. In addition to the magnitude of losses, the loss risk profile and the probability distribution of the loss estimates are influenced by hurricane severity. In hurricane scenarios with lower water elevations, refinery total loss is dominated by production loss, and the loss histogram displays a spike for the lowest loss estimate and larger loss values with lower weights. In the case of hurricanes with higher water elevations, the histogram tends toward a normal distribution. Such hurricane scenarios often produce larger spill volumes, resulting in larger spill clean-up costs and larger civil fines. Extremely severe scenarios result in a bimodal or multimodal probability distribution for refinery total loss. The coefficient of variation of loss estimates is often small for the uncertainty treatment considered, reaching a maximum of 0.44 for the refinery total loss estimates and 0.10 for the HSC aggregated loss in a handful of cases.
The integrated risk assessment framework developed in this study enables a comprehensive analysis of the risk posed to petroleum infrastructure subjected to multiple hurricane hazards by taking into account the effects of changing climate conditions, different types of losses, and various sources of uncertainty. In the future, additional sources of uncertainty, e.g., hazard uncertainty or other factors affecting the cost and loss modeling, should be incorporated in the analyses, and the framework should be expanded to enable risk assessment of petroleum facilities subjected to extreme rainfalls and pluvial flooding events. Furthermore, the risk assessment framework could be coupled with statistical-dynamical hurricane/surge models such as the one used in Marsooli et al. (2019) to comprehensively account for effects of changing climate on hurricane-induced storm surge. Finally, future research will leverage the proposed framework for quantitative evaluation of different policies and mitigation strategies, e.g., elevating critical equipment, regulating the siting of certain infrastructure such as storage tanks, or investing in local or regional scale hurricane protection systems like dikes and levees, providing insight on the effectiveness of different policies and strategies and their impacts on the industry.
Data Availability Statement
The raw data supporting the conclusions of this article will be made available by the authors, without undue reservation.
Author Contributions
ME and KA: conceptualization, methodology, data collection, modeling, analysis, investigation, visualization, writing—original draft. KC: conceptualization, methodology, data collection, modeling, analysis, investigation, visualization, writing—review and editing. JP: conceptualization, supervision, writing—review and editing, funding acquisition, project administration. RM: conceptualization, supervision, writing—original draft. PH, TL-T, and PB: conceptualization, supervision, writing—review and editing. All authors contributed to the article and approved the submitted version.
Funding
The financial support for this project was provided by the Rice University Creative Ventures funding and its creation of the Center of Excellence for Resilience of Industrial & Energy Infrastructure (CERISE). The contributions of the first author were also partly supported by the Shell Center for Sustainability, and of the third and fourth authors in part by the National Science Foundation under Grant No. CMMI-1635784.
Conflict of Interest
The authors declare that the research was conducted in the absence of any commercial or financial relationships that could be construed as a potential conflict of interest.
Acknowledgments
The authors gratefully acknowledge the financial support of the sponsors of this research project and thank Dr. Clint Dawson, Dr. Casey Dietrich, and the Texas Advanced Computing Center for use of their computing resources. The findings presented are those of the authors and do not necessarily reflect the views of the sponsors.
Supplementary Material
The Supplementary Material for this article can be found online at: https://www.frontiersin.org/articles/10.3389/fbuil.2020.00104/full#supplementary-material
Abbreviations
AST, Aboveground storage tank; CERISE: Center of Excellence for Resilience of Industrial and Energy Infrastructure; FEMA, Federal Emergency Management Agency; HCAD, Harris County Appraisal District; H-GAC, Houston-Galveston Area Council; HSC, Houston Ship Channel; MCS, Monte Carlo simulation; RCP 8.5, Representative Concentration Pathway 8.5; SLR, Sea-level rise; SWAN+ADCIRC, Simulating WAves Nearshore and ADVanced CIRCulation; U.S., United States; USEIA, U.S. Energy Information Administration; α, Ratio of an AST repair cost to its replacement cost; β, Clean-up cost rate; γ, Civil fine per unit volume; ρL, Internal liquid specific gravity; φ, Friction coefficient at AST base; B, Internal liquid height; CAST, AST replacement cost; CClean−up, Total clean-up cost at a refinery; CR, Repair cost of an AST; CRepair, Total repair cost of ASTs at a refinery; D, AST diameter; E[X], Expected value of X; f, Probability density function; H, AST height; Hw, Wave height; IDP, Inundation depth at process-units; IRF, Facility inundation ratio; IRP, Process-unit inundation ratio; L1, Land value loss; L2, Process-unit damage loss; L3, Spill clean-up and AST repair cost; L4, Productivity loss; L5, Civil fine; LHSC, The HSC aggregated loss; LP, Production loss; LS, Sale loss; LT, Total refinery loss; N, Number of ASTs at a refinery; , Production price; , Retail price; , Wholesale price; PtS, Sale profit; R1, Land value loss ratio; R2, Refinery damage parameter; S, Surge height; Sd, Design stress value of the steel shell of ASTs; SV, Spill volume for an AST; SVT, Total spill volume at a refinery; T, Downtime; T1, Downtime due to facility inundation; T2, Downtime due to process-unit inundation; T3, Downtime due to petrochemical spill; Tw, Wave period; U, Current velocity; unif, Uniform distribution; Vf, Hurricane forward speed; VLand, Property-appraised value of land; VRef, Refinery value; VolP, Production volume; VolS, Sale volume; W, Wind speed.
References
A Barrel Full (2019). US Oil Refineries. Available online at: http://abarrelfull.wikidot.com/us-refineries (accessed November 21 2019).
Adams, C., Witt, E. C., Wang, J., Shaver, D. K., Summers, D., Filali-Meknassi, Y., et al. (2007). Chemical quality of depositional sediments and associated soils in New Orleans and the Louisiana peninsula following Hurricane Katrina. Environ. Sci. Technol. 41, 3437–3443. doi: 10.1021/es0620991
Anarde, K. A., Kameshwar, S., Irza, J. N., Nittrouer, J. A., Lorenzo-Trueba, J., Padgett, J. E., et al. (2018). Impacts of hurricane storm surge on infrastructure vulnerability for an evolving coastal landscape. Nat. Hazards Rev. 19:04017020. doi: 10.1061/(ASCE)NH.1527-6996.0000265
Bass, B., Torres, J. M., Irza, J. N., Proft, J., Sebastian, A., Dawson, C., et al. (2018). Surge dynamics across a complex bay coastline, Galveston Bay, TX. Coastal Eng. 138, 165–183. doi: 10.1016/j.coastaleng.2018.04.019
Bernier, C., Elliott, J. R., Padgett, J. E., Kellerman, F., and Bedient, P. B. (2017). Evolution of social vulnerability and risks of chemical spills during storm surge along the Houston Ship Channel. Nat. Hazards Rev. 18:04017013. doi: 10.1061/(ASCE)NH.1527-6996.0000252
Bernier, C., Kameshwar, S., Elliott, J. R., Padgett, J. E., and Bedient, P. B. (2018). Mitigation strategies to protect petrochemical infrastructure and nearby communities during storm surge. Nat. Hazards Rev. 19:04018019. doi: 10.1061/(ASCE)NH.1527-6996.0000309
Bernier, C., and Padgett, J. E. (2019). Fragility and risk assessment of aboveground storage tanks subjected to concurrent surge, wave, and wind loads. Reliab. Eng. Syst. Safety 191:106571. doi: 10.1016/j.ress.2019.106571
Burleson, D. W. (2015). Modeling the Vulnerability of a Highly Industrialized Estuary to Storm Surge With a Coupled ADCIRC, SWAN, and EFDC System. Houston, TX: University of Houston.
Cauffman, S. A., Phan, L. T., Sadek, F., Fritz, W. P., Duthinh, D., and Rossiter, W. J. Jr. (2006). Performance of Physical Structures in Hurricane Katrina and Hurricane Rita: A Reconnaissance Report (NIST TN 1476). Gaithersburg, MD: National Institute of Standards and Technology. doi: 10.6028/NIST.TN.1476
Center for Chemical Process Safety (CCPS) (1995). Guidelines on Technical Planning for On-Site Emergencies.
Chan, K. T. (2019). Are global tropical cyclones moving slower in a warming climate? Environ. Res. Lett. 14:104015. doi: 10.1088/1748-9326/ab4031
Chow, E., and Elkind, J. (2005). Hurricane Katrina and US energy security. Survival 47, 145–160. doi: 10.1080/00396330500433449
Cruz, A. M., and Krausmann, E. (2013). Vulnerability of the oil and gas sector to climate change and extreme weather events. Clim. Change 121, 41–53. doi: 10.1007/s10584-013-0891-4
Deka, A., Hamta, N., Esmaeilian, B., and Behdad, S. (2016). Predictive modeling techniques to forecast energy demand in the United States: a focus on economic and demographic factors. J. Energy Res. Technol. 138:022001. doi: 10.1115/1.4031632
Dietrich, J., Zijlema, M., Westerink, J., Holthuijsen, L., Dawson, C., Luettich, R. Jr., et al. (2011). Modeling hurricane waves and storm surge using integrally-coupled, scalable computations. Coast. Eng. 58, 45–65. doi: 10.1016/j.coastaleng.2010.08.001
Dietrich, J. C., Tanaka, S., Westerink, J. J., Dawson, C. N., Luettich, R., Zijlema, M., et al. (2012). Performance of the unstructured-mesh, SWAN+ ADCIRC model in computing hurricane waves and surge. J. Sci. Comput. 52, 468–497. doi: 10.1007/s10915-011-9555-6
Dismukes, D. E. (2011). OCS-Related Infrastructure Fact Book. Volume I: Post-Hurricane Impact Assessment. New Orleans, LA: U.S. Dept. of the Interior, Bureau of Ocean Energy Management, Gulf of Mexico OCS Region.
Done, J., Bruyère, C., and Holland, G. (2015). “Future changes in gulf of mexico hurricane impacts,” in Offshore Technology Conference (Houston, TX).
Emanuel, K. (2017). Assessing the present and future probability of Hurricane Harvey's rainfall. Proc. Natl. Acad. Sci. 2017:16222. doi: 10.1073/pnas.1716222114
Federal Emergency Management Agency (FEMA) Mitigation Division (2018). Multi-Hazard Loss Estimation Methodology Flood Model - Technical Manual. (Washington, DC).
FM Global (2004). Creating a Flood Emergency Response Plan. Available online at: https://www.fmglobal.com/~/media/Files/FMGlobal/Nat%20Haz%20Toolkit/P0589.pdf (accessed March 25 2020).
Francis, R., and Bekera, B. (2014). A metric and frameworks for resilience analysis of engineered and infrastructure systems. Reliab. Eng. Syst. Safety 121, 90–103. doi: 10.1016/j.ress.2013.07.004
Frazier, T. G., Wood, N., Yarnal, B., and Bauer, D. H. (2010). Influence of potential sea level rise on societal vulnerability to hurricane storm-surge hazards, Sarasota County, Florida. Appl. Geogr. 30, 490–505. doi: 10.1016/j.apgeog.2010.05.005
Godoy, L. A. (2007). Performance of storage tanks in oil facilities damaged by Hurricanes Katrina and Rita. J. Perform. Constructed Facil. 21, 441–449. doi: 10.1061/(ASCE)0887-3828(2007)21:6(441)
Gutmann, E. D., Rasmussen, R. M., Liu, C., Ikeda, K., Bruyere, C. L., Done, J. M., et al. (2018). Changes in hurricanes from a 13-yr convection-permitting pseudo–global warming simulation. J. Clim. 31, 3643–3657. doi: 10.1175/JCLI-D-17-0391.1
Hall, T. M., and Kossin, J. P. (2019). Hurricane stalling along the North American coast and implications for rainfall. npj Clim. Atmospheric Sci. 2, 1–9. doi: 10.1038/s41612-019-0074-8
Harris County Appraisal District (2019). Real Property Account Information. Available online at: http://hcad.org/ (accessed November 21, 2019).
Harris County Appraisal District (HCAD) (2019). HCAD Public Data. Available online at: https://pdata.hcad.org/GIS/ (accessed December 16 2019).
Hassanzadeh, P., Lee, C. Y., Nabizadeh, E., Camargo, S. J., Ma, D., and Yeung, L. Y. (2020). Effects of climate change on the movement of future landfalling Texas tropical cyclones. Nat. Commun. doi: 10.1038/s41467-020-17130-7
Hoffman, P., Bryan, W., and Lippert, A. (2009). Comparing the Impacts of the 2005 and 2008 Hurricanes on US Energy Infrastructure. Washington, DC: U.S. Department of Energy.
Hope, M. E., Westerink, J. J., Kennedy, A. B., Kerr, P., Dietrich, J. C., Dawson, C., et al. (2013). Hindcast and validation of Hurricane Ike (2008) waves, forerunner, and storm surge. Journal of Geophys. Res. 118, 4424–4460. doi: 10.1002/jgrc.20314
Horowitz, J., and Disis, J. (2017). Nation's largest oil refinery forced to shut down as Harvey floods Port Arthur. Available online at: https://money.cnn.com/2017/08/30/news/harvey-motiva-oil-refinery-shutdown/index.html (accessed November 21 2019).
Houston-Galveston Area Council (H-GAC) (2018). Aerial and LiDAR Imagery. Available online at: http://www.h-gac.com/imagery/ (Accessed December 16 2019).
Hyder, M. (2008). Oil Spill Intelligence Report, Assessment of Hurricane Ike Damage Continues. Aspen Publishers.
Irish, J. L., Resio, D. T., and Ratcliff, J. J. (2008). The influence of storm size on hurricane surge. J. Phys. Oceanogr. 38, 2003–2013. doi: 10.1175/2008JPO3727.1
Kameshwar, S., and Padgett, J. E. (2018a). Fragility and resilience indicators for portfolio of oil storage tanks subjected to hurricanes. J. Infrastruct. Syst. 24:04018003. doi: 10.1061/(ASCE)IS.1943-555X.0000418
Kameshwar, S., and Padgett, J. E. (2018b). Storm surge fragility assessment of above ground storage tanks. Struct. Safety 70, 48–58. doi: 10.1016/j.strusafe.2017.10.002
Kim, M., Miller-Hooks, E., and Nair, R. (2011). A geographic information system-based real-time decision support framework for routing vehicles carrying hazardous materials. J. Intell. Transp. Syst. 15, 28–41. doi: 10.1080/15472450.2011.544584
Kingston, P. F. (2002). Long-term environmental impact of oil spills. Spill Sci. Technol. Bull. 7, 53–61. doi: 10.1016/S1353-2561(02)00051-8
Kopp, R. E., Horton, R. M., Little, C. M., Mitrovica, J. X., Oppenheimer, M., Rasmussen, D., et al. (2014). Probabilistic 21st and 22nd century sea-level projections at a global network of tide-gauge sites. Earth Fut. 2, 383–406. doi: 10.1002/2014EF000239
Kossin, J. P. (2018). A global slowdown of tropical-cyclone translation speed. Nature 558:104. doi: 10.1038/s41586-018-0158-3
Lanzante, J. R. (2019). Uncertainties in tropical-cyclone translation speed. Nature 570, E6–E15. doi: 10.1038/s41586-019-1223-2
Lewis, M. S. (2009). Temporary wholesale gasoline price spikes have long-lasting retail effects: The aftermath of Hurricane Rita. J. Law Econ. 52, 581–605. doi: 10.1086/592056
Liu, Y., and Irish, J. L. (2019). Characterization and prediction of tropical cyclone forerunner surge. Coast. Eng. 147, 34–42. doi: 10.1016/j.coastaleng.2019.01.005
Luettich, R. A., and Westerink, J. J. (2004). Formulation and Numerical Implementation of the 2D/3D ADCIRC Finite Element Model Version 44. XX. Web Publication.
Marsooli, R., Lin, N., Emanuel, K., and Feng, K. (2019). Climate change exacerbates hurricane flood hazards along US Atlantic and Gulf Coasts in spatially varying patterns. Nat. Commun. 10, 1–9. doi: 10.1038/s41467-019-11755-z
Michigan Department of Treasury (2003). Assessor's manual volume II - State of Michigan. (Lansing, MI).
Moon, I.-J., Kim, S.-H., and Chan, J. C. (2019). Climate change and tropical cyclone trend. Nature 570, E3–E5. doi: 10.1038/s41586-019-1222-3
Mudd, L., Wang, Y., Letchford, C., and Rosowsky, D. (2014a). Assessing climate change impact on the US East Coast hurricane hazard: temperature, frequency, and track. Nat. Hazards Rev. 15:04014001. doi: 10.1061/(ASCE)NH.1527-6996.0000128
Mudd, L., Wang, Y., Letchford, C., and Rosowsky, D. (2014b). Hurricane wind hazard assessment for a rapidly warming climate scenario. J. Wind Eng. Indust. Aerodyn. 133, 242–249. doi: 10.1016/j.jweia.2014.07.005
National Hurricane Center Central Pacific Hurricane Center (2020). Tropical Cyclone Climatology. Available online at: https://www.nhc.noaa.gov/climo/ (accessed March 01 2020).
Palinkas, L. A., Downs, M. A., Petterson, J. S., and Russell, J. (1993). Social, cultural, and psychological impacts of the “Exxon Valdez” oil spill. Hum. Organ. 1–13. doi: 10.17730/humo.52.1.162688w475154m34
Patricola, C. M., and Wehner, M. F. (2018). Anthropogenic influences on major tropical cyclone events. Nature 563, 339–346. doi: 10.1038/s41586-018-0673-2
Pine, J. C. (2006). Hurricane Katrina and oil spills: Impact on coastal and ocean environments. Oceanography 19, 37–39. doi: 10.5670/oceanog.2006.61
Port of Houston Authority (2019). The Economic Impact of the Houston Ship Channel. Available online at: https://porthouston.com/about-us/economic-impact/ (accessed September 22 2019).
Powell, M. D., Houston, S. H., Amat, L. R., and Morisseau-Leroy, N. (1998). The HRD real-time hurricane wind analysis system. J. Wind Eng. Indust. Aerodyn. 77, 53–64. doi: 10.1016/S0167-6105(98)00131-7
Qi, H., and Altinakar, M. S. (2011). A GIS-based decision support system for integrated flood management under uncertainty with two dimensional numerical simulations. Environ. Modell. Software 26, 817–821. doi: 10.1016/j.envsoft.2010.11.006
Rego, J. L., and Li, C. (2009). On the importance of the forward speed of hurricanes in storm surge forecasting: a numerical study. Geophys. Res. Lett 36:7. doi: 10.1029/2008GL036953
Rosowsky, D. V., Mudd, L., and Letchford, C. (2016). “Assessing climate change impact on the joint wind-rain hurricane hazard for the northeastern US coastline,” in Risk Analysis of Natural Hazards, eds P. Gardoni, C. Murphy, and A. Rowell (Springer), 113–134. Available online at: https://link.springer.com/chapter/10.1007/978-3-319-22126-7_8
Sebastian, A., Proft, J., Dietrich, J. C., Du, W., Bedient, P. B., and Dawson, C. N. (2014). Characterizing hurricane storm surge behavior in Galveston Bay using the SWAN+ ADCIRC model. Coast. Eng. 88, 171–181. doi: 10.1016/j.coastaleng.2014.03.002
Sengul, H., Santella, N., Steinberg, L. J., and Cruz, A. M. (2012). Analysis of hazardous material releases due to natural hazards in the United States. Disasters 36, 723–743. doi: 10.1111/j.1467-7717.2012.01272.x
Ting, M., Kossin, J. P., Camargo, S. J., and Li, C. (2019). Past and future hurricane intensity change along the US east coast. Sci. Rep. 9, 1–8. doi: 10.1038/s41598-019-44252-w
U.S. Chemical Safety Hazard Investigation Board (2018). Arkema Inc. Chemical Plant Fire. Available online at: https://www.csb.gov/arkema-inc-chemical-plant-fire-/ (accessed March 25 2020).
U.S. Coast Guard (USCG) (2006). Report to Congress: Oil Spill Liability Trust Fund Hurricane Impact. (Washington, DC).
U.S. Energy Information Administration (2019a). Gasoline and Diesel Fuel Update. Available online at: https://www.eia.gov/petroleum/gasdiesel/ (accessed December 2 2019).
U.S. Energy Information Administration (2019b). Gulf of Mexico Fact Sheet. Available online at: https://www.eia.gov/special/gulf_of_mexico/ (accessed January 9 2019).
U.S. Energy Information Administration (2019c). Oil: Crude and Petroleum Products Explained. Available online at: https://www.eia.gov/energyexplained/oil-and-petroleum-products/refining-crude-oil.php (accessed December 2 2019).
U.S. Energy Information Administration (2019d). Petroleum and Other Liquids. Available online at: https://www.eia.gov/petroleum/data.php (accessed December 2 2019).
Verter, V., and Kara, B. Y. (2001). A GIS-based framework for hazardous materials transport risk assessment. Risk Analysis 21, 1109–1120. doi: 10.1111/0272-4332.216179
Wu, S.-Y., Yarnal, B., and Fisher, A. (2002). Vulnerability of coastal communities to sea-level rise: a case study of Cape May County, New Jersey, USA. Climate Res. 22, 255–270. doi: 10.3354/cr022255
Yamaguchi, M., Chan, J. C., Moon, I.-J., Yoshida, K., and Mizuta, R. (2020). Global warming changes tropical cyclone translation speed. Nat. Commun. 11, 1–7. doi: 10.1038/s41467-019-13902-y
Zhang, G., Murakami, H., Knutson, T. R., Mizuta, R., and Yoshida, K. (2020). Tropical cyclone motion in a changing climate. Sci. Adv. 6:eaaz7610. doi: 10.1126/sciadv.aaz7610
Keywords: petroleum infrastructure, risk assessment framework, storm surge, changing climate, monetary loss, houston ship channel, aboveground storage tank (AST), refinery
Citation: Ebad Sichani M, Anarde KA, Capshaw KM, Padgett JE, Meidl RA, Hassanzadeh P, Loch-Temzelides TP and Bedient PB (2020) Hurricane Risk Assessment of Petroleum Infrastructure in a Changing Climate. Front. Built Environ. 6:104. doi: 10.3389/fbuil.2020.00104
Received: 31 March 2020; Accepted: 04 June 2020;
Published: 16 July 2020.
Edited by:
Ning Lin, Princeton University, United StatesReviewed by:
Amal Elawady, Florida International University, United StatesYou Dong, Hong Kong Polytechnic University, Hong Kong
Copyright © 2020 Ebad Sichani, Anarde, Capshaw, Padgett, Meidl, Hassanzadeh, Loch-Temzelides and Bedient. This is an open-access article distributed under the terms of the Creative Commons Attribution License (CC BY). The use, distribution or reproduction in other forums is permitted, provided the original author(s) and the copyright owner(s) are credited and that the original publication in this journal is cited, in accordance with accepted academic practice. No use, distribution or reproduction is permitted which does not comply with these terms.
*Correspondence: Jamie E. Padgett, amFtaWUucGFkZ2V0dEByaWNlLmVkdQ==