 Nikolaos Makrakis
 Prodromos N. Psarropoulos
 Dionysios Chatzidakis
 Yiannis Tsompanakis
- 1School of Rural and Surveying Engineering, National Technical University of Athens, Athens, Greece
- 2School of Environmental Engineering, Technical University of Crete, Chania, Greece
Offshore lifelines, such as gas pipelines and cables, consist large-scale and very important engineering projects, while their safe operation is undoubtedly a challenging task. Offshore lifelines usually cross submarine areas facing various offshore geohazards, which are very often related (directly or indirectly) with local seismicity. Therefore, in order to avoid severe damages with devastating consequences, it is of paramount importance to optimize their design, taking realistically into account all earthquake-related geohazards and their detrimental effects on the examined lifeline. Since the avoidance of all geohazardous areas is not always feasible, the route optimization of a lifeline at an early stage of the design phase is very crucial for its safety and serviceability. The current study presents a new smart decision-support tool that aims to facilitate route optimization of offshore lifelines through: (a) the qualitative and quantitative assessment of the major earthquake-related geohazards along a possible lifeline routing, (b) the quantitative assessment of their potential impact on the lifeline, and (c) the selection of the optimum lifeline route. The proposed decision-support tool can be very useful for the efficient design of an offshore lifeline, provided that adequate and reliable input data are available. Its efficiency is illustrated with two characteristic case studies in the Mediterranean Sea.
Introduction
During the last decades, many offshore lifelines have been constructed worldwide, and many more will be developed in the near future. Offshore lifelines, such as high-pressure gas pipelines and cables for electrical or telecommunication purposes, are usually major and expensive engineering projects. The ever-increasing demand for immediate availability and reliability of such networks, which supply energy or digital data, coupled with improved environmental standards, make their cost-effective design an issue of paramount importance, with specific requirements related to safety and techno-economical aspects. An optimal lifeline route selection can be extremely beneficial as it minimizes, not only the cost of construction and maintenance of a pipeline or a cable, but its failure probability as well. Critical factors affecting route selection of an offshore lifeline are topographical and geological characteristics, environmental and political restrictions as well as geohazards, such as active seismic faults and landslides.
Geographic Information System (GIS) is an effective, fast and continuously improving tool for route selection compared to empirical methods (Balogun et al., 2013). The majority of the reported studies on the application of GIS for optimal route selection are limited to onshore oil, gas or water pipelines (Feldman et al., 1995; Çevik and Topal, 2003; Moghaddam and Delavar, 2007; Yildirim and Yomralioglu, 2011; Schwarz et al., 2015). King et al. (2011) examined the offshore pipeline corridor to avoid ice gouges in the Arctic, while Haneberg et al. (2013) investigated the case of pipeline routing for past and future submarine landslides in Australia. Devine and Haneberg (2016) proposed optimization methods for offshore Arctic pipeline routing using GIS, while Devine et al. (2016) implemented the methodology for offshore pipeline routing proposed by ABS guidelines (American Bureau of Shipping, 2016). The case of offshore oil pipeline routing in Malaysia accounting of environmental, engineering and financial criteria has been examined by Balogun et al. (2015, 2017). Other studies focused on routing of onshore high or medium voltage electrical cables against landslides, road or river crossing and other environmental or topographical aspects (Monteiro et al., 2005; Bagli et al., 2011; Uddin et al., 2017). Moreover, GIS can be combined with multi-criteria decision making (MCDM) methods for greater accuracy and mainly to enable comparison of alternative routes (Balogun et al., 2015; Yildirim et al., 2017).
Submarine geohazards are the geological, hydrogeological and hydraulic conditions or processes that can lead to sudden or slow progressive deformations of the seabed. Offshore lifelines cross extensive submarine areas under highly adverse and uncertain conditions. Operating in such environment increases their vulnerability to geohazards, such as tectonic and non-tectonic faulting, slope failures, strong ground shaking, soil liquefaction, salt diapirs, mud volcanoes, shallow gas, gas hydrates, scour by currents and tsunamis (Randolph and Gourvenec, 2017). It is evident that in some cases a potential damage and especially a failure of an offshore lifeline, apart from the direct problems regarding its operation, may cause devastating environmental consequences.
The response assessment of a lifeline subjected to a geohazard consists a soil-structure interaction problem. Analytical, semi-analytical as well as numerical methods can be utilized for this purpose. Pipeline distress due to a submarine landslide has been investigated in several studies utilizing analytical and numerical models (Chatzidakis et al., 2019). Other studies investigated pipelines subjected to kinematic distress due to seismic fault rupture by developing analytical approaches (Sarvanis and Karamanos, 2017). Regarding the numerical investigation of pipeline distress due to seismic fault rupture, there are two approaches that can be adopted. In the first methodology, the pipeline and the surrounding soil are simulated in a coupled model, usually using 3D solid and shell elements (Vazouras et al., 2015; Zhang et al., 2016; Halabian and Hokmabadi, 2018). In the second approach the pipeline and the surrounding soil are decoupled and the Permanent Ground Displacements (PGDs) are imposed on the pipeline via non-linear springs (Joshi et al., 2011; Trimintziou et al., 2015; Uckan et al., 2015; Melissianos and Gantes, 2017). Regarding the other geohazards, several studies investigated the dynamic pipeline response due to strong ground motion on the seabed (Kaynia et al., 2014), while others studied the response due to waves or currents (Zhou et al., 2014).
During the route optimization process, it is evident that crossing through some specific areas is not permitted. These can be military areas, wrecks or protected areas, archeological sites, etc. In parallel, the presence of a severe geohazard that can impose excessive PGDs on the lifeline will probably lead to the avoidance of this problematic area. Moreover, in a deep-water environment any repair/intervention action is very difficult and therefore damages should be avoided. In the case of earthquake-related geohazards, which have a certain probability of occurrence during the lifetime of the project, the following categorization of the examined areas can be considered:
(a) Potentially problematic areas, where there is a possibility of PGDs to take place during, or just after, an earthquake.
(b) Problematic areas, where significant PGDs are expected during an earthquake, but the consequent lifeline distress is below the allowable limits.
(c) Critical areas, where the expected PGDs during an earthquake can cause excessive lifeline distress, above the allowable limits, leading thus to damages or even failure.
Based on the earlier discussion, the current study presents the development and the application of a new GIS-based smart tool that has recently been developed to support decision-making regarding route optimization of offshore lifelines through: (a) the qualitative and quantitative assessment of the major earthquake-related geohazards along a possible lifeline routing, (b) the quantitative assessment of their potential impact on the lifeline, and (c) the selection of the optimum lifeline route. This smart decision-support tool has been implemented in a GIS environment, utilizing advanced numerical simulations. The efficiency of the tool is verified by its application in two case studies in the Mediterranean Sea, where analysis and handling of the available spatial data directly or indirectly related to existing geographical information (bathymetric, geological, geophysical, geotechnical and seismological data, etc.) were performed. This process enables the identification and subsequent avoidance of critical areas, thereby leading to optimal techno-economic and environmental decision-making of such large-scale energy projects.
Optimum Design Against Earthquake-Related Geohazards
The structural risk of any structure, including lifelines, is a function of the anticipated hazard and the corresponding structural vulnerability. The sketch in Figure 1A depicts the main earthquake-related geohazards of a lifeline crossing an extensive area, having both onshore and offshore parts. In general, geohazards due to earthquakes can be categorized as dynamic, i.e., the strong ground motion due to the seismic waves and local site conditions, and quasi-static, such as active seismic fault rupture at the surface of the ground or the seabed, soil liquefaction phenomena and earthquake-triggered slope instabilities. Moreover, it has to be emphasized that these phenomena are often interrelated, especially in the sea.
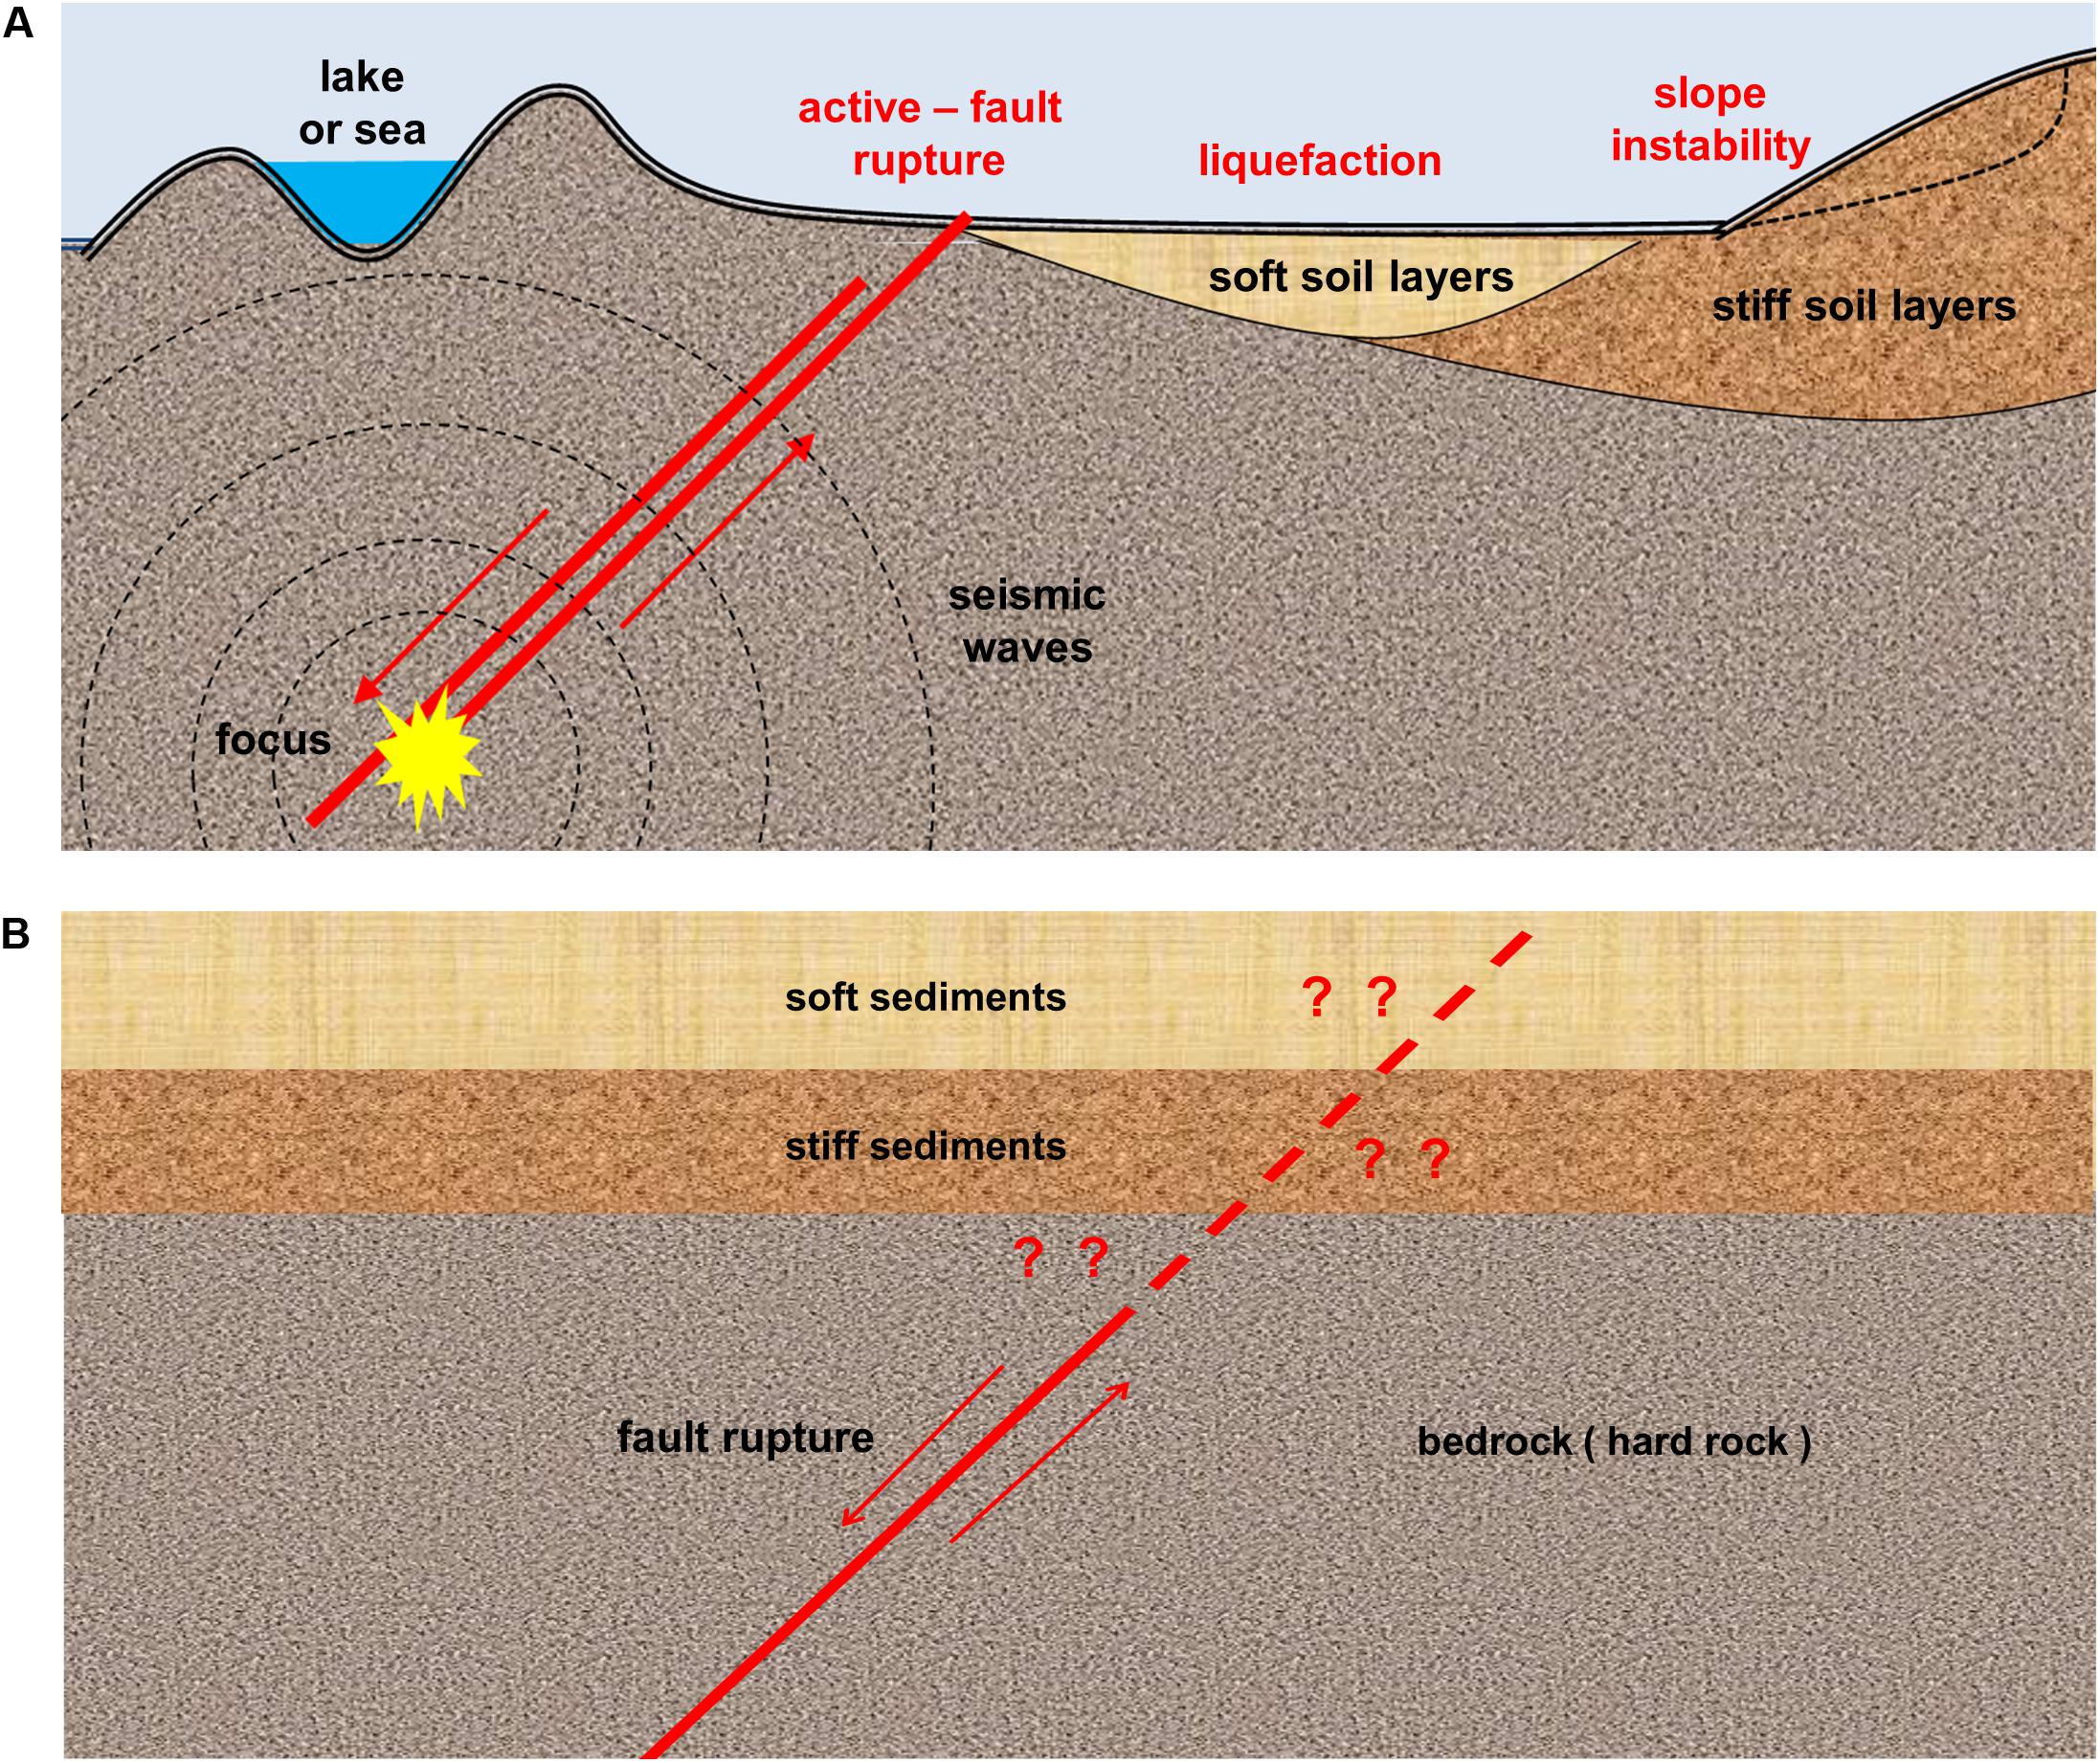
Figure 1. (A) Earthquake related geohazards, and (B) rupture propagation through sediments at a covered fault.
Local site conditions consist a critical factor which can be favorable or unfavorable for the pipeline distress. In some cases, the existence of soil layers or soft sediments may increase the geohazard at the surface of the ground or the seabed. This is the case of soil amplification or topographic amplification of the seismic motion. On the other hand, there are some other cases where the existence of soil layers or soft sediments may be beneficial and may decrease the geohazard at the surface. This is the case of seismic fault rupture propagation through thick layers of soft soils or seabed sediments.
As illustrated in Figure 1B, seismic faults can be separated into two categories: outcropped faults and covered (or blind) faults. It is obvious that, when a lifeline crosses an active seismic fault -either onshore or offshore-, the rupture of an outcropped fault will impose a direct threat on the lifeline, while in the case of soft sediments covering a blind fault may lead to a smoother pattern of PGDs at the surface of the seabed. This beneficial impact of the soft sediments to the PGDs at the surface has been demonstrated in various studies (Anastasopoulos et al., 2008; Bransby et al., 2008) and it is highlighted that this fact may be very crucial for the design. Furthermore, it is important to know the geometrical and mechanical properties of the sediments and the fault type, while it is also necessary to estimate the process of the induced offset at the bedrock. Subsequently, the assessed PGDs can be imposed on the lifeline as a quasi-static load and the lifeline distress can be calculated (Joshi et al., 2011; Trimintziou et al., 2015; Uckan et al., 2015; Melissianos and Gantes, 2017).
Generally, lifeline routing through geohazardous areas is a techno-economical procedure with the following options (Psarropoulos et al., 2013): (a) complete avoidance of the problematic area by lifeline rerouting, (b) crossing through the problematic area after applying various mitigation or isolation measures aiming to minimize the PGDs or the lifeline distress to acceptable levels, and (c) crossing through the problematic area without applying mitigation measures. The first option is unfavorable in many cases due to various technical, financial or environmental issues, such as excessive increase in lifeline length and/or cost. The second option is the most conservative and the most expensive. Several mitigation techniques can be utilized on onshore lifelines. However, in offshore conditions -especially in deep waters- most of these measures are inapplicable. For instance, burying of the lifeline, ground remediation, or the use of mitigation measures (such as expanded polystyrene or geotextiles) cannot be implemented in deep water submarine lifelines. Therefore, in many cases, the third option may be the most cost-effective. This option demands realistic consideration of the local site conditions, along with the structural capability of the examined lifeline to withstand the expected PGDs.
Development of the Smart Decision-Support Tool
In order to optimize offshore lifeline routings in a (semi-) automatic way, a smart decision-support tool has been gradually developed by the authors, utilizing the GIS computing environment of ArcGIS software (ESRI, 2013). The GIS environment facilitates the superposition of various thematic layers/maps and the least cost path analysis (LCPA), which allows the user to find the “cheapest” path from one point to another over a cost or friction surface (Douglas, 1994). The optimization of the lifeline routing is performed through a MCDA, taking into account the offshore geohazards among other parameters. In the initial version of the smart tool the aim was to combine the GIS software with the qualitative assessment of various geohazards along a specific route. Therefore, an effort was made to identify the “problematic” areas under static conditions and the “potentially problematic” areas under seismic conditions (Çevik and Topal, 2003; Yildirim and Yomralioglu, 2011; Haneberg et al., 2013; Psarropoulos et al., 2016). The basic design criteria were set as follows: (a) lifeline length minimization, (b) limited crossing of forbidden areas (e.g., military areas, wrecks or protected areas), and (c) avoidance of the problematic and/or the potentially problematic areas, or at least minimization of lifeline length in those areas. It is worth noting that each criterion can be weighted according to the user’s preferences and requirements.
The optimization problem is not formulated in a standard mathematical form (with design variables, objective function, constraints), but in a more “abstract” form, where the objective is to minimize the route (i.e., the length), thus, the cost of the examined offshore lifeline taking into account one or more criteria that are related to the examined geohazards. The standard MCDA that is provided in ArcGIS for GIS-based spatial analysis has been used. This methodology is based on LCPA and is often used when the aim is to optimize the route of any type of lifelines or networks.
Regarding the implementation in the ArcGIS: the two main types of GIS spatial data are vectors and rasters. The three basic vector types are points, lines and polygons (areas). Raster data consist of a matrix of cells (or pixels) organized into rows and columns (or a grid) where each cell contains a value representing a specific information. A raster is useful for representing data that change continuously across a landscape (surface). Rasters can be digital aerial photographs, imagery from satellites, digital pictures, or even scanned maps. Moreover, raster data can also be produced within ArcGIS, i.e., a raster cost surface. In the examined cases, the data related with the geohazards (i.e., soil liquefaction and slope instability zones as well as seismic faults in Eastern Mediterranean Sea), are converted into rasters to be used in LCPA. More specifically, LCPA is applied through a spatial analysis function in ArcGIS, aiming to generate the least cost path among two points. Therefore, it is crucial to clearly define the origin and the destination points of the lifeline. Subsequently, in order to achieve the least cost path, a few tools of the spatial analysis toolbox need to be used.
In summary, to optimize the design of an offshore lifeline, the proposed decision-support tool uses three main modules: (i) the weighted overlay, (ii) the cost distance, and (iii) the cost path (ESRI, 2013). A brief description of these modules is given in the sequence.
1. The weighted overlay tool is applied to solve multi-criteria problems within ArcGIS environment. More analytically, a criterion raster layer is inserted in this tool into a common preference scale, e.g., from 1 to 9, where 9 is the most favorable. When many criteria are used, their raster layers are inserted into the weighted overlay tool, the user can assign different weights to the criteria according to their importance, provided that their sum is 100.
2. The cost distance function uses the starting point (origin) and the accumulated cost surface In this manner, an output raster is produced, where each cell of the raster is assigned a value that is the least accumulative cost for traveling from each cell back to the origin, i.e., the lower the value, the lower the cost.
3. The cost path tool defines the route between origin and destination points taking into account the cost distance. This path is one cell wide and is guaranteed to be the cheapest route with respect to the cost units defined by the original cost raster, which is initially entered into the weighted-distance tool.
After various improvements and modifications, the decision-support tool -at its current version- has the capability to perform a quantitative assessment of various offshore geohazards along a specific route in order to estimate the PGDs via geotechnical-type simulations. After the aforementioned assessment of the earthquake-related geohazards at the potentially problematic areas, the tool can assess -in a quantitative way- the structural distress of the lifeline in terms of strains. This final assessment actually permits the distinction between the problematic areas that can be crossed with adequate safety, and the critical areas that must be avoided. After the completion of these two quantitative assessments, the tool can continue to the optimization phase of the lifeline routing. For this reason, the smart tool combines the GIS environment with the commercial finite-element software ABAQUS (Simulia, 2014), which is capable of performing realistic simulations of geotechnical problems and soil-structure interaction (SSI) analyses as well.
Geotechnical simulations and analyses are performed in the identified problematic (and possibly critical) areas along the lifeline route, usually in terms of PGDs. They can be executed in two (or even three) dimensions depending on the available geodata, which are firstly incorporated into the GIS platform. The geodata include all information regarding bathymetric, geological, geotechnical, geophysical, seismotectonic and seismological conditions. In this manner, major earthquake-related geohazards can be quantified, such as the slope instability of the seabed or the rupture of an active seismic fault up to the surface of the seabed. Figure 2A represents the slope instability (in terms of PGDs) that has been simulated with ABAQUS (Simulia, 2014).
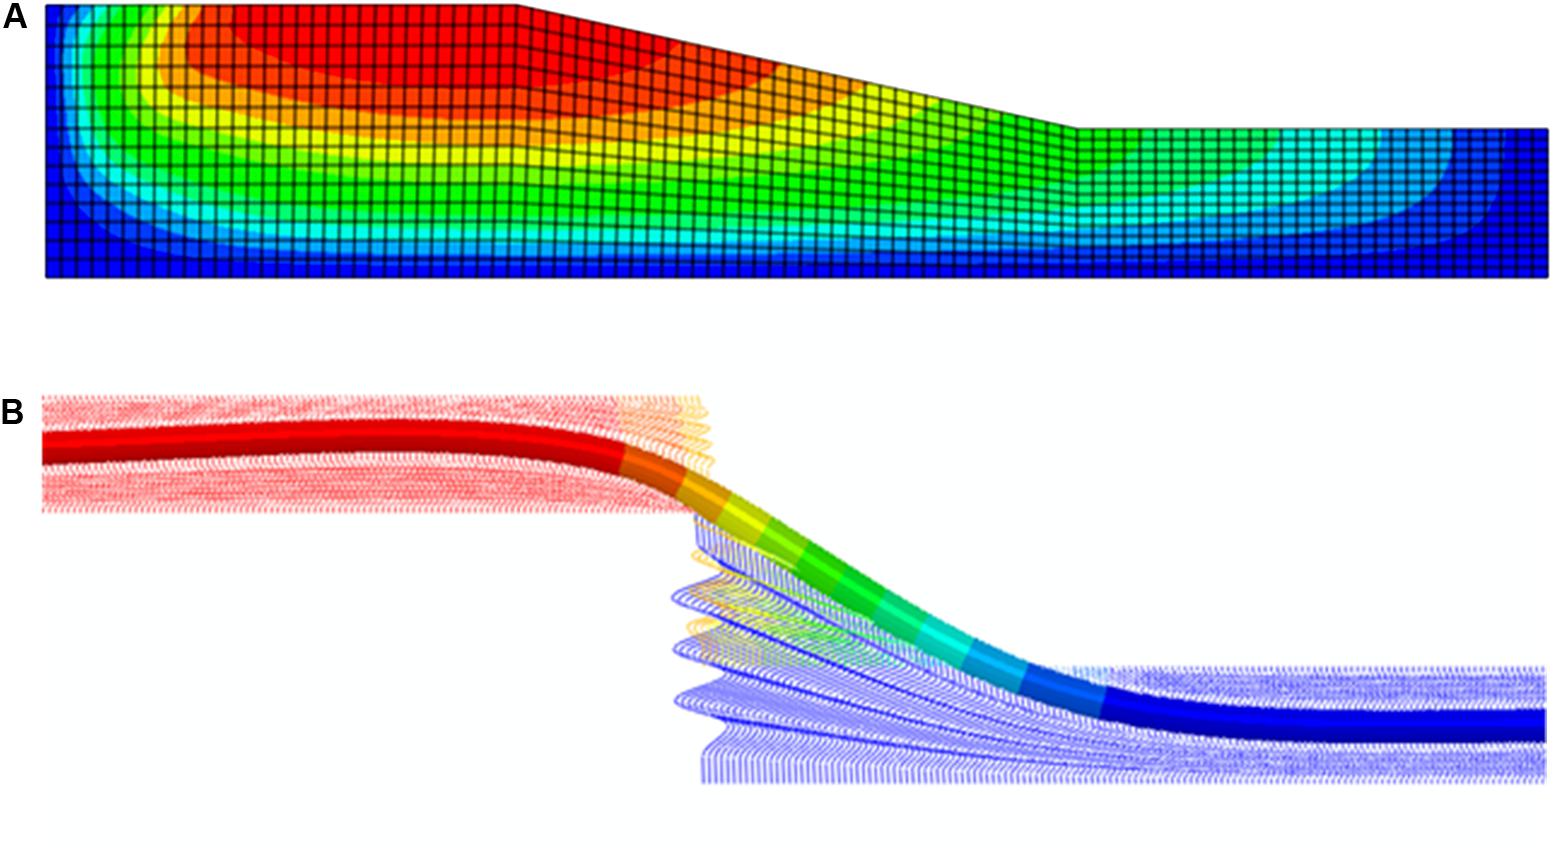
Figure 2. Simulation of: (A) slope instability, and (B) pipeline distress using a finite-element software.
SSI analyses are performed to evaluate the distress of the examined lifeline (in terms of stresses and strains) when the lifeline is subjected to the aforementioned PGDs. Subsequently, the numerical results of the SSI analyses, together with the allowable strain limits, are taken into account by the smart tool in order to avoid the critical areas and to derive the optimum routing. Figure 2B illustrates the distress (i.e., strains) of a pipeline crossing an active seismic fault.
The flowchart shown in Figure 3 presents the main steps of the proposed tool. Firstly, all input geodata are inserted in the GIS environment. The next step is to perform the finite-element simulations and analyses for the quantitative geohazard assessment. Subsequently, SSI analyses are performed, in order to assess the distress of the lifeline and to compare it with the allowable levels defined by the standards/norms (e.g., American Lifelines Alliance, 2001; European Commitee for Standardization, 2006; Det Norske Veritas, 2012). These two intermediate phases require the main manual interventions by the user during the whole process. Finally, after taking into account the results of the previous steps, the route optimization of the lifeline can be achieved within the GIS environment using least cost path analysis.
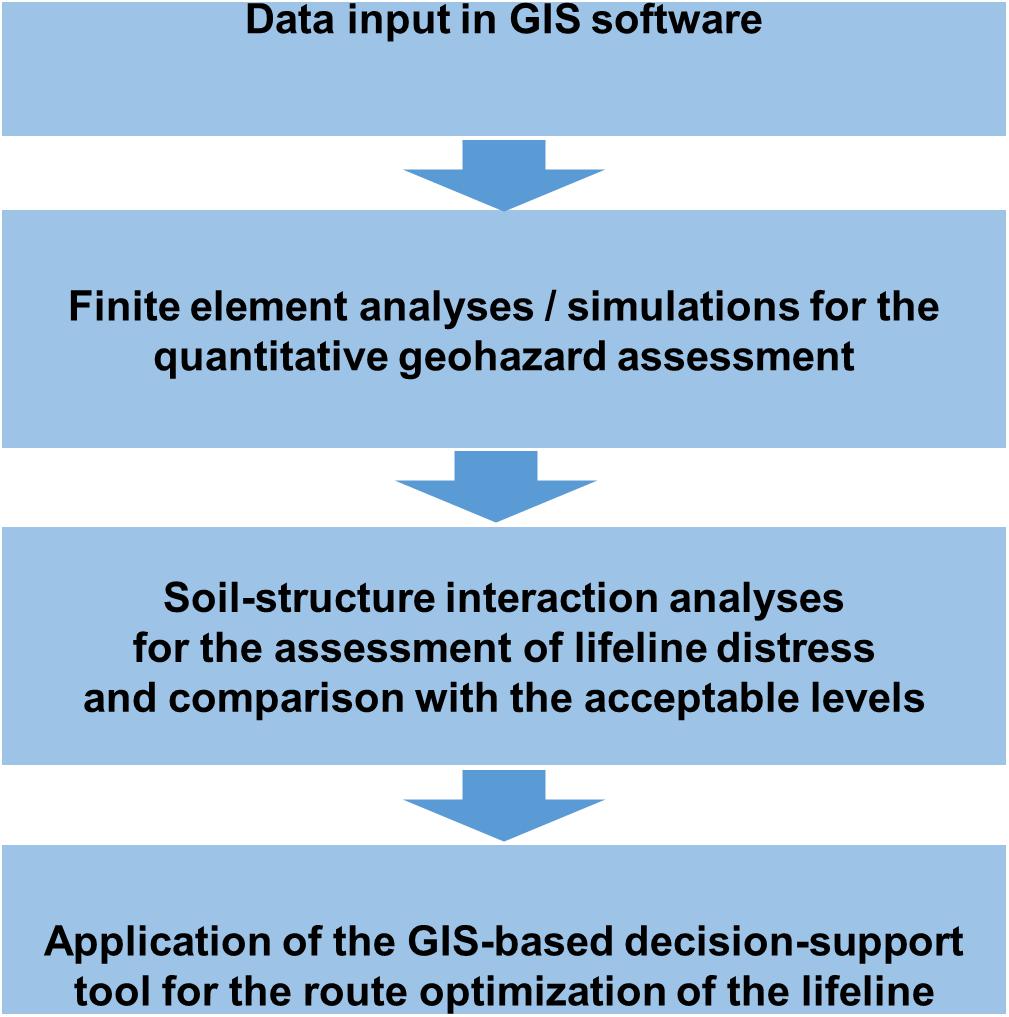
Figure 3. Flowchart of the main steps of the developed smart decision-support tool.
Case Studies
The smart decision-support tool has been applied in two characteristic case studies, based on real engineering projects. In the first case study, the optimal routing of an offshore cable connecting Greece and Italy is examined against the geohazards of slope instability and soil liquefaction. In the second case study, the optimal routing of an offshore gas pipeline between Cyprus and Crete is examined against seismic fault rupture geohazard. Note that in both case studies the origin and the destination points of the examined routes are very close to the actual locations of the real designs. However, the routes that resulted from the application of the smart tool do not coincide with those obtained from the engineering design process.
A significant difference among the two applications is that in the first case study the initial version of the decision-support tool has been applied, in which the main aim was to integrate into the GIS software the qualitative assessment of various geohazards (i.e., slope instability and soil liquefaction) along a specific route within the examined region. In the second case study the upgraded version of the tool has been applied, which is also capable of performing a quantitative assessment of the examined geohazard (i.e., kinematic distress due to seismic faults via geotechnical-type simulations).
Another major difference between the two case studies is related to the additional design criteria, apart from the length minimization of the proposed route. More specifically, in the first case study the basic criterion is the avoidance of the problematic or potentially problematic areas related to two geohazards: slope instability and soil liquefaction. On the other hand, in the second case study the geohazard-related design criterion is the avoidance or crossing (under certain conditions) of major seismic faults in the examined region.
Undoubtedly, there are various uncertainties that have to be considered when designing offshore lifelines utilizing a GIS-based approach. The main data related to the geomorphology, topography, sediments properties, of the seabed for wider regions are limited. Usually, such data are derived from digitized geological maps and geophysical surveys of the sea bottom and they are inserted -as much accurately as possible -into the GIS environment as polygons, lines or points entities. On the other hand, various epistemic and aleatory uncertainties exist regarding the qualitative and quantitative assessment of earthquake-related geohazards. For example, seismic faults are indicated as linear entities into the GIS, thus, they have specific dimensions. However, it is very difficult to map accurately a fault at high depths: the exact dimensions, boundaries, slip potential, path propagation, secondary faults, etc.
Offshore Cable in Adriatic Sea
The first case study is an offshore cable for the electrical interconnection between Greece and Italy shown in Figure 4A, which was constructed approximately 20 years ago. Figure 4B depicts the origin and the destination points of the cable at Thesprotia, Greece and at Otranto, Italy, respectively. Note that in this case study the route optimization was based only on the qualitative assessment of earthquake-related offshore geohazards and corresponds to the initial version of the computational tool.
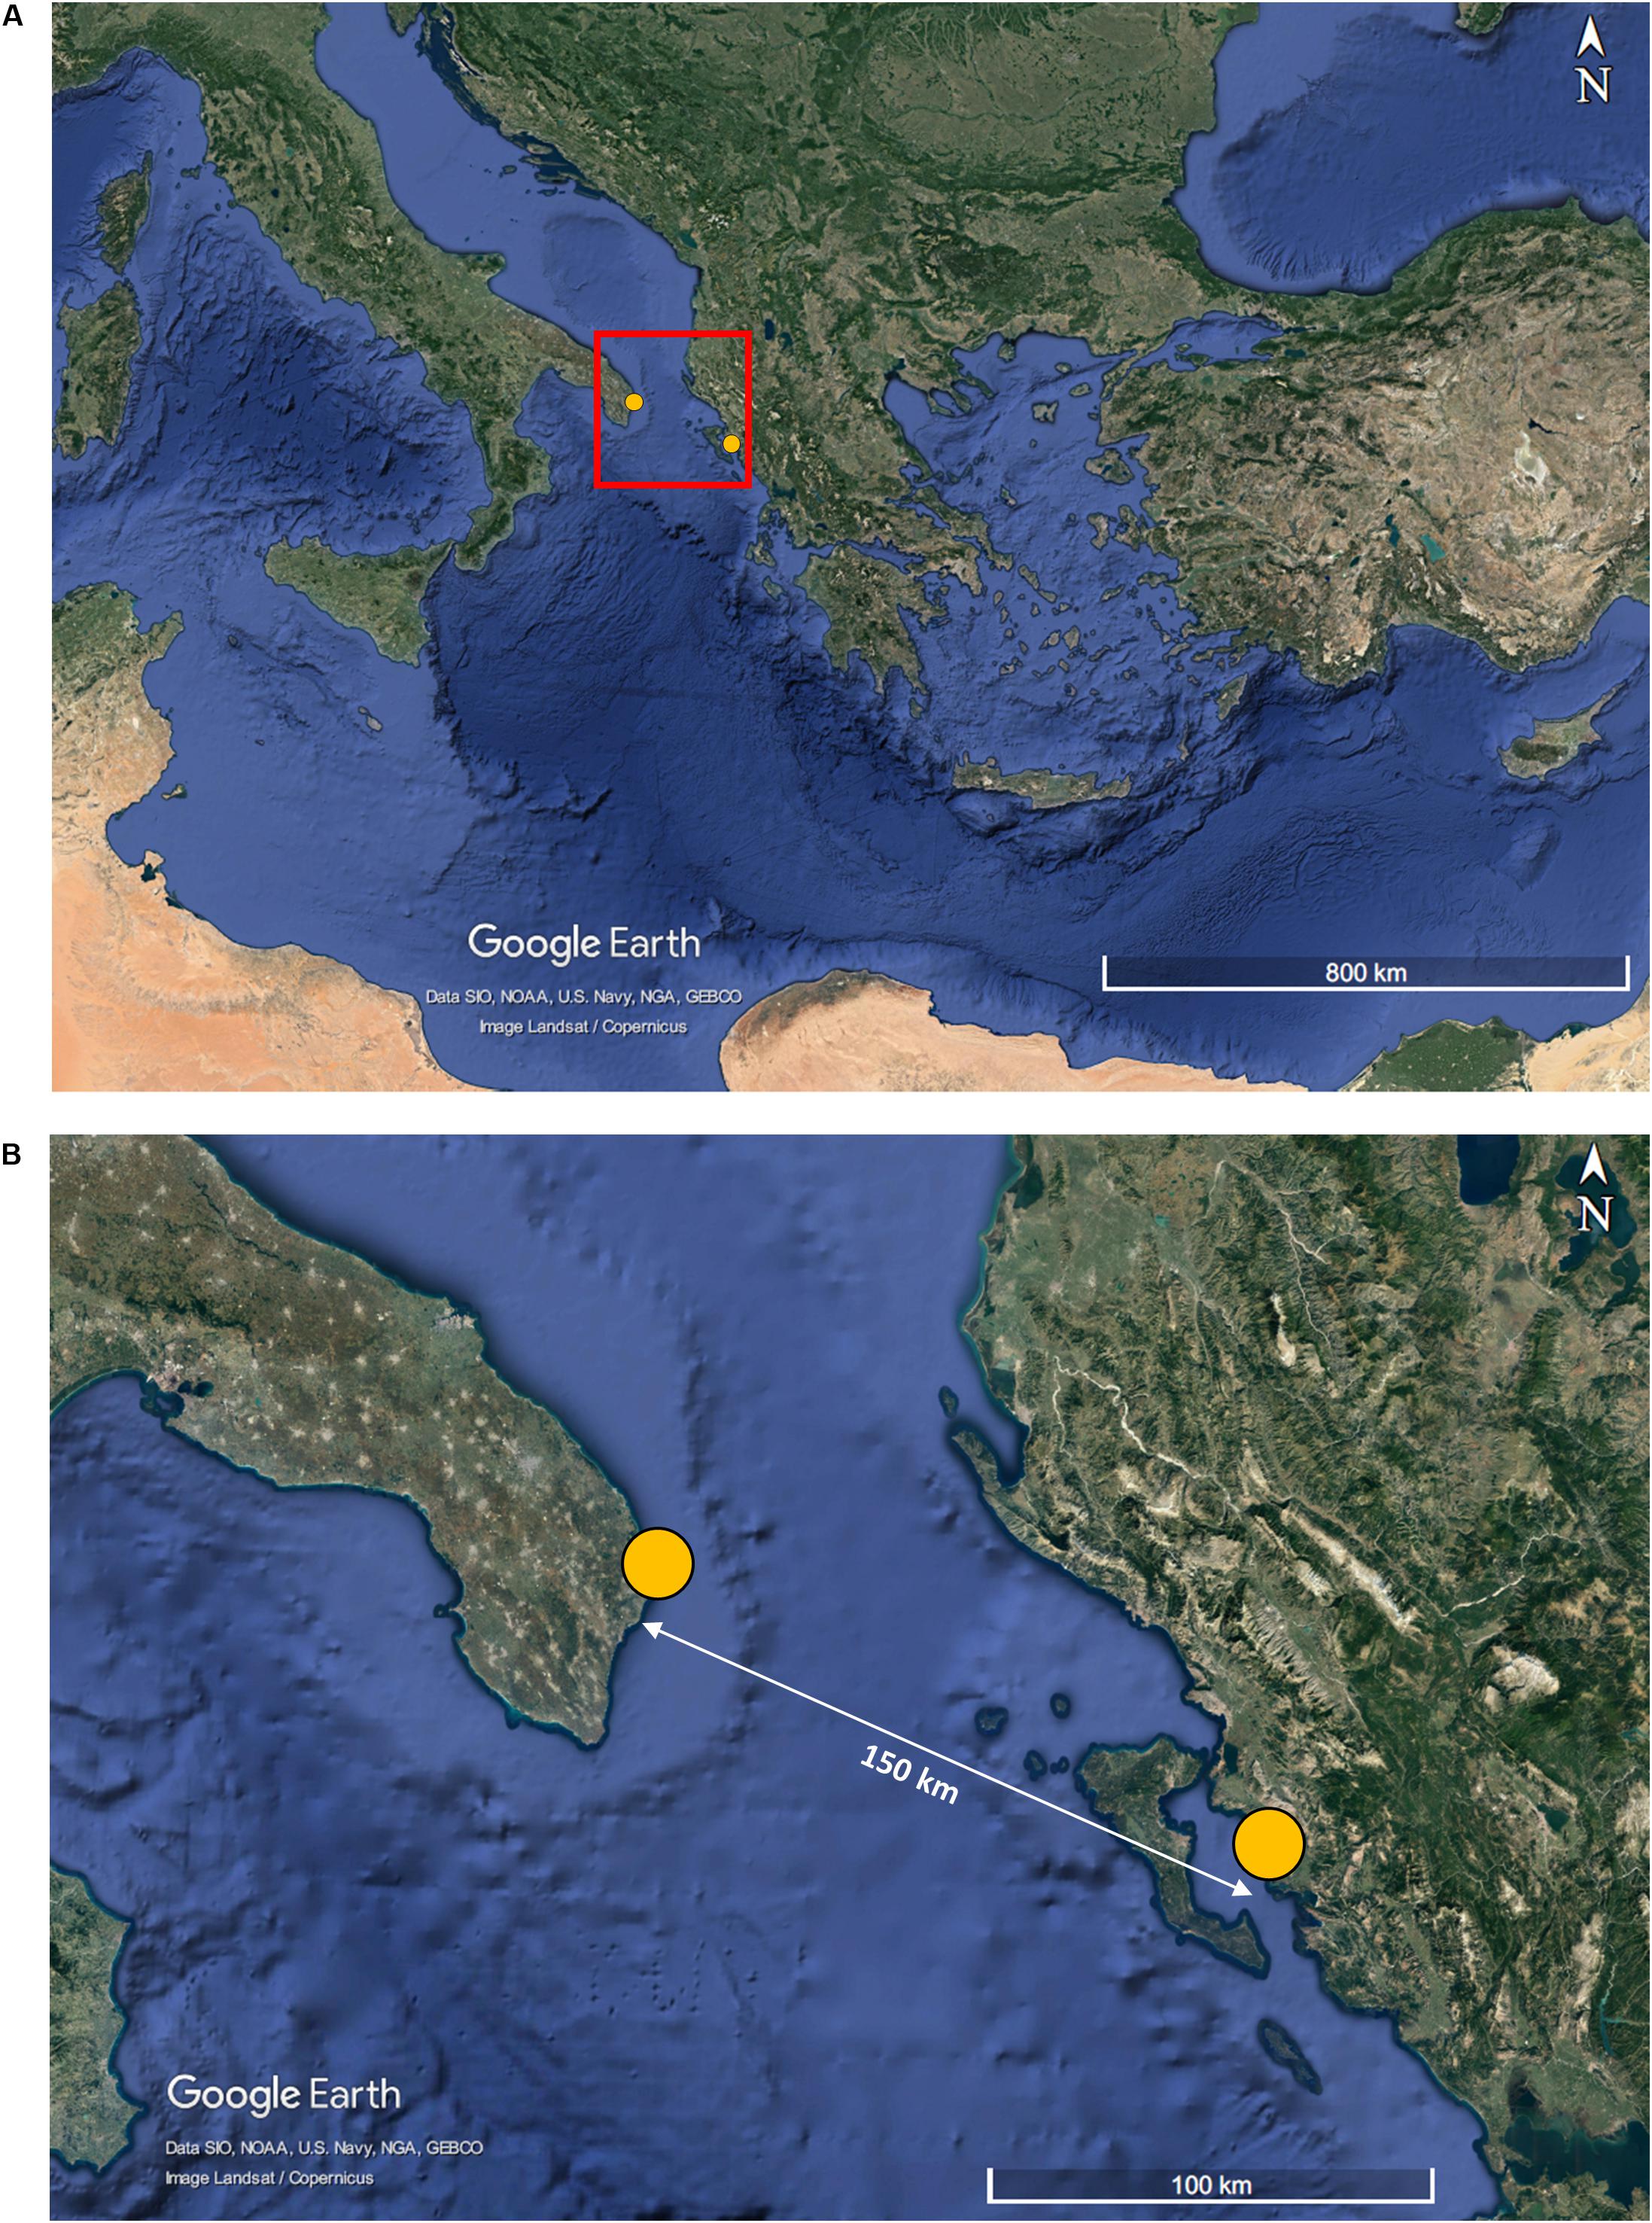
Figure 4. (A) The area of interest in Adriatic Sea, and (B) the origin and the destination points of the cable at Greece and Italy (yellow points).
After defining the study area, the collection and processing of all necessary geodata were performed. The required geodata were inserted in the GIS environment using a digital elevation model (DEM) of the seabed in geotiff format file (shown in Figure 5) and the seismic hazard map illustrated in Figure 6 (Slejko et al., 1999), aiming to collect all information related to the average values of seismic accelerations at the seabed. Finally, the required data were determined via a map representing the concentration of sediments on the seabed according to the ADRICOSM GROUP (2005) project (Figure 7) and a map showing the slope inclinations at the seabed in the examined area, as displayed in Figure 8. It should be noted that the illustrated onshore areas of Figure 8 in Greece (e.g., the island of Corfu), Albania and Italy are depicted in green color, which is also used to define flat seabed regions.
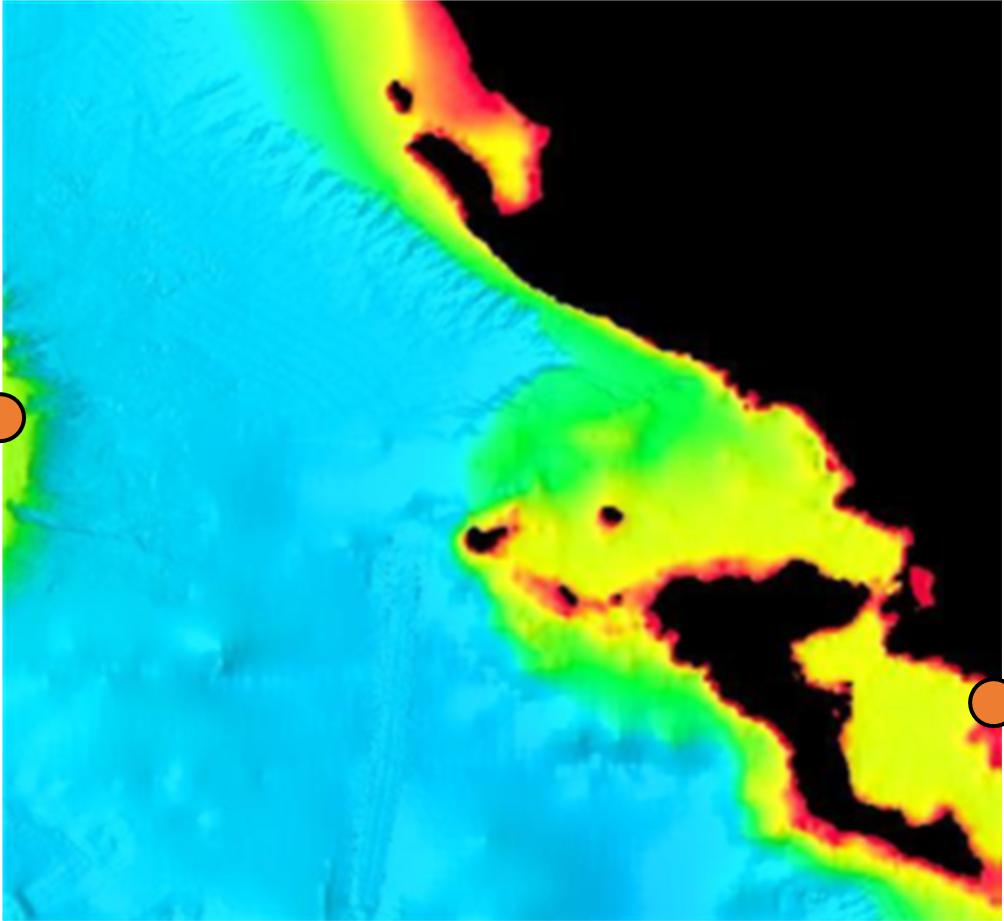
Figure 5. Digital Elevation Model (DEM) of the seabed in geotiff format file.
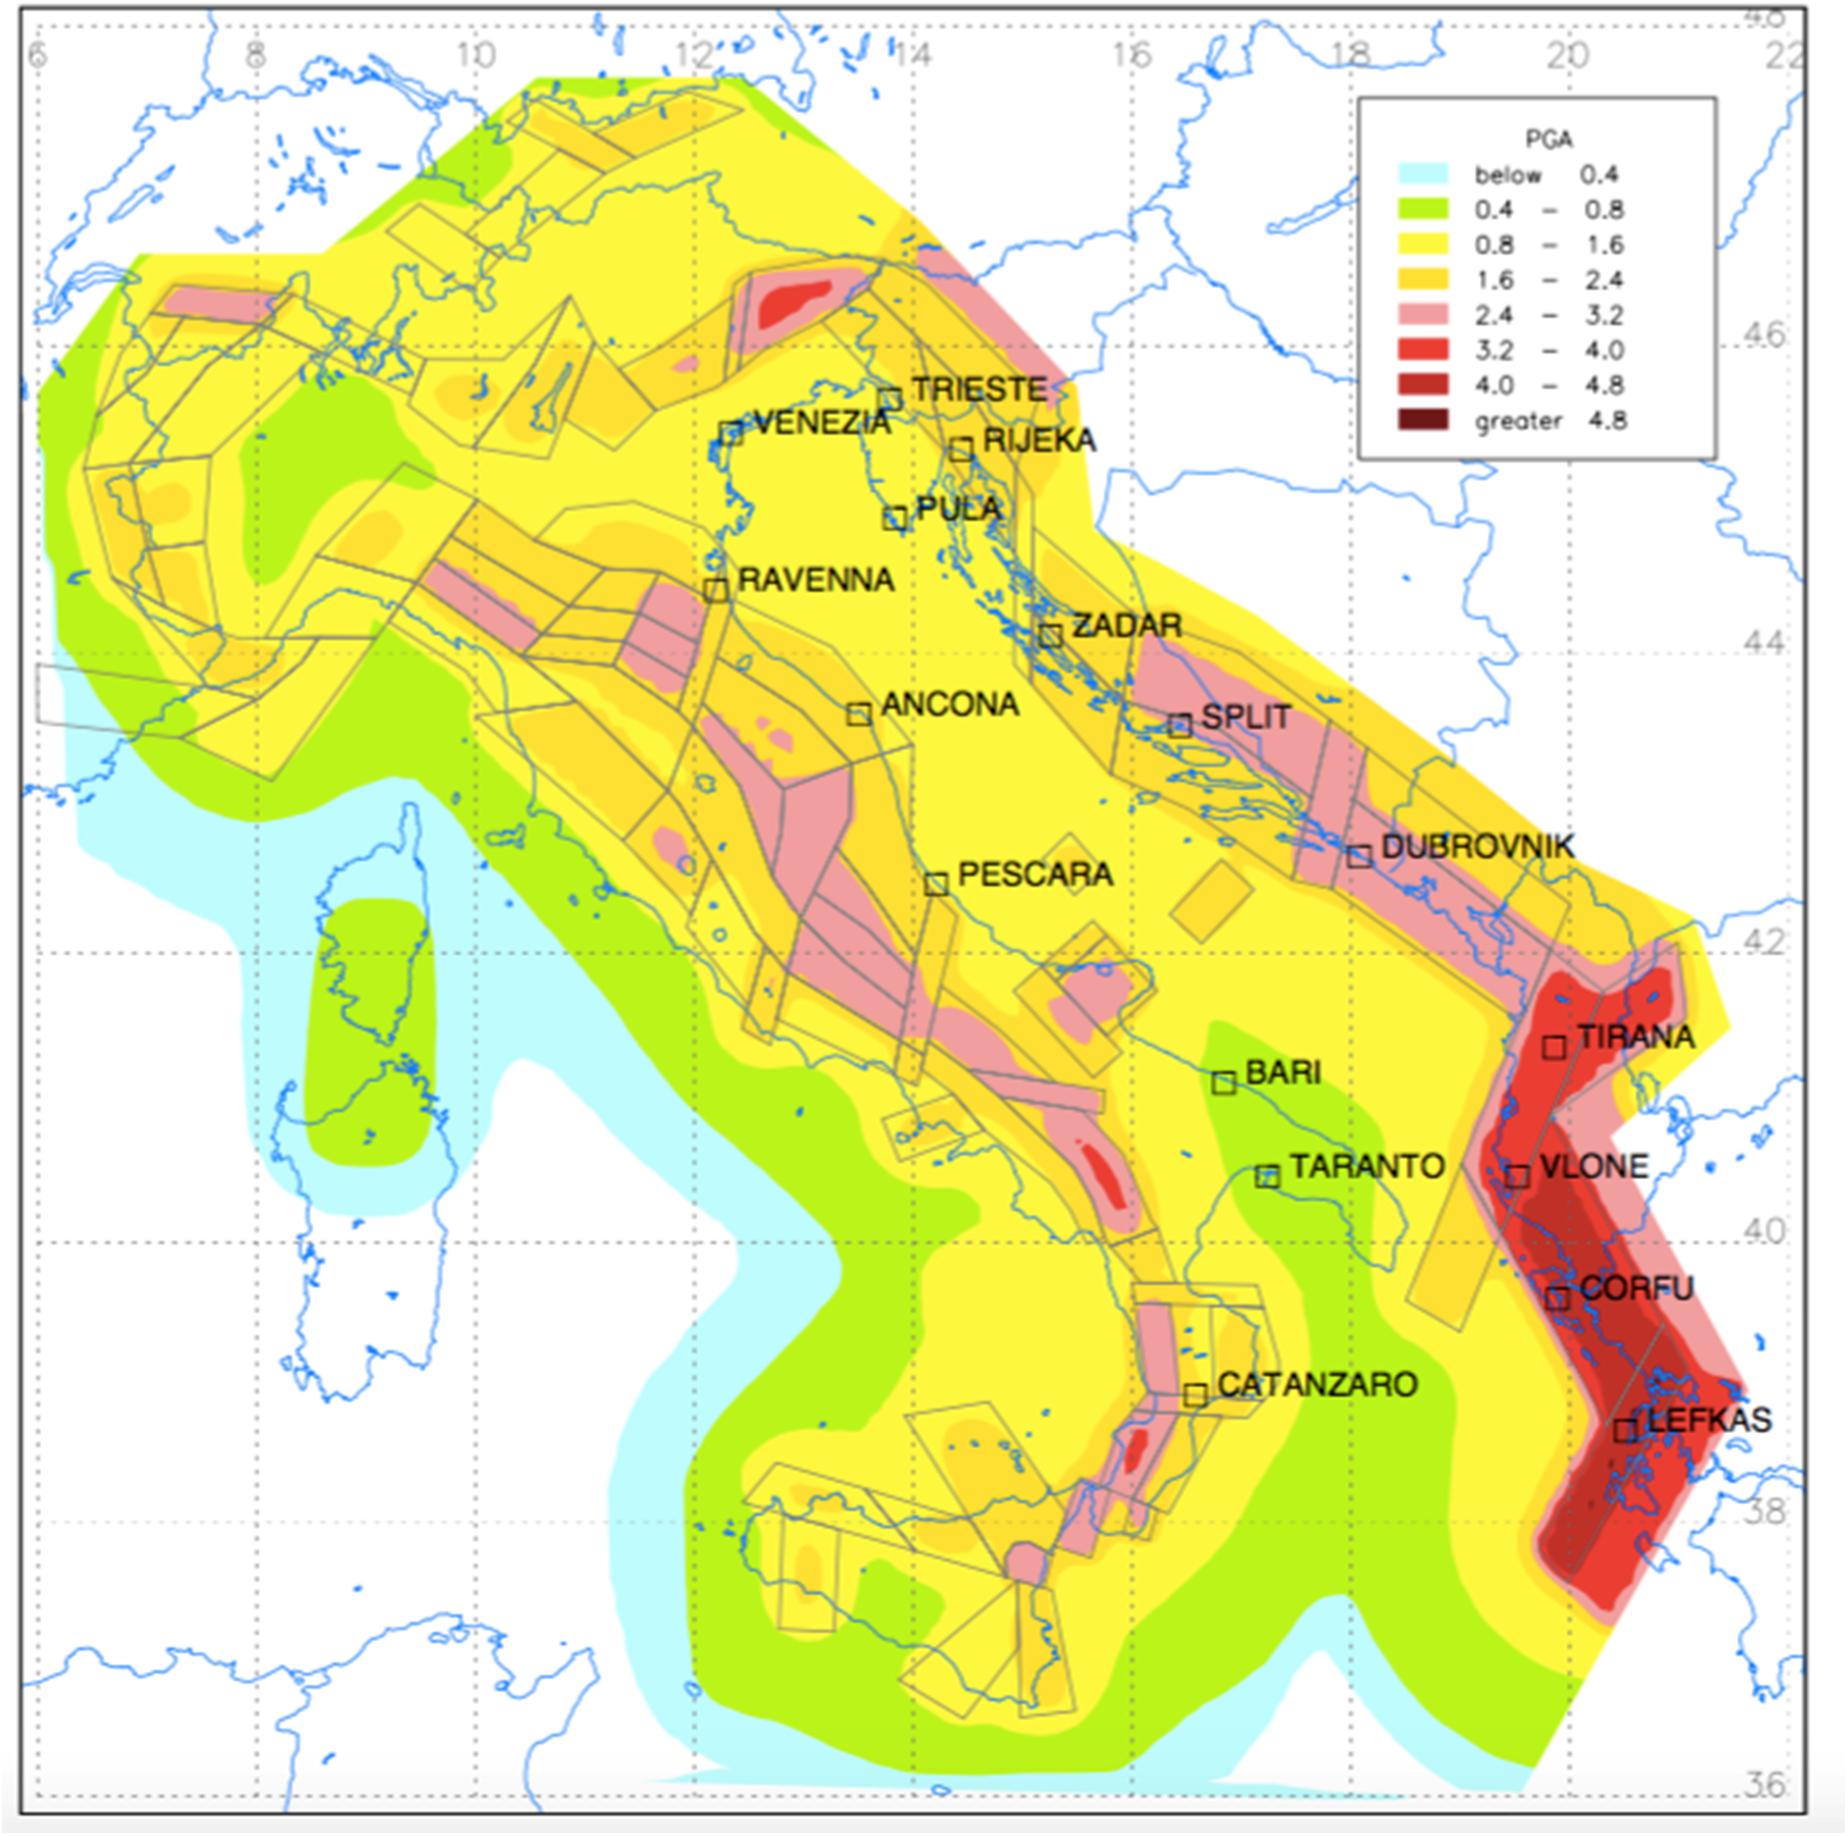
Figure 6. Peak ground acceleration (in m/s2) at bedrock in Adriatic Sea for a 475-year return period (adopted from Slejko et al., 1999).
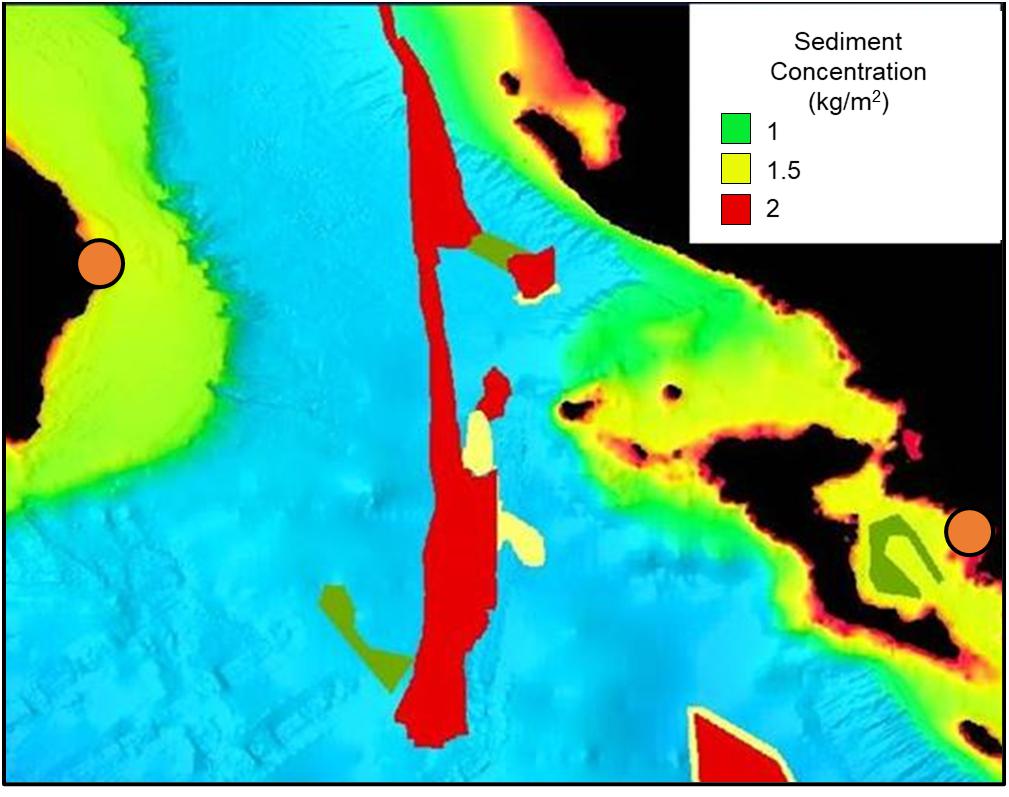
Figure 7. Map of the sediments concentration at the seabed (ADRICOSM GROUP, 2005).
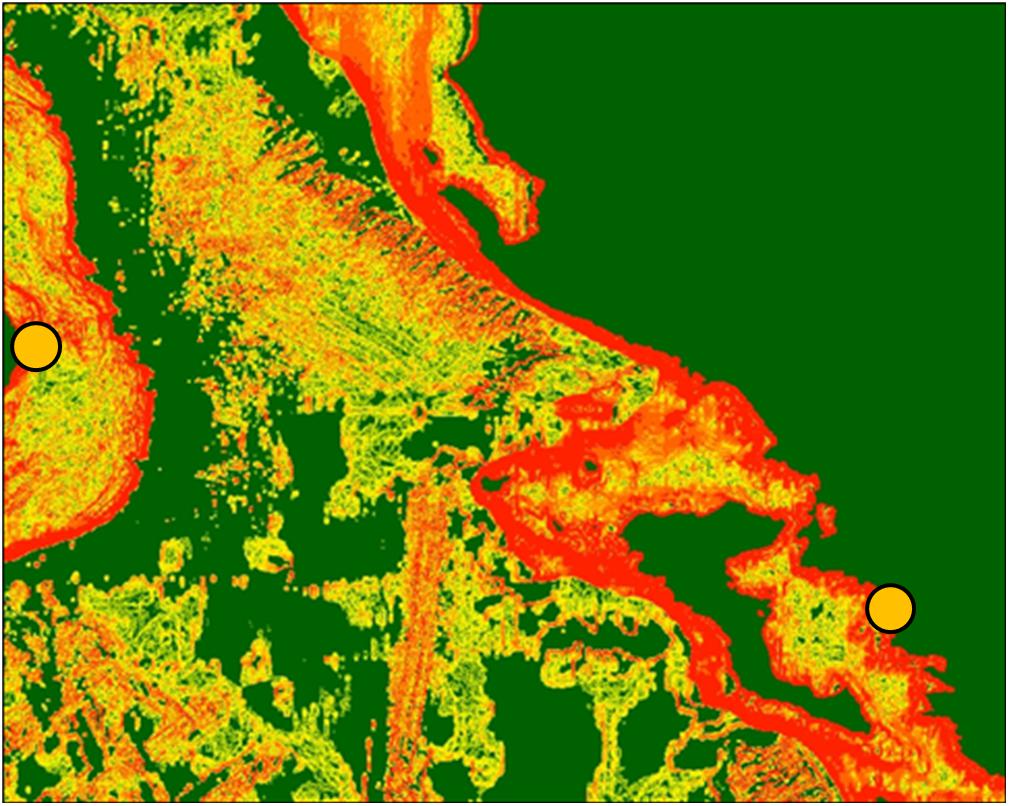
Figure 8. Map of the slope inclinations at the seabed of the examined area.
In addition, after collecting and processing all the appropriate geodata, the main criteria for the route optimization were set in the GIS environment. The most important criterion is to achieve length minimization of the examined cable. Moreover, as the initial version of the tool was applied, the route was designed to totally avoid the potentially problematic areas in terms of geohazards. More specifically, the geohazards that have been considered in this application are the potentially liquefiable areas at the seabed of the Adriatic Sea, while an additional design goal was to avoid areas of the seabed characterized by relatively high inclination that are susceptible to slope instabilities. It is noted that the map of the potentially problematic areas of soil liquefaction is a combination of individual data, and more specifically, the liquefiable areas are an overlay of: (a) the average sediments concentration, (b) the seismic acceleration zones, and (c) gentle slopes of the seabed at the site of interest.
In summary, only a qualitative geohazard assessment was performed in this case study and the tool was capable to minimize the length of the lifeline crossing within the potentially problematic areas or to completely avoid them without examining their criticality (i.e., the impact of potential PGDs to the lifeline). Figure 9 illustrates some indicative results of this successful application of the decision-support tool, which were derived from the superposition of different thematic layers in the GIS environment. These layers were created and designed in order to transfer all related geodata from the maps into the GIS. More specifically, this plot presents three alternative routes of the submarine cable taking into account, apart from the length minimization, the weighted criteria related to the geohazards of soil liquefaction and/or slope instability.
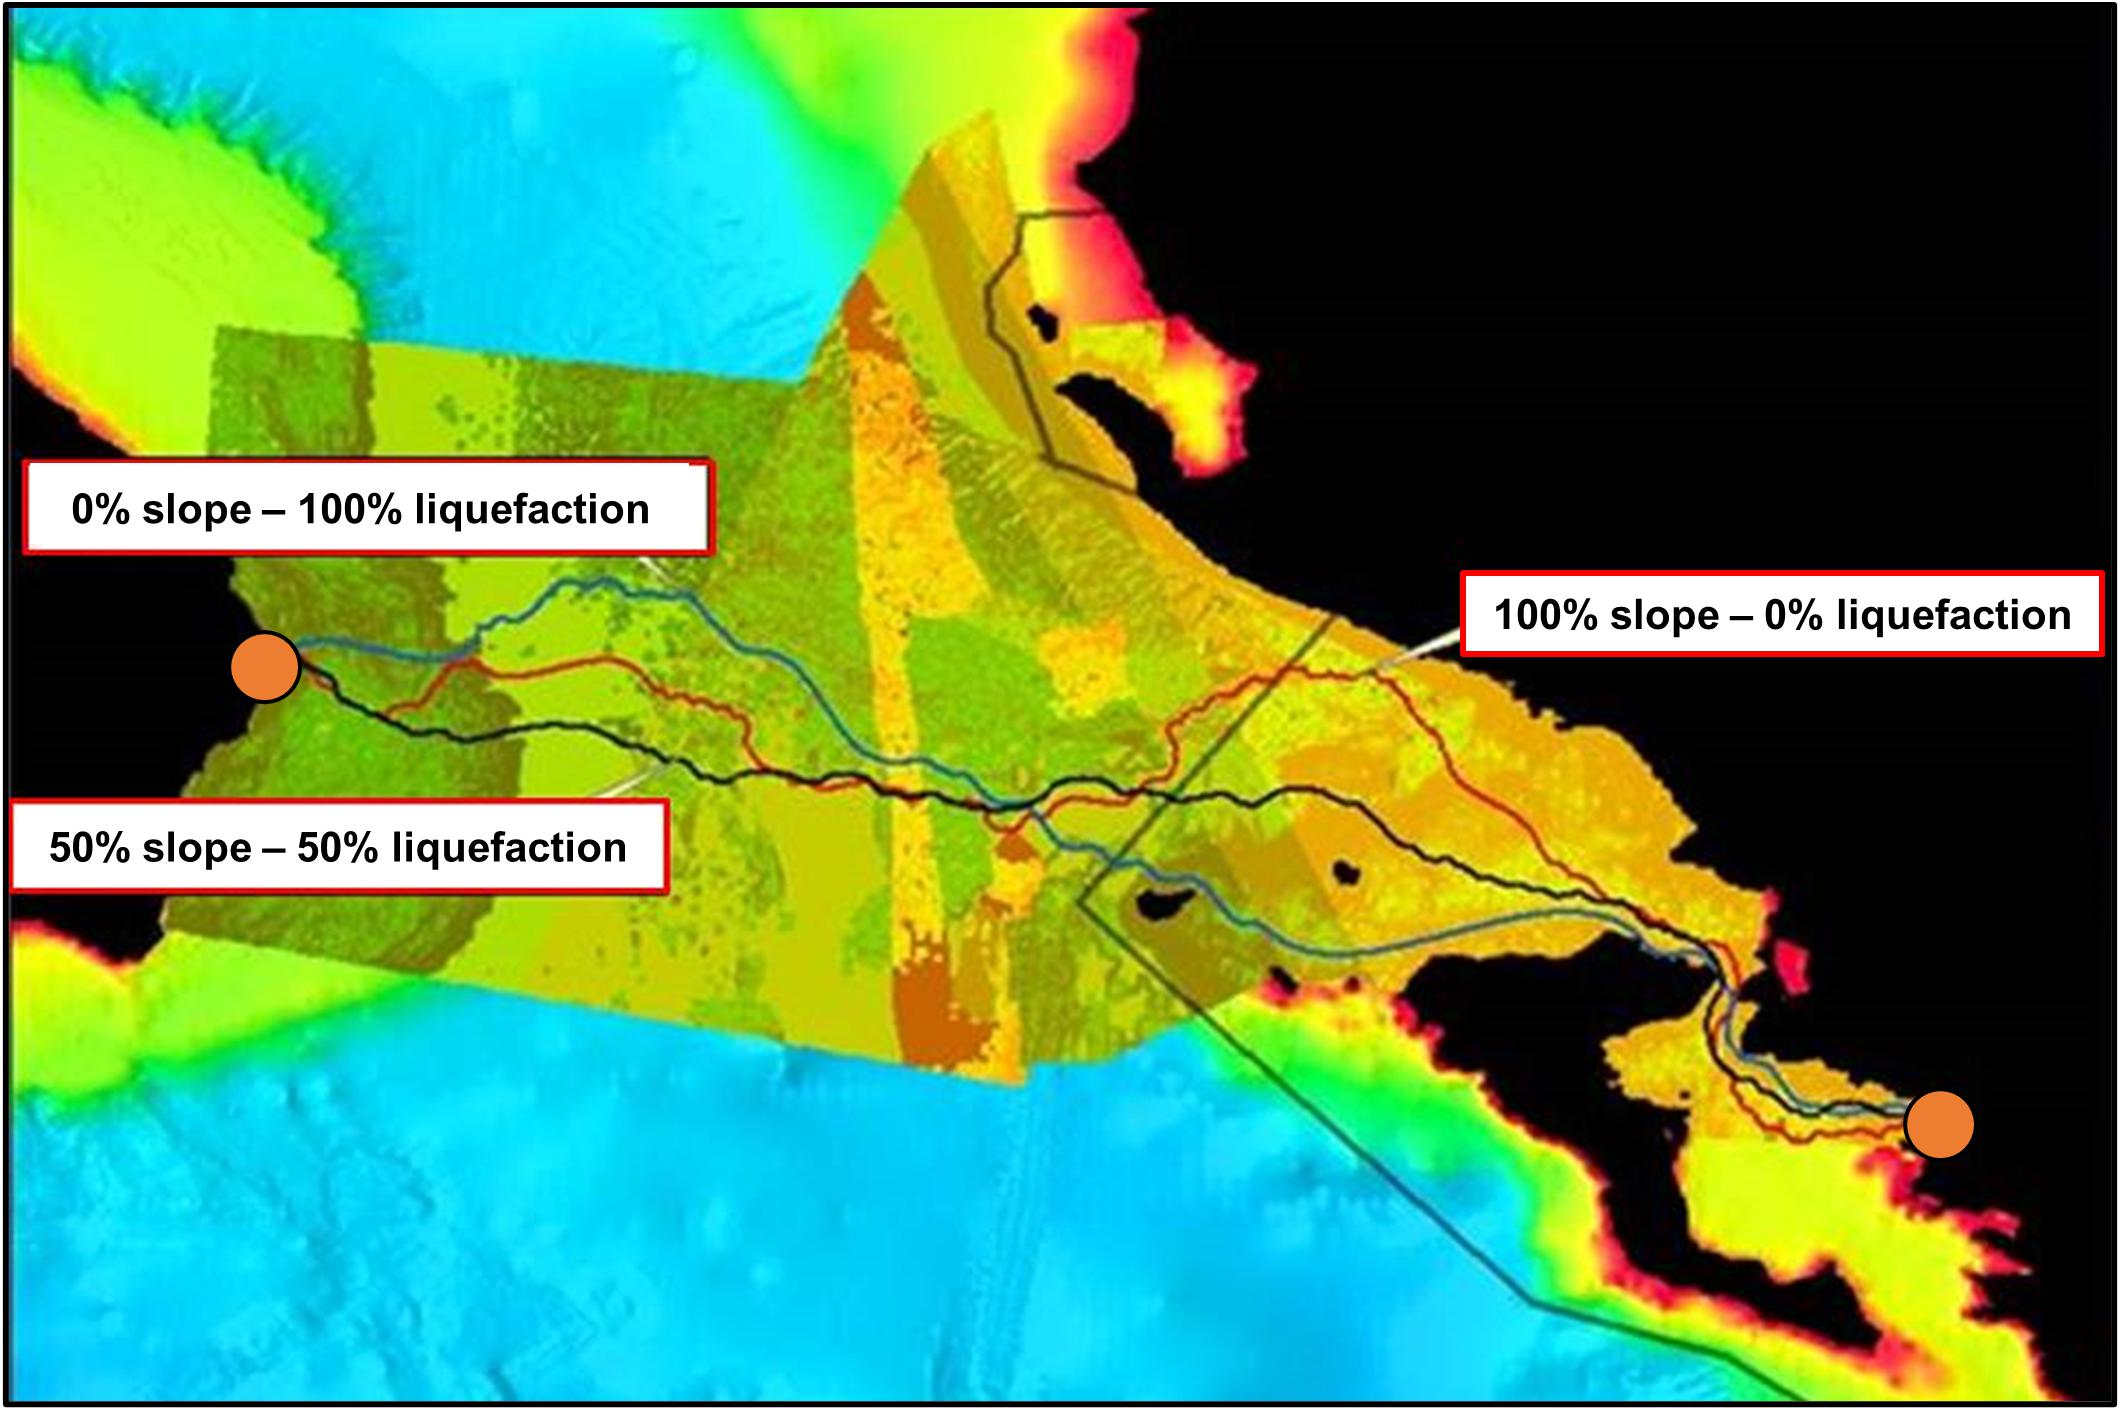
Figure 9. The three alternative cable routes that have been proposed by the decision-support tool.
Note that each route is derived by taking into account different weight factors of the two examined geohazards (soil liquefaction and slope instability) and additional routes could be derived by changing these factors. For instance, the first route takes into account only the soil liquefaction geohazard. This geohazard is directly related with the sediment concentration shown in Figure 7. Consequently, the weight is 0% for the slope instability (which is directly related to seabed inclination) and 100% for the soil liquefaction. Therefore, this route bypasses areas with high potential for soil liquefaction. Analogously, the second route has a 100% weight for slope instability, thus, bypasses seabed areas with steep slopes.
Lastly, the third route both soil liquefaction areas and steep seabed slopes are weighted with 50% to consider both geohazards. As a result of the above weighted criteria, the black path lies between the two extreme cases of the red and blue paths along the eastern part of the cable. In contrast, within the continental slope of the Adriatic Sea near Italy the black path is closer to the red path. In this case, the length minimization criterion is the most critical one and determines the cable route. More specifically, in this zone the blue and the red paths try to avoid the concentration of sediments and the steep slopes near Italy, which are more extended at the southern areas of the destination point, thus, resulting to the routes depicted in Figure 9. When setting the weight factors equal to 50%, the tool becomes less strict in avoiding these areas; thus, it passes following as much as possible a straight line in order to minimize the length of the cable. Each of these three routes could be considered as “optimal,” depending on which geohazard is given a higher priority, i.e., what is more important to avoid problematic areas with slope instabilities or soil liquefaction.
Offshore Pipeline Between Cyprus and Crete
The second application of the smart tool refers to a high-pressure offshore natural gas pipeline connecting Cyprus with Crete. This case study is based on the preliminary design of EastMed gas pipeline, which may be constructed in the near future. Actually, the pipeline that has been examined consists one of the two main offshore parts of the EastMed gas pipeline and requires the examination of a wider area in Eastern Mediterranean Sea, as shown in Figure 10. For the representation of this area, satellite images from Google Earth were utilized. Moreover, the Digital Elevation Model for the description of the seabed was obtained by processing a Geotiff format file in the GIS environment. This file was downloaded from Open Topography1, which is an interface where GMRT data are accessed (Ryan et al., 2009). The Global Multi-Resolution Topography (GMRT) synthesis is a multi-resolution compilation of edited multi-beam sonar data collected by scientists and institutions worldwide that is reviewed, processed and gridded by the Marine Geoscience Data System Team (MGDS) and merged into a single continuously updated compilation of global elevation data2.
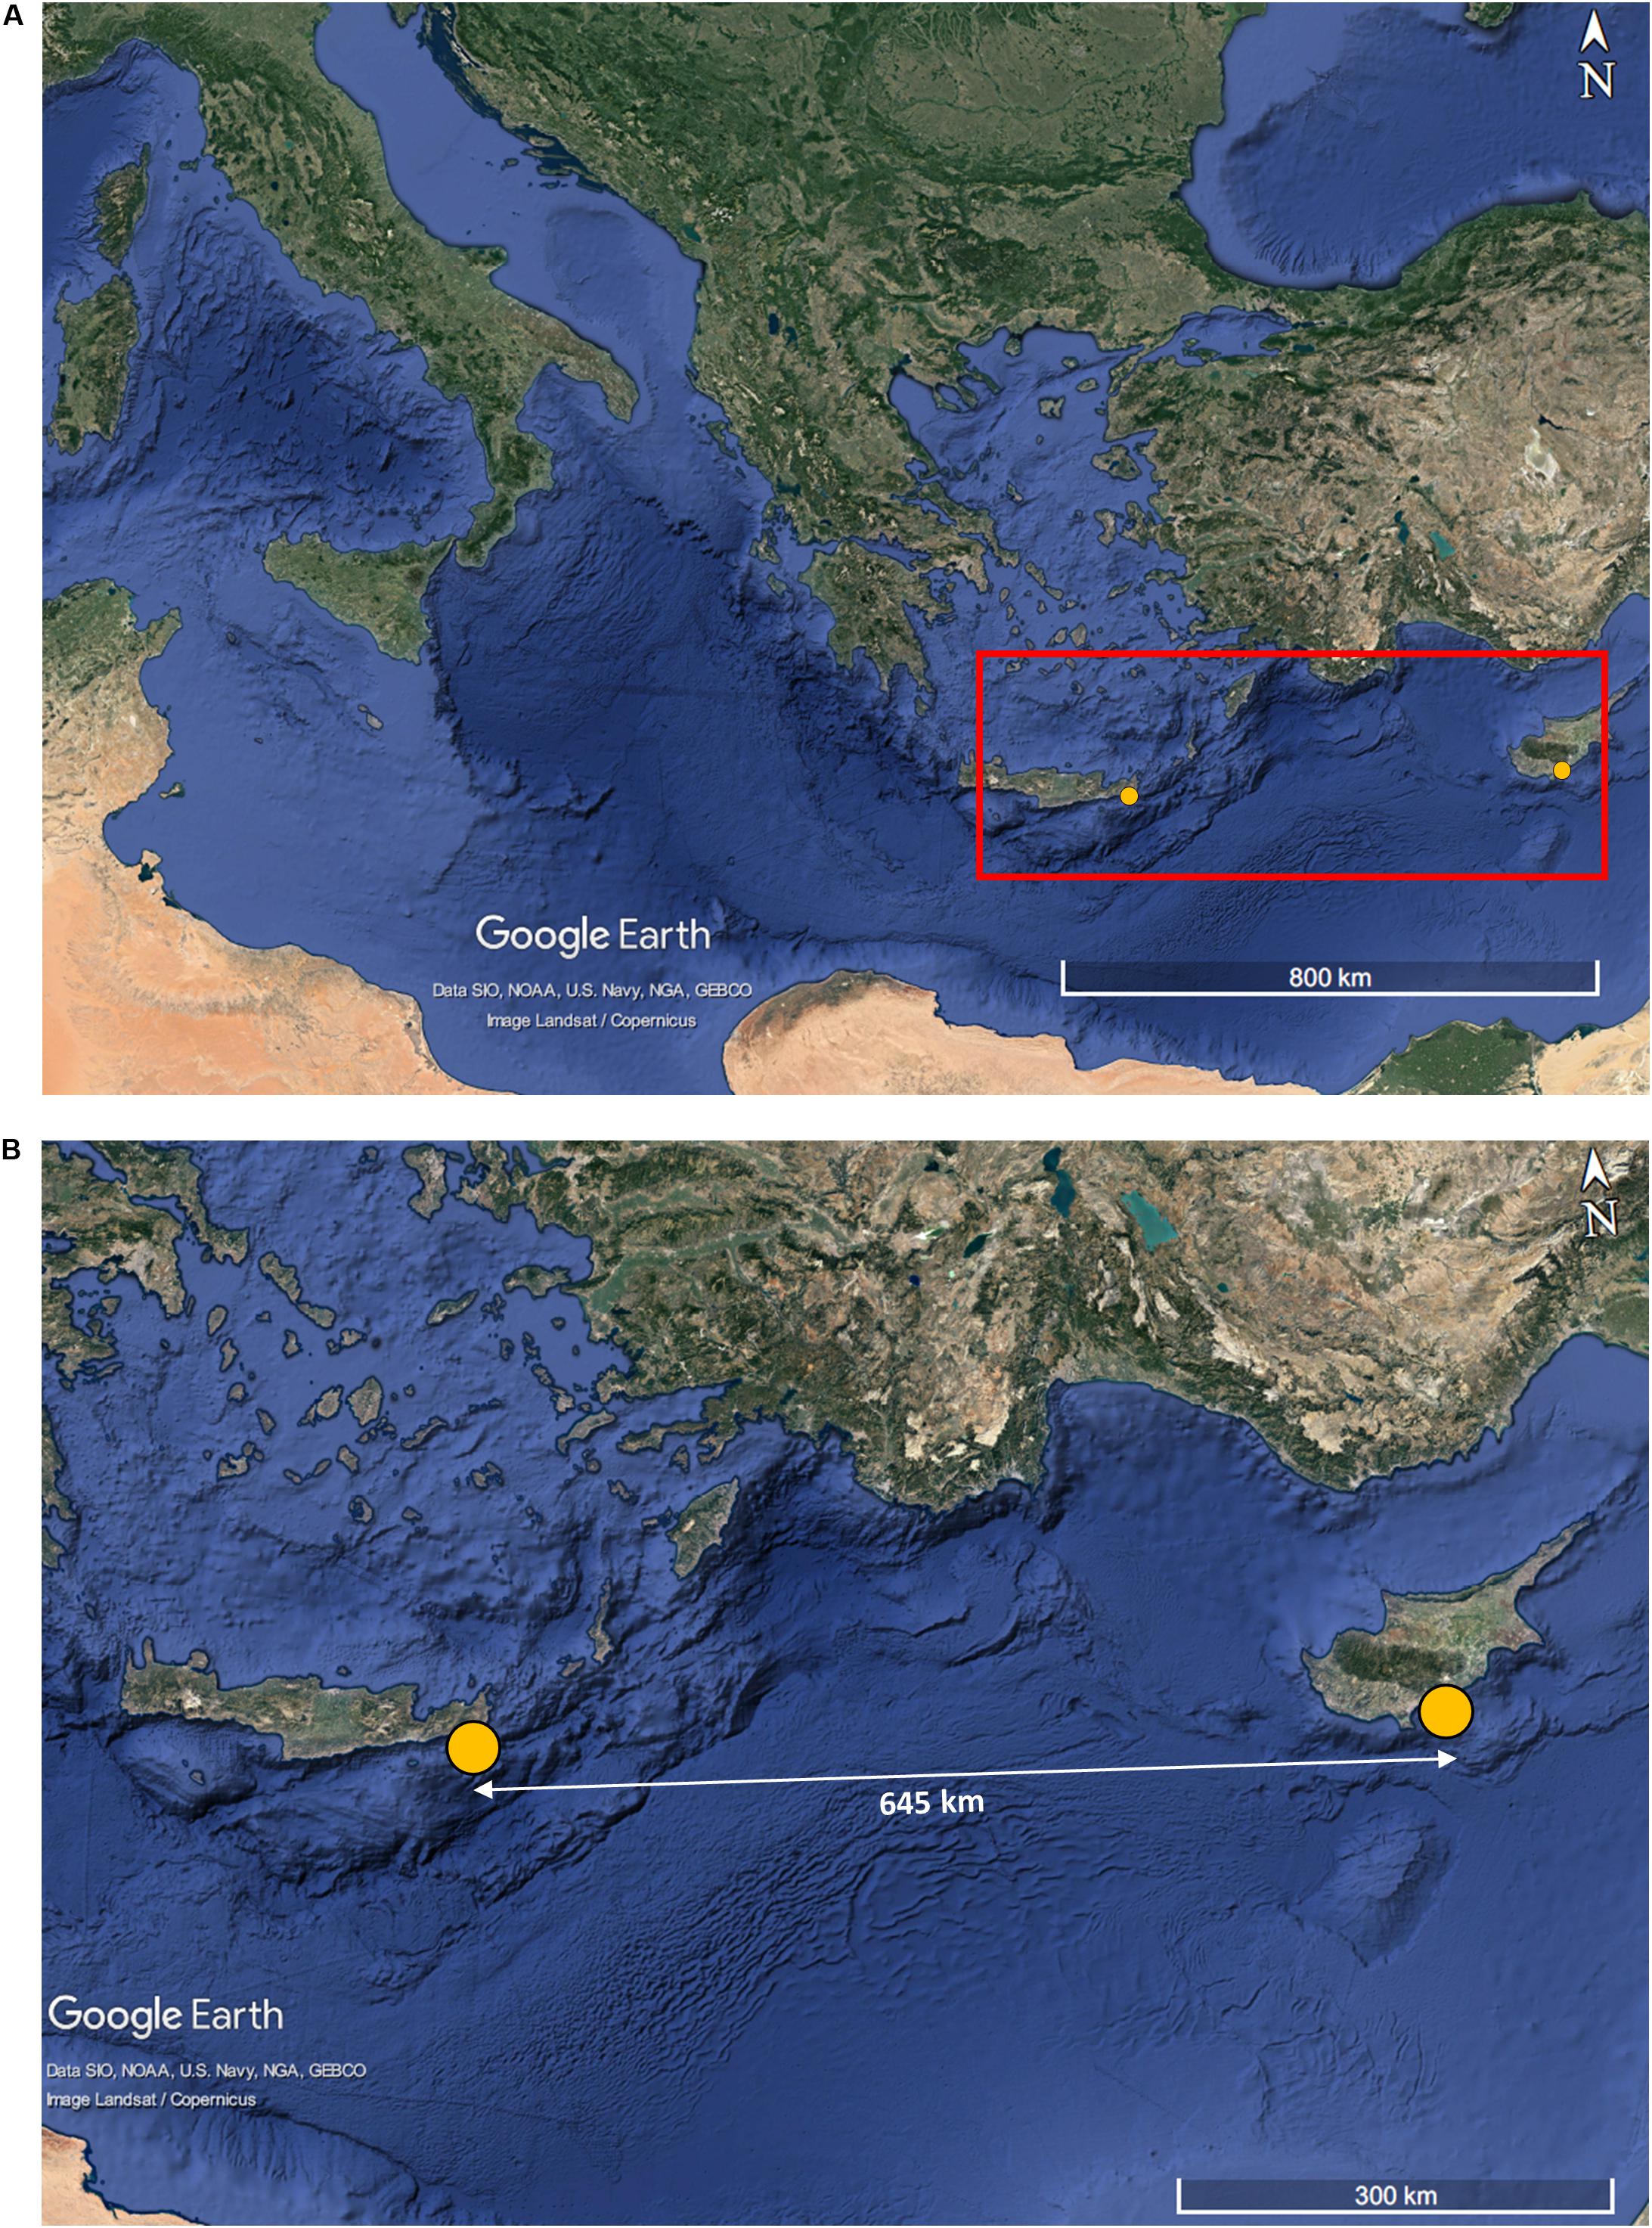
Figure 10. (A) the examined area in the Eastern Mediterranean Sea, and (B) the origin and the destination points of the pipeline in Crete and Cyprus (yellow points).
The bathymetric data, which were necessary for all maps, were obtained from Natural Earth3. These data were created from Shuttle Radar Topography Mission plus (SRTM plus) and they were nested polygons for each depth (i.e., 200, 1000, 2000, 3000, 4000, 5000). Seismic faults were acquired from the National Oceanic and Atmospheric Administration4 (NOAA) as linear entities. For the final creation of the maps, the boundaries of the Mediterranean Sea were derived through a series of processes in the GIS environment, based on shapefiles related to sea areas obtained from Marineregions.org5.
As the pipeline approaches the island of Crete, it is expected to cross three active seismic fault zones, and in particular: (i) the East Mediterranean Ridge, (ii) the Hellenic Trench, and (iii) the Cretan-Rhodes Ridge, as shown in Figure 11A. It has to be stressed that the exact details of the seismic fault zones cannot be accurately determined, regarding both their potential maximum slip (amplitude and orientation) as well as their geometry. The examined area is very active tectonically, characterized by displacements at the bedrock of the order of 4 cm per year (Apel et al., 2007), which is equivalent to 2 m during the 50-year lifetime period of the pipeline. In addition, the bathymetry of East Mediterranean Sea is characterized by deep waters, reaching depths up to 2,500 m in this region, as illustrated in Figure 11B.
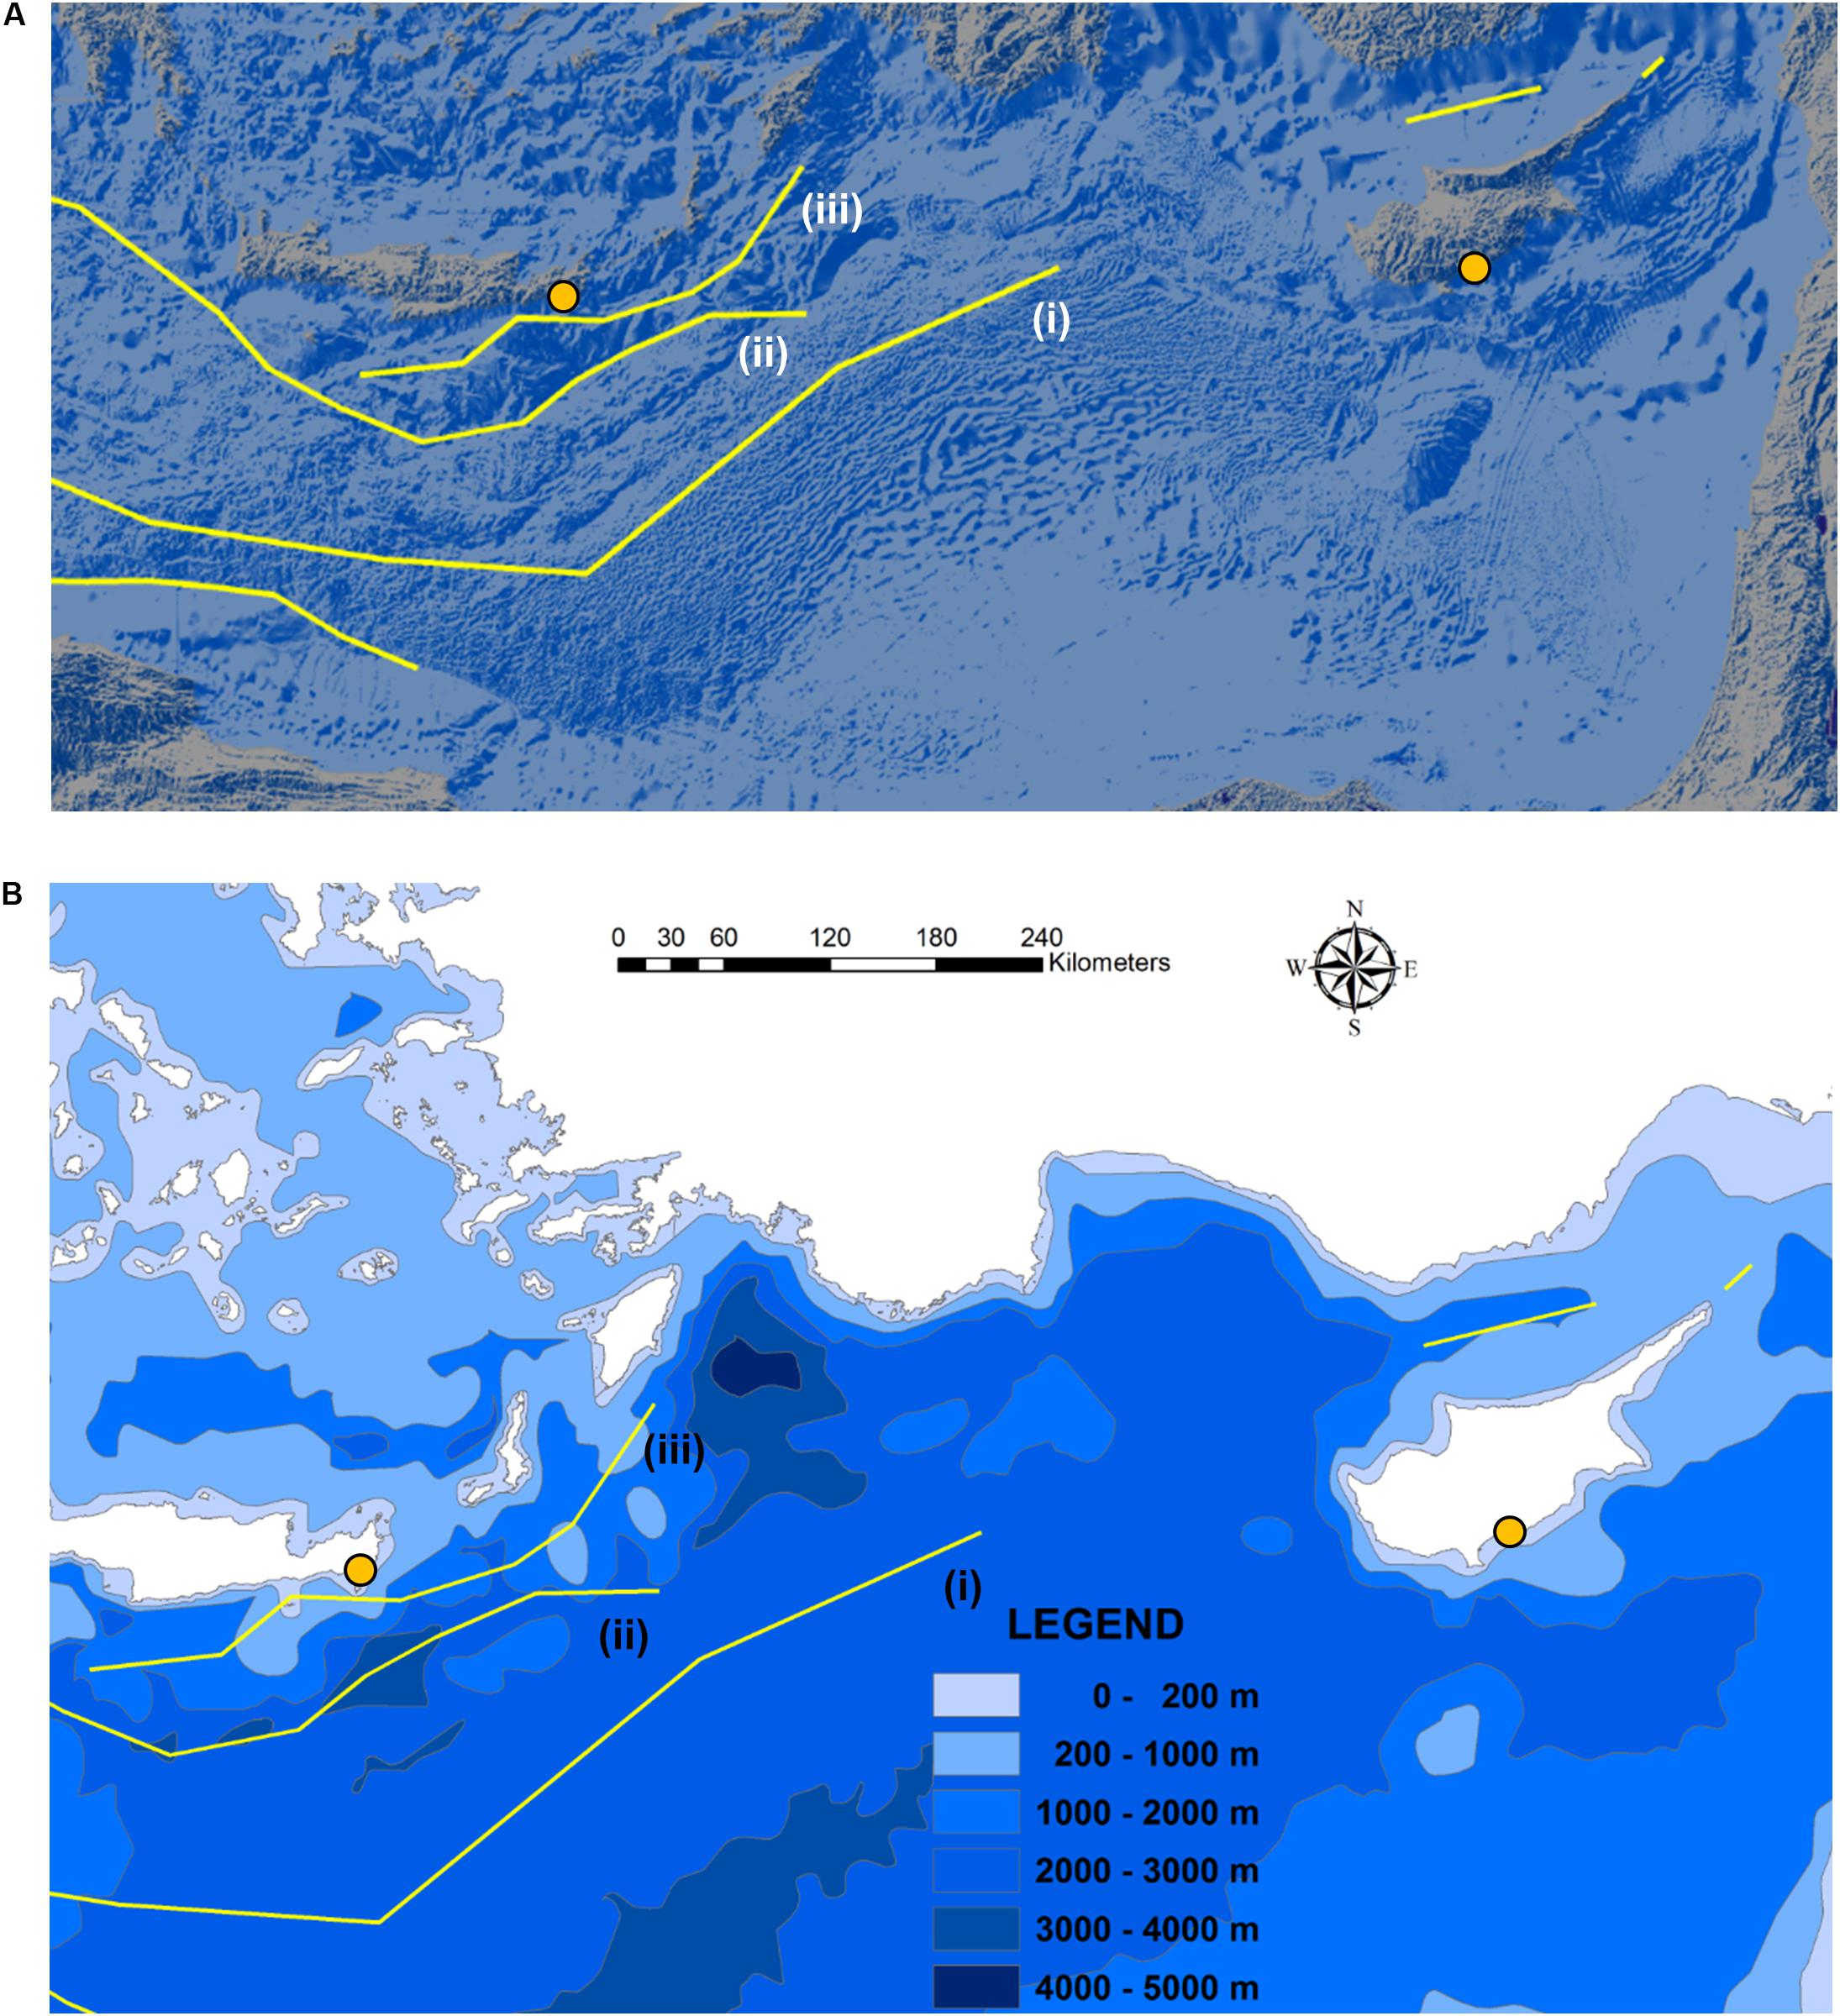
Figure 11. (A) Morphology and (B) bathymetry of the East Mediterranean Sea and main active fault zones: (i) East Mediterranean Ridge, (ii) Hellenic Trench, and (iii) Cretan-Rhodes Ridge.
As discussed earlier, past recordings and analyses have shown that the existence of soft soil layers or sediments above active seismic faults can be beneficial to the distress of a crossing lifeline, as they significantly reduce differential settlements at the ground surface or at the seabed. Moreover, the role of sediments covering the East Mediterranean Ridge is expected to be important for the design of the examined pipeline. Figure 12 presents a map showing the thickness of the sediments in the Mediterranean Sea6. In the area of South-Eastern Mediterranean Sea sediment thickness varies from 0 to 800 m (Gennesseaux and Winnock, 1993). The maximum depth where the pipeline will be placed in this area is approximately 2,500 m. The high-pressure offshore natural gas pipeline is assumed to have an outer diameter of D = 0.66 m, and wall thickness t = 27 mm.
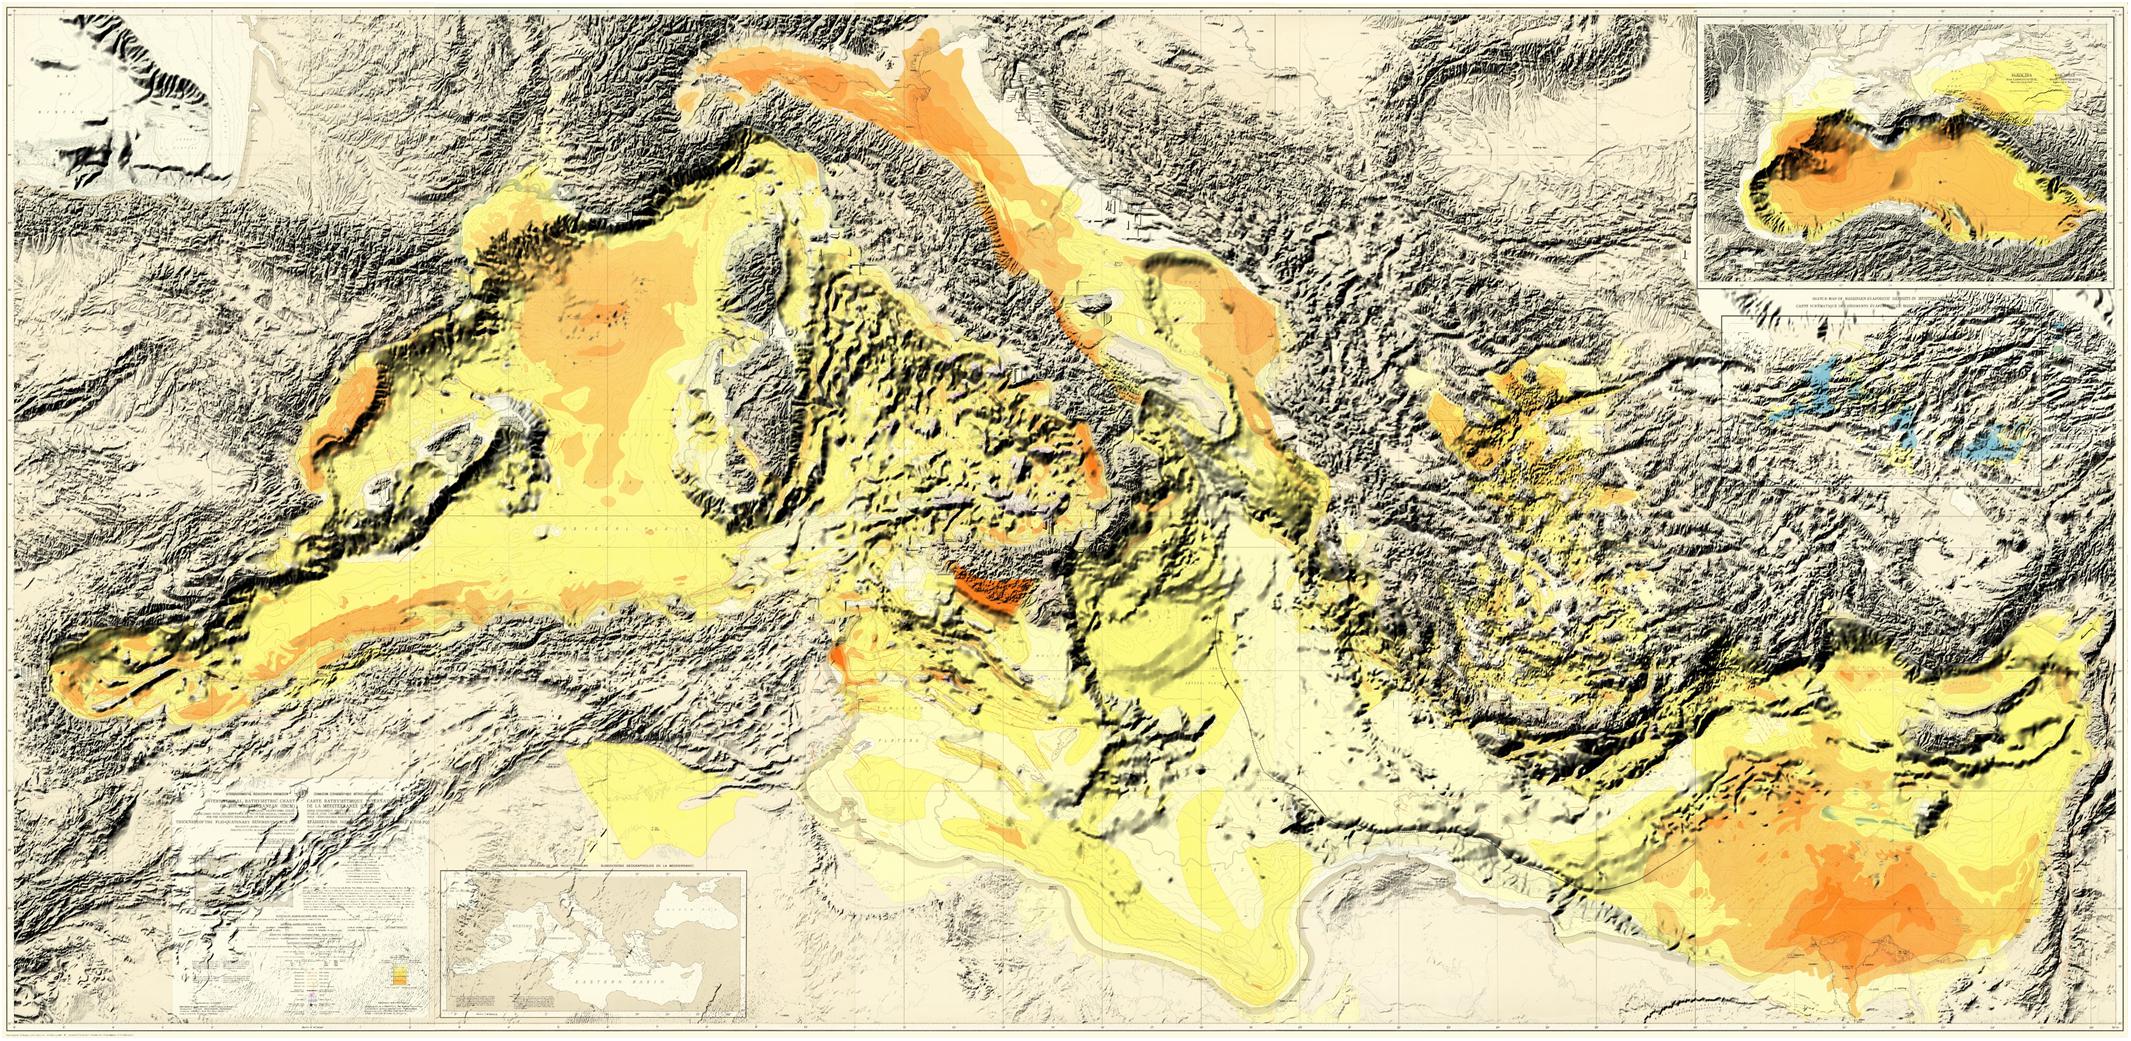
Figure 12. Sediment thickness map (Gennesseaux and Winnock, 1993).
In its current version the computational tool, apart from the avoidance of potentially problematic areas, has the capability to: (a) assess the geohazard(s) quantitatively (after taking into account the aforementioned beneficial role of sediments), and (b) estimate the pipeline distress in terms of developed strains. Therefore, the pipeline-fault crossing can be checked after performing numerical simulations regarding the fault rupture propagation path through the soft sediments, as well as analyses related to the soil-structure interaction between the pipeline and the sediments. Despite the fact that the thickness of the sediments, H, may be of the order of 800 m in this region, in the present case study three rather conservative scenarios with respect to the thickness of the sedimentary layers were examined: 50, 100, and 150 m. Indicative results for the case of H = 100 m are depicted in Figure 13A. It is obvious that at the surface of the seabed the PGDs are smoother than the PGDs at the bedrock. Additionally, Figure 13B presents the results of the numerical simulations of the soil-structure interaction in terms of axial deformation of the pipeline crossing the seismic fault. It is apparent that when the pipeline crosses an active seismic fault zone with sediments of zero or small thickness, then it will be exposed to greater distress.
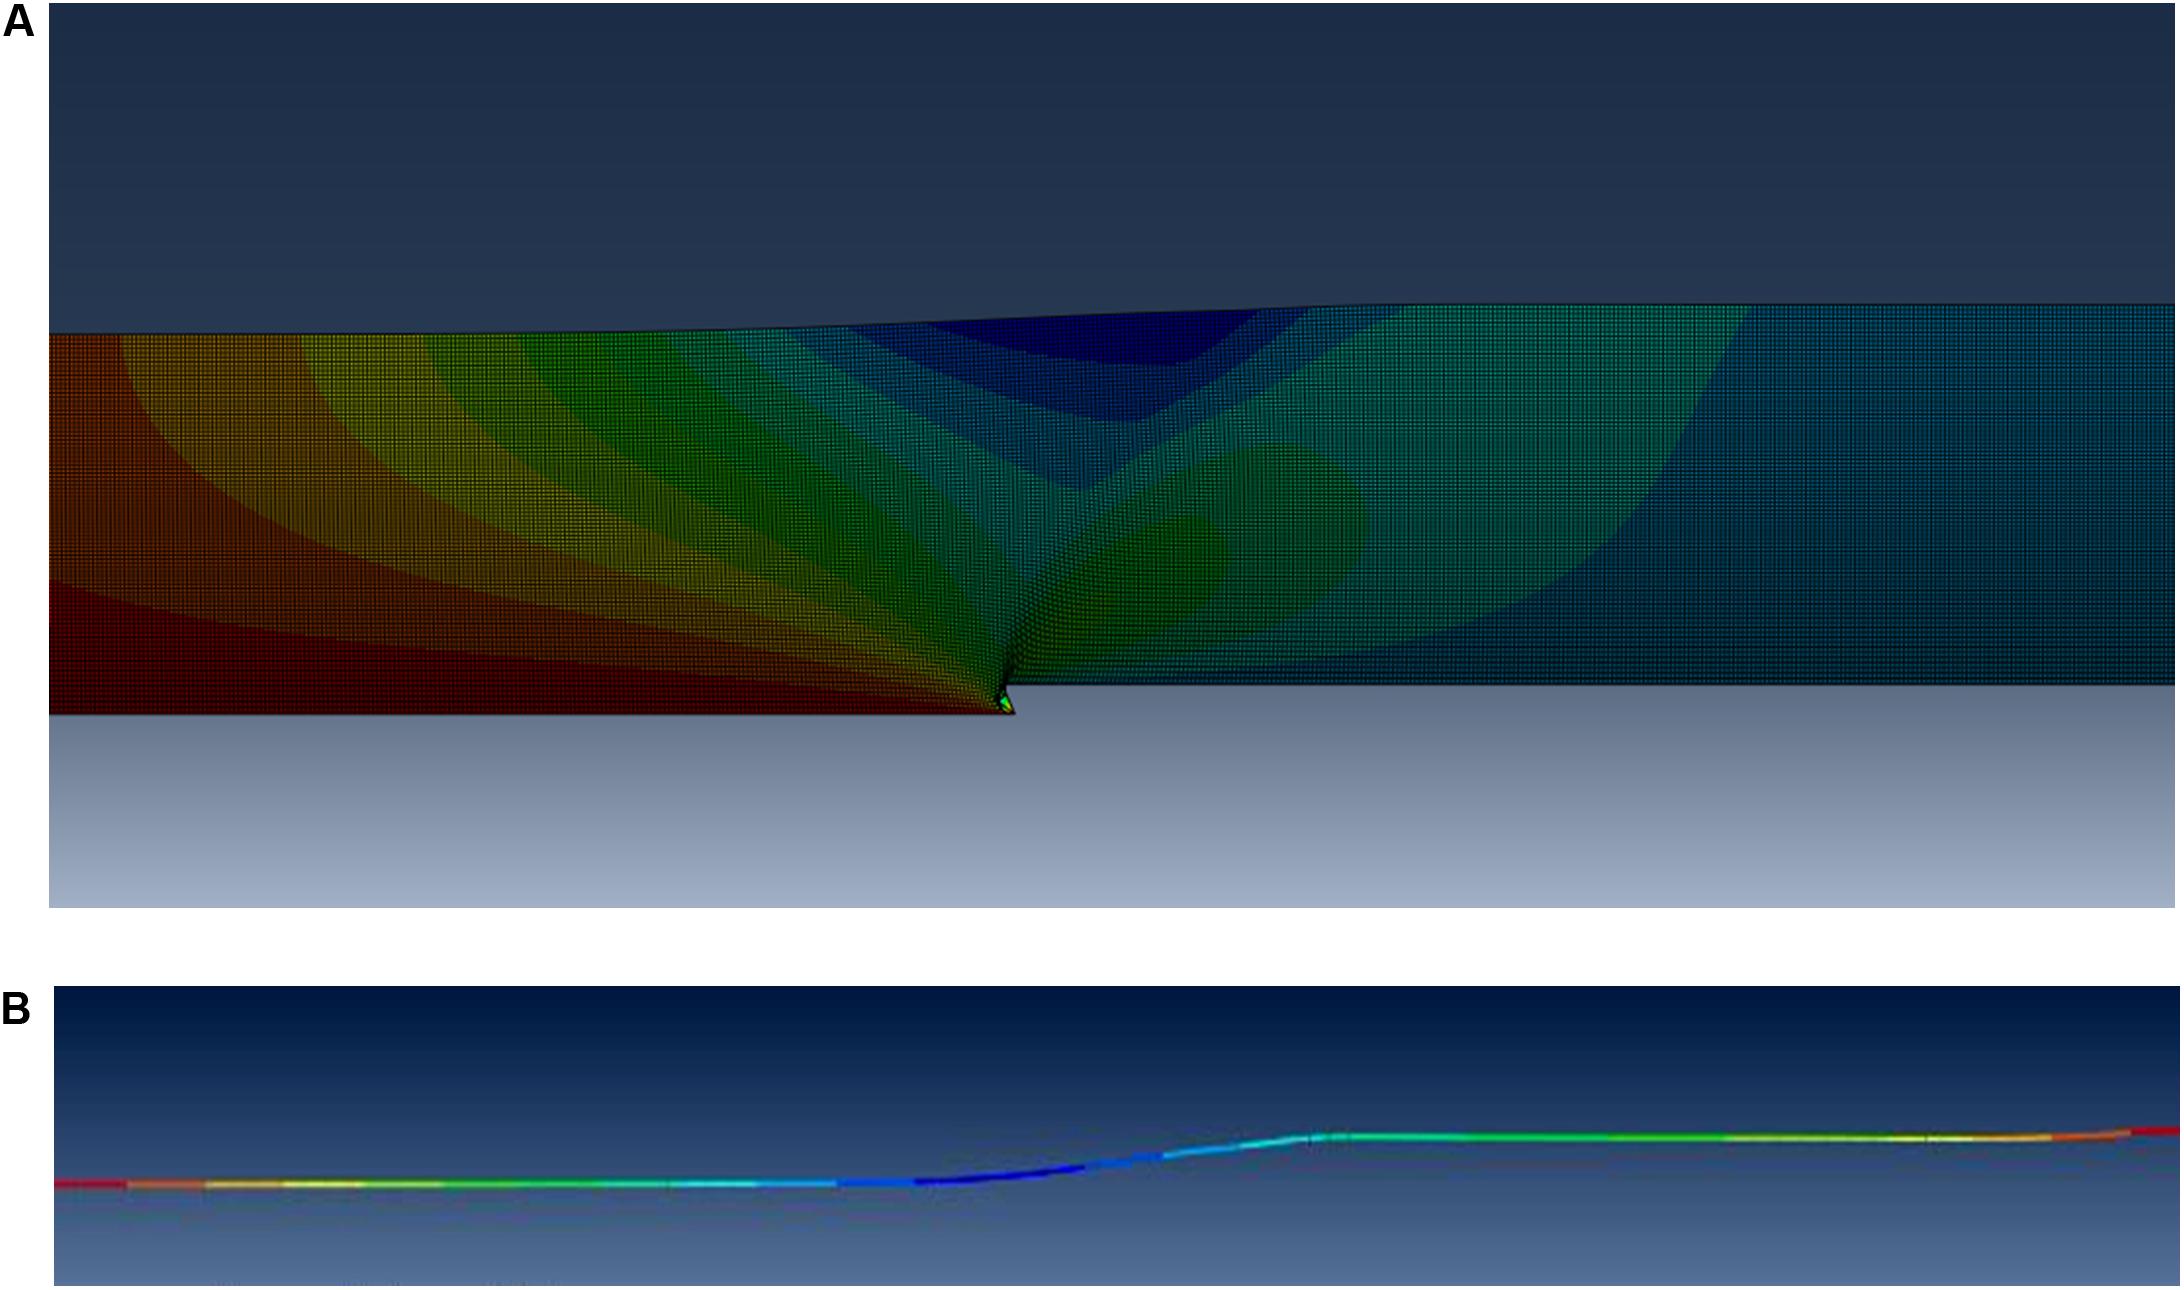
Figure 13. Numerical results: (A) the differential settlement of the sedimentary layer due to fault rupture, and (B) the axial pipeline deformations.
A s it has already been mentioned, the initial version of the computational tool had the capability of complete avoidance of all potentially problematic areas, which in this case are the three seismic fault zones depicted in Figure 11. However, one difference from the previous case study is that there is only one design criterion, i.e., kinematic distress of the pipeline due to seismic faults. As there is only one criterion in this case study, the weight factor is 100% for all possible routes, while a special layer is added in ArcGIS with all details for the three major seismic faults.
The user rates each fault according to its severity (aiming to avoid or cross a fault zone if the expected PGDs are within allowable limits with or without proper mitigation measures) using a preference scale from 1 to 9. The three alternative routes have different preference values for each seismic fault. For instance, in the first route shown in Figure 14 (denoted as “Pipeline routing I”) all faults have been given the maximum preference value (i.e., 9) to completely avoid all seismic fault zones. However, in this case the pipeline length is very long, while the pipeline has to be placed in greater depths (of the order of 4,000 m) and difficult seabed conditions (narrow valleys, etc.) that exist between the nearby Greek islands, leading thus to an extremely high construction cost.
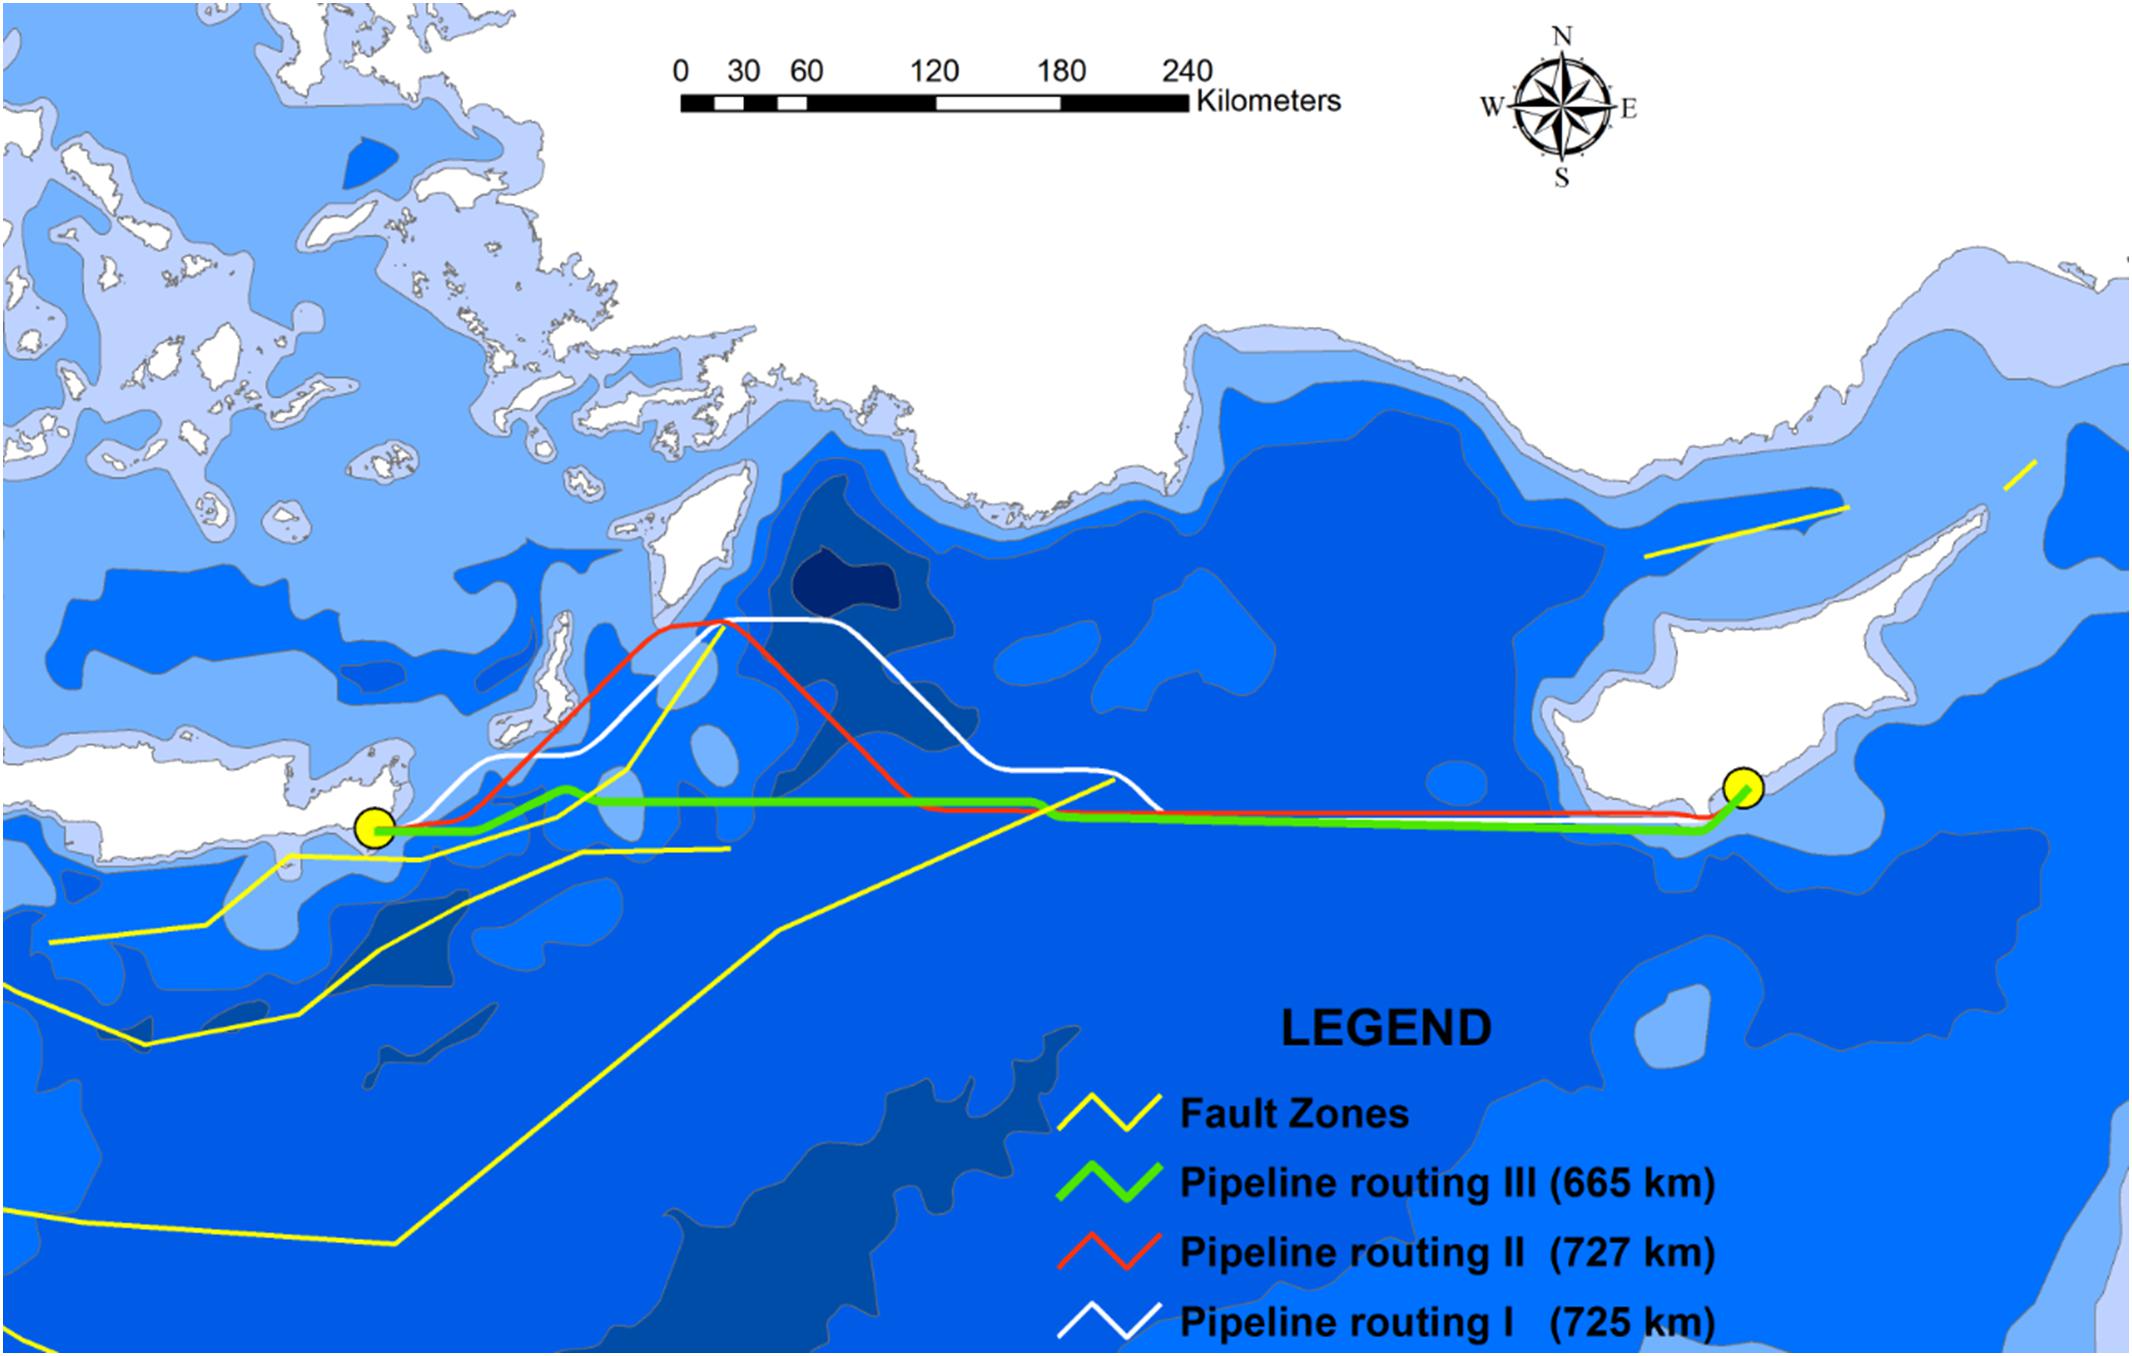
Figure 14. Alternative pipeline routes.
On the other hand, as also shown in Figure 14, the second route proposed by the tool, the so-called “Pipeline routing II,” avoids completely the seismic fault zones of Cretan-Rhodes Ridge and Hellenic Trench, but it allows the crossing through the East Mediterranean Ridge, due to the beneficial existence of sediments. It is noted that despite the fact that this route is regarded as safe, the construction cost remains relatively high with respect to the basic criterion of length minimization (i.e., it has approximately the same length as “Pipeline routing I”), while it may encounter the local problems mentioned previously for “Pipeline routing I.”
Apart from the two routes which have been proposed by the tool, a third route can be considered in order to achieve the required length minimization (i.e., cost minimization). As presented in Figure 14, “Pipeline routing III” avoids the Hellenic Trench, but crosses both the East Mediterranean Ridge and the Cretan-Rhodes Ridge and has substantially smaller length than the previous two routes, as shown in the legend of Figure 14. Since the Cretan-Rhodes Ridge has actually no sediments, thus, substantial pipeline distress is expected. For this reason, if the project is going to be constructed, then detailed analyses in conjunction with efficient mitigation measures will be required in order to safely cross this area.
Lastly, the tool has also the ability to provide supporting graphs in three-dimensional form. More specifically, for a better understanding of the topography, the bathymetry of the study area and the proposed pipeline routing, the tool can export a qualitative three-dimensional representation of the seabed with the pipeline, as shown in Figure 15A. In addition, a profile graph of the pipeline routing can be exported, e.g., Figure 15B, which could be useful to estimate the total route length and the depths at which the pipeline would be placed.
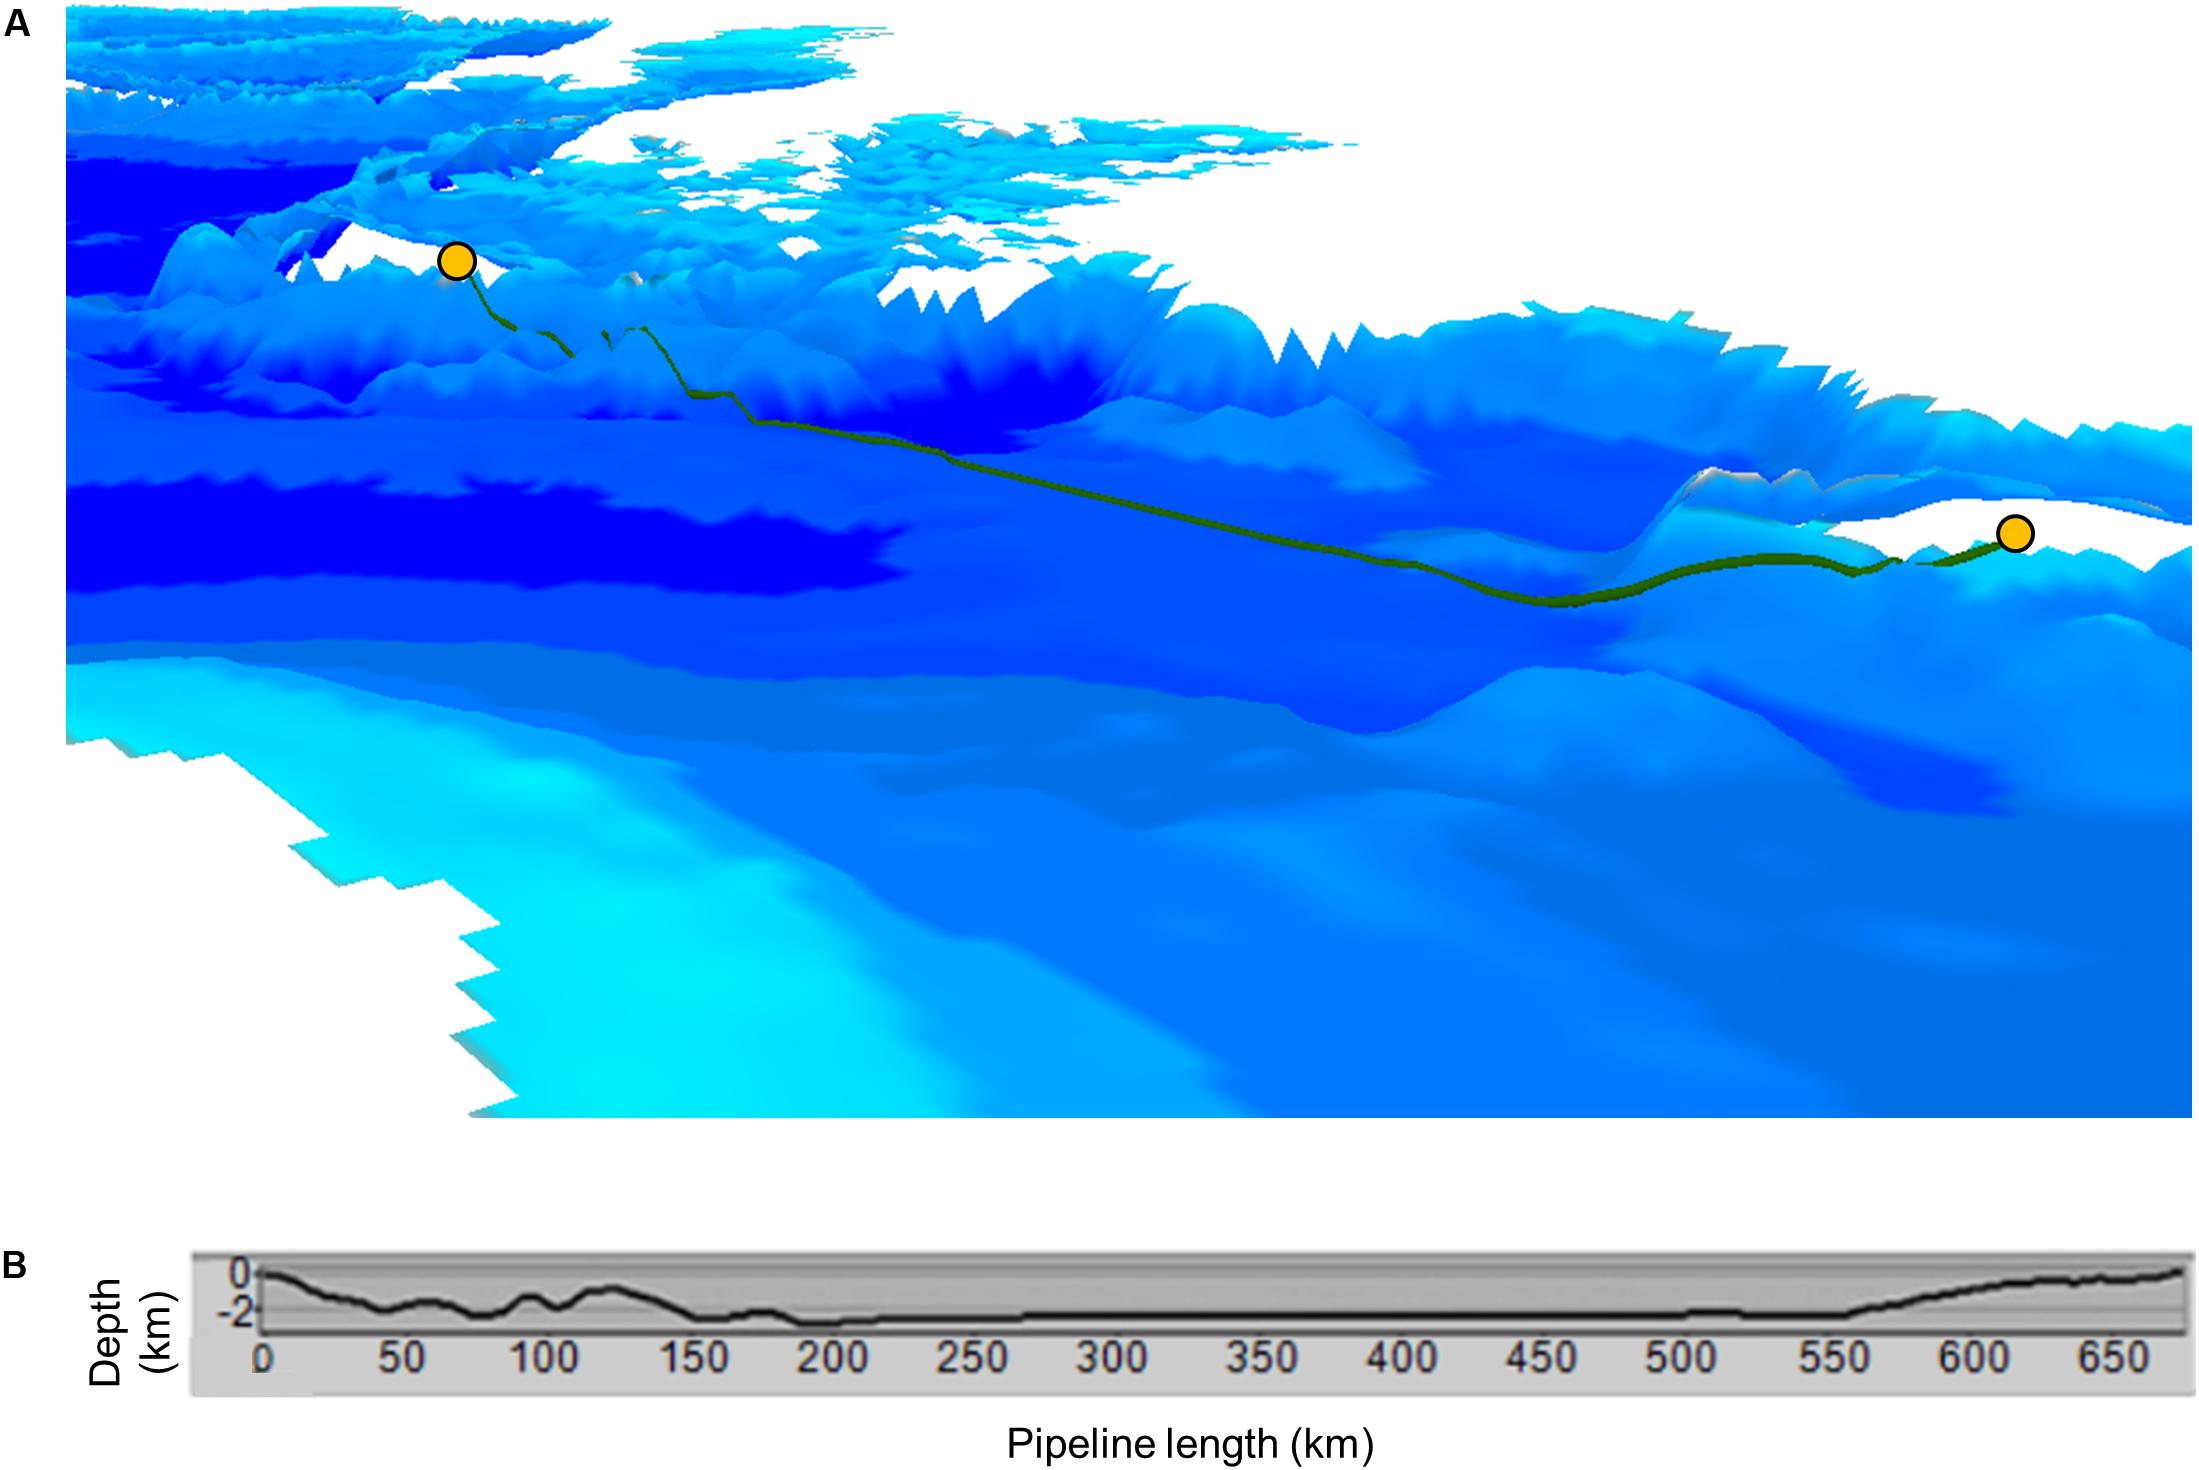
Figure 15. (A) 3D model, and (B) profile graph of “Pipeline routing III.”
Conclusions
The current study focuses on route optimization of offshore lifelines (i.e., hydrocarbon pipelines and interconnecting cables), taking into consideration the potential crossing of extensive submarine areas, facing various offshore earthquake-related geohazards, apart from the typical criteria, such as length minimization, avoidance of forbidden zones, etc. Combining the capabilities of ArcGIS (ESRI, 2013) platform with the finite-element software ABAQUS (Simulia, 2014), a smart decision-support tool has been developed in order to facilitate: (a) the qualitative and quantitative assessment of the major earthquake-related geohazards along a possible lifeline routing, (b) the quantitative assessment of their potential impact on the lifeline, and (c) the selection of the optimum pipeline route. The tool has been applied in two case studies in the Mediterranean Sea, which is a region characterized by: (a) great potential for offshore development in the near future, and (b) moderate to high seismicity and consequent earthquake-related geohazards.
Although the new tool requires further improvement, the preliminary results demonstrate its capability to handle, analyze and manage all the available spatial data that are directly or indirectly linked with the earthquake-related geohazards (i.e., topographical, geological, geotechnical, seismotectonical, and seismological data) and to support the geoscientists and engineers to quantify the geohazards and the relevant risks and to make a prompt and clear distinction between the actual critical areas, that a lifeline cannot cross, and the non-critical areas, that a lifeline can safely cross.
Author Contributions
YT and PP supervised the study and guided DC to carry out the literature review and NM to perform the required runs for the dynamic analyses. PP also assisted NM to develop the numerical models. All authors analyzed and interpreted the results and contributed to the completion of the manuscript.
Funding
This research was co-financed by the Greece and the European Union (European Social Fund – ESF) through the Operational Programme “Human Resources Development, Education and Lifelong Learning” in the context of the project “Strengthening Human Resources Research Potential via Doctorate Research” (MIS-5000432), implemented by the State Scholarships Foundation (IKY).
Conflict of Interest
The authors declare that the research was conducted in the absence of any commercial or financial relationships that could be construed as a potential conflict of interest.
The reviewer MF declared a shared affiliation, with no collaboration, with the authors to the handling editor at the time of review.
Frontiers Media SA remains neutral with regard to jurisdictional claims in published maps and institutional affiliations.
Acknowledgments
The authors are grateful to Mr. S. Tsougkranis and Mr. D. Chavelas for their valuable contribution to the development of the computational tool. This work is based on services provided by the OpenTopography Facility.
Footnotes
- ^ Open Topography, April 26, 2018, accessed December, 2019, https://opentopography.org/.
- ^ Global Multi-Resolution Topography Data Synthesis, October, 2019, accessed December, 2019, https://www.gmrt.org/.
- ^ Natural Earth, 2009, accessed December, 2019, https://www.naturalearthdata.com/.
- ^ National Oceanic and Atmospheric Administration, accessed December, 2019, https://www.ngdc.noaa.gov/.
- ^ Flanders Marine Institute, “IHO Sea Areas, version 3,” MarineRegions.org, 2018, accessed December, 2019, https://www.marineregions.org/.
- ^ Gennesseaux M. and Winnock E., “International Bathymetric Chart of the Mediterranean (IBCM),” Intergovernmental Oceanographic Commission, 1993, accessed December, 2019, https://www.ngdc.noaa.gov/mgg/ibcm/ibcmsedt.html.
References
American Bureau of Shipping (2016). Guidance Notes on Subsea Pipeline Route Determination. Houston, TX: American Bureau of Shipping.
American Lifelines Alliance (2001). Guidelines for the Design of Buried Steel Pipe. Reston, VA: American Society of Civil Engineers.
Anastasopoulos, I., Callerio, A., Bransby, M. F., Davies, M. C. R., El Nahas, A., Faccioli, E., et al. (2008). Numerical analyses of fault-foundation interaction. Bull. Earthq. Eng. 6, 645–675. doi: 10.1007/s10518-008-9078-1
Apel, E., Bürgmann, R., and Serpelloni, E. (2007). “Rigid block motion, interseismic strain, and backarc deformation in the aegean,” in Proceedings of the AGU Fall Meeting Abstracts, Bologna.
Bagli, S., Geneletti, D., and Orsi, F. (2011). Routeing of power lines through least-cost path analysis and multicriteria evaluation to minimise environmental impacts. Environ. Impact Assess. Rev. 31, 234–239. doi: 10.1016/j.eiar.2010.10.003
Balogun, A. L., Matori, A. N., and Hamid-Mosaku, A. I. (2015). A fuzzy multi-criteria decision support system for evaluating subsea oil pipeline routing criteria in East Malaysia. Environ. Earth Sci. 74, 4875–4884. doi: 10.1007/s12665-015-4499-z
Balogun, A. L., Matori, A. N., Hamid-Mosaku, A. I., Umar Lawal, D., and Ahmed Chandio, I. (2017). Fuzzy MCDM-based GIS model for subsea oil pipeline route optimization: an integrated approach. Mar. Georesources Geotechnol. 35, 961–969. doi: 10.1080/1064119X.2016.1269247
Balogun, A. L., Matori, A. N., Yusof, K., Lawal, D. U., and Chandio, I. A. (2013). Geographic information system (GIS) in Offshore pipeline route selection: past, present, and future. Pensee J. 75, 374–396.
Bransby, M. F., Davies, M. C. R., and El Nahas, A. (2008). Centrifuge modelling of normal fault-foundation interaction. Bull. Earthq. Eng. 6, 585–605. doi: 10.1007/s10518-008-9079-0
Çevik, E., and Topal, T. (2003). GIS-based landslide susceptibility mapping for a problematic segment of the natural gas pipeline, Hendek (Turkey). Environ. Geol. 44, 949–962. doi: 10.1007/s00254-003-0838-6
Chatzidakis, D., Tsompanakis, Y., and Psarropoulos, P. N. (2019). An improved analytical approach for simulating the lateral kinematic distress of deepwater offshore pipelines. Appl. Ocean Res. 90:101852. doi: 10.1016/j.apor.2019.101852
Det Norske Veritas (2012). Submarine Pipeline Systems. Offshore Standandard DNV-OS-F101. Oslo: Det Norske Veritas.
Devine, C. A., and Haneberg, W. C. (2016). “Optimization methods for arctic pipeline route selection,” in Proceedings of the Arctic Technology Conference 2016, St. John’s, NL. doi: 10.4043/27391-ms
Devine, C. A., Haneberg, W. C., Lee, H., Liu, M. L., and Chang, G. A. (2016). “A sensible approach to subsea pipeline route determination – moving from hand-drawn routes to geologically-constrained, least-cost optimized paths,” in Proceedings of the Annual Offshore Technology Conference, Houston, TX. doi: 10.4043/26940-ms
Douglas, D. H. (1994). Least-cost path in GIS using an accumulated cost surface and slopelines. Cartographica 31, 37–51. doi: 10.3138/D327-0323-2JUT-016M
European Commitee for Standardization (2006). EN 1998-4:2006 – Eurocode 8: Design of Structures for Earthquake Resistance – Part 4: Silos, Tanks and Pipelines. Brussels: European Commitee for Standardization.
Feldman, S. C., Pelletier, R. E., Walser, E., Smoot, J. C., and Ahl, D. (1995). A prototype for pipeline routing using remotely sensed data and geographic information system analysis. Remote Sens. Environ. 53, 123–131. doi: 10.1016/0034-4257(95)00047-5
Gennesseaux, M., and Winnock, E. (1993). Thickness of Mediterranean Plio-quaternary Sediment. Intergov. Oceanogr. Cinnussuib (UNESCO). IBCM Geol. Geoph. Ser. Available online at: https://www.ngdc.noaa.gov/mgg/ibcm/ibcmsedt.html (accessed December 15, 2019).
Halabian, A. M., and Hokmabadi, T. (2018). A new hybrid model for rigorous analysis of buried pipelines under general faulting accounting for material and geometrical non-linearities with focusing on corrugated HDPE pipelines. Soil Dyn. Earthq. Eng. 115, 1–17. doi: 10.1016/j.soildyn.2018.08.005
Haneberg, W. C., Bruce, B., and Drazba, M. C. (2013). “Using qualitative slope hazard maps and quantitative probabilistic slope stability models to constrain least-cost pipeline route optimization,” in Proceedings of the Offshore Technology Conference, Houston, TX. doi: 10.4043/23980-ms
Joshi, S., Prashant, A., Deb, A., and Jain, S. K. (2011). Analysis of buried pipelines subjected to reverse fault motion. Soil Dyn. Earthq. Eng. 31, 930–940. doi: 10.1016/j.soildyn.2011.02.003
Kaynia, A. M., Dimmock, P., and Senders, M. (2014). “Earthquake response of pipelines on submarine slopes,” in Proceedings of the Annual Offshore Technology Conference, Houston, TX. doi: 10.4043/25186-ms
King, T., Phillips, R., and Johansen, C. (2011). “Pipeline routing and burial depth analysis using GIS software,” in Proceedings of the Society of Petroleum Engineers – Arctic Technology Conference 2011, Houston, TX. doi: 10.4043/22085-ms
Melissianos, V. E., and Gantes, C. J. (2017). “Numerical modeling aspects of buried pipeline-fault crossing,” in Computational Methods in Applied Sciences, eds M. Papadrakakis, V. Plevris, and N. Lagaros (Cham: Springer). doi: 10.1007/978-3-319-47798-5_1
Moghaddam, H. K., and Delavar, M. R. (2007). A GIS-based pipelining using fuzzy logic and statistical models. Int. J. Comput. Sci. Netw. Secur. 7, 117–123.
Monteiro, C., Ramírez-Rosado, I. J., Miranda, V., Zorzano-Santamaría, P. J., García-Garrido, E., and Fernández-Jiménez, L. A. (2005). GIS spatial analysis applied to electric line routing optimization. IEEE Trans. Power Deliv. 20, 934–942. doi: 10.1109/TPWRD.2004.839724
Psarropoulos, P. N., Tsompanakis, Y., Antoniou, A. A., and Charmpis, D. C. (2013). “The impact of earthquake-related geohazards on offshore pipelines and seaside facilities of the oil & gas industry in the mediterranean region,” in Civil-Comp Proceedings, Cagliari. doi: 10.4203/ccp.102.87
Psarropoulos, P. N., Tsougkranis, S., and Antoniou, A. A. (2016). “A smart decision-support GIS-based tool for the optimization of pipeline routing taking into consideration the potential geohazards,” in Proceedings of the 11th Pipeline Technology Conference (PTC-2016), Berlin.
Randolph, M., and Gourvenec, S. (2017). Offshore Geotechnical Engineering. London: Spon Press. doi: 10.1201/9781315272474
Ryan, W. B. F., Carbotte, S. M., Coplan, J. O., O’Hara, S., Melkonian, A., Arko, R., et al. (2009). Global multi-resolution topography synthesis. Geochem. Geophys. Geosyst. 10:Q03014. doi: 10.1029/2008GC002332
Sarvanis, G. C., and Karamanos, S. A. (2017). Analytical model for the strain analysis of continuous buried pipelines in geohazard areas. Eng. Struct. 152, 57–69. doi: 10.1016/j.engstruct.2017.08.060
Schwarz, L., Robl, K., Wakolbinger, W., Mühling, H., and Zaradkiewicz, P. (2015). “GIS based, heuristic approach for pipeline route corridor selection,” in Engineering Geology for Society and Territory – Volume 6: Applied Geology for Major Engineering Projects, ed. G. Lollino (Cham: Springer). doi: 10.1007/978-3-319-09060-3_48
Slejko, D., Camassi, R., Cecic, I., Herak, D., Herak, M., Kociu, S., et al. (1999). Seismic hazard assessment for Adria. Ann. Geofis 42, 1085–1107. doi: 10.4401/ag-3771
Trimintziou, M. S., Sakellariou, M. G., and Psarropoulos, P. N. (2015). Designing offshore pipelines facing the geohazard of active seismic faults designing offshore pipelines facing the geohazard of active seismic faults. Int. J. Civil Environ. Struct. Constr. Archit. Eng. 9, 775–784. doi: 10.5281/zenodo.1109850
Uckan, E., Akbas, B., Shen, J., Rou, W., Paolacci, F., and O’Rourke, M. (2015). A simplified analysis model for determining the seismic response of buried steel pipes at strike-slip fault crossings. Soil Dyn. Earthq. Eng. 75, 55–65. doi: 10.1016/j.soildyn.2015.03.001
Uddin, S., Sherpa, K. S., Chakravorty, S., and Ray, A. (2017). Transmission line routing using open source software Q-GIS. Int. J. Open Source Softw. Process 8, 71–82. doi: 10.4018/IJOSSP.2017100104
Vazouras, P., Dakoulas, P., and Karamanos, S. A. (2015). Pipe-soil interaction and pipeline performance under strike-slip fault movements. Soil Dyn. Earthq. Eng. 72, 48–65. doi: 10.1016/j.soildyn.2015.01.014
Yildirim, V., and Yomralioglu, T. (2011). NABUCCO pipeline route selection through Turkey comparison of a GIS-based approach to a traditional route selection approach. Oil Gas Eur. Mag. 37, 20–24.
Yildirim, V., Yomralioglu, T., Nisanci, R., Çolak, H. E., Bediroğlu, ş, and Saralioglu, E. (2017). A spatial multicriteria decision-making method for natural gas transmission pipeline routing. Struct. Infrastruct. Eng. 13, 567–580. doi: 10.1080/15732479.2016.1173071
Zhang, L., Zhao, X., Yan, X., and Yang, X. (2016). A new finite element model of buried steel pipelines crossing strike-slip faults considering equivalent boundary springs. Eng. Struct. 123, 30–44. doi: 10.1016/j.engstruct.2016.05.042
Keywords: offshore lifelines, pipelines and cables, route optimization, geohazards, finite element analysis, geographic information system
Citation: Makrakis N, Psarropoulos PN, Chatzidakis D and Tsompanakis Y (2020) Route Optimization of Offshore Lifelines Taking Into Account Potential Earthquake-Related Geohazards. Front. Built Environ. 6:112. doi: 10.3389/fbuil.2020.00112
Received: 06 March 2020; Accepted: 17 June 2020;
Published: 14 July 2020.
Edited by:
Eleni N. Chatzi, ETH Zürich, SwitzerlandReviewed by:
Michalis Fragiadakis, National Technical University of Athens, GreeceYou Dong, The Hong Kong Polytechnic University, Hong Kong
Vagelis Plevris, OsloMet – Oslo Metropolitan University, Norway
Copyright © 2020 Makrakis, Psarropoulos, Chatzidakis and Tsompanakis. This is an open-access article distributed under the terms of the Creative Commons Attribution License (CC BY). The use, distribution or reproduction in other forums is permitted, provided the original author(s) and the copyright owner(s) are credited and that the original publication in this journal is cited, in accordance with accepted academic practice. No use, distribution or reproduction is permitted which does not comply with these terms.
*Correspondence: Yiannis Tsompanakis, anRAc2NpZW5jZS50dWMuZ3I=