 Y. Edward Zhou1*
 Mark R. Guzda2*
- 1Bridge Instrumentation & Evaluation Lead, North America, AECOM, Germantown, MD, United States
- 2Bridge Engineer, AECOM, Hunt Valley, MD, United States
Load ratings of the 1967 built I-195 westbound bridge over Seekonk River in Rhode Island are governed by shear at the dapped ends of prestressed concrete (PSC) girders. Insufficient analytical load ratings, in combination with visible shear cracks at the dapped ends, prompted the need for a refined method of load rating through load testing. The proof load testing method was chosen over diagnostic testing for a higher level of reliability due to uncertainties involved in calculating shear capacities of the dapped ends. A proof load test was successfully completed with a maximum proof load of two test trucks of approximately 100,000 lbs each crossing the bridge side-by-side without any signs of distress or non-linear behavior observed. Vehicle loading dynamic impact was also assessed during the load test. Test measurements indicated full composite action between the bridge deck and the PSC drop-in girders, which was not accounted for in the analytical rating of the dapped ends. Test results suggested that the strut-and-tie and shear-friction analysis methods underestimate the shear resistance of the dapped ends by considering only the stirrup reinforcement and draped prestressing strands within the PSC girder. This paper provides detailed information on bridge proof load testing in general concept and procedure, comparisons with the diagnostic load testing method, field operation, examination of test measurements for linear elastic structural behavior, and determining bridge load ratings based on test results per The Manual for Bridge Evaluation of AASHTO.
Introduction
The I-195 westbound (WB) bridge over Seekonk River in Providence, Rhode Island was built in 1967 and consists of 13 prestressed concrete (PSC) girder spans and five steel plate girder spans. The bridge carries five traffic lanes before an exit ramp and four traffic lanes plus a full-width right shoulder after the exit ramp. The superstructure of the PSC spans is of the cantilevered and drop-in girder construction and consists of six lines of girders equally spaced at a distance varying from 13 ft in the five lane section to 11.4 ft in the four lane section. The drop-in girders are the PSC Type IV AASHTO girders with dapped ends resting on elastomeric bearings at the end of the cantilevered girder sections.
Figure 1 shows a typical PSC girder span of the I-195 WB bridge, which has a reinforced concrete arch wall on each side as an aesthetic feature. In the photograph, the arch span at the lower-left corner in the background is an exit ramp, and the steel girders at the upper-right corner in the foreground are part of the I-195 eastbound (EB) bridge. Load ratings of the PSC girder spans were found to be governed by shear at the dapped end of the drop-in girders. Figure 2 is a close-up view of the drop-in girder dapped end supported by a cantilevered girder section from the pier. Figure 3 is from the 1967 bridge plans depicting the drop-in section of the PSC girders including the path of deflected prestressing strands as well as reinforcing details at the dapped end.

Figure 1. Overview of a typical PSC girder span of I-195 WB bridge over Seekonk river.
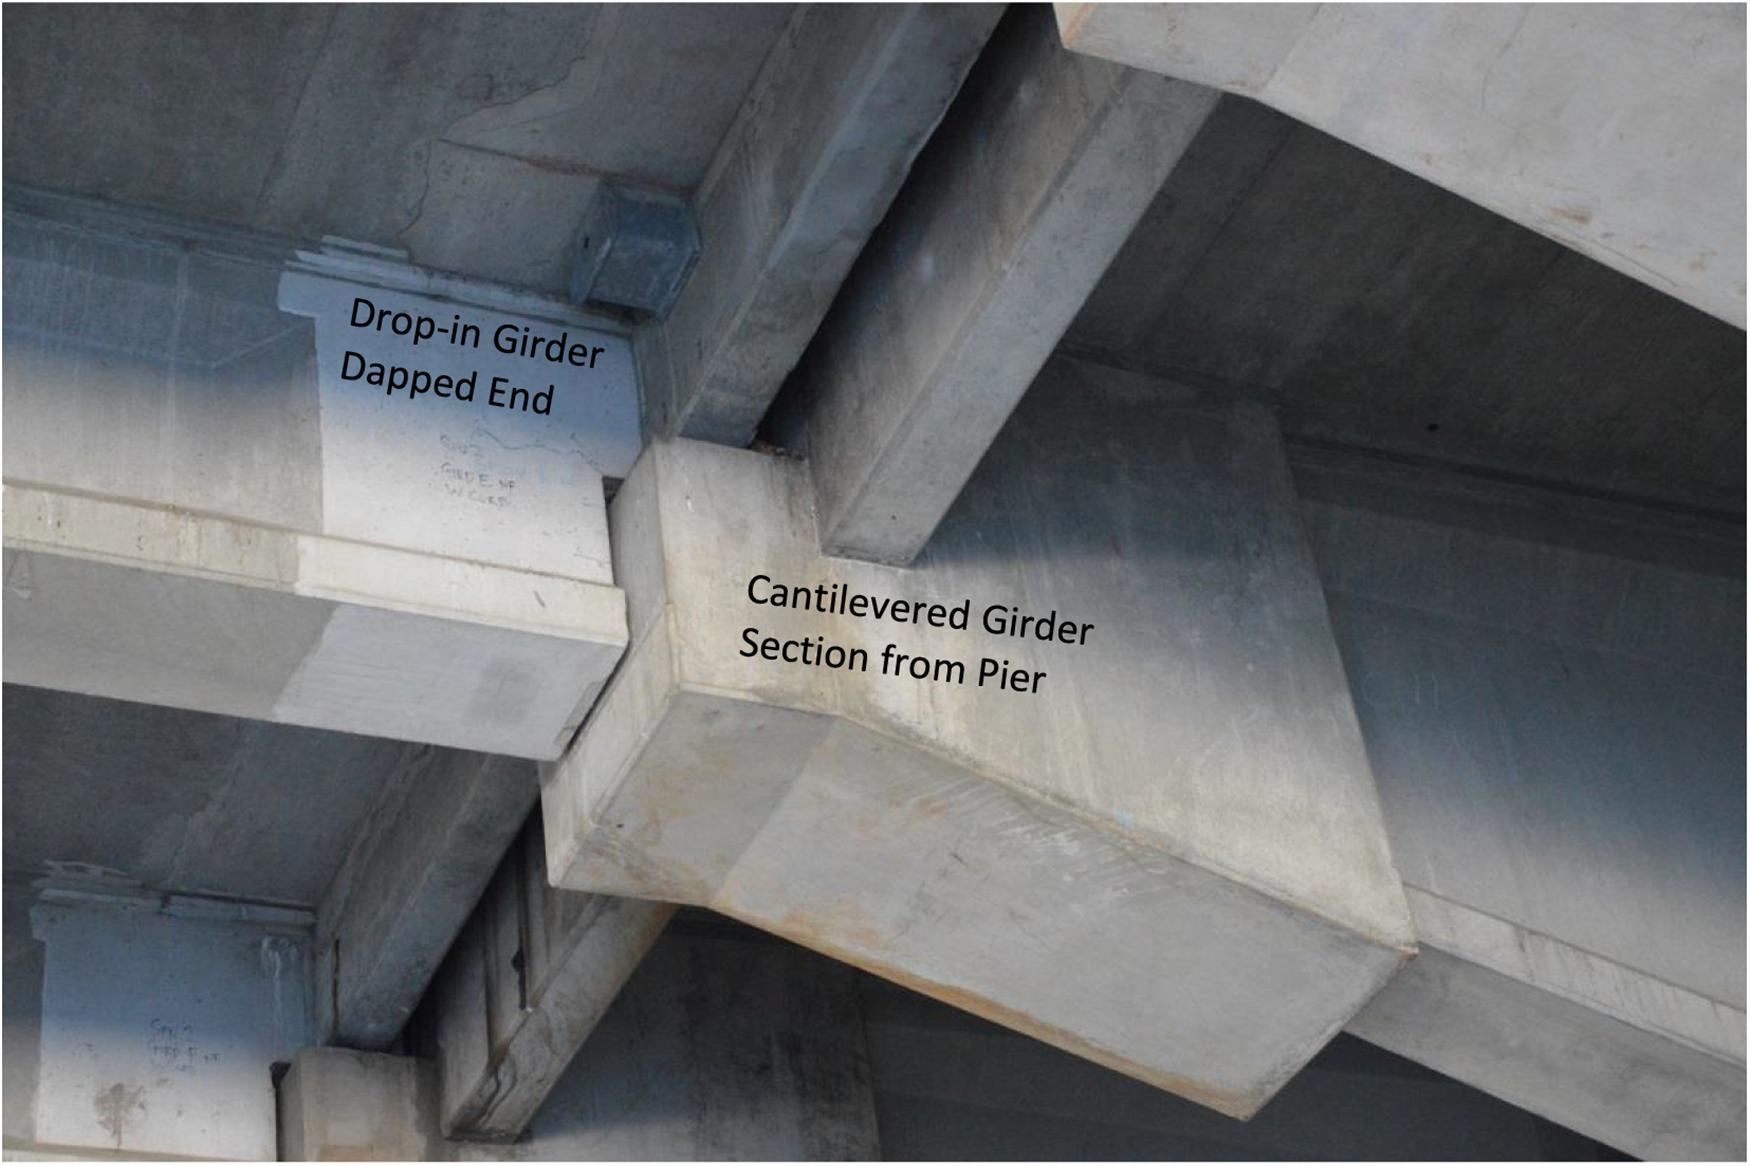
Figure 2. Dapped end of drop-in girder supported by cantilevered girder section from pier.
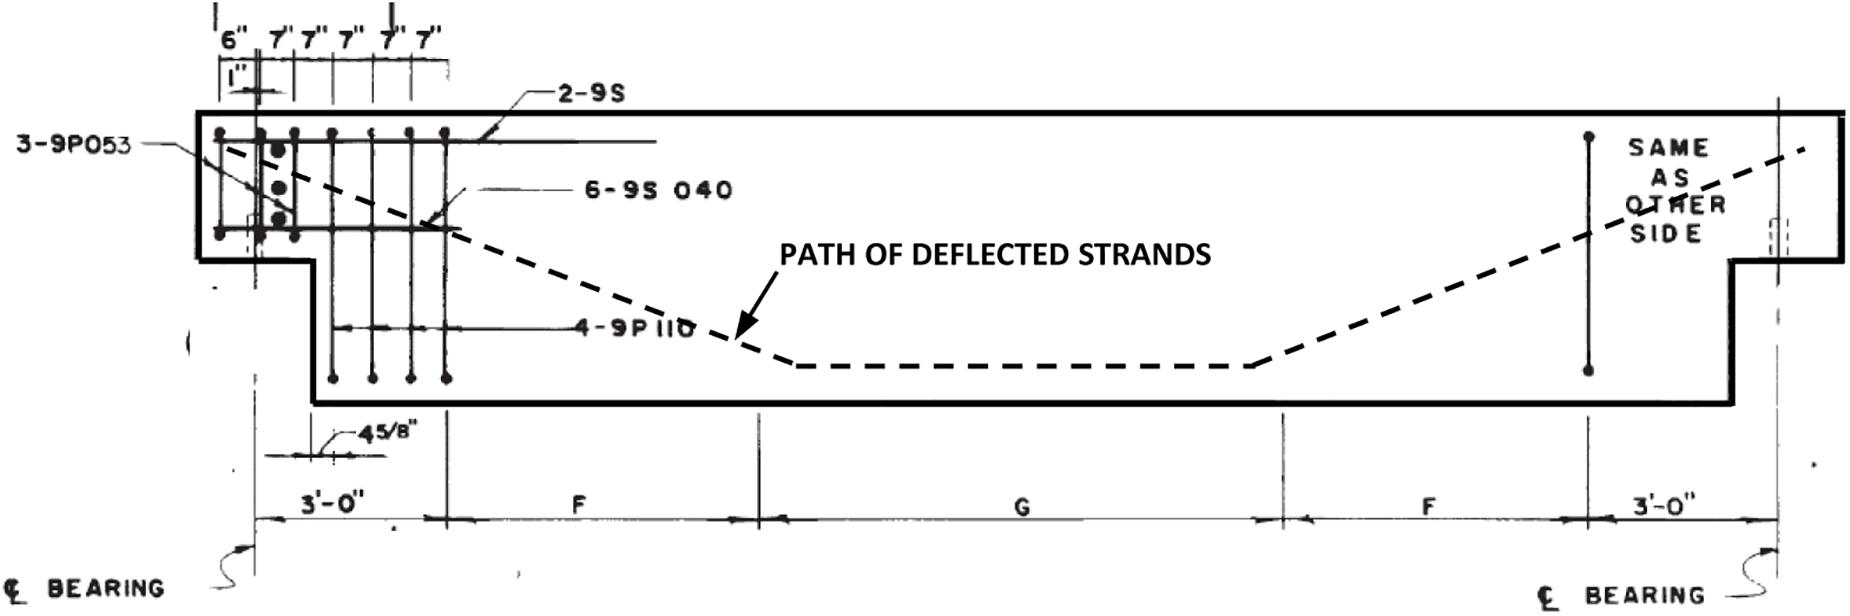
Figure 3. Reinforcing details at dapped end and prestressing strand path of drop-in girder.
Analytical load ratings for the dapped ends were calculated significantly insufficient for most rating vehicles from the strut-and-tie and shear friction analysis methods with the shear capacity based on the resistances from the stirrup reinforcement and draped prestressing strands within the PSC girder. Diagonal concrete cracks initiated from the re-entrant corner of the dapped end have been observed in multiple girders. However, no correlations were found between the degree of field observed diagonal cracking and the level of analytical load effects at the dapped ends. The insufficient analytical load ratings, in combination with the apparent shear cracks observed at the dapped ends, prompted the need for a refined method of load rating through load testing. The bridge has been carrying interstate highway loads without any weight restrictions.
Selection of Load Testing Method
Load ratings measure a bridge’s load carrying capacity for specific loading vehicles in addition to its self-weight. Bridge load ratings are defined with different levels of reliability in AASHTO’s The Manual for Bridge Evaluation (MBE) (AASHTO, 2018) and provide a basis for decisions on weight posting, overweight vehicle permits, and structural strengthening or replacement. Engineering experience indicates that the conventional methods of analysis may yield overly conservative load ratings in some circumstances. Load testing has proven to be a reliable and efficient method for determining more accurate load ratings that reflect the actual structural behavior and physical condition of the bridge (TRB, 1998; TRB, 2019). Field measurements help identify inherent mechanisms that assist in carrying live load, such as unintended composite actions between primary load-carrying members (girders, trusses, arch ribs, etc.) and secondary components (deck, flooring frames, barriers, etc.). Load test results also provide quantitative measurements for actual live load distribution among multiple structural elements as well as the effects of in situ conditions of connections and supports.
The AASHTO MBE prescribes two load testing methods for bridge load rating purposes: the diagnostic load test and the proof load test. Diagnostic load testing determines the actual responses of key structural components, generally in terms of measured strains and deflections, to known test loads. An analytical model is usually established based on best available information and compared with the load test results. After being adjusted and validated with test results, the analytical model is used to assess the maximum load effects of dead load and all required rating vehicles. In order to calculate refined bridge load ratings through a diagnostic load test, member capacities must be quantified based on section and material properties per construction documents, field measurements, or through in situ material testing.
Alternatively, proof load testing physically proves the bridge’s ability to carry its full dead load plus some magnified live load. Test loads are applied to the bridge in a multiple-step loading and unloading process in a progressively increasing manner toward a predetermined target proof load. The target proof load is established to be sufficiently higher than the rating vehicles in order to include a live load factor for the required margin of safety and to account for the effects of dynamic impact. During each loading and unloading step, key responses of the structure are measured and monitored for possible signs of distress or non-linear-elastic behavior. Upon successful completion of a proof load test, the highest applied load provides a lower bound on the true strength capacity, which leads to a lower bound bridge load rating after incorporating proper load factors and dynamic load allowance.
Compared with diagnostic load testing, proof load testing requires a reduced level of structural analysis without the necessity for calculating section capacities or the maximum force effects of dead and live loads. The direct result from a proof load test is to conclude whether the rating factor for a specific vehicle type (the test vehicle) exceeds 1.0 at the Operating level of reliability, which is lower than the Inventory level of reliability as in bridge design. Load ratings for other vehicle types can be determined from a simple structural analysis by comparing the governing force effects of the rating vehicles with those of the test vehicle. Despite having been available for over two decades (Fu and Tang, 1995; TRB, 1998), the proof load testing method still lacks a definitive procedure for interpreting and translating the test results into bridge load ratings (Lantsoght et al., 2017; Lantsoght, 2019; TRB, 2019).
For the I-195 WB bridge, proof load testing was chosen over diagnostic testing for a higher level of reliability because calculating the shear capacity of the dapped end involves multiple uncertainties including quantification of the contributions of vertical and horizontal reinforcing bars as well as prestressing strands at the dapped end, effects of existing cracks, etc. Additionally, the effect of the reinforced concrete bridge deck in distributing and resisting shear at the dapped end is difficult to quantify in any analytical model.
Instrumentation Plan
One span (Span 2) was chosen for load testing to represent all 13 PSC girder spans of the bridge that have similar analytical load ratings. The selected span has easy access from the ground and was representative of the worst condition in diagonal cracking and concrete spalling at the dapped end throughout the bridge. Figure 4 depicts the instrumented span including the layout of 32 strain sensors in the plan view and cross section view. Of these strain sensors, 26 measure the effects of shear at the dapped end of all six (6) drop-in girders (four on each east end of all six girders and two on west end of Girder F), four (4) measure the effects of flexure at the mid-span of Girders E and F, and two (2) measure the effects of flexure near the east end of Girder F.
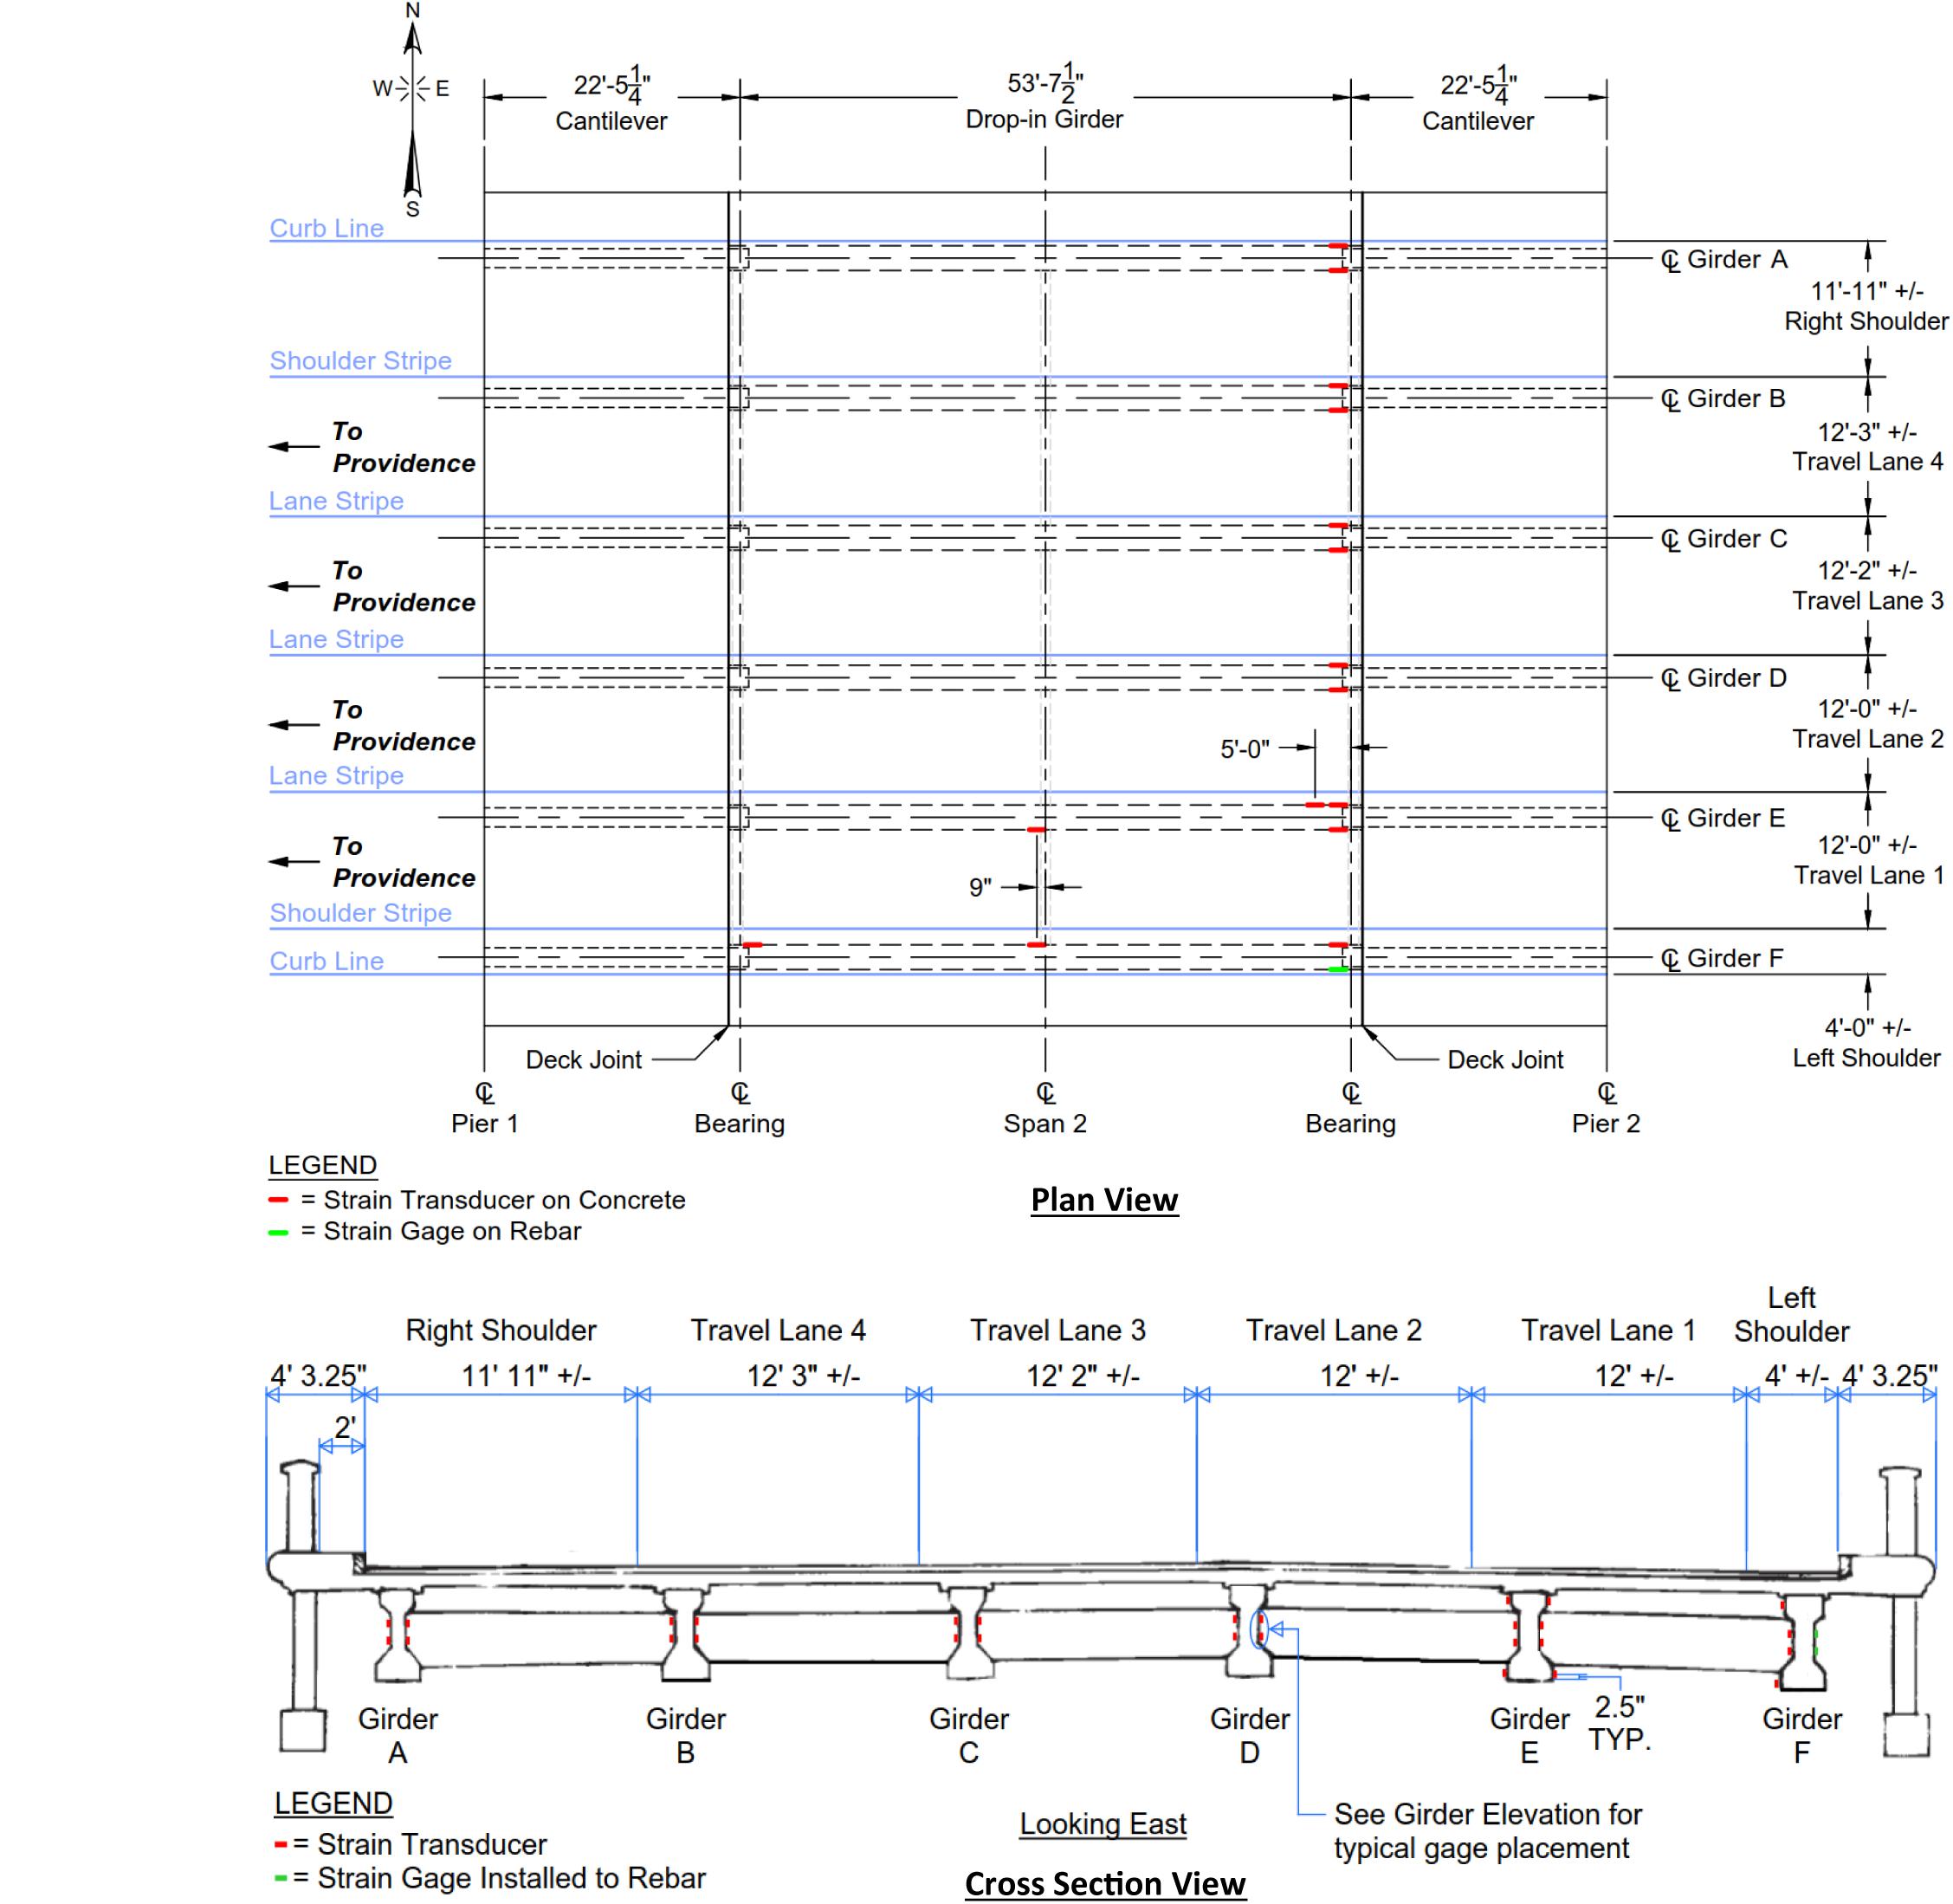
Figure 4. Layout of 32 strain sensors on six drop-in girders.
Placement details of strain transducers on concrete surface for shear at the dapped end are described in Figure 5, along the compression and tension diagonals at a 45-degree angle, respectively. Strain transducers installed along the compression diagonal had a 3′′ gage length, while those along the tension diagonal were extended to a 12′′ or 15′′ gage length to span over any existing cracks or spalls. The east end of all six (6) drop-in girders were instrumented with two (2) strain transducers for shear on each side of the web, with the exception of the south face of Girder F, which had two (2) weldable strain gages installed to exposed steel reinforcement as shown in Figure 6. The west end of Girder F was also instrumented with two (2) strain transducers for shear on its north web surface only.
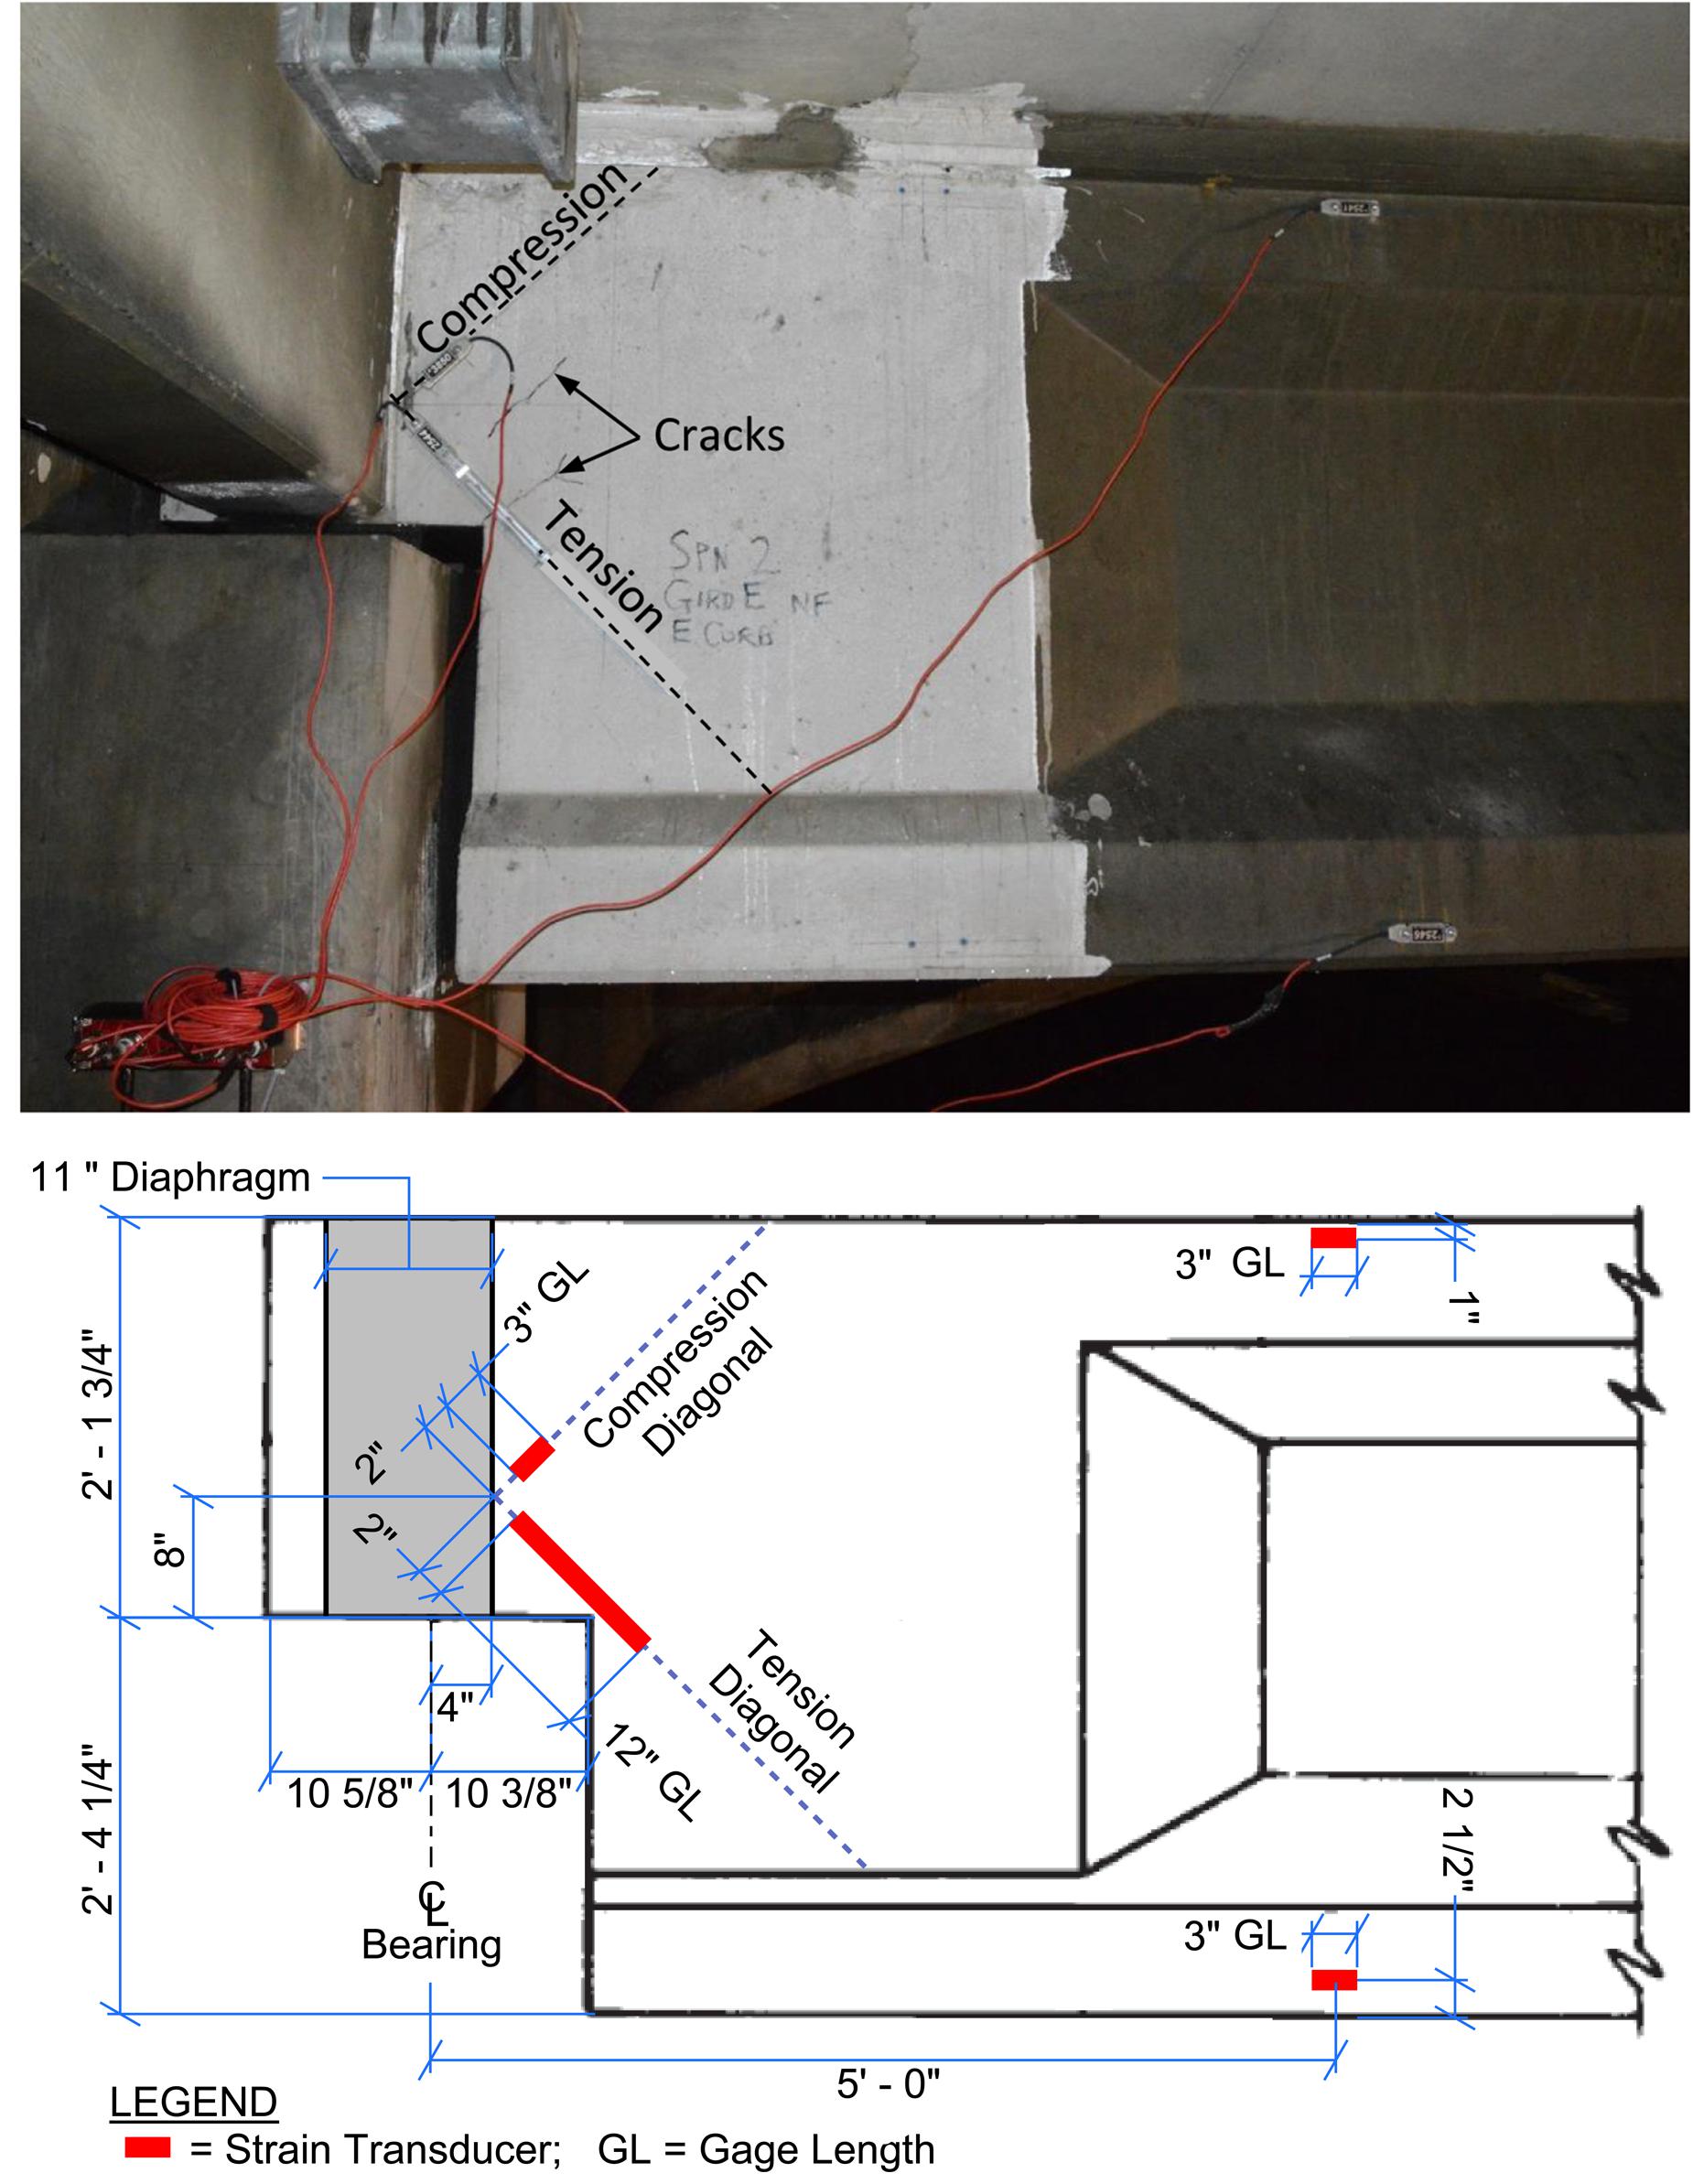
Figure 5. Strain transducers on concrete surface at dapped end.
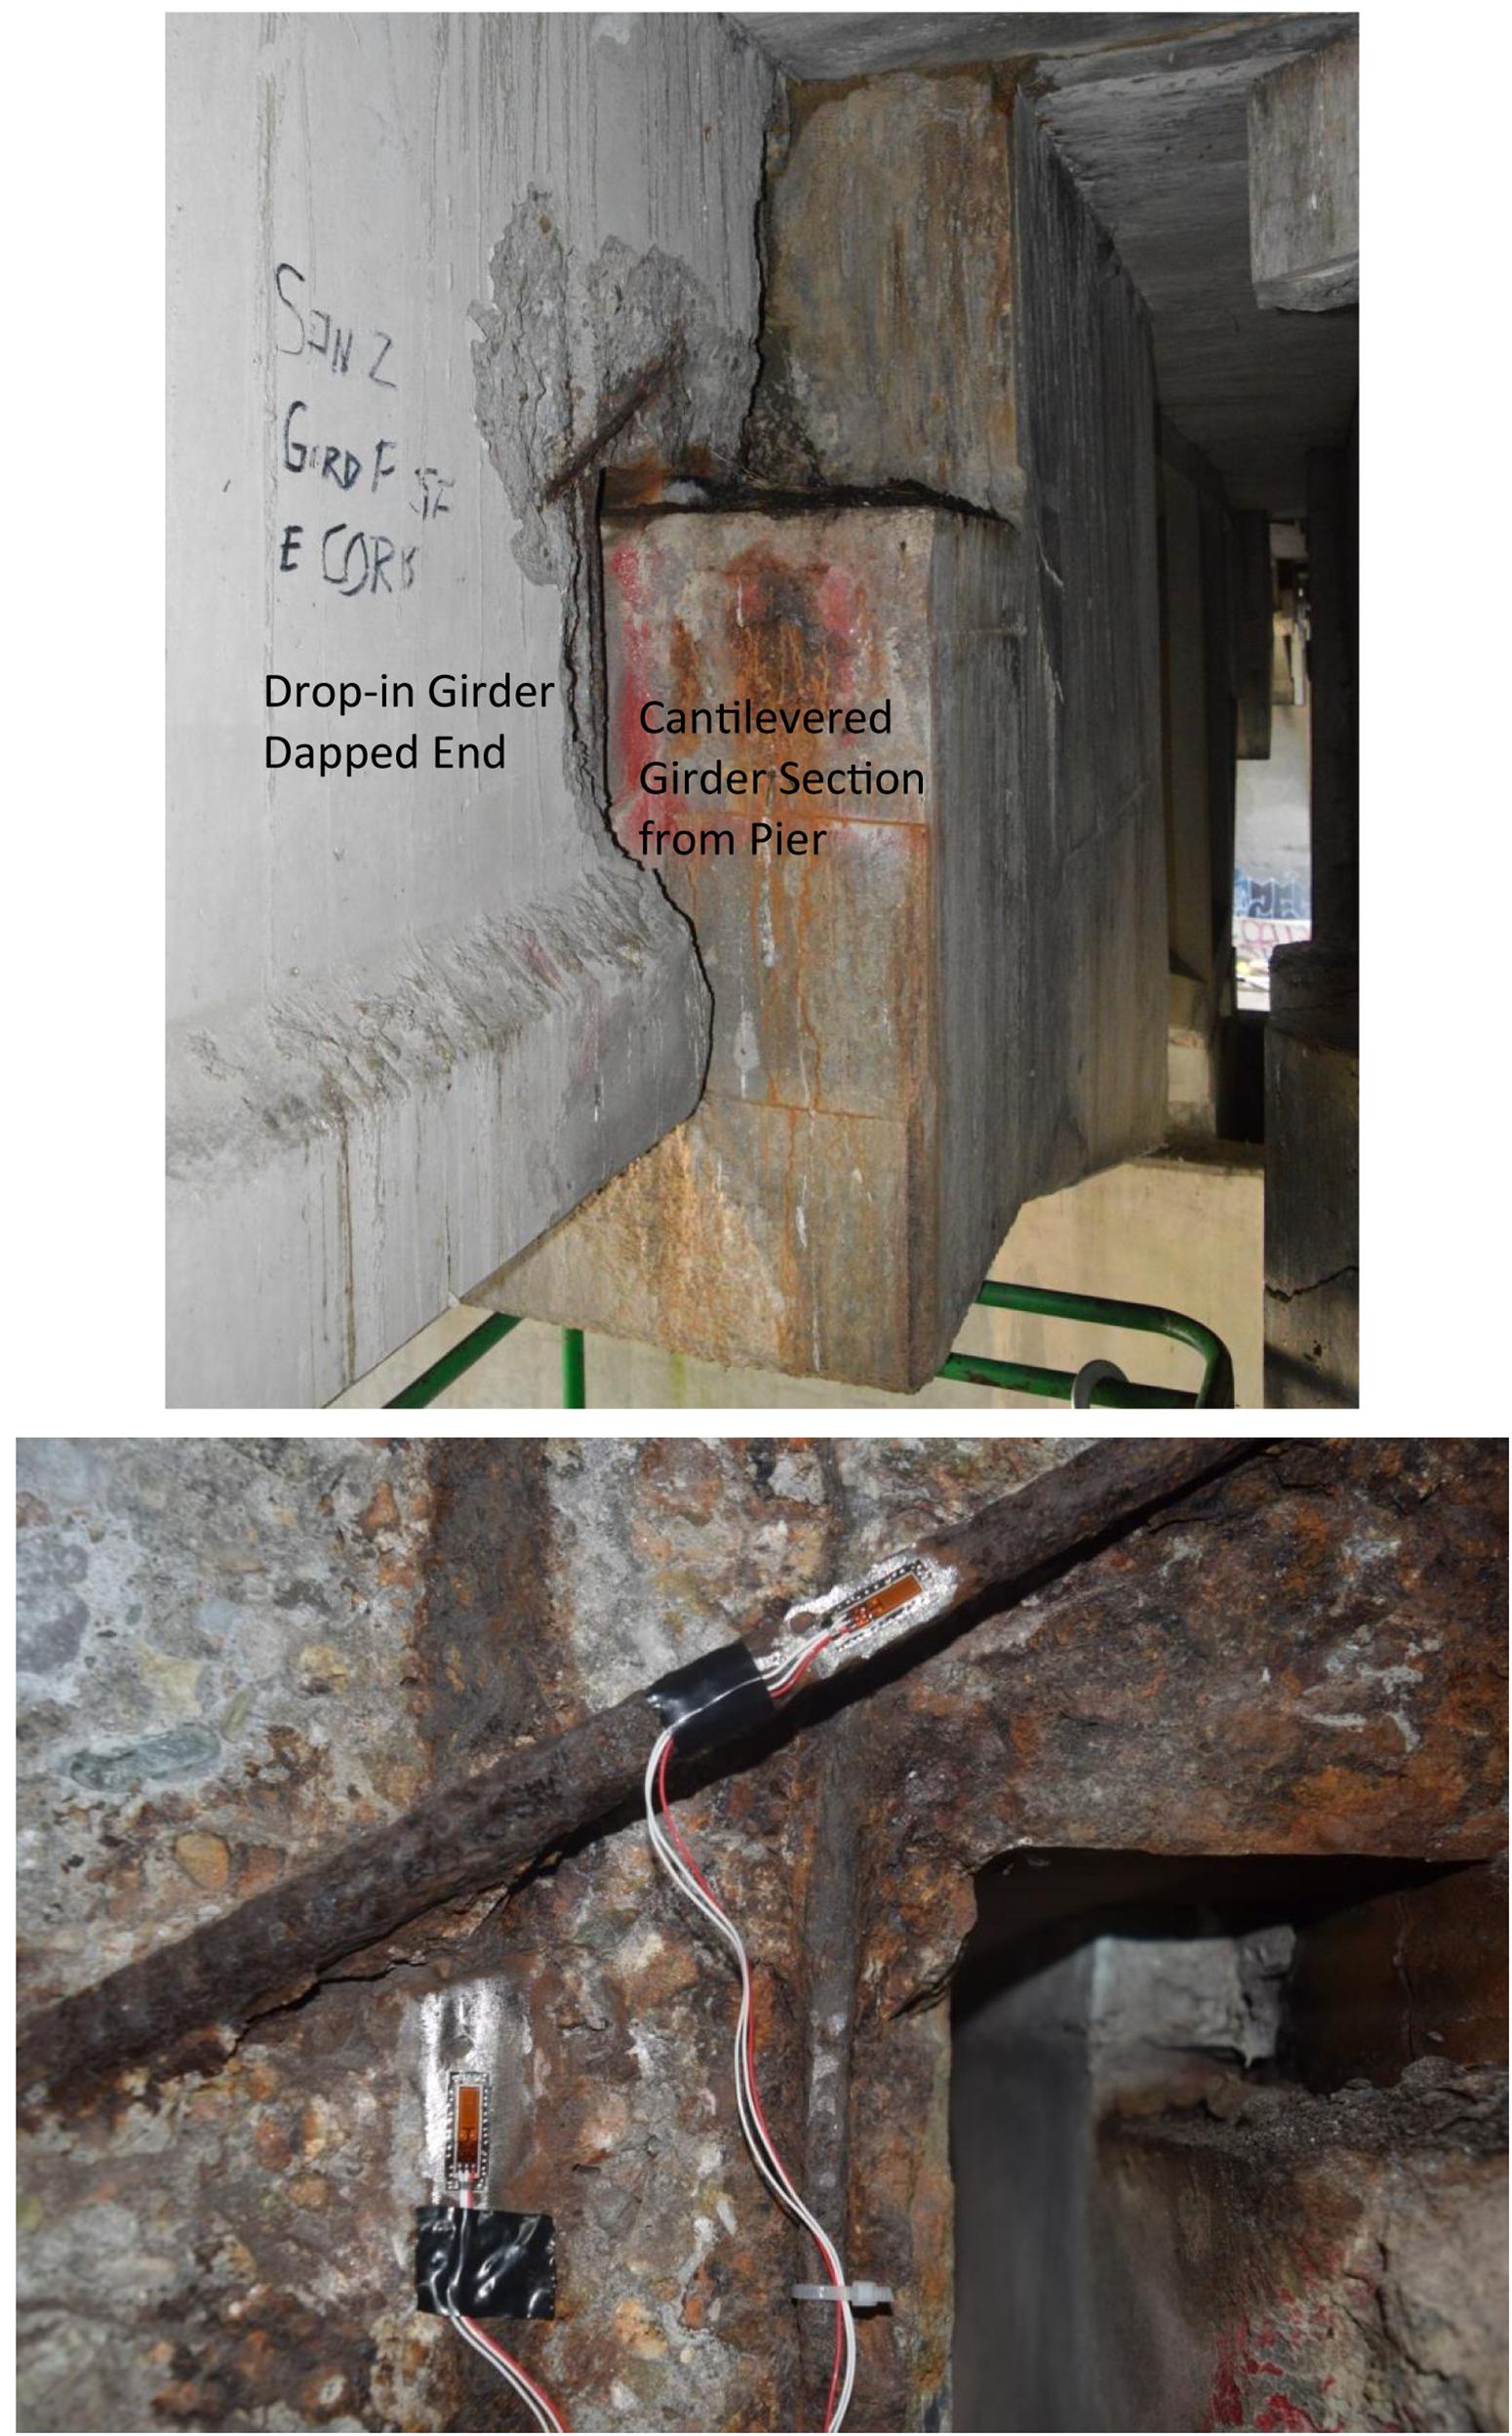
Figure 6. Weldable strain gauges on exposed rebars at dapped end.
Strain transducers on concrete surface for flexural effects were installed to the top and bottom flanges of drop-in Girders E and F near the mid-span, as shown in Figures 4, 7. Girder E was also instrumented with two strain transducers on the top and bottom flanges near its east end, at 5′-0′′ (greater than the girder depth) from the centerline of bearing as shown in Figure 5. These sensors provide information for assessment of the deck-girder composite action at a high shear location in addition to flexural strains in the PSC girders. All sensors were connected to a wireless digital data acquisition system that records sensor responses and allows real-time review of test results during the load test.
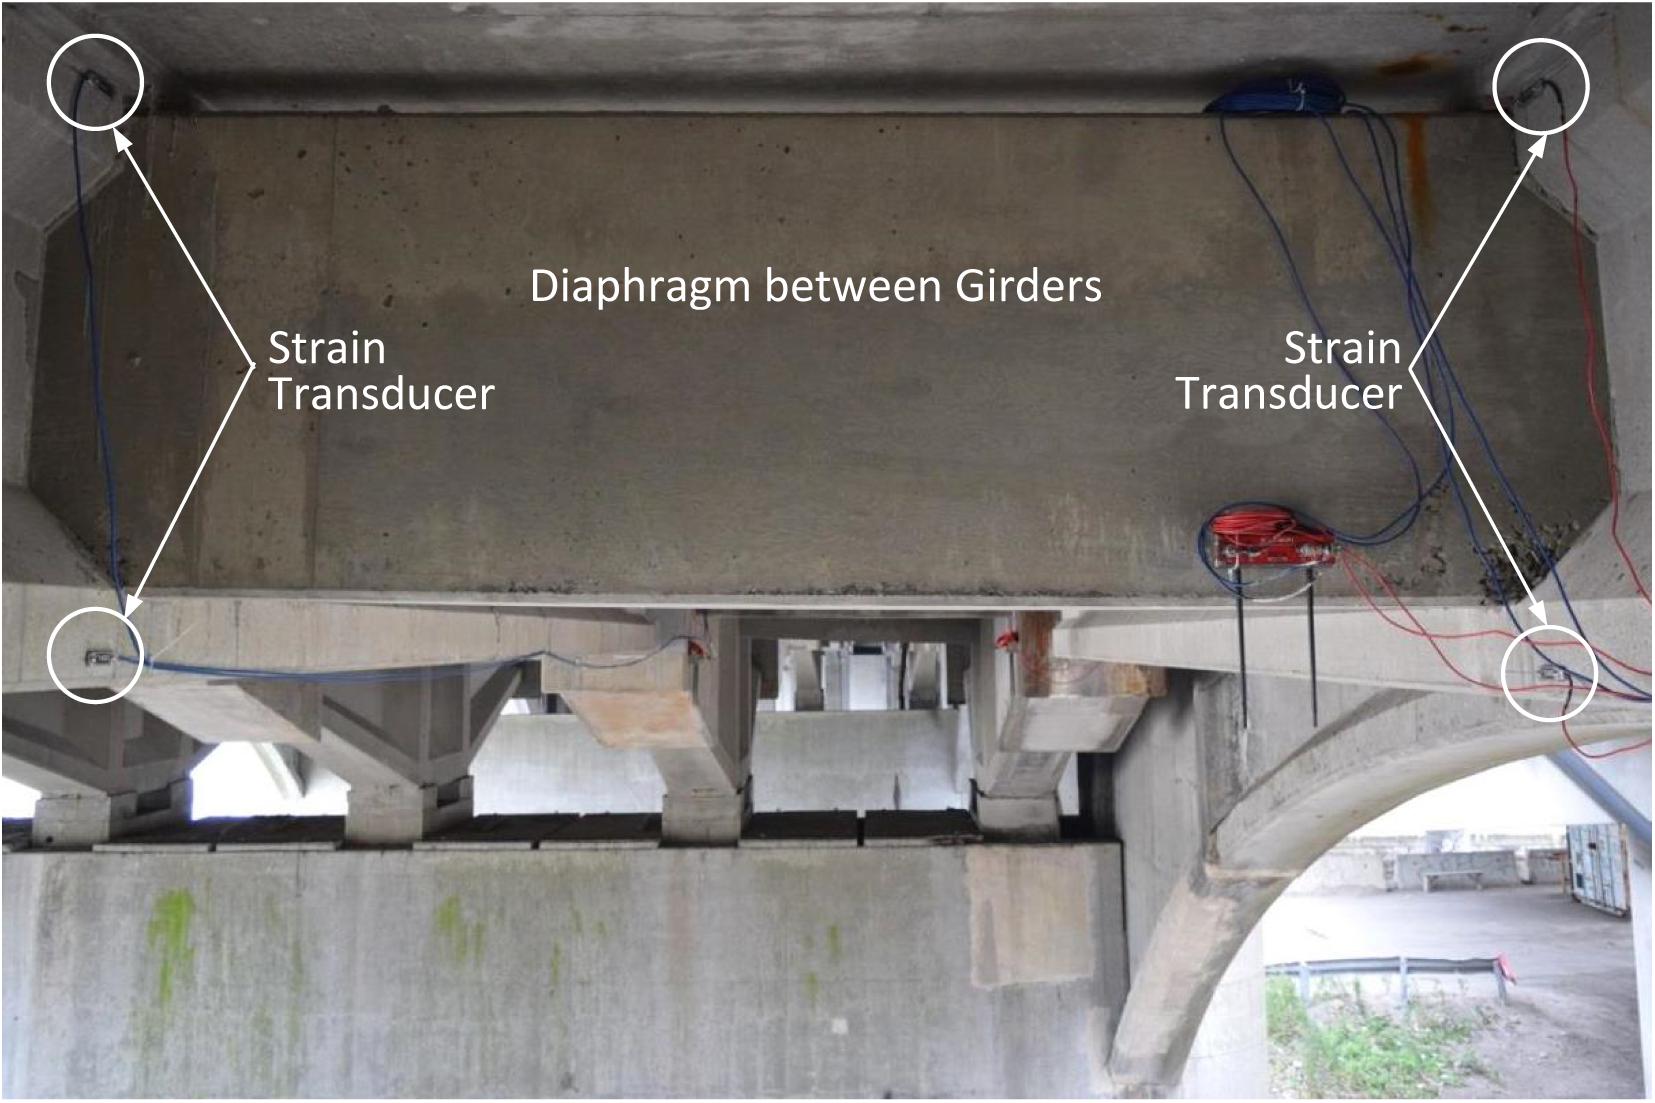
Figure 7. Strain transducers on top and bottom flanges of drop-in girder at mid-span.
Target Proof Load
The target proof load needs to be sufficiently high to appropriately encompass an evaluation live load factor (γLL) and a dynamic load allowance (IM) for load rating. The Manual for Bridge Evaluation (MBE) (AASHTO, 2018) specifies the values of γLL that vary with the method and level of bridge load rating. Different load rating methods include the Load and Resistance Factor Rating (LRFR), Load Factor Rating (LFR), and Allowable Stress Rating (ASR). LRFR includes Design load rating at the Inventory and Operating levels, as well as Legal load rating and Permit load rating. LFR and ASR each includes load ratings at the Inventory and Operating levels. It is important to note that proof load testing should only be expected to verify a lower bound load rating at the LRFR Design Operating, Legal or Permit level, or the LFR Operating level.
The MBE (AASHTO, 2018) prescribes the following for establishing the target proof load (LT):
where:
XpA = adjusted target live load factor.
LR = comparable unfactored live load due to the rating vehicle for the lanes loaded.
IM = dynamic load allowance.
In accordance with the MBE, the target live load factor (Xp) has a base value of 1.40 but should not be less than 1.3 or more than 2.2 after adjustments (XpA) considering the number of loaded lanes, structural redundancy, presence of fracture critical details, in situ condition, average daily truck traffic (ADTT), etc. (AASHTO, 2018). Values of the adjustments provided were calibrated to provide a comparable level of reliability as the calculated load capacity.
In LRFR Legal load rating, the generalized live load factor (γLL) for the Strength I limit state is 1.30 for ADTT ≤ 1,000 and 1.45 for ADTT ≥ 5,000 in one direction. The γLL values account for multiple-presence of two heavy trucks side-by-side on a multi-lane bridge as well as the probability of truck weights exceeding the legal limits. If warranted, γLL may be increased by a multiplier of up to 1.3. If the purpose of the test is solely to verify a rating for a permit load, Xp may be reduced in correspondence with the permit load factors that range from 1.10 to 1.40 (AASHTO, 2018).
It must be noted that the LT or LR used in the AASHTO MBE for prescribing the target proof load is the force effect governing the bridge load rating. For a bridge proof load test using vehicles for load application, the test load needs to be defined by the type and number of test trucks to be used, their initial and target weights, as well as their weight increases and combinations during the multiple-step loading and unloading process.
For this bridge, the maximum shear force (Vmax) at the dapped end of the drop-in girder was used as the key parameter to establish the target proof load since it governs the bridge load rating. Table 1 lists the Vmax in the 53′-71/2′′ test span from a simple beam analysis for the HL93 design truck plus eight (8) different legal vehicles for load rating. Among the legal vehicles, the SU7 vehicle (SU7) produces the highest Vmax of 58.76 kips, which is very close to (98.81% of) that of the HL93 design truck (59.47 kips).
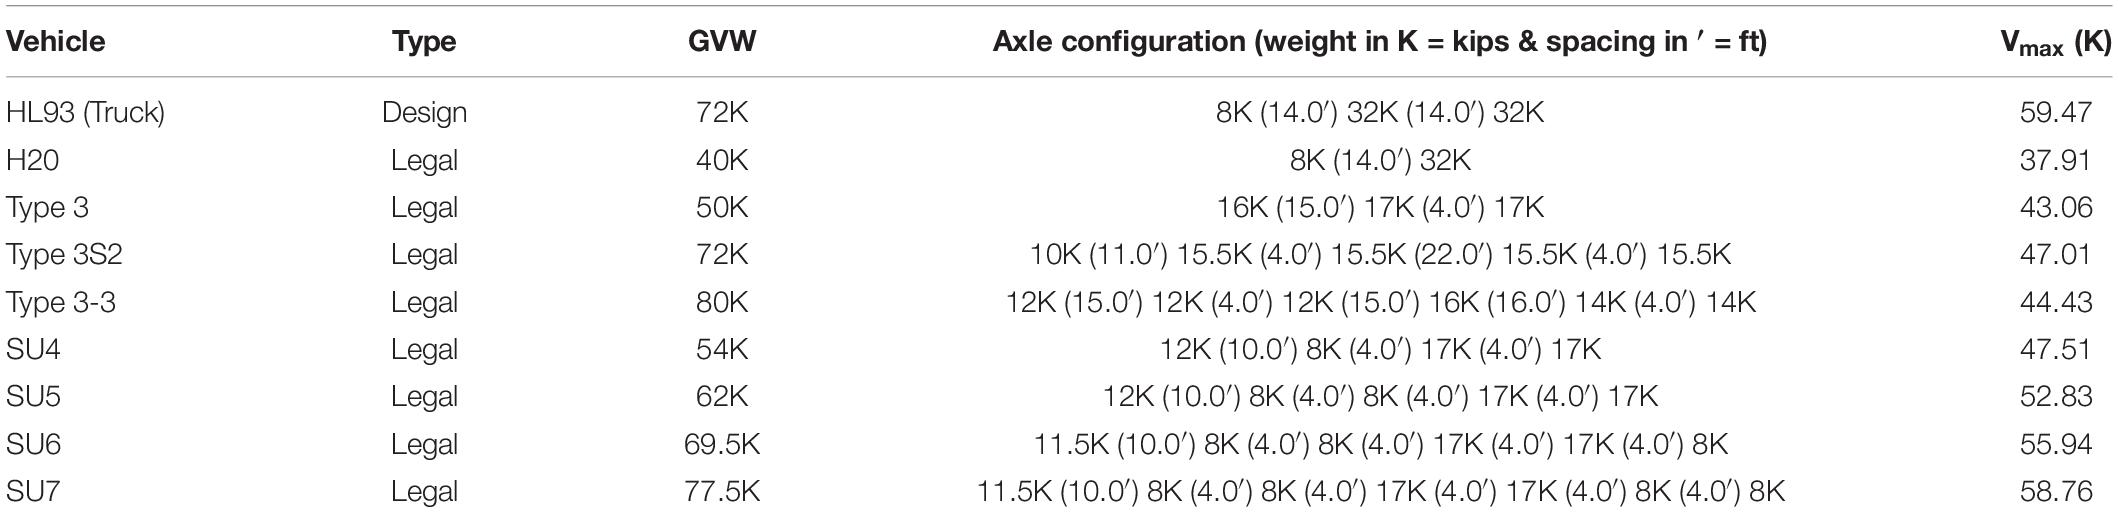
Table 1. Maximum shear force (Vmax) in a 53′-71/2′′ simple span due to different rating vehicles.
Two three-axle dump trucks were chosen for the proof load testing based on the availability of test vehicles as well as the span length (53′-71/2′′) and girder spacing (12′-3′′) of the concerned structure where load rating is governed by shear at the dapped end. The axle configurations of the test trucks are similar to, but slightly longer than, the AASHTO Type 3 vehicle (Type 3). Therefore, Type 3 was used to estimate the target weight of the test vehicles.
Based on Table 1, the gross vehicle weight (GVW) of Type 3 for producing an equivalent maximum shear due to SU7 is: (58.76K/43.06K) (50K) = 68.23K. Using the 1.40 base value of the target live load factor (Xp) without dynamic load allowance, the target proof weight for Type 3 is: (1.40) (68.23K) = 95.52K. This was used as the approximate target weight for the test vehicles due to their similarity to Type 3. It should be realized that the wheel and axle weights of a truck for a GVW vary with the loading material and equipment employed, and cannot be predicted beforehand.
Proof Testing Procedure and Operation
A detailed proof load testing procedure was developed for applying test loads in a progressively increasing manner aiming to accomplish the target proof load. The test plan considered: a) applying direct and similar test loads to each of the six girders in the instrumented span; b) at each truck weight level, running multiple single truck and two-truck side-by-side crossings at varying lateral positions for different load effects; c) repeating the same crossing patterns at all weight levels, and d) when possible, making pairs of slow speed and highspeed runs using the same truck at the same lateral position for assessing dynamic impact. Measures were also prepared for aborting the load test at any intermediate step if deemed necessary based on possible signs of distress or non-linear behavior. In addition, deliberate considerations were given to safety as well as operation issues such as maintenance of traffic, entrance and exit points on the interstate highway for the test trucks, etc.
The proof load test consisted of 44 test runs using two test trucks at four (4) different weight levels as shown in Figure 8. The actual truck weights at the highest weight level ended up to be 101.72K and 100.38K, slightly higher than the target proof load of 95.52K for Type 3.
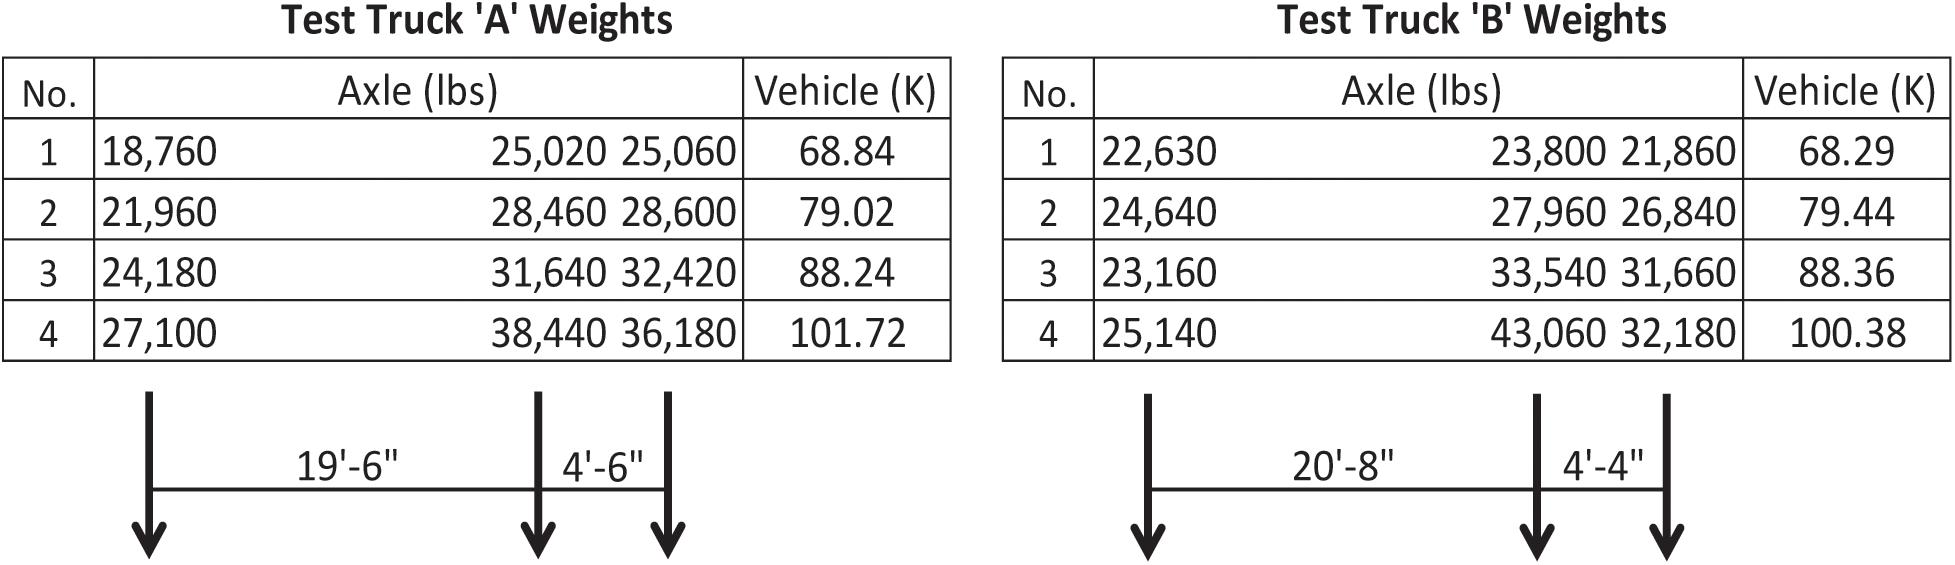
Figure 8. Test trucks axle configurations and weights at four different levels.
The 44 test runs included 13 each at weight levels No. 1 (WL#1) and No. 2 (WL#2), and nine (9) each at WL#3 and WL#4. Table 2 describes the 13 test runs at WL#2, including five (5) single truck crossings at a crawl speed (about 5 MPH), four (4) two-truck side-by-side crossings at a crawl speed, and four (4) single truck crossings at the speed limit (about 55 MPH). WL#1 had similar test runs as WL#2; WL#3 and WL#4 each had only the nine (9) crawl speed runs since highspeed runs at such weights are unsafe if even possible.
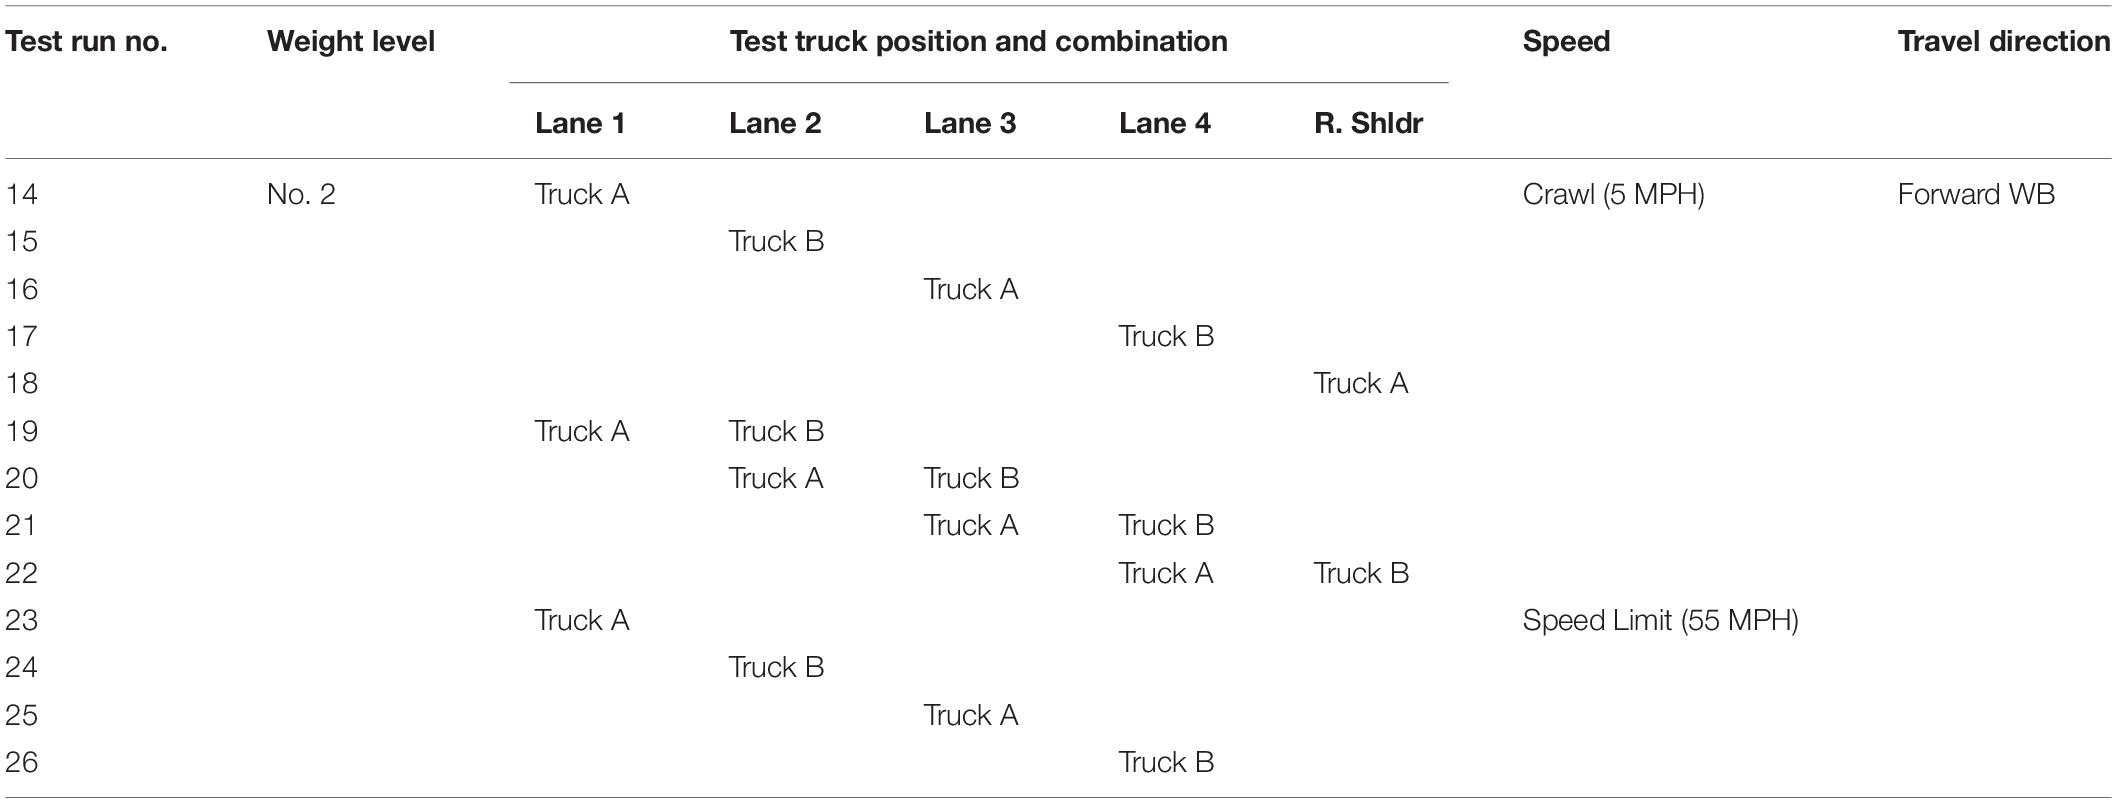
Table 2. Descriptions of 13 test runs at weight level no. 2 (WL#2).
The proof load test was performed in two consecutive nights between 10 PM and 4 AM. During the testing period in each night, the two left lanes of I-195 WB were closed to traffic and used as a staging area for the test trucks and the load testing staff for approximately one mile beyond each end of the test span. The two right lanes remained open except for during the test runs when the entire bridge was closed to traffic intermittently. Figure 9 depicts the load test operation including loading and weighing a test truck and running a single truck and a two-truck side-by-side test runs.

Figure 9. Photos of loading and weighing test trucks and operating test runs.
Upon completion of each test run, measurement results from all sensors were reviewed for magnitudes, linearity of strain increase vs. load increase, and zero turns. Visual observations were also made for possible signs of distress or condition changes.
Strain Responses vs. Increasing Test Load for Linear Elastic Behavior
For the purpose of investigating linear-elastic behavior of the PSC drop-in girders, results of the proof load test were plotted in terms of increasing test load vs. peak strain measurements from all the sensors for all test runs. Based on the sensor locations as depicted in Figures 4–7, strain responses include shear induced tension, shear induced compression, and flexure induced tension and compression. For the concerned dapped-end, measurements from strain sensors placed along shear induced tension diagonal were chosen as the parameter for capturing possible non-linear behavior or onset of failure due to shear. Figure 10 illustrates plots of total test load vs. peak strain along shear-induced tension diagonal at the dapped end for single truck and two-truck side-by-side test runs. The test load is represented in gross vehicle weight (GVW) in the left plot and tandem axle weight (TAW) in the right plot. In general, TAW requires separate examination for short spans with respect to the vehicle length and where key responses of concern, such as shear (or reaction) at the support, are sensitive to axle loads.
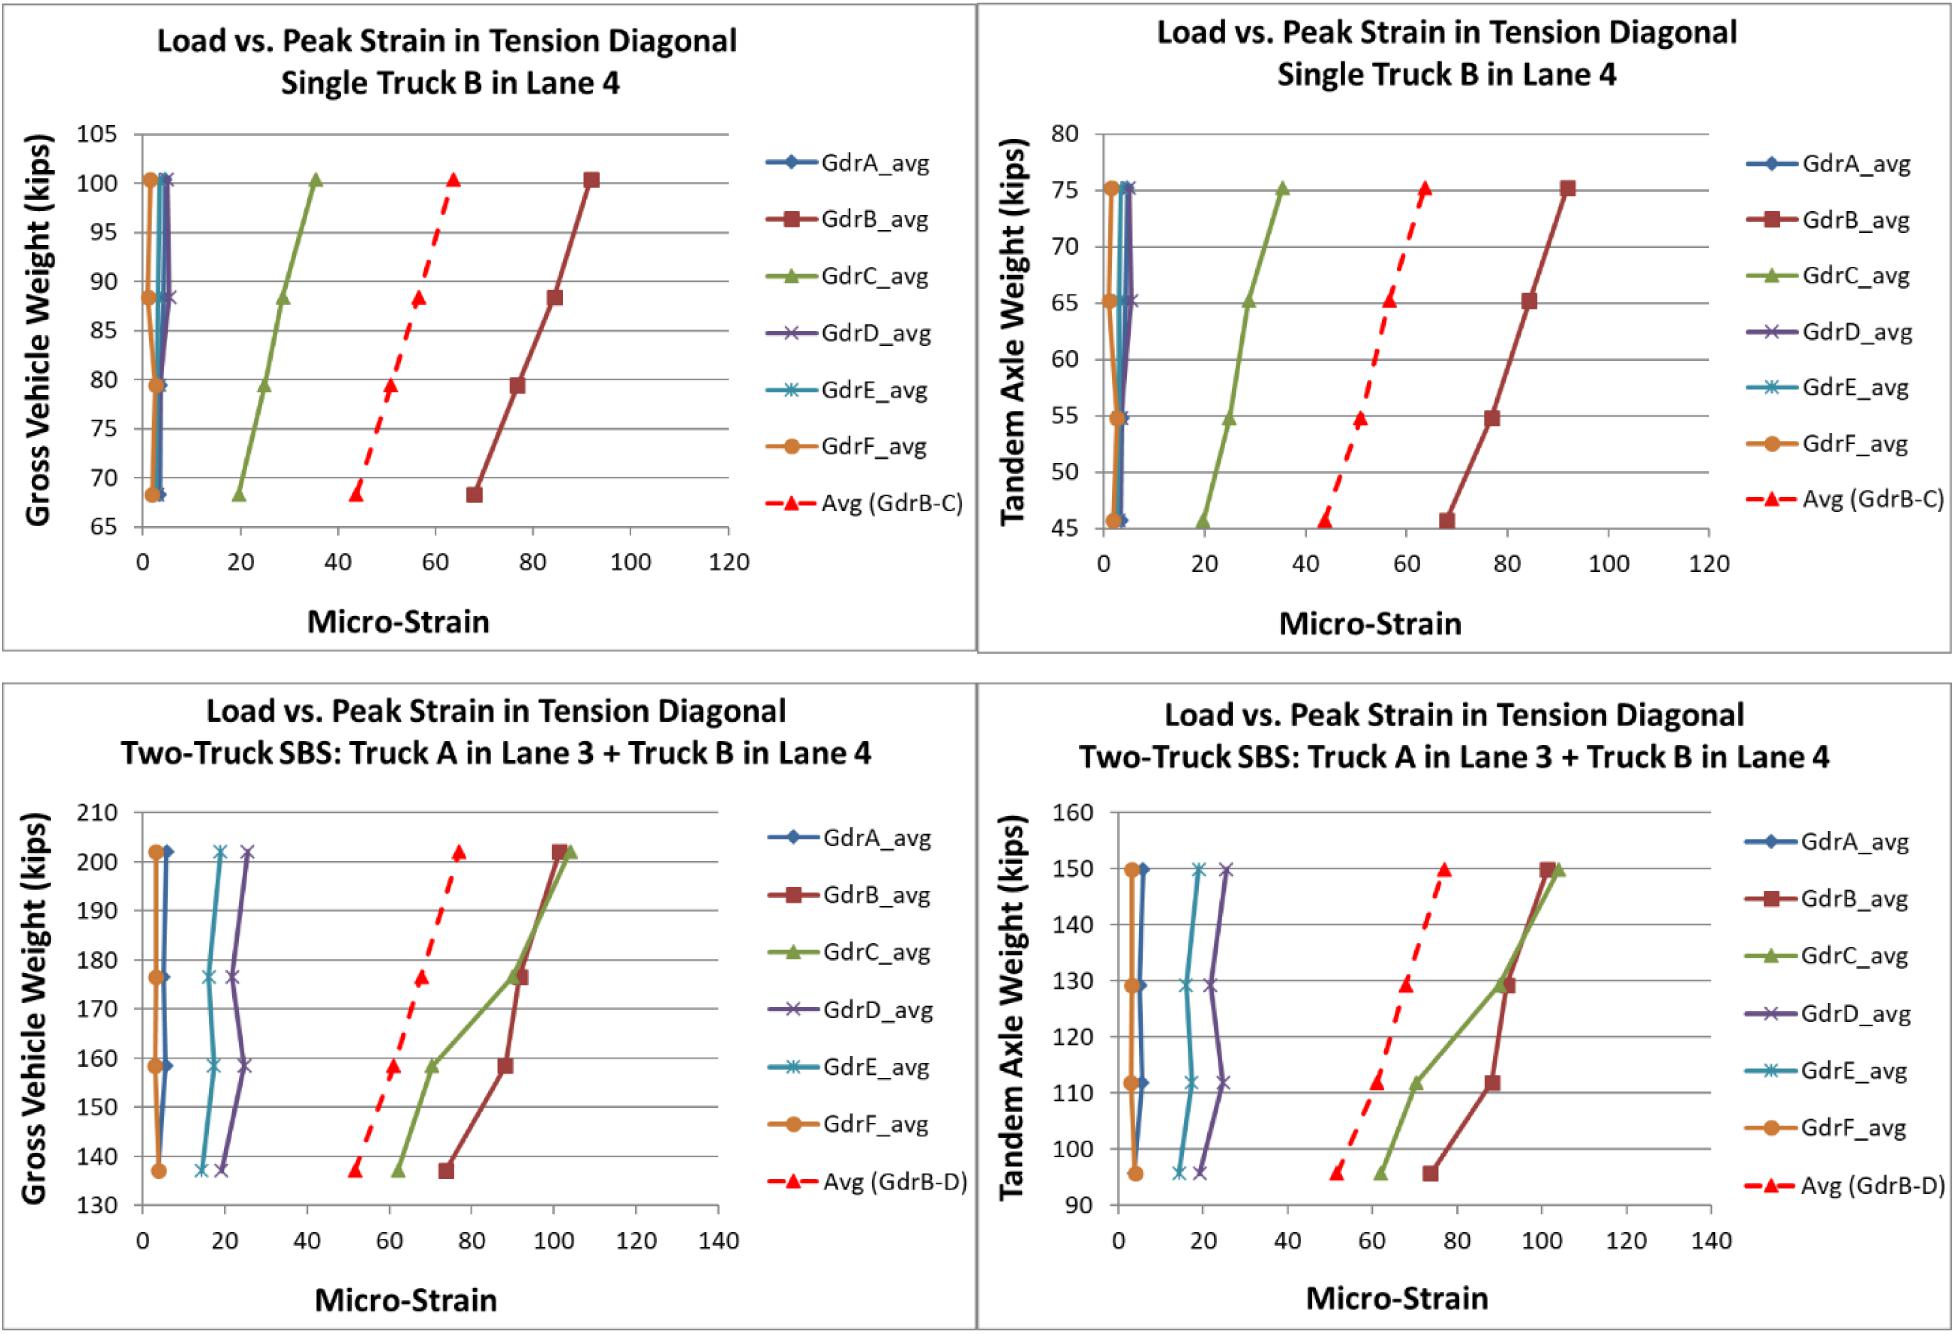
Figure 10. Load vs. peak strain in tension diagonal of dapped end: single truck B in lane 4 test runs (top) and two-truck side-by-side test runs, truck A in lane 3 & truck B in lane 4 (bottom).
In the load vs. response plots, the slope of the line between any two adjacent data points represents the girder stiffness in terms of load increase relative to strain increase. For linear-elastic structural behavior, strain responses are expected to increase linearly with load increase. Particular attention should be paid to any noticeable decrease of the slope with the increase of test load, as this may be an indication of structural stiffness decrease due to non-linear structural behavior, distress, or onset of failure.
In bridge field testing, the test vehicles actual lateral position may change slightly among comparable test runs at different weight levels. This results in slightly different load distribution among girders as reflected in some sensor plots in Figure 10, where the slope of the line changes between load increments. Lateral shifting of test vehicle position at different weights generally causes opposite slope changes in adjacent girders. Non-linear structural behavior or onset of failure would cause consistent slope decreases from multiple sensors which may worsen with further load increase. An effective method for canceling the effect of test vehicle lateral shifting is to plot an average response of multiple sensors mounted on adjacent girders directly under the test load. The red dashed lines in Figure 10 (Top) are the average of four strain sensors on both webs of Girders B and C; the red dashed lines in Figure 10 (Bottom) are the average of six strain sensors on both webs of Girders B, C and D. Each of the average plots clearly indicated linear response with increasing test load.
Confirmation of linear elastic structural behavior for a proof load test also requires examining the zero return of all sensors after each unloading and the magnitudes of strain and deflection measurements in comparison of material properties or analytical predictions. The strain time histories of all 44 test runs exhibited smooth and distinctive responses to the crossings of the test vehicles and their axles. All strain responses returned to zero after unloading at the end of each test run. The maximum measured strain was 198 micro-strain (corresponding to 798 psi for the concrete compressive strength of f′c = 5,000 psi) along the tension diagonal on the north face of Girder E during Test Run 41 with two-truck side-by-side crossing Lanes 1 and 2.
Vehicle Loading Dynamic Impact
Dynamic impact due to vehicle loading was assessed by comparing strain responses from the same sensors between the crawl speed and highspeed test runs of the same test truck of the same weight in the same lateral position. An impact factor (I) was calculated by dividing the peak response from a highspeed run by that from the corresponding crawl speed run. Field measured I values were calculated for the most heavily loaded girders within each pair of test runs from the sensors measuring the effects of shear and flexure, respectively. For shear effects at the dapped end, the average of strain measurements on both sides of the girder web along the respective compression (Com) and tension (Ten) diagonal was used for assessing vehicle dynamic impact. Highspeed runs were conducted in all four travel lanes at WL#1 and WL#2 but not at WL#3 and WL#4 for safety reasons and not to cause damages to the test trucks. Results of field measured impact factors (I) from the load test are summarized in Table 3.
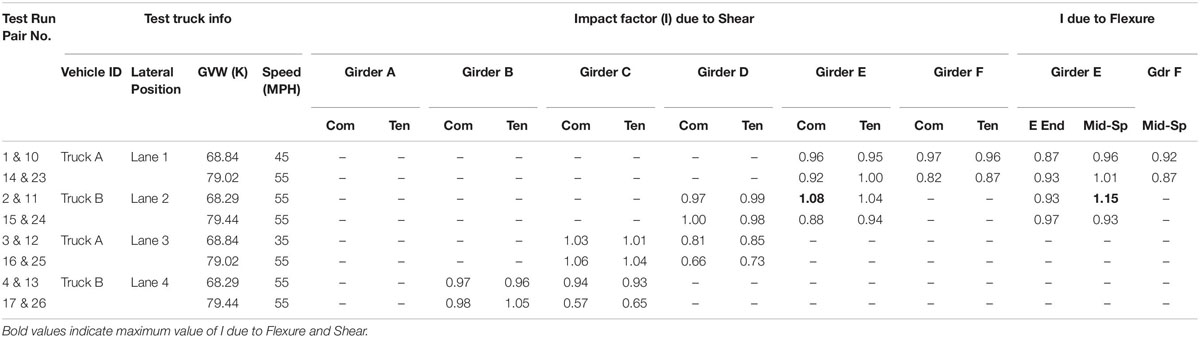
Table 3. Vehicle loading impact factor (I) from field measurements.
As shown in Table 3, the highest I value was 1.08 for shear and 1.15 for flexure in the test span, respectively, from strain sensors along the compression diagonal at the dapped end of Girder E and on the bottom flange at the mid-span of Girder E. Many I values were calculated less than 1.0 from field measurements due to possible reasons of lateral vehicle position shifting between the crawl and highspeed runs, effects of vibration, etc. In order to properly assess vehicle loading dynamic impact, it is important to use sensor measurements from bridge elements directly loaded by the test vehicles and repeat highspeed runs when possible.
Based on field observed good condition of the deck and joints throughout the bridge, it was recommended to use an impact factor (I) of 1.10 for shear and 1.20 for flexure for load rating in its current condition. These values are in agreement with the AASHTO MBE for reducing the Dynamic Load Allowance (IM) to 10% for smooth riding surface at approaches, bridge deck, and expansion joints and 20% for minor surface deviations or depressions.
Deck-Girder Composite Action
Strain measurements from the sensors installed on the girder top and bottom flanges for flexural effects showed very low compressive strains in the top flange compared to the tensile strains in the bottom flange of the same girder section throughout the load test at both the mid-span and a section 5 ft from the support. This clearly indicated full deck-girder composite action, including in the dapped-end region, at all the test load levels. This finding is important because it disapproved an assumption in the rating analysis which assumes the shear resistance in the dapped end is supplied by the stirrup reinforcement and draped prestressing strands in the girder without any participation of the deck or the reinforcing steel in and surround it.
Bridge Load Rating Based on Proof Test Results
A lower-bound bridge load rating for a rating vehicle, depending on the load rating method and level, can be determined using the following equation based on the proof test results:
where:
RFP = a lower-bound rating factor for a rating vehicle based on a proof load test.
kO = proof load test termination factor per AASHTO MBE (1.00 for reaching target load without distress; 0.88 for test aborted due to distress before reaching target load).
WR = gross vehicle weight (GVW) of rating vehicle.
WP = final GVW of test vehicle upon completion of proof load test.
fV = vehicle adjustment factor = Weq/WP, where
Weq = equivalent GVW of rating vehicle for the same force effect of test truck.
γLL = live load factor for specific load rating levels per AASHTO MBE (see Table 4).
IM = dynamic load allowance per AASHTO MBE.
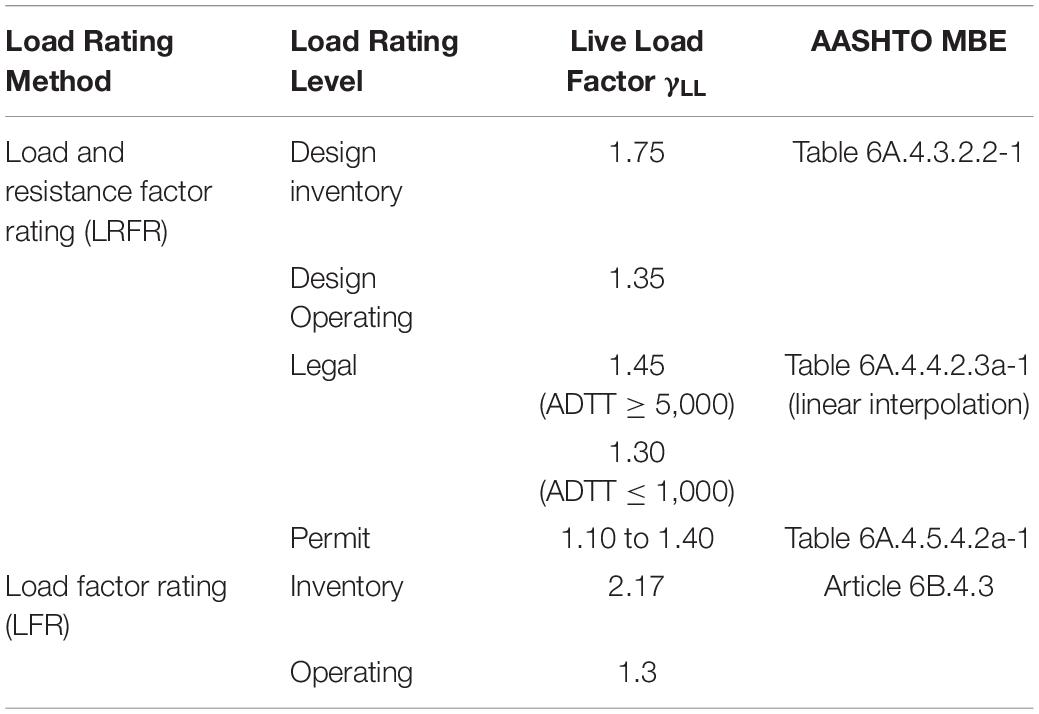
Table 4. Live Load Factor (γLL) for AASHTO LRFR and LFR Methods.
Bridge load ratings derived from a proof load test vary with the live load factor (γLL) of the load rating method and level as shown in Table 4. Table 5 illustrates calculated lower-bound load ratings (RFP) of the I-195 WB bridge based on the proof test results for four different legal vehicles using Eq. (2), Table 4, and the dynamic load allowance discussed previously. The upper and lower portions of Table 5 provide LRFR Legal load ratings for ADTT ≤ 1,000 (γLL = 1.30) and ADTT ≥ 5,000 (γLL = 1.45), respectively; linear interpolations can be made for any ADTT in between. In Table 5, WP = 101.7 kips upon successful completion of proof load test without any signs of distress, thus kO = 1.00. For each rating vehicle, an equivalent gross vehicle weight Weq was calculated for producing the same maximum bending moment (Mmax) and maximum shear force (Vmax), respectively, from a line beam structural analysis of 53′-7′′ simple span.
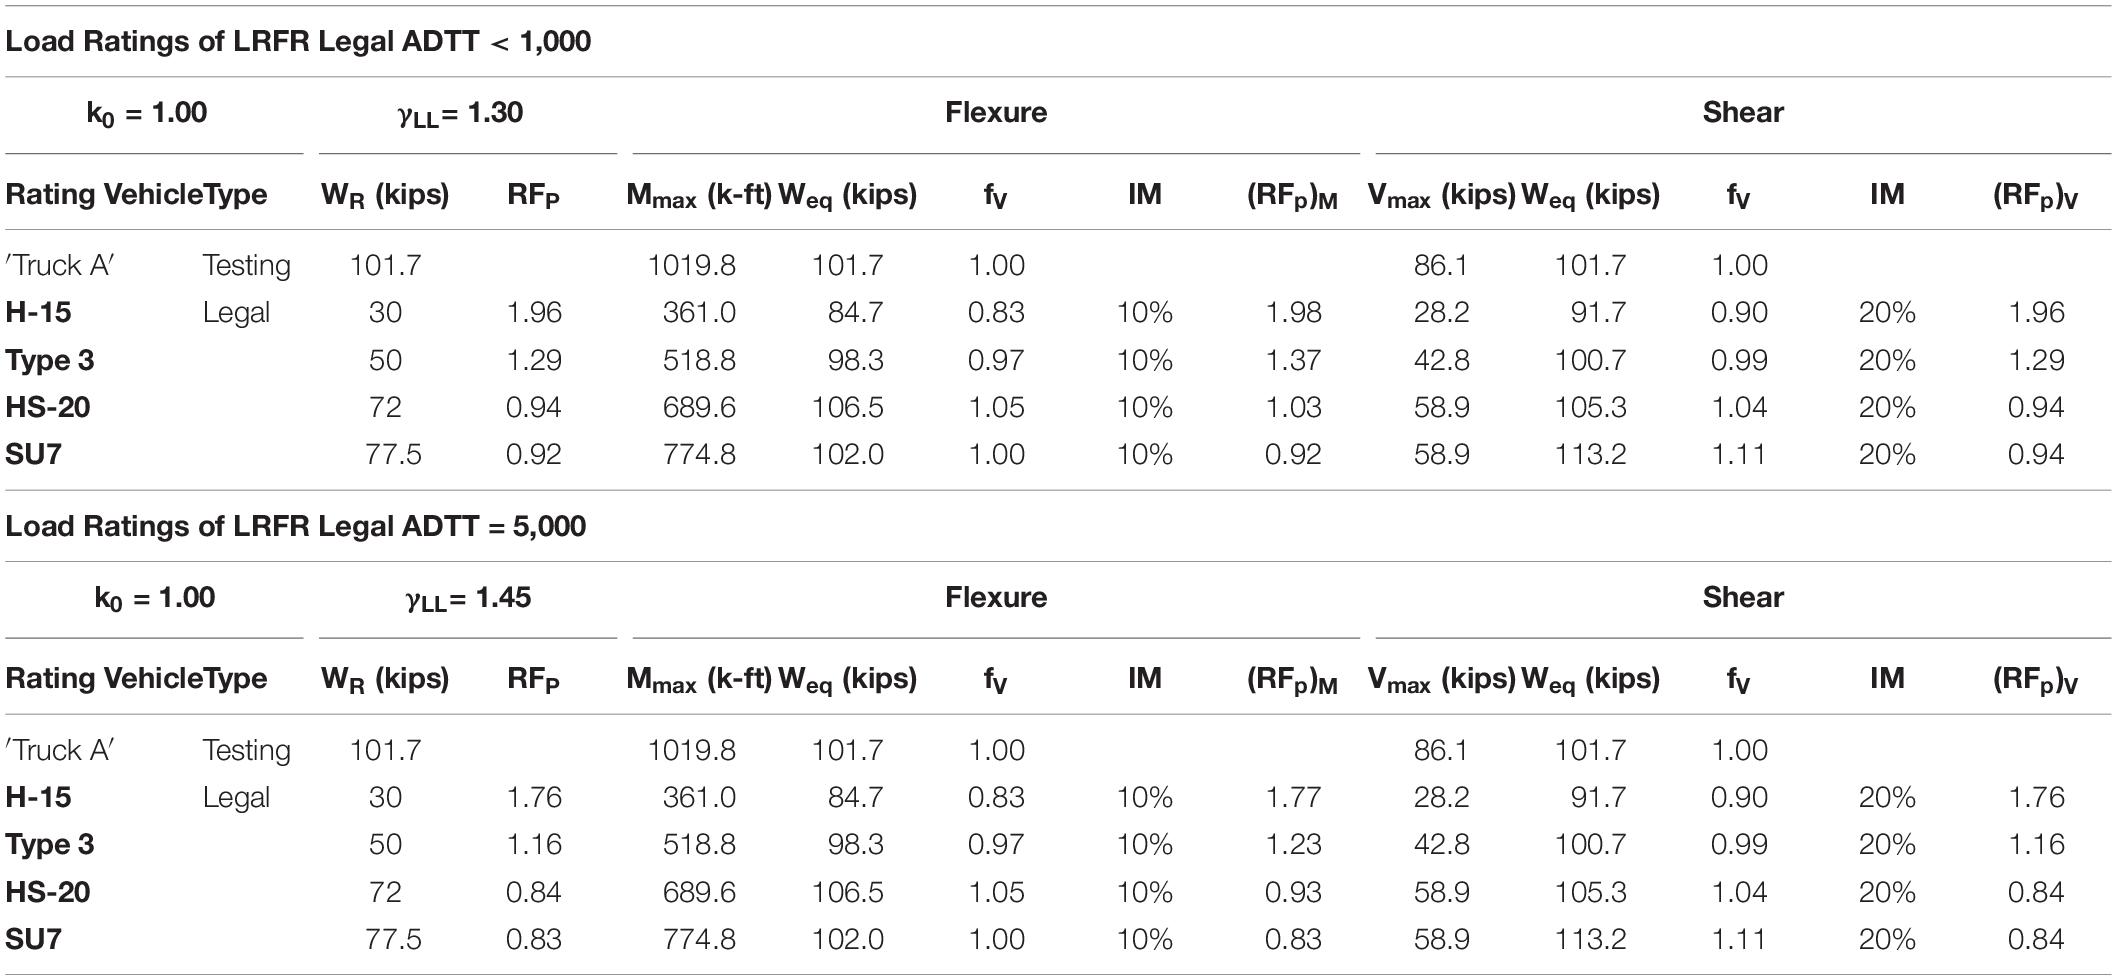
Table 5. Lower-bound bridge load ratings derived from proof test results.
Based on the proof load test results discussed, the bridge was physically proven to have load ratings equal to or higher than the lower-bound load ratings as shown in Table 5.
Analytical Assessment of Shear Resistance of Dapped End
Two analytical methods were used to assess the nominal shear resistance of the dapped end: the strut-and-tie (S-T) and the shear-friction (S-F) methods.
Strut-and-Tie (S-T) Method
The S-T method models the flow of forces in ‘D-regions’ near discontinuities for the design of reinforced or prestressed concrete members (Collins and Mitchell, 1986; Schlaich et al., 1987). Discontinuities may be caused by abrupt changes in member geometry (e.g., dapped ends or openings) or by concentrated forces such as reactions or post-tension anchorages. In contrary, ‘B-regions’ are for bending where planar sections can be assumed to remain plane after loading and shear stresses reasonably uniform over the effective web area. For B-regions, the conventional sectional design approach is sufficient without addressing how the forces are introduced into the member. In D-regions, however, the stress flows are disturbed; planar sections do not remain plane and shear stresses are not uniform over the effective shear area; and S-T modeling serves as an effective design method (Mitchell et al., 2004; AASHTO, 2017).
It is important to understand that strut-and-tie (S-T) modeling is a conservative design method when the conventional sectional models become invalid. It is a “lower bound approach” for minimizing the amount of reinforcement through postulating a number of different S-T models that all provide safe paths for the loads to reach the supports (Mitchell et al., 2004). S-T modeling simplifies the highly complicated load paths in D-regions into a straight-line truss model consisting of concrete compressive struts, steel tension ties, and nodes. It then determines their respective factored resistances based on the geometrical and strength properties of reinforcing steel, prestressing steel, concrete, as well as development or anchorage of steel elements in concrete. The S-T method is subjective to some degree as it requires visualization of stress flows and discretion in assembling and detailing an idealized truss model.
Figure 11 illustrates a strut-and-tie model for the I-195 WB bridge dapped end, where the blue lines represent compression struts and red lines for tension ties. Shear resistance of the dapped end is governed by the tension resistance of vertical tie BC, which consists of contributions from non-prestressed stirrup reinforcement made of ASTM standard No. 9 reinforcing bars of 40 ksi yield strength and draped prestressing strands made of ASTM standard Grade 250, 0.5 in. diameter seven-wire prestressing strands.
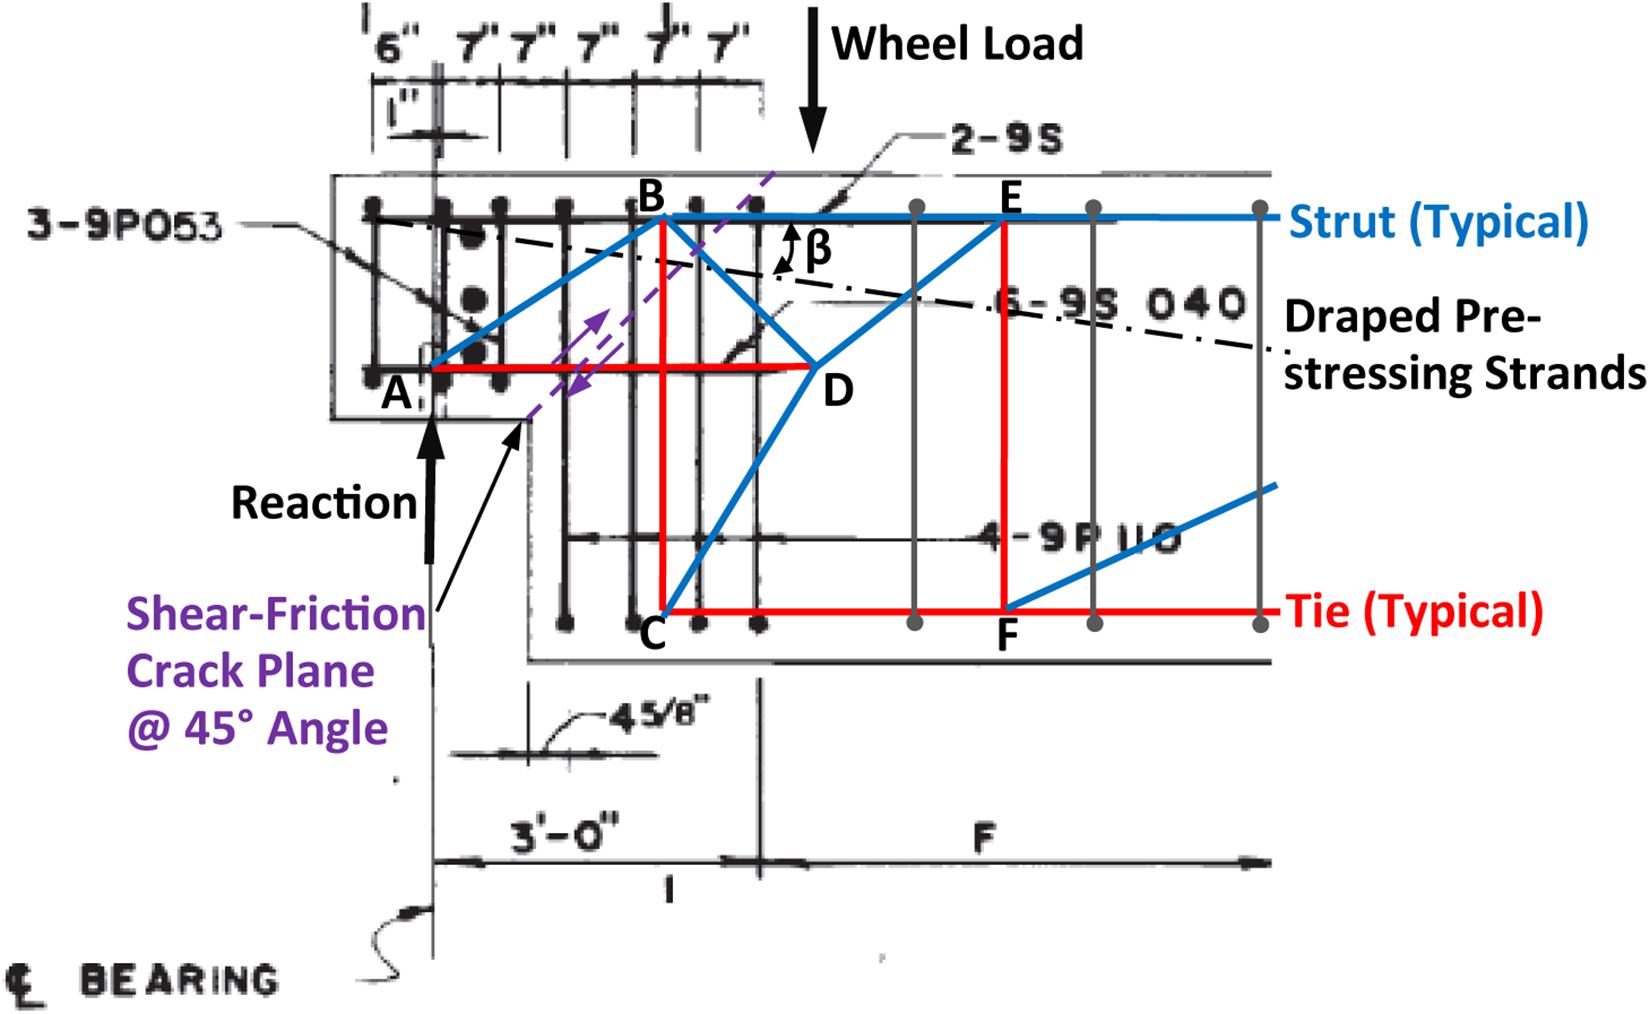
Figure 11. Illustration of strut-and-tie modeling and shear-friction crack plane at dapped end.
Nominal shear resistance of the dapped end (RnV) from the S-T method is calculated as follows (AASHTO, 2018):
where:
RnV,st = nominal tension resistance of stirrup reinforcement.
RnV,ps = vertical component of compression force from draped prestressing strands.
Ast = area of four (4) sets of double-leg stirrups = (4) (2) (1.00 in2) = 8.0 in2.
Aps = area of prestressing steel = (2) (0.144 in2) = 0.288 in2.
fy = yield strength of non-prestressed reinforcement (ksi) = 40 ksi.
fpe = effective stress in prestressing steel after losses = (0.6) (250 ksi) = 150 ksi.
β = angle of draped prestressing strands with respect to horizontal axis = 7°.
Thus, RnV,st = (8.0 in2) (40 ksi) = 320 kips
RnV,ps = (0.288 in2) (150 ksi + 40 ksi) sin(7°) = 6.67 kips
RnV = RnV,st + RnV,ps = 320 kips + 6.67 kips = 326.67 kips
Shear-Friction (S-F) Method
The S-F method is used to determine the shear strength along a specific shear failure plane such as an existing or potential crack in monolithic concrete or an interface between two concretes cast at different times (Birkeland and Birkeland, 1966; Mattock and Hawkins, 1972). The S-F concept assumes the shear resistance to be provided by the dowel action of the reinforcement across the shear failure plane and the friction resulting from the sliding movement of the crack faces under the clamping force from the reinforcement in tension to its yield strength. Any permanent net compression due to properly developed prestressing strands across the shear plane is also added to the force in the shear-friction reinforcement.
For the I-195 WB bridge dapped end, the shear-friction crack plane may be assumed at a 45° angle initiating from the re-entrant corner, as shown by the purple dashed line in Figure 11. Similar to Equation (3), nominal shear resistance of the dapped end (RnV) consists of the vertical component of shear resistance along the assumed shear plane due to shear-friction of vertical stirrups (RnV,st) and that due to the draped prestressing strands (RnV,ps) (Mattock, 1974; Mattock, 1977; AASHTO, 2002; ACI, 2019):
where:
Avf = Area of three (3) sets of double-leg stirrups = (6) (1.00 in2) = 6.0 in2.
α = angle between shear-friction reinforcement and shear plane = 45°.
45° + β = angle between prestressing strands and shear plane = 45° + 7° = 52°.
μ = coefficient of friction depending on contact surface condition.
= 1.4λ for concrete placed monolithically (λ = 1.0 for normal weight concrete) = 1.4.
Thus, RnV,st = (6.0 in2) (40 ksi) [(1.4) (sin45°) + cos45°] sin45° = 288 kips
RnV,ps = (0.288 in2) (150 ksi) [(1.4) (sin52°) + cos52°] sin45° = 52.51 kips
RnV = RnV,st + RnV,ps = 288 kips + 52.51 kips = 340.51 kips
Comparing the results from the two analytical methods indicates: (1) the S-F method yields slightly (4%) higher shear resistance than the S-T method; (2) shear resistance from the S-T method has a higher contribution from non-prestressed reinforcement because vertical tie BC consists of four sets of stirrups while the shear-friction crack plane only involves three sets of stirrups; and (3) shear resistance from the S-F method has a higher contribution from the draped prestressing strands. In the S-F method, both layers of horizontal reinforcement across the shear plane cannot be included for shear resistance because they are subject to compression due to shear slippage (ACI, 2019).
It is important to point out that each method establishes an analytical shear resistance based on a hypothetical failure mode and resistance mechanism. Neither method considers the effects of an 8.5 in. thick reinforced concrete deck in distributing and resisting shear, which are likely the main reason for why analytical load ratings underestimated the shear capacity of the dapped end.
Summary and Conclusion
For a prestressed concrete girder bridge with insufficient analytical load ratings governed by shear at the dapped ends, a proof load test was successfully completed in four loading and unloading steps with a maximum proof load of two test trucks of approximately 100,000 lbs each crossing the bridge side-by-side. The load test consisted of 44 test runs with the use of 32 strain sensors. No signs of distress or non-linear behavior were observed throughout the process.
The following findings and conclusions are made from this study:
(1) Proof load testing has a higher level of reliability than diagnostic testing in assessing structural capacity because it includes the effects of full dead load plus a magnified live load and minimizes uncertainties in calculating structural capacities. However, proof testing requires more complex field operations and involves a higher level of risks.
(2) In a proof load test, sensors must be placed at locations that can capture possible signs of distress, non-linear behavior, or onset of failure of the structure.
(3) Key factors in determining a target proof load include a desired or target load rating, available test vehicles, comparison of the governing force effect between the rating vehicle and the test vehicle, number and weight capacities of test vehicles to be used, etc.
(4) Test runs of increasing load need to be arranged to apply direct loads to all primary load carrying elements, utilize a variety of crossing patterns for different load effects, repeat the same crossing patterns at all weight levels, and make pairs of slow speed and highspeed test runs for assessing vehicle loading dynamic impact.
(5) Plots of key sensor responses vs. increasing test load, in combination with examination of zero returns and the magnitudes of strain and deflection measurements, serve as an effective method for assessing linear elastic behavior of the structure and capturing possible signs of distress or onset of failure.
(6) Vehicle dynamic impact can be assessed by comparing strain responses from the same sensors between the crawl speed and highspeed test runs of the same test truck of the same weight in the same lateral position. Only sensor measurements from bridge elements directly loaded by the test vehicles should be used for this purpose. Highspeed test runs should be repeated when possible for increased reliability.
(7) Lower bound bridge load ratings can be derived from the results of a proof load test using Eq. (2) depending on the load rating method and level as needed.
(8) Test results suggested that analytical methods of strut-and-tie and shear-friction underestimate the shear resistance of the dapped ends by considering only the stirrup reinforcement and draped prestressing strands within the PSC girder. Effects of a composite reinforced concrete deck in distributing and resistant shear are likely the main reason for why analytical load ratings underestimated the shear capacity of the dapped end.
(9) The Manual for Bridge Evaluation of AASHTO contains conceptual guidelines for determining bridge load rating through proof load testing. This paper provides detailed procedures for field implementation, test results interpretation, and load rating derivation.
(10) It is important to note that proof load test results are valid only upon the structural condition at the time of load test. A re-evaluation may be required if any significant changes or deteriorations occur in the superstructure or the substructure.
Data Availability Statement
The raw data supporting the conclusions of this article will be made available by the authors, without undue reservation, to any qualified researcher.
Author Contributions
YZ and MG performed all the testing and analytical work discussed in this manuscript. YZ wrote the majority of the manuscript with assistance from MG for the development of tables and figures. Both authors contributed to the article and approved the submitted version.
Conflict of Interest
Both authors are employed by the company AECOM Technical Services, Inc.
The authors declare that the research was conducted in the absence of any commercial or financial relationships that could be construed as a potential conflict of interest.
Acknowledgments
The authors would like to express their acknowledgments to Mr. Corey Richard of AECOM for his efforts in project management and field testing coordination; Mr. Michael Sullivan, formerly of AECOM, for his efforts during field testing and data processing; and Mr. Stephen Matty of AECOM for his supports in the strut-and-tie and shear friction methods of analysis.
References
AASHTO (2002). Standard Specifications for Highway Bridges, 17th Edn, Washington, DC: American Association of State Highway and Transportation Officials.
AASHTO (2017). AASHTO LRFD Bridge Design Specifications, 8th Edn, Washington, DC: American Association of State Highway and Transportation Officials.
AASHTO (2018). The Manual for Bridge Evaluation, 3rd Edn, Washington, DC: American Association of State Highway and Transportation Officials.
ACI (2019). Building Code Requirements for Structural Concrete, ACI 318-19. Naples, FL: American Concrete Institute.
Birkeland, P. W., and Birkeland, H. W. (1966). Connections in precast concrete construction. ACI J. Proc. 63, 345–368.
Collins, M. P., and Mitchell, D. (1986). A rational approach to shear design – the 1984 canadian code provisions. ACI J. 83, 925–933.
Fu, G., and Tang, J. (1995). Risk-based proof-load requirements for bridge evaluation. J. Structut. Eng. 121, 542–556. doi: 10.1061/(asce)0733-9445(1995)121:3(542)
Lantsoght E. O. L. (ed.) (2019). Proof Load Testing and the Future of Load Testing, (Structures and Infrastructures). Boca Raton, FL: CRC Press.
Lantsoght, E. O. L., van der Veen, C., Hordijk, D. A., and de Boer, A. (2017). Development of recommendations for proof load testing of reinforced concrete slab bridges. Eng. Struct. 152, 202–210. doi: 10.1016/j.engstruct.2017.09.018
Mattock, A. H. (1974). Shear Transfer in Concrete Having Reinforcement at an Angle to the Shear Plane, Shear in Reinforced Concrete, SP-42. Farmington Hills, MI: American Concrete Institute.
Mattock, A. H. (1977). Discussion of considerations for the design of precast concrete bearing wall buildings to withstand abnormal loads, by PCI committee on precast concrete bearing wall buildings. PCI J. 22, 105–106.
Mattock, A. H., and Hawkins, N. M. (1972). Shear transfer in reinforced concrete—recent research. PCI J. 17, 55–75. doi: 10.15554/pcij.03011972.55.75
Mitchell, D., Collins, M. P., Bhide, S. B., and Rabbat, B. G. (2004). AASHTO LRFD Strut-and-Tie Model Design Examples. New York, NY: Portland Cement Association.
Schlaich, J., Shafer, K., and Jennewein, M. (1987). Towards a consistent design of reinforced Concrete Structures. PCI J. 32, 77–150.
TRB (1998). Manual for Bridge Rating through Load Testing. NCHRP Research Results Digest No. 234. Washington, DC: Transportation Research Board.
Keywords: bridge, load rating, prestressed concrete, dapped end, proof load test
Citation: Zhou YE and Guzda MR (2020) Bridge Load Rating Through Proof Load Testing for Shear at Dapped Ends of Prestressed Concrete Girders. Front. Built Environ. 6:117. doi: 10.3389/fbuil.2020.00117
Received: 13 December 2019; Accepted: 26 June 2020;
Published: 22 July 2020.
Edited by:
Fikret Necati Catbas, University of Central Florida, United StatesReviewed by:
Monique Hite Head, University of Delaware, United StatesJeffrey Scott Weidner, The University of Texas at El Paso, United States
Copyright © 2020 Zhou and Guzda. This is an open-access article distributed under the terms of the Creative Commons Attribution License (CC BY). The use, distribution or reproduction in other forums is permitted, provided the original author(s) and the copyright owner(s) are credited and that the original publication in this journal is cited, in accordance with accepted academic practice. No use, distribution or reproduction is permitted which does not comply with these terms.
*Correspondence: Y. Edward Zhou, ZWQuemhvdUBhZWNvbS5jb20=; Mark R. Guzda, bWFyay5ndXpkYUBhZWNvbS5jb20=