 Mikko Sauni
 Heikki Luomala1
 Esko Turunen
- 1Built Environment, Tampere University, Tampere, Finland
- 2Information Technology and Communication Sciences, Tampere University, Tampere, Finland
Railway track geometry deterioration indicates degradation in the underlying track structures. Monitoring and predicting this behavior are important as is investigating the root causes contributing to the deterioration. Without knowing the causes, assigned remediation might not result in a long-lasting correction. However, there is little research regarding the pragmatic aspects of investigating the root causes of track geometry deterioration utilizing real-world data sources. For this purpose, a new method was explored. After reviewing methodologies, the chosen approach was an association rule data mining method: General Unary Hypotheses Automaton (GUHA). The initial data used in data mining comprise data from asset management and multiple measurement systems, including a track geometry measurement vehicle, a track stiffness measurement device, ground penetrating radar, and lidar. The results of the GUHA data mining are hypotheses based on the initial data and can be used to indicate the most common and uncommon types of structures regarding their track geometry deterioration behavior and the attributes governing the behavior of a certain structure type. Therefore, the GUHA method was found to be a suitable method for investigating the root causes of track geometry deterioration from comprehensive railway track structure data.
Introduction
Railway track structures endure harsh conditions and countless damaging loading cycles in their life cycle. During this life cycle, which usually lasts many decades, the structures degrade and require intermediate maintenance. However, the need for maintenance is not generally homogeneous along the length of a track section: Some areas require much more frequent maintenance than others. If the heterogeneous nature of degradation is not accounted for, dangerous conditions regarding train safety can occur. Furthermore, if the uniform maintenance for the whole track section is assigned according to the needs of the weakest parts of the track, plenty of unnecessary maintenance will be conducted, and money will be wasted. Therefore, the condition of the whole track section needs to be monitored.
The condition monitoring of track structures is widely conducted using track geometry measurement vehicles that measure deviations of track geometry using onboard measurement systems (Esveld, 2001). The deviations indicated by the measurement systems indicate wear or movement in the track structures. These measurement systems continue to be developed, and new technologies are applied, for example, conducting measurements from in-service vehicles (Weston et al., 2015).
The track geometry measurements require detailed analyses to ensure train safety, and they are traditionally done by comparing the measurement results to limit values set by the track owner. Many different techniques can be used in this type of results analysis as described by Berawi et al. (2010).
Analyzing the condition of track geometry using more sophisticated methods has been a popular branch of science as is evident from the number of different approaches for track deterioration modeling (Higgins and Liu, 2018). Especially, track geometry deterioration modeling has been popular. Track geometry deterioration is the process of uneven settling of track structures, which is observed by obtaining increasing deviations in track geometry, when new measurements are conducted and time progresses. If this process is modeled with great detail, either with a deterministic or a stochastic model, the required maintenance can be planned in advance, which leads to better use of the track availability and reduced maintenance costs.
Track geometry deterioration modeling is a worthwhile exercise as it has been proven to reduce costs in asset management (Andrews et al., 2014). However, deterioration modeling is solving only half the problem. Another important aspect to consider is investigating the root causes of track geometry deterioration. These root causes are here defined as the track structure features associated with increased track geometry deterioration rates, for example, insufficient drainage or subgrade deformation issues. Fixing these types of problems for the long term might require maintenance activities that are different from routine maintenance.
The most common maintenance activity for correcting track geometry deviations is tamping. Tamping is the process of lifting the rails and ties while compacting the ballast under the ties being lifted. Tamping can level the track geometry to provide a smooth running surface for trains. However, the effects of tamping are not permanent (Audley and Andrews, 2013). Furthermore, tamping does not increase the resilience of structures per se, but only provides temporary correction of geometry. Deteriorated or defective track structures continue to cause the track geometry to rapidly deteriorate to the state before tamping. Therefore, to attain a more lasting effect, the root causes for track geometry deterioration must be investigated to assign suitable remediation.
This aspect of investigating root causes for track geometry deterioration has been researched far less than track geometry deterioration modeling. Guler et al. (2011) used neural networks to predict track geometry deterioration based on certain track asset data. Sadeghi and Askarinejad (2009, 2012) have provided stochastic approaches to analyzing the effects of track structure conditions and track components to track geometry.
Although these studies have modeled the effects of different components and conditions, they do not strictly assess the root causes of track geometry deviations. For example, the severity of some features is assessed in these studies, but the commonness of a problem type is not. To advance the investigation of the root causes of track geometry deterioration, new methods have to be tested and applied. For this purpose, a method is explored: first, by searching a promising method by type, and second, by testing the chosen method using actual railway track structure data.
Choosing a method for investigating the root causes of track geometry deterioration can be taken in steps. First, it must be decided whether to create a deterministic model or use a stochastic approach. Using a deterministic model requires many experimental values and knowledge of the chain of events leading to deteriorated track geometry. Although many track settlement models are available (Dahlberg, 2001), their use for this purpose may not be suited as these models rely greatly on detailed descriptions of different loading and support conditions. This information is practically impossible to provide for all the different types of structures on a track section.
Stochastic models, on the other hand, can utilize already available data, and inarguably, there is a great volume of data recorded from track structures that can be utilized. This data, in the case of Finland, includes the track geometry measurement history; ground penetrating radar (GPR) measurements that can provide a continuous thickness and moisture index for different structure layers; laser scanning (lidar) results to indicate embankment shape, from which drainage depth can be assessed; track asset data, such as bridges, turnouts, and culverts; and continuous track deflection measurements conducted as demonstrated by Luomala et al. (2017).
Therefore, the next step should be to select one stochastic approach, from which there are many to choose. Considering the complexity of the multivariate heterogeneous initial data, the search should be pointed to data mining methods that can digest this type of data.
Data mining can be understood in many ways and terms. Terms, such as machine learning and deep learning, are associated with the subject and are sometimes used interchangeably. Even though there is no single conclusive definition of data mining, one well-established way to define it is to use the terminology provided by Fayyad et al. (1996). In this terminology, data mining is a step in a larger process that is knowledge discovery from data (KDD). KDD begins with raw data, and after many steps in preprocessing the data and applying data mining methods and expert judgment, knowledge can be retrieved as the result. In this process, data mining is the step in which data analysis and discovery algorithms are applied to produce patterns or models from the data (Fayyad et al., 1996).
Data mining is in itself a whole branch of science, from which there are many methods to choose. As previously mentioned, the terminology in the field is not irrefutable, but some generalizations can be made. Data mining can be divided into two categories with different primary goals: predictive or descriptive methods (Fayyad et al., 1996). The predictive or supervised methods, in other terminology (Tsui et al., 2006), focus on learning past behavior and predicting future observations based on a given input. Descriptive or unsupervised methods, in other terminology (Tsui et al., 2006), find patterns or relationships within the provided data, thus giving new insight about the data that could not be observed with human effort. Most methods do not belong to one category absolutely but generally exhibit stronger ties to one than the other (Fayyad et al., 1996).
Of these two methodologies, descriptive data mining is the more fitting choice because finding root causes of track geometry deterioration is closely related to finding novel patterns and relationships from data and presenting them to the end user. Descriptive data mining methods can be classified to include clustering, summarization, association rules, and sequence discovery (Dunham, 2003) of which clustering and association rules provide the best descriptions of the relationships between different data sources, whereas summarization and sequence discovery are more useful in cases such as text mining or customer purchase tracking, respectively.
Clustering is organizing the data into groups that represent data points that are more similar to data inside the cluster than outside it (Jain et al., 1999). Association rules provide insight on which data sources are most associated with other data sources with a specified confidence, often using Boolean logic (Agrawal et al., 1993). Of these two tasks, association rules better fit the purpose of this research.
To enhance current practices regarding track geometry deterioration analysis, the ability to investigate the root causes of track geometry deterioration using the association rule data mining algorithm General Unary Hypotheses Automaton (GUHA) was tested. The choice of the method was based on the reviewed methodologies and tasks. GUHA provides a way to assess the relationship of different input data attributes. In practical terms, using GUHA, associations between available railway track structure data sources and developments in track geometry can be investigated.
Materials and Methods
Initial Data
The initial data used in the data mining presented in section “Results from Applying GUHA to Railway Track Structure Data” concern the Luumäki–Imatra track section located in Eastern Finland. The track section was initially built in the 1960s and was renewed at the beginning of the 21st century. The track section is a 65-km-long electrified single-track line, which has both passenger and cargo traffic. A major renewal is being planned on the track section in question because faster and heavier trains are required to increase the line’s efficiency. The condition of the track section varies: Some sections of the track exhibit problematic structures, whereas others have required little maintenance during their life cycle.
The initial data available from the structures of this track section were conformed into a single matrix (CSV spreadsheet), in which a row of data depicts a 1-m-long section of track that is described by the columns representing the features of the track structure. The initial data matrix contained 65,142 rows and 25 columns. Of the 25 columns, 24 contained attributes used in data mining, and one column contained location information in the form of track meters. This was used only for locating interesting occurrences, not for data mining. Figure 1 presents a snapshot of the initial data, and Table 1 elaborates the attributes of the data.
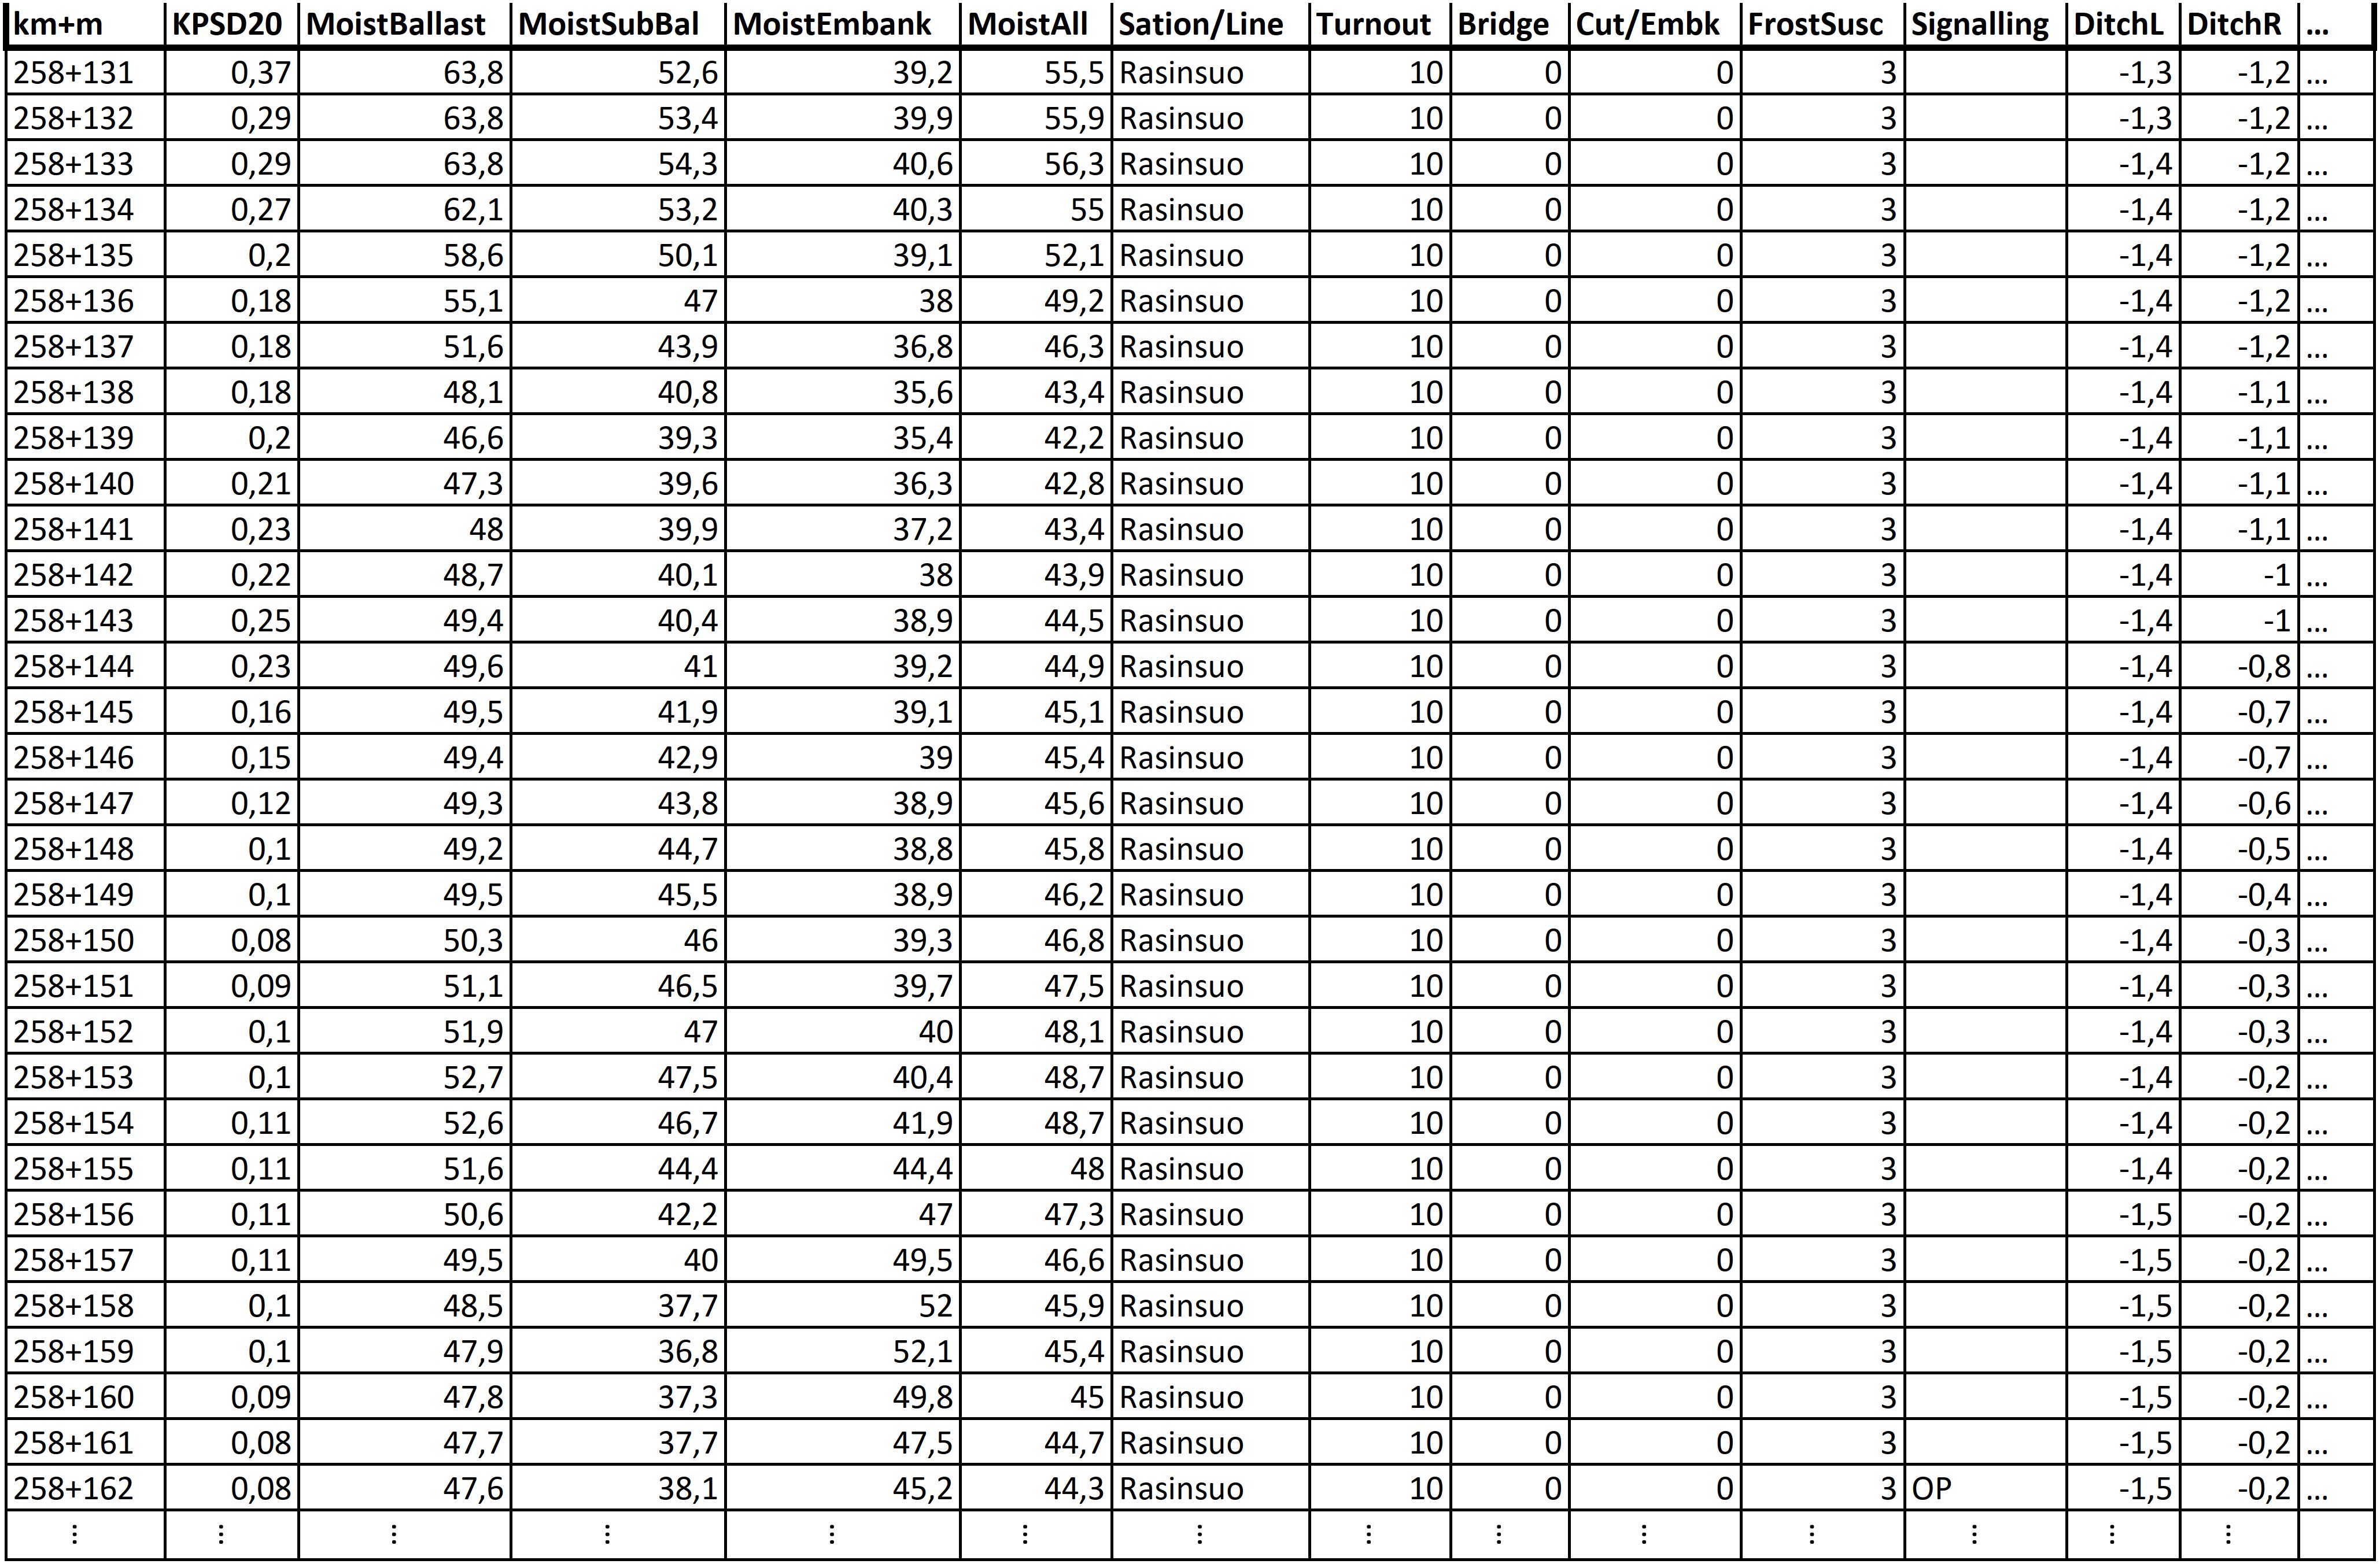
Figure 1. Snapshot of the initial data.
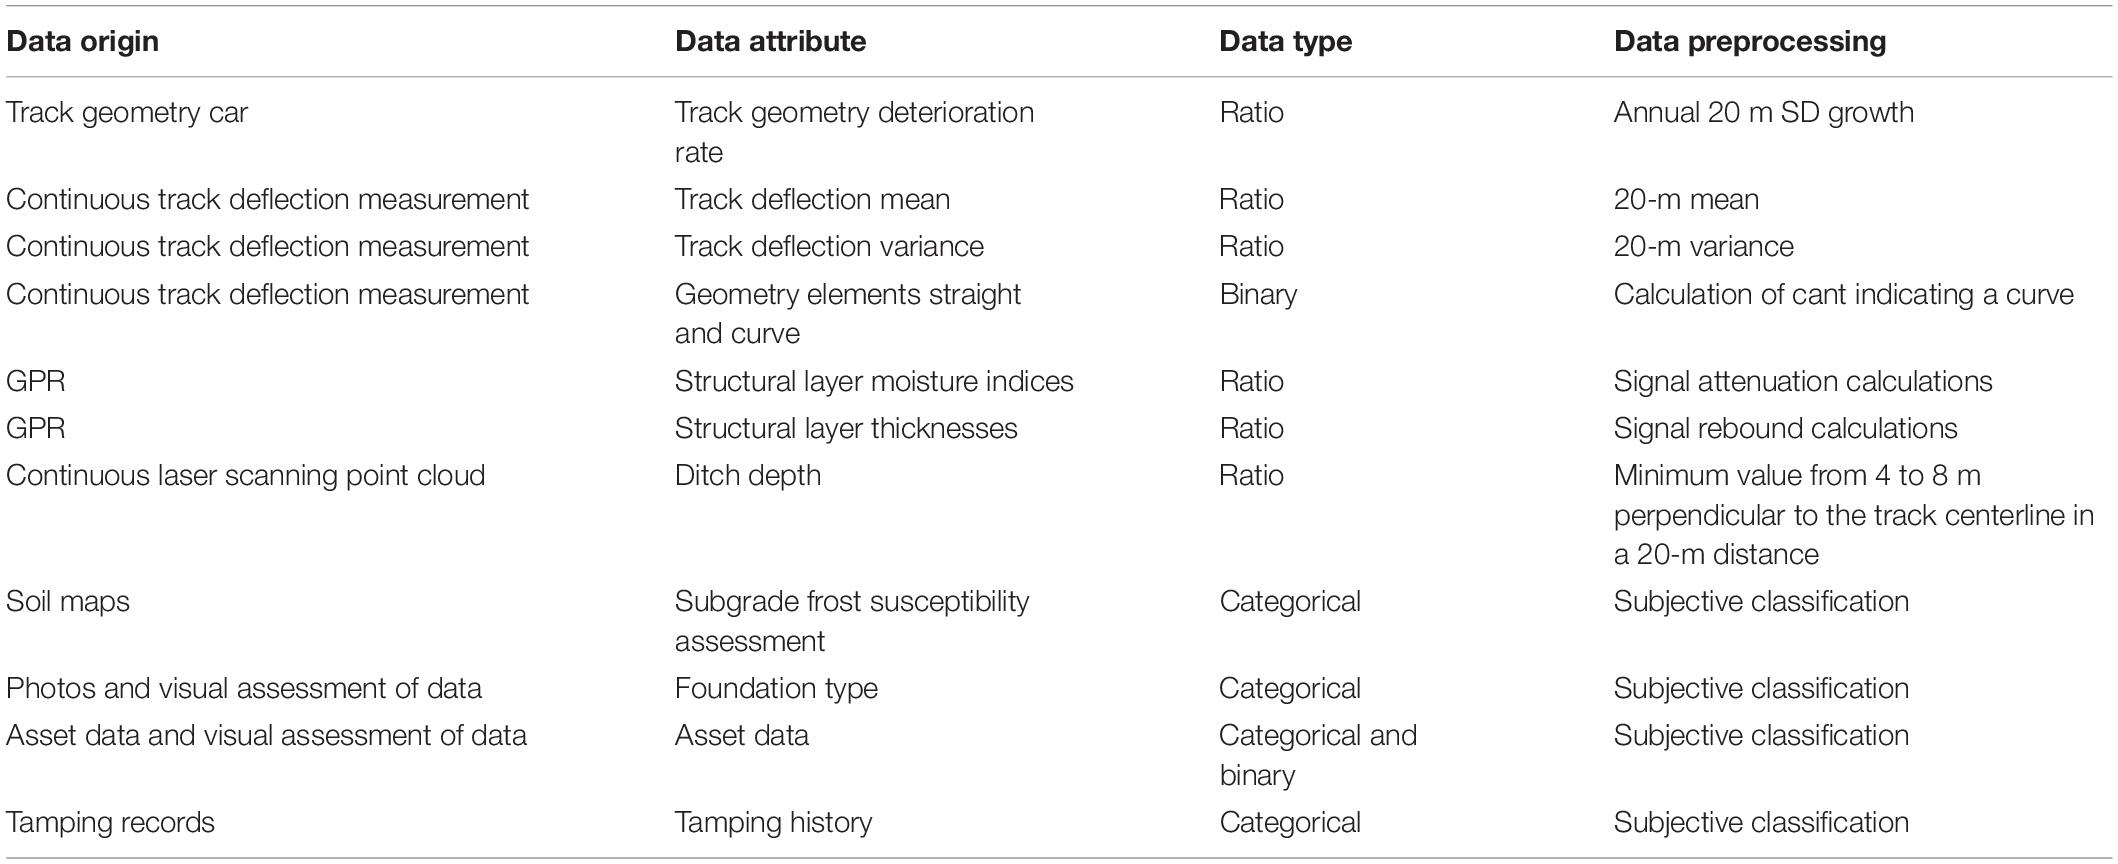
Table 1. Attributes used in data mining.
The initial data were essentially either ratio or nominal data depending on the data origin. Ratio data, in this context, refers to data having a true zero, order, and quantifiable differences between data points. Nominal data, in this context, refers to categorical or binary data in which no ordering, direction, or distances for the data points are present.
The attribute for track geometry deterioration rate is further elaborated in section “Track Geometry Deterioration Rate”. Track deflection was measured using a continuous track deflection measurement device presented by Luomala et al. (2017). Two attributes were created from the track deflection measurements: deflection level (mean) and variations (variance) in deflection. Furthermore, track deflection measurements provided geometry cant data, which were used to identify track geometry elements such as curves and straights.
GPR measurements provided the structural layer moisture indices and layer boundaries, using which layer thicknesses were calculated. The structural layer thicknesses were calculated for ballast, subballast, and embankment. Furthermore, an attribute for the whole structure thickness, a combination of the aforementioned, was provided. GPR measurements also revealed bedrock depths in places where the bedrock level was shallow.
As a peculiarity, Finnish track structures are relatively thick compared with structures in warmer regions. The lowest allowable new track structure thickness using frost-resistant materials varies between 2.0 and 2.6 m, depending on the region. If the required track structure thickness is not met or if frost heave problems are observed on old track sections, frost insulation boards can be installed in the track substructure to reduce frost penetration. These frost insulation boards are extruded polystyrene boards that can withstand high pressure. Before the 2000s, some expanded polystyrene (EPS) boards were installed in track structures, but these did not endure well, and the use of EPS boards in track structures has since been banned.
As presented in Table 1, ditch depth was calculated from the laser scanning point clouds. Soil maps and historical data were used to assess the frost susceptibility of the subgrade. Asset data included binary and categorical attributes for frost insulation boards, stations, level crossings, bridges, culverts, turnouts, cuttings, and wayside signaling equipment. Some of the asset data were retrieved from the railway asset management data warehouse, and some of the data were created using the video feed of the track section combined with the GPR interpretations and laser point clouds. Accordingly, track assets could be accurately located.
The used initial data exhibited missing values. However, due to the GUHA method’s ability to handle them and their small quantity, the missing values were left in the data. Some missing data were intentionally left blank and was handled in the software as an attribute category. For example, an empty value for a bridge implies the non-existence of a bridge. The actual missing values included ballast thickness on bridges without a ballast layer and ballast moisture in some turnouts where GPR measurements were distorted by the frog.
Track Geometry Deterioration Rate
The process for calculating the track geometry deterioration rate is not unambiguously defined throughout literature. Therefore, it is pertinent to fully elaborate how the calculations have been conducted, especially as the track geometry deterioration rate is used as the predominant measure of durability.
The track geometry measurement data were produced using a track recording vehicle, Plasser and Theurer EM 120 (Ttr1 51), which uses relative measurements from three bogies to determine track geometry deviations. The measurement data contained biannual measurements from 2008 to 2018. Longitudinal geometry deviations were used in calculating the deterioration rate because the longitudinal geometry is mostly affected by the movements in the structures below the track rather than only by the rails or sleepers themselves.
Different chord lengths and parameters were tested calculating the track geometry deterioration rate. A 20-m running standard deviation (SD) calculated from longitudinal deviations (LD) was chosen as it best described the original longitudinal geometry deviation signal. The SD values obtained from the consecutive measurements were used to calculate the annual increase or decrease in track geometry deterioration. The mean of the increased annual values was used to describe the track geometry deterioration rate. If the SD values significantly decreased from 1 year to another, the reduction was ignored in the track geometry deterioration rate because a large reduction in the deviation implied tamping or other maintenance and repair actions. The track geometry deterioration rate was calculated for each point in the track section in 1-m intervals to be in conformity with the other initial data.
The average deterioration rate for the Luumäki–Imatra track section was 0.103 mm/a. Track geometry deterioration rate was lower than average on 70% of the track section, meaning that problematic areas were not as common as non-problematic areas but exhibited much higher deterioration rates than the non-problematic areas. This result was expected because problematic areas are not generally long sections of the track.
Figure 2 presents an example of the track geometry deterioration rate of two cross-sections in which the y-axis represents 20 m SD values of LD. The deterioration behavior of the two cross-sections is very different. The cross-section at track kilometer 260 + 390 is at the edge of a section having frost insulation boards. The cross-section at track kilometer 260 + 360 is approximately 20 m away from the section having frost insulation boards.
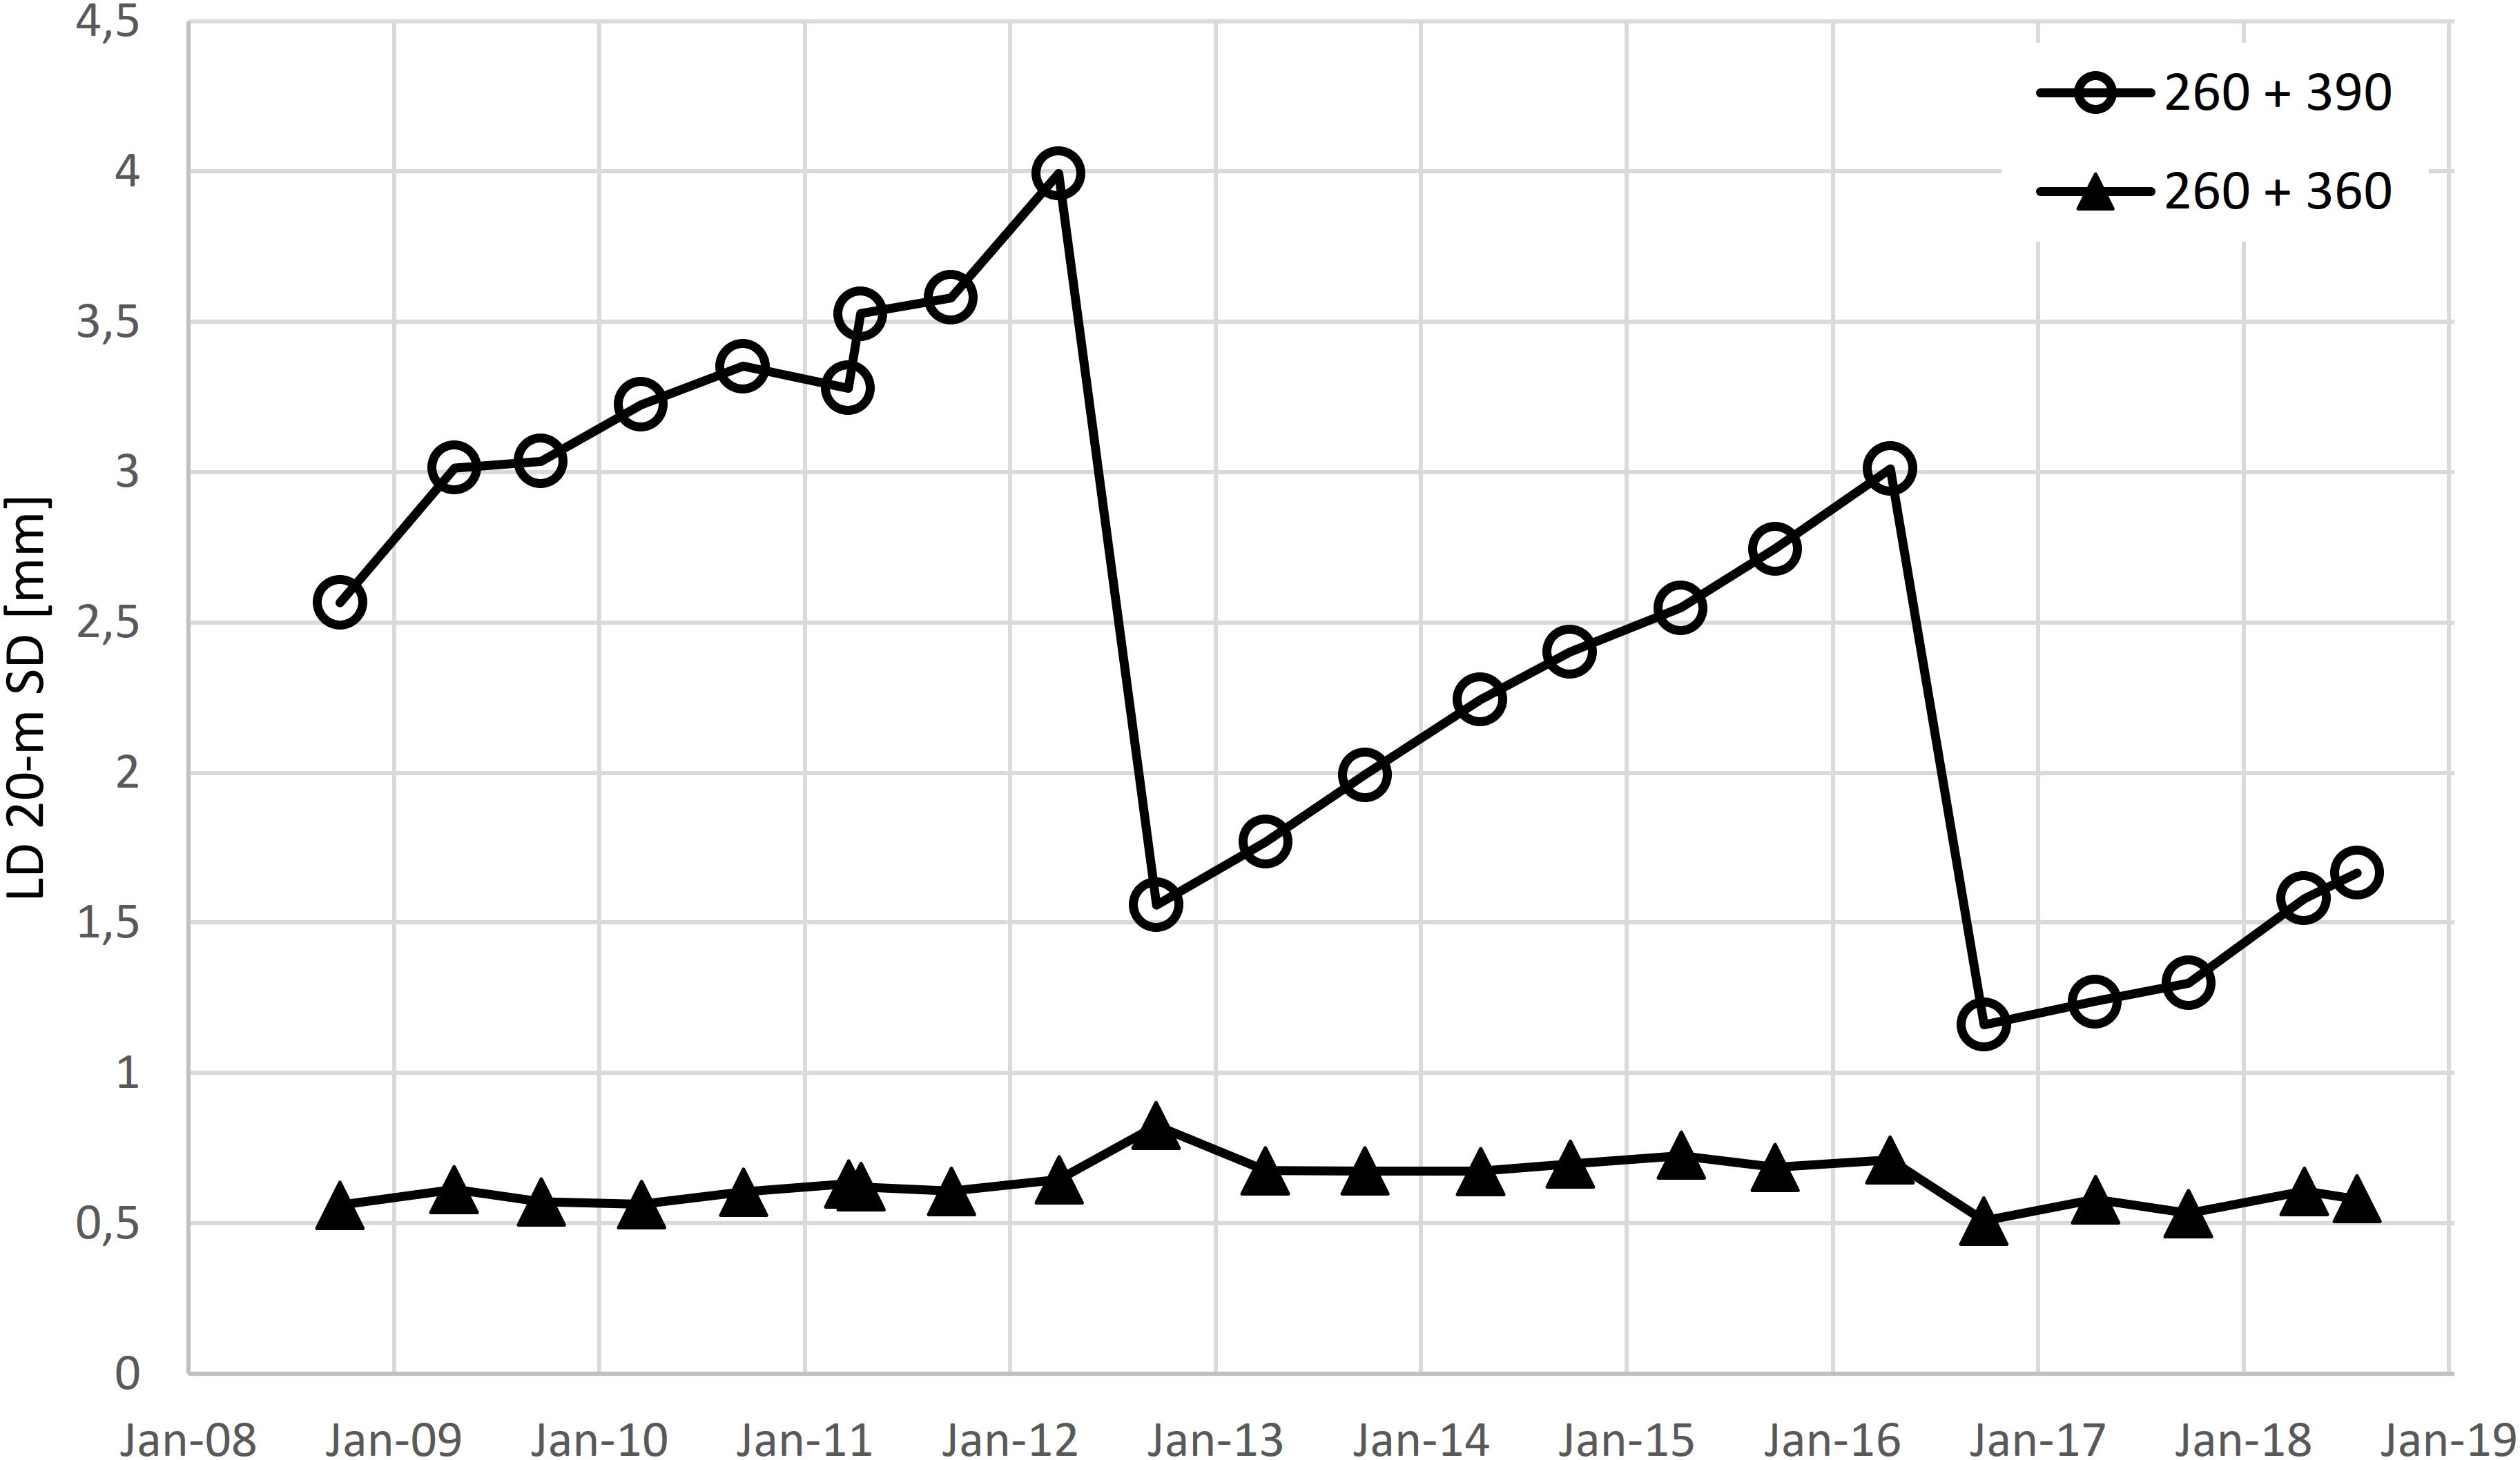
Figure 2. LD 20-m SD of two cross-sections.
The track geometry deterioration rate for cross-section 260 + 390 was 0.35 mm/a, whereas the corresponding value for cross-section 260 + 360 was 0.05 mm/a. Tamping can be observed to have taken place before the 2012 and 2016 winter measurements. Surprisingly, the 2012 tamping has increased deviations at cross-section 260 + 360, which might be due to uneven ballast settlement after tamping. However, the effect is nearly negligible because the deviations at cross-section 260 + 360 do not tend to grow, and the 2016 tamping has restored the deviations to their original level. In the spring of 2011, the track geometry was measured both in April and May. These measurements produced different results at cross-section 260 + 390. Winter of 2010–2011 was especially cold in Finland, and the measurements indicate the time before frost thaw and after frost thaw as deviations have significantly increased between the two measurements.
The calculated track geometry deterioration rate was visualized and compared with other available data. The deterioration indicates the condition of a track structure. Known problem areas, such as bridge transitions (Li and Davis, 2005) and stiffness variations (Dahlberg, 2010), could be detected based on the deterioration rate. In addition, tamping and frost heave problems could be observed from the track geometry history as large reductions or fluctuation in the deviations. The track geometry deterioration rate was generally used as the succedent attribute in GUHA data mining.
GUHA Method
The GUHA method was initially developed in the 1960s and 1970s, and its background was elaborated by Hájek and Havránek (1978). An up-to-date and comprehensive presentation of the method can be found in Jan Rauch’s Observational Calculi and Association Rules (2013). The GUHA method is considered a descriptive data mining method. Hence, it is not used to make deductions or predictions, but to describe and present input data in new ways to users by producing hypotheses.
The GUHA method is based on logic formalism: the statements about data are either true (data support a statement) or false (data do not support the statement). The user provides general questions about the data. Typical data can produce millions of statements, among which only a few are true and interesting to the user. True statements, referred to as hypotheses, are considered to be answers to the user’s questions.
Data mining was conducted using the LISp-Miner program, an application of the GUHA method (Rauch, 2013). The practical aspects of using LISp-Miner have been elaborated by Berka (2016). The GUHA method and its application, LISp-Miner, have considerably evolved since their discovery and are still being further developed (Novák et al., 2008; Hájek et al., 2010; Piché et al., 2014).
Figure 3 presents the generic process for using the GUHA method and the LISp-Miner program. This process begins with collecting and formatting data into an initial data matrix that is suitable for data mining. In the initial data, rows contain observations, and columns contain attributes (also called predicates), meaning the properties the observations have. In GUHA data mining, the key is to set relevant questions, called analytical questions, related to the data. These questions can be translated into the GUHA language. Then, GUHA data mining produces various hypotheses based on the input data. The hypotheses are automatically generated according to boundary conditions that are selected by the user. The hypotheses can vary from trivial to interesting in a single data mining task. The user can choose the meaningful ones and further explore them by assessing their contingency tables and associated predicates. After analyzing the results, the user can subjectively translate the numeric results into comprehensible human language.
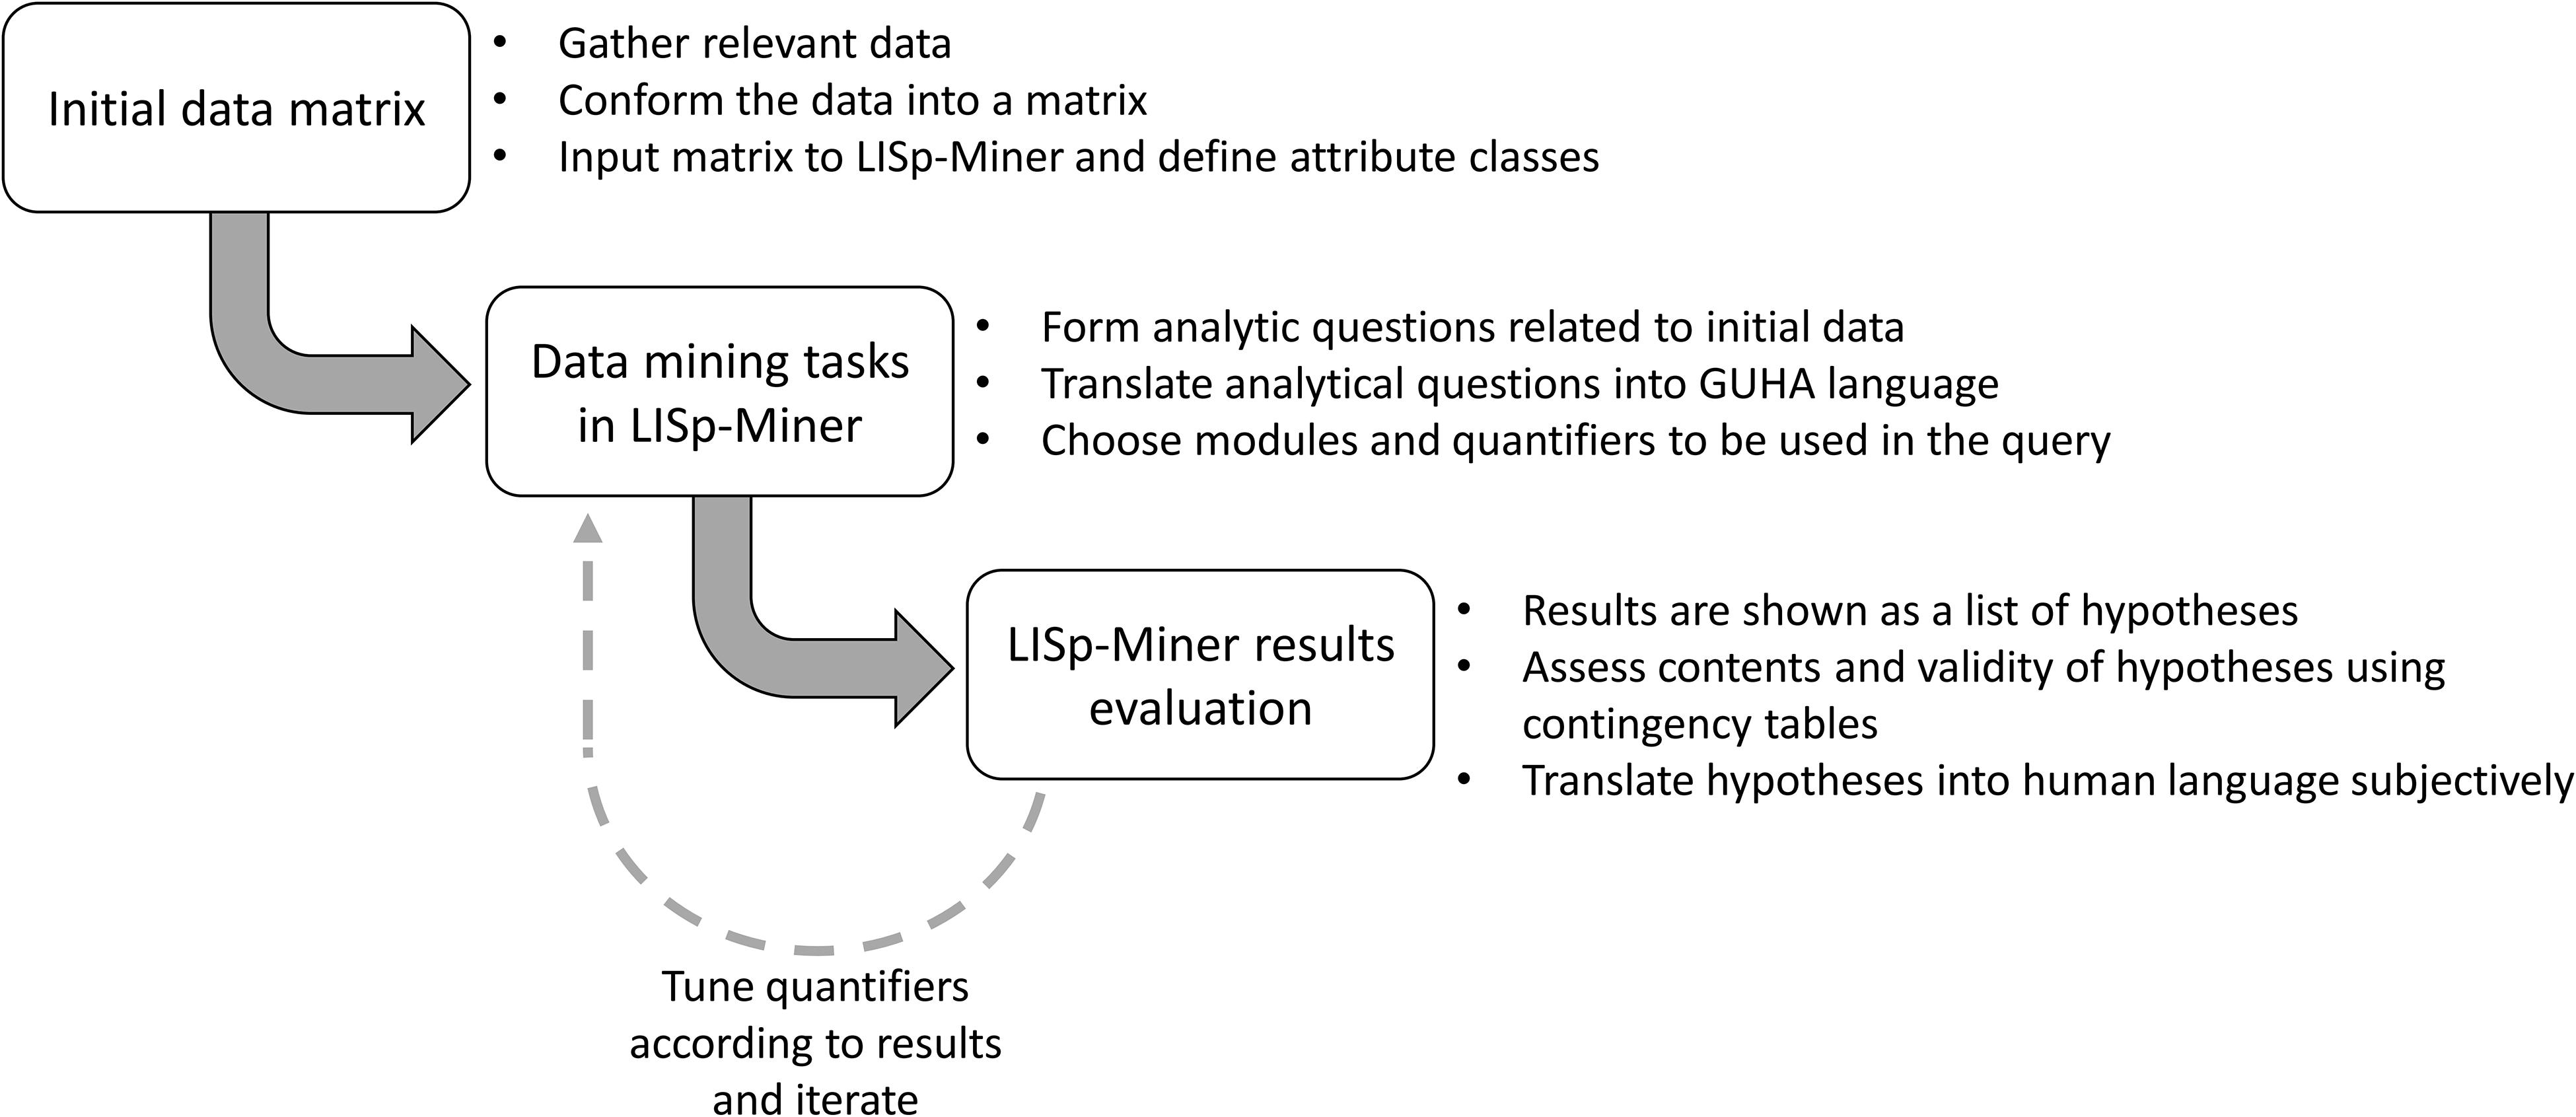
Figure 3. Principle of the data mining process using LISp-Miner.
The boundary conditions of the predicates assigned by the user include antecedents, succedents, conditions, and quantifiers, which adjust the preconditions and consequences of data mining. Adjusting these boundary conditions influences the types and number of results produced. The user should intend to achieve a limited number of results to reveal the strongest correlations within the data.
Antecedents, succedents, and conditions are attributes from the initial data. Any attribute can be set as an antecedent, succedent, or a condition, and any number or combination of attributes can be chosen. Furthermore, the assessment of attribute categories can be adjusted by choosing the coefficient type and length. This process adjusts how many attribute categories are regarded in one category and how the combined categories are comprised.
The results (hypotheses) in the LISp-Miner program are presented to the user as contingency tables (Table 2). Based on the contents of the contingency tables and hypotheses, the user can assess the meaning and importance of the hypotheses and also subjectively examine the initial data and determine the rows from the data that support a hypothesis and those that oppose a hypothesis.
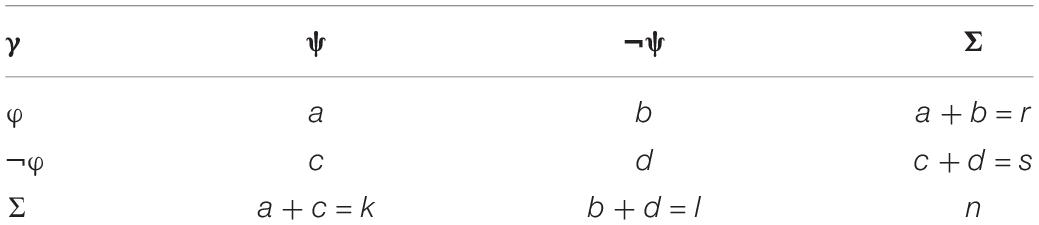
Table 2. Contingency table satisfying condition γ (Berka, 2016; Turunen, 2018).
In Table 2, n is the number of initial data matrix rows regarded in a contingency table (n = a + b + c + d), when a is the number of objects satisfying both φ and ψ; b is the number of objects satisfying φ, but not ψ; c is the number of objects not satisfying φ, but satisfying ψ; and d is the number of objects not satisfying φ nor ψ (Turunen, 2018).
Ten data mining modules have been implemented into the LISp-Miner software, two of which were applied in the investigation of root causes for track geometry deterioration. In the 4ft-Miner module, several quantifiers can be used to evaluate the contingency table antecedent’s (φ) relationship to its succedents (ψ) when condition (γ) is satisfied. In the AC4ft-Miner (action miner) module, two contingency tables are assessed and compared when some attributes remain stable and others change (called flexible attributes) between the tables (Berka, 2016). Pairs of rules specific for each quantifier are available to test the contingency tables’ data.
GUHA quantifiers have an intuitive meaning, for example, “often implies,” “almost equivalent,” and “above average.” Association rules based on quantifiers founded implication (also called p-implication or PIM) and above-average dependence were applied in both modules used. Founded implication assesses the commonness of the relationship p between contingency table parameters a and b. This can be expressed by,
By adjusting p, the user can choose to inquire hypotheses for which the antecedents and succedents are fulfilled in 0 < p ≤ 1 of cases (Rauch, 2013). For example, the query may involve asking in which cases the antecedent φ and succedent ψ are simultaneously fulfilled in more than 90% of cases. In other words, the association between φ and ψ is supported by the data if at least 90% of the cases in which φ is satisfied also ψ is satisfied.
The association rule based on the above-average quantifier tests how much more common succedent ψ is among the antecedents φ in relation to all the instances of ψ in the whole data set. This is defined more explicitly by
when p > 0. Now, by adjusting p, the user can choose how many more times above-average dependence must appear for the hypothesis to be accepted. For example, by choosing p = 1, the software will search the cases in which ψ appears two times more often in relation to φ than ψ appears in the whole data.
Frequencies related to quantifiers are also implemented into the modules. These regulate the Base value: the number of occurrences in different contingency table slots. For example, a quantifier for the contingency table parameter a ≥ Base = 1000 can be given. Then, LISp-Miner will not present any hypotheses for which fewer than 1000 cases have fulfilled the antecedents, succedents, and conditions regardless of other chosen quantifiers.
Examples of how analytical questions are formed to GUHA questions and how hypotheses found by LISp-Miner procedures are interpreted into comprehensible language can be found in the next section.
Results From Applying GUHA to Railway Track Structure Data
In this section, the application of the GUHA method to railway data is demonstrated by conducting three different exemplary GUHA data mining tasks. The demonstrations show how the software is used and the types of results that can be obtained. This section only presents the data mining queries and their results. The results’ domain knowledge interpretations and the possible broader implications to railway domain applications are presented in the discussion.
In the demonstrations, analytical questions about the development of the track structure condition are formed and translated to GUHA language in LISp-Miner, and answers (hypotheses) to the questions are presented. The analytical questions were inquired using the data concerning the Luumäki–Imatra track section. The technical information concerning the queries and their results is composed into Table 3.
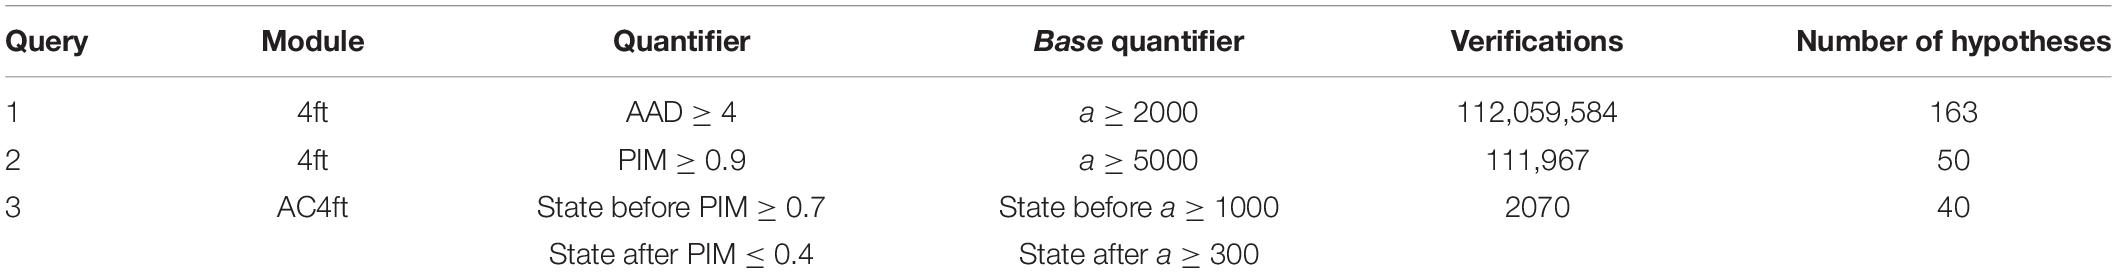
Table 3. Technical information of queries.
Analytical Question 1: What kind of track structure attributes are associated with a certain type of track geometry deterioration rate with more than four times above-average dependence?
The first query was conducted using 4ft-Miner module. Base parameter for contingency table parameter a ≥ 2000 and quantifier over four times above-average dependence were applied. All attributes except for the track geometry deterioration rate could be chosen for antecedents, but the program was limited to choose 2–5 attributes. The only succedent was the track geometry deterioration rate, for which 1–4 sequential classes could be chosen by the program. No conditions were applied.
The query concerning analytical question 1 resulted in 112,059,584 verifications (contingency tables), of which 163 were in accordance with the preconditions (antecedents, succedents, conditions, and quantifiers). These hypotheses were displayed to the user. One of the 163 hypotheses is presented below. Its contingency table is presented in Table 4, and attributes are presented in Table 5.
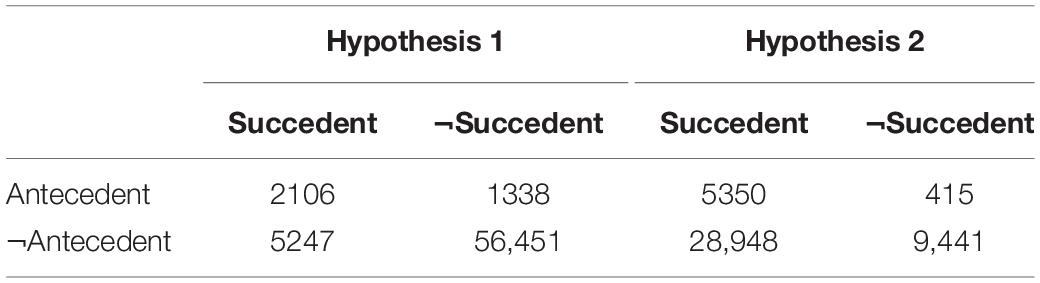
Table 4. Contingency table for analytical question 1 and 2 hypotheses.
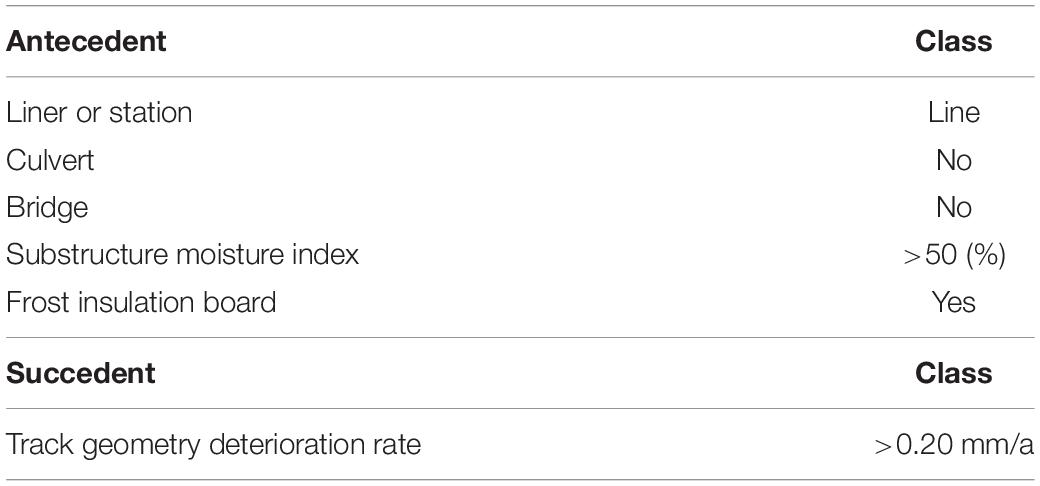
Table 5. Attributes for analytical question 1 hypothesis.
Hypothesis that is one answer to analytical question 1 (statement supported by the data): When the track section is located on a line section that contains no bridges or culverts, its substructure exhibits a high moisture index, and a frost insulation board is installed in the track structure, the highest class of track geometry deterioration rate is observed 4.4 times more often than on average.
No conditions were set for the analytical question 1 query, so the whole track section, composed of 65,142 (=2106 + 1338 + 5247 + 56,451) rows of data, is presented in the hypothesis and contingency table.
Analytical Question 2: What kind of track structure attributes have the highest correlation to some types of track geometry deterioration rate on a line section without track structure discontinuity or frost insulation boards?
Analytical question 2 query was also conducted using the 4ft-Miner module. Base parameter a ≥ 5000 and founded quantifier PIM must be over 90% (p ≥ 0.9) were used. Antecedents included all track structure attributes aside from the track geometry deterioration rate, discontinuity attributes, stations, and frost insulation boards. The succedent included the track geometry deterioration rate, from which the program could choose 1–4 sequential classes. Sections with signaling equipment, stations, culverts, bridges, level crossings, turnouts, and frost insulation boards were excluded using conditions.
Analytical question 2 query resulted in 111,967 verifications, of which 50 were in accordance with the preconditions. One of the 50 hypotheses is presented below. Its contingency table is presented in Table 4, and attributes are presented in Table 6.
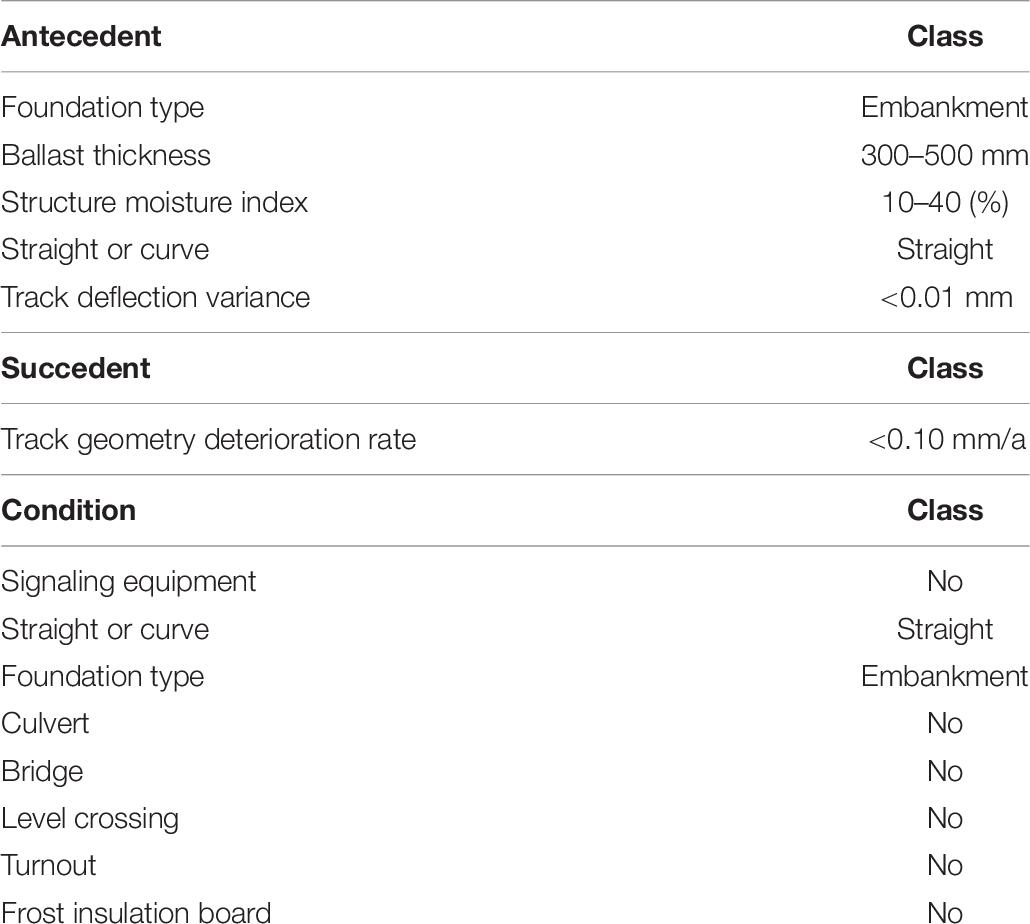
Table 6. Attributes for analytical question 2 hypothesis.
Analytical question 2 hypothesis (statement supported by the data): A lower than average track geometry deterioration rate is observed on 93% of the track structures that are founded on an embankment, exhibit 300- to 500-mm-thick ballast layers, exhibit a low structure moisture index, are located on straights, and have low track deflection variance.
Because conditions were used to exclude certain types of track, only 44,154 (=5350 + 415 + 28,948 + 9441) rows are now presented in the contingency table, meaning that 20,988 rows contained discontinuities, stations, or frost insulation boards and were not included in the data mining task.
Analytical Question 3: If some track structure attributes are stable, how does a change in the attribute for frost insulation boards affect a certain type of track geometry deterioration rate on a line section without track structure discontinuities?
The third analytical question was conducted using the 4ft-Action Miner (AC4ft). Base parameter a ≥ 1000 for the before state and a ≥ 300 for the after state were used. Founded implication p ≥ 0.7 for the before state and p ≤ 0.4 for the after state were applied. Antecedents’ stable part included all track structure attributes except for frost insulation boards, track geometry deterioration rate, stations, and discontinuities. Antecedent attribute part included frost insulation boards. The succedent stable part was the track geometry deterioration rate from which the program could choose 2–4 sequential classes. In the conditions, signaling equipment, stations, culverts, bridges, level crossings, and turnouts were excluded.
Analytical question 3 query resulted in 2070 verifications, which led to 40 results. One of the 40 results is presented below. Its two adjacent contingency tables are presented in Table 7, and attributes are presented in Table 8. There were 47,881 rows of data that met the conditions and were examined in the hypothesis.
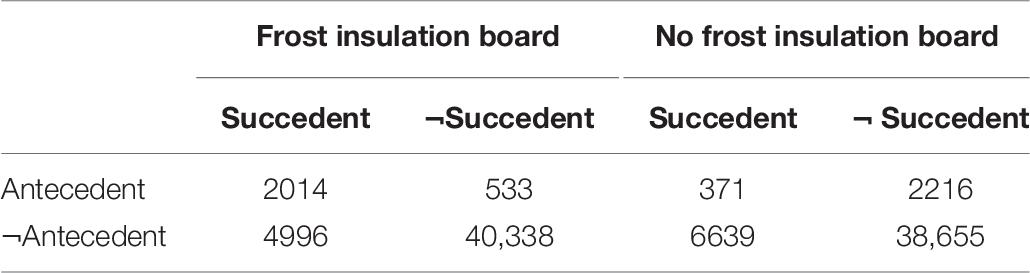
Table 7. Contingency tables for analytical question 3 hypothesis.
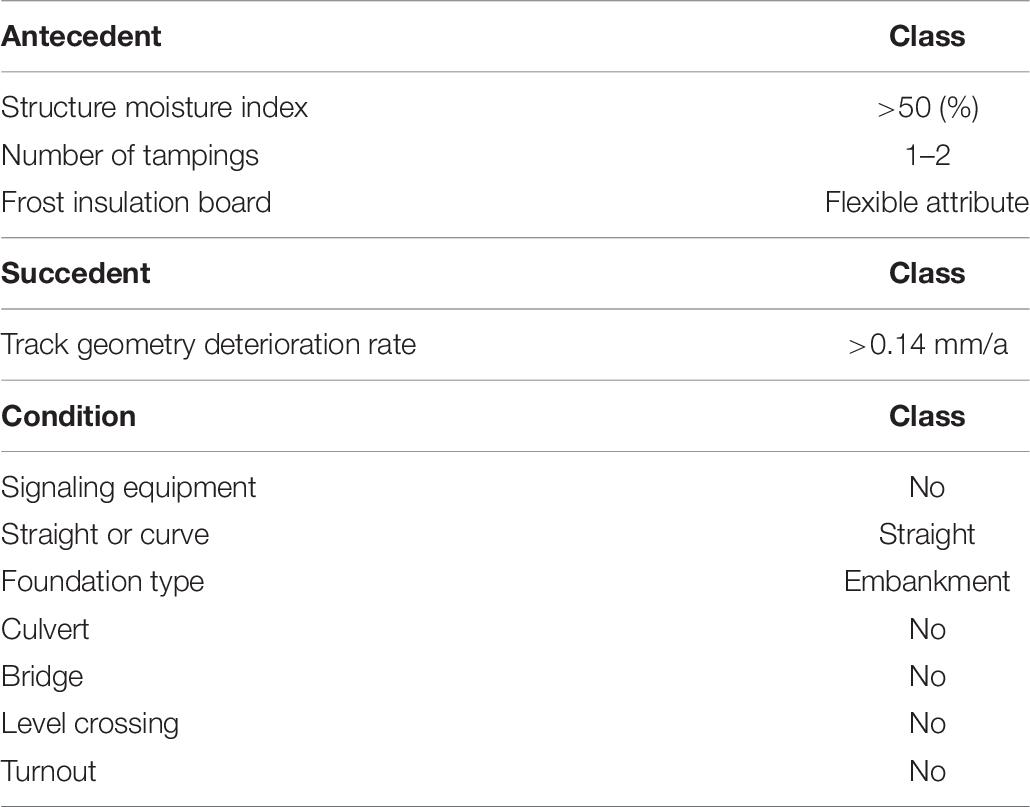
Table 8. Attributes for analytical question 3 hypothesis.
Analytical question 3 hypothesis (statement supported by the data): When the track moisture index is very high and the number of tamping times is low, a high track geometry deterioration rate is observed on 79% of the structures where a frost insulation board has been installed and on 14% of track sections where no frost insulation board has been installed.
Discussion
Case Track Section Data Mining
The hypothesis for analytical question 1 presented the combination of parameters that were more commonly associated with high track geometry deterioration rates, meaning that the track section is abnormal as regards track geometry deterioration, and the hypothesis attributes should be investigated further.
The attributes of the hypothesis include common attributes, such as line sections instead of stations and the exclusion of bridges and culverts. These do not create a distinct attribute combination as the vast majority of the track section shares these attribute types. The other two antecedents are far more infrequent in the data: high substructure moisture index and frost insulation boards. However, these two attribute values are connected due to the GPR measurement technique. Frost insulation boards increase the GPR moisture index of the substructure layer because they cause the GPR signal to deflect and give high readings that would normally indicate the appearance of moisture. Therefore, it is reasonable to deduct that the frost insulation boards are playing a major role in this hypothesis. Based on this information, the areas located on line sections in which frost insulation has been installed should be further investigated. Such investigations have been reported in Sauni et al. (2020).
The analytical question 1 hypothesis has good confidence as more than 2 km of track support the statement, and about 1.3 km of track oppose it. If the same hypothesis were to be created for the rest of the track section, only around 5.2 km of track would support it, and more than 56 km oppose it. Considering these lengths, the behavior of the track section in accordance with the hypothesis antecedents is unusual to say the least.
The hypothesis for analytical question 2 demonstrated the highest correlation to a particular type of track geometry deterioration rate. The result implied that almost all cases (93%) of track sections in accordance with the antecedents exhibit only low track geometry deterioration rates. This correlation does not deviate from the average correlation (75%) of the rest of the track section as much as the correlations in hypothesis for analytical question 1. Nevertheless, this hypothesis showed that the correlation is particularly strong as more than 5 km of track satisfying the antecedents behaves almost uniformly.
The antecedents of the hypothesis for analytical question 2 exhibit properties traditionally associated with good structures such as low moisture and low deflection variance. The results are intuitive and demonstrate that the presumptions regarding the properties presented in the antecedents are justified. Furthermore, when all the hypotheses for analytical question 2 were examined, it was apparent that all hypotheses’ succedents were related to low track geometry deterioration rates. This may be the result of opting out track discontinuities and frost insulation boards from the antecedents.
A difference could be observed between the types of hypotheses obtained from analytical questions 1 and 2. Analytical question 1 produced results concerning abnormal behavior of track structures, whereas analytical question 2 produced results concerning typical behavior.
The third analytical question provided a comparison of two populations that differed by one antecedent class: frost insulation boards. According to one produced hypothesis, the existence of a frost insulation board divides track sections consisting of track built on embankment without discontinuities. On these structures with frost insulation boards, high track geometry deterioration rates are observed on 79% of structures. When only the attribute for frost insulation boards is changed to no frost insulation board, the commonness of high track geometry is practically converse at 14%. This result highlights the major effect of frost insulation boards on the track geometry deterioration rate.
Prospective of GUHA in Railway Track Structure Condition Monitoring
In this section, the use of the tested LISp-Miner GUHA data mining modules and quantifiers is discussed in a broader context regarding railway track structure condition monitoring.
Stochastic analysis of railway track structures inherently leads to handling heterogeneous data that originate from multiple sources. The requirement for an analysis method and software to handle this type of data is met using LISp-Miner, as text, numerals, binary, and categorical data can all be used as they are. Furthermore, missing data and outliers can be handled within the LISp-Miner software when creating attribute categories. Thus, the GUHA method and LISp-Miner software provide an adequate basis for track structure data analysis.
From the heterogeneous track structure data, the GUHA method could be used to ask questions related to correlations between variables and their combinations. Three different types of questions were asked, for which different module-quantifier combinations were used.
The 4ft-Miner module with the PIM quantifier can be used to inquire about the most common types of attribute combinations. For the investigation of the causes of track geometry deterioration, these questions help in understanding the most common types of track structure behavior. This helps in identifying structures, i.e., the combination of attributes that generally exhibit only a certain type of behavior.
The 4ft-Miner module with the above-average quantifier can be used practically for the contrary of purpose as 4ft-Miner with PIM. The above-average quantifier provides extraordinary correlations between variable combinations when compared with other variables’ correlations. In the context of investigating the causes of track geometry deterioration, this approach can be used to detect abnormal behavior of some structure types. This information is of value in detecting the peculiar structure types that exhibit problematic behavior.
The AC4ft-Miner module with the PIM quantifier approach investigates the effects of changing one or some of the attribute classes in a hypothesis. In practice, this method can reveal which attributes have the dominant effect on a certain type of structure’s behavior. This feature can be used to individually detect the attributes contributing to geometry deterioration rate.
The encountered limitations of the GUHA method were the dependence on initial data and the amount of effort required for result analysis. The dependence on initial data stems from the descriptive nature of the method. If the input data do not entail the features affecting the behavior of the structure, the method cannot produce results that exhibit such features. The initial data available for the case track section were vast. However, such data sets are not readily available for all track sections. To ensure reliable and interesting results, the method should be used only if extensive data are available.
The other encountered limitation was the difficulty to communicate the results to people not familiar with GUHA. The contingency tables and attributes can be subjectively translated into comprehensible language, which aids communication. However, some of the translated hypotheses can be difficult to fully comprehend as they might contain many variables and details. To counter the difficulties, visualizing the results should be further researched.
Conclusion
Successful condition monitoring of track geometry requires not only measurements and maintenance responses to deviations but also investigations into the root causes for its deterioration. For the investigations, an approach with flexible data handling and good generalization ability is required. Thus, stochastic models were examined instead of deterministic models as the latter requires much too specific input information, which is not usually available in asset management.
From the stochastic models, an association rule data mining method, GUHA, was selected to be tested. The method is a descriptive data mining method, meaning that it describes the input data and presents it to the user in an informative way. The GUHA method is applied in software, LISp-Miner, which can handle multivariate heterogeneous data and produces hypotheses that are statements generated from the input data.
The use of the GUHA method was tested on actual track structure data from the Finnish state rail network. Three GUHA module-and-quantifier combinations were examined. The results from the data mining were used to generalize the types of domain information that can be investigated using the GUHA method. Three following applications for approaches were identified:
• 4ft-Miner and PIM quantifier identifies the structure types (attribute combinations) that correlate strongly to a certain track geometry deterioration rate.
• 4ft-Miner and above-average quantifier identifies the structure types that exhibit behavior, which differs from the typical behavior of structures.
• AC4ft-Miner module and PIM quantifier identify the structure attributes affecting the behavior of structures when changed.
Using the information obtained from these approaches, the causes of track geometry deterioration can be investigated from asset data. The method points out the structure types correlating to certain behavior and identifies the attributes governing the behavior. The main limitation of the method is the dependence to the input data. If a feature is not depicted in the initial data, it cannot be present in the results either. The GUHA method and LISp-Miner contain many more approaches in addition to the three tested ones. Exploring the applicability of these in the future would be valuable.
Data Availability Statement
The raw data supporting the conclusions of this article will be made available by the authors, without undue reservation.
Author Contributions
MS was responsible for gathering and processing the initial data and conducting the data mining. HL and PK were responsible for organizing the research and participated in the analysis of the data mining results. ET supervised the data mining process. All authors contributed to the article and approved the submitted version.
Funding
This research was funded by the Finnish Transport Infrastructure Agency (Väylä) and the Tampere University Foundation sr.
Conflict of Interest
The authors declare that the research was conducted in the absence of any commercial or financial relationships that could be construed as a potential conflict of interest.
Acknowledgments
The authors would like to thank our funder, the Finnish Transport Infrastructure Agency (Väylä), and the valued cooperation between Tampere University and Väylä.
References
Agrawal, R., Imielinski, T., and Swami, A. (1993). “Mining association rules between sets of items in large databases. SIGMOD’93,” in Proceedings of the 1993 ACM SIGMOD International Conference on Management of Data, New York, NY: ACM, 207–2016.
Andrews, J. D., Prescott, D., and De Rozieres, F. (2014). A stochastic model for railway track asset management. Reliab. Eng. Syst. Saf. 130, 76–84. doi: 10.1016/j.ress.2014.04.021
Audley, M., and Andrews, J. D. (2013). The effects of tamping on railway track geometry degradation. Proc. Inst. Mech. Eng. Part F J. Rail Rapid Transit. 227, 376–391. doi: 10.1177/0954409713480439
Berawi, A. R. B., Delgado, R., Calçada, R., and Vale, C. (2010). Evaluating track geometrical quality through different methodologies. IJTech 1, 38–47. doi: 10.14716/ijtech.v1i1.35
Dahlberg, T. (2001). Some railroad settlement models–a critical review. Proc. IMechE. Part FJ Rail and Rapid Transit. 215, 289–300. doi: 10.1243/0954409011531585
Dahlberg, T. (2010). Railway track stiffness variations – consequences and countermeasures. Int. J. Civil Eng. 8, 1–12.
Dunham, M. (2003). Basic Data Mining Tasks. Data Mining Introductory and Advanced Topics. New Jersey: Prentice Hall, 5–9.
Fayyad, U., Piatetsky-Shapiro, G., and Padhraic, S. (1996). From data mining to knowledge discovery in databases. AI Magazine 17, 37–54.
Guler, H., Evren, G., and Jovanovic, S. (2011). Modelling railway track geometry deterioration. Proc. Inst. Civ. Eng. Transp. 162, 65–75. doi: 10.1680/tran.2011.164.2.65
Hájek, P., and Havránek, T. (1978). Mechanizing Hypothesis Formation: Mathematical Foundations for a General Theory, 1st Edn. Berlin: Springer.
Hájek, P., Holeňa, M., and Rauch, J. (2010). The GUHA method and its meaning for data mining. J. Comput. Syst. Sci. 76, 34–48. doi: 10.1016/j.jcss.2009.05.004
Higgins, C., and Liu, X. (2018). Modeling of track geometry degradation and decisions on safety and maintenance: a literature review and possible future research directions. Proc. IMechE. Part FJ Rail Rapid Transit. 232, 1385–1397. doi: 10.1177/0954409717721870
Jain, A., Murty, M., and Flynn, P. (1999). Data clustering: a review. ACM Comput. Surv. 31, 264–323.
Li, D., and Davis, D. (2005). Transition of railroad bridge approaches. J. Geotech. Geoenviron. Eng. 131, 1392–1398. doi: 10.1061/(ASCE)1090-02412005131:111392
Luomala, H., Rantala, T., Kolisoja, P., and Mäkelä, E. (2017). “Assessment of track quality using continuous track stiffness measurements,” in Georail 2017, 3rd International Symposium Railway Geotechnical Engineering, (Marne La Vallée: IFSTTAR), 281–290.
Novák, N., Perfilieva, I., Dvořák, A., Chen, G., Wei, Q., and Yan, P. (2008). Mining pure linguistic associations from numerical data. Int. J. Approximate Reasoning. 48, 4–22.
Piché, R., Järvenpää, M., Turunen, E., and Šimu̇nek, M. (2014). Bayesian analysis of GUHA hypotheses. J. Intell. Inf. Syst. 1, 42–47. doi: 10.1007/s10844-013-0255-6
Rauch, J. (2013). “Observational calculi and association rules,” in Studies in Computational Intelligence, 1st Edn, Vol. 469(Berlin: Springer).
Sadeghi, J., and Askarinejad, H. (2009). An investigation into the effects of track structural conditions on railway track geometry deviations. Proc. IMechE. Part F J Rail Rapid Transit. 223, 415–425. doi: 10.1243/09544097JRRT266
Sadeghi, J., and Askarinejad, H. (2012). Application of neural networks in evaluation of railway track quality condition. J. Mech. Sci. Technol. 26, 113–122. doi: 10.1007/s12206-011-1016-5
Sauni, M., Luomala, H., Kolisoja, P., and Turunen, E. (2020). “Determining sampling points using railway track structure data analysis,” in Proceedings of the 3rd International Conference (ICITG). Guimarães: Springer, 841–856. doi: 10.1007/978-3-030-32029-4_71
Tsui, K. L., Chen, V., Jiang, W., and Alp Aslandogan, Y. (2006). “Data Mining Methods and Applications,” in Springer Handbook of Engineering Statistics, ed. H. Pham (London, UK: Springer-Verlag), 651–669.
Turunen, E. (2018). Paraconsistent many–valued logic in GUHA framework. Acta Informatica Pragensia. 7, 104–111. doi: 10.18267/j.aip.116
Keywords: association rules, condition monitoring, data mining, railway track, track geometry deterioration
Citation: Sauni M, Luomala H, Kolisoja P and Turunen E (2020) Investigating Root Causes of Railway Track Geometry Deterioration – A Data Mining Approach. Front. Built Environ. 6:122. doi: 10.3389/fbuil.2020.00122
Received: 26 May 2020; Accepted: 07 July 2020;
Published: 03 August 2020.
Edited by:
Sakdirat Kaewunruen, University of Birmingham, United KingdomReviewed by:
Ruilin You, China Academy of Railway Sciences, ChinaMohd Haniff Bin Osman, Universiti Kebangsaan Malaysia, Malaysia
Copyright © 2020 Sauni, Luomala, Kolisoja and Turunen. This is an open-access article distributed under the terms of the Creative Commons Attribution License (CC BY). The use, distribution or reproduction in other forums is permitted, provided the original author(s) and the copyright owner(s) are credited and that the original publication in this journal is cited, in accordance with accepted academic practice. No use, distribution or reproduction is permitted which does not comply with these terms.
*Correspondence: Mikko Sauni, bWlra28uc2F1bmlAdHVuaS5maQ==