 Arash Taghinezhad
 Carol J. Friedland
 Robert V. Rohli
 Brian D. Marx
- Bert S. Turner Department of Construction Management, Louisiana State University, Baton Rouge, LA, United States
Purpose: Statistical data imputation methods are important in a wide range of scientific research; however, in construction management research, they are not used widely. Specifically, in research for building loss studies due to extreme hazard events, data are frequently missing, inaccessible, spurious, or expensive to collect. First-floor elevation (FFE) data are vital in building flood loss analysis, so the lack of high-quality FFE data before and/or after elevating structures represents a major barrier to understanding avoided loss (AL) in flood mitigation projects. While a few guidelines exist to estimate FFE, the guidelines lack information on estimation of FFE for mitigated and non-mitigated buildings. Existing techniques tend to rely on recommendations by professional engineers that have not been evaluated for statistical fit in elevated homes in Louisiana, United States.
Methods: This Louisiana-based case study statistically evaluates the effectiveness of existing guidelines on building elevation data. Furthermore, it provides a state-of-the-art methodology to impute missing FFE data statistically for buildings in mitigated and unmitigated conditions without relying on building foundation-type data, which itself is commonly needed but often missing in previous building mitigation AL studies.
Findings: Results here suggest that existing guidelines for FFE estimation match reported FFE only moderately well in flood-mitigated residences in Louisiana. Moreover, an update and inclusion of foundation-type data in the guidelines would improve FFE estimates for Louisiana homes. Among the imputation methods by multiple linear regression, random forest, and generalized additive models (GAM) overlay, the GAM model performs most effectively based on the accuracy in data imputation for missing FFE data. These results will assist builders, developers, and communities in their quest to enhance resilience to the ever-increasing flood hazard.
Introduction
Background
Hazard mitigation is any intentional action that decreases loss from natural disaster events by reducing vulnerability. Avoided loss (AL) analysis is the main tool for measuring the economic value of the benefit of hazard mitigation actions (Orooji, 2015). Because flooding is the most common natural disaster in the United States (FEMA, 2014), improved accuracy in AL analysis of flood-mitigated properties is crucial. To calculate the AL, the loss with and without mitigation strategy must be compared together (Taghinezhad et al., 2020). Flood loss functions are used to calculate the flood loss in buildings. These functions, often referred to as depth–damage curves (e.g., Gulf Engineers & Consultants [GEC], 2006; FEMA, 2015), are based on a single independent variable—the depth of floodwater above the first floor of a building. Thus, for flood loss analysis, two factors must be known—the floodwater elevation and the building FFE. Although FFE is an essential component in flood loss calculation, all too often building FFE information is unavailable due to the costly nature of elevation certificate preparation (FEMA, 2011b), for which a licensed surveyor is required, as well as the cost and effort required to maintain community building databases.
Determining the AL of implemented flood mitigation projects requires comprehensive project data. However, since this is often done for building stocks in a large region (e.g., cities, states), considering the limitations of data sources, including missing data, is important. One of the most important variables in flood loss analysis is first-floor elevation (FFE) (Nofal and van de Lindt, 2020); however, unavailability or illegibility of documents often leads to missing FFE data. While estimation methods based on the technical or engineering guidelines can be used to populate the missing FFE data, imputation methods based on statistical analysis are a faster way to replace the missing data with the approximate estimate of data. Also, in some cases with the lack of well-developed engineering guidelines, imputation can be the only option for populating the missing data. In addition, it is an effective way to validate the technical or engineering guidelines because it is adaptable based on “real world” data, specific to building properties and locations, and it does not have the limitation or assumptions that exist in guidelines.
Missing data is a common issue in analyzing big data (Zhang, 2016). Imputation is the systematic process of filling missing data in a dataset through a variety of scientific estimation methods (Marwala, 2009). In data analysis, imputation is required when the deletion of observations with missing data biases the analysis and when incomplete data decrease analysis efficiency or prevent analysis (Barnard and Meng, 1999). Imputation methods have been widely implemented in statistical analyses of clinical and public health experiments with missing data (e.g., van Buuren et al., 1999; Hawthorne and Elliott, 2005; van der Heijden et al., 2006; Burton et al., 2007; Newgard and Haukoos, 2007). In the field of hazard mitigation, Pita et al. (2011) successfully applied imputation methods to address missing building roof shape data required in hurricane wind loss analysis. While statistical imputation methods are widely applied in scientific fields, hazard mitigation literature demonstrates a lack of integration of imputation for missing or unknown building information.
Aim and Objectives
This article aims to improve the quality of building stock data for natural disaster analysis when the missing data represent a barrier that leads to decreased accuracy or loss of useful data. To reach this goal, we introduce the idea of applying statistical imputation methods for populating the missing FFE data, based on accessible information for most buildings. Advanced statistical methods (e.g., machine learning methods) are used to impute missing data, and the results are compared internally through statistical cross-validation (CV) methods and externally with existing engineering guidelines. Therefore, the specific objectives of this research are as follows:
• To impute the FFE data with advanced statistical methods.
• To evaluate the accuracy of the imputation results by using advanced statistical methods.
• To evaluate existing engineering guidelines for missing FFE data with observations from flood-mitigated buildings in Louisiana, United States, and the results of statistical data imputation methods.
Methods
The Louisiana Governor’s Office of Homeland Security & Emergency Preparedness (GOHSEP) data that are available through the Louisiana Hazard Mitigation (LAHM) online portal are used for imputation modeling on flood-mitigated buildings. The FFE before and after mitigation is imputed for flood mitigation projects, using several statistical models, including four multiple linear regression, two random forests, and four GAM models. The leave one out cross-validation root-mean-square error (LOOCVRMSE) method was implemented to assess model performance. To validate the Federal Emergency Management Agency (FEMA) guidelines for estimating missing FFE data, scenarios are explored that consider FFEs based on known foundation types and on statistically generated foundation types. Mean square error (MSE), F-test, t-test, and analysis of variance (ANOVA) are used to assess the relative effectiveness of the FFE estimation and imputation methods for populating the missing information.
Contribution and Implications of Research
This research contributes significantly to the field of study by eliminating the barrier of unknown foundation type as required information in FEMA guidelines for estimating missing FFE data and by providing advanced statistical models to impute missing data. Additionally, this research provides a methodology to impute the missing FFE data separately for buildings before and after mitigation, which is important in AL analysis for elevation and reconstruction mitigation project types. The statistical models provide an interpretable demonstration for FFE data based on accessible independent variables of base flood elevation (BFE) and digital elevation models (DEMs). Finally, the few current guidelines for FFE estimation and foundation distribution in Louisiana are evaluated statistically, which can be helpful for development of future guidelines.
Literature Review
Regression and Decision Tree
Previous research has demonstrated that statistical imputation methods can handle missing data successfully. Regression imputation is a traditional method to deal with missing data as an improvement on mean, median, or mode imputation models (Zhang, 2016), as it evaluates the relationship between missing data and other independent variables. However, when data deviate strongly from linearity or normality and have many outliers, the violation of the regression assumption presents a barrier. Alternatively, decision trees, either associated with or independently of a “random forest” methodology (Breiman, 2001), can be used for imputation, especially when the data can be clustered effectively. The results of the classification and regression tree (CART) can vary based on the researcher-defined criteria for splitting trees on each node (Breiman et al., 1984; Breiman, 2017). Therefore, a random forest method was developed to improve the results of CART by generating multiple decision trees using resampling methods. The CART and random forest methods offer the advantage of avoiding the need for making the assumptions of regression analysis and can be implemented on data with any distribution (Breiman, 2001). For instance, Shataee et al. (2012) found that random forest yielded stronger imputation results than k-nearest neighbor and support vector machine regression, as evidenced by the CV RMSE to identify the error rate of each model.
Generalized Additive Model
The generalized additive model (GAM) is another effective imputation method for predicting when the independent variables have a non-linear association with the dependent variable (Moore et al., 2011). GAM has been found to provide valid interpretability on the flexible non-linear behavior of each independent variable (Larsen, 2015). Because GAM is capable of using smoothing functions to fit non-linear models, it can be effective for showing the quality of the fit, along with the confidence interval, for each independent variable. Some examples of GAM imputation are those of McKechnie et al. (2013) to impute the missing data for a spatial fishing study and Cugliari et al. (2018) to impute missing daily extremes temperature data.
Imputation in Construction
Imputation has also been used for building studies. For instance, Posenato et al. (2010) and Chen et al. (2018) used imputation in structural health monitoring research. Inman et al. (2015) used imputation for modeling building electrical demand. In the field of hazard mitigation. Pita et al. (2011) imputed missing roof shape data using Bayesian belief networks (BBN) and CART methods. That study assumed that data are missing at random, and 10-fold CV suggested that CART was effective for imputation. Also, there is a dearth of research using imputation in hazard mitigation research. Despite the fact that FFE data before and/or after mitigation are commonly missing, few have attempted methods to handle the missing FFE information. Although FEMA publications based on expert opinion provide some default values for missing FFE data, such estimations generally have not been validated in scientific studies and are not always available.
LAHM Data
This study employs data from 1356 flood-mitigated single-family homes that were funded by FEMA in Louisiana between 2005 and 2015. The flood mitigation strategies in this study are elevation (i.e., elevating an existing structure), reconstruction (i.e., demolishing and rebuilding an existing structure with a new FFE level), and acquisition (i.e., purchasing a floodprone building to move residents out of an area with high probability of flooding). The data for flood-mitigated buildings were accessed through the LAHM online portal, which is accessible only to authorized users. The data acquisition was accomplished by the efforts of a group of graduate students in 18 months, and it covers the mitigation projects obligated by FEMA after Hurricanes Katrina and Rita (2005), Gustav (2008), and several other significant flood events in Louisiana. In the LAHM website, each FEMA project number includes one or more properties. Multiple scanned documents pertaining to the application process and other clerical documents associated with the grant are available for most of the FEMA-funded properties in Louisiana during the study period.
After an initial search for available data on the LAHM website, data collection templates were developed to ensure continuity and uniformity throughout the data collection process. The collection effort provided maximum achievable information for application in the flood loss analysis. Some of the data fields for flood mitigation projects were recognized as critical for performing flood loss analysis. For instance, missing critical values of “address,” “building replacement value,” “building type,” “number of stories,” “initial elevation (m),” and “final elevation (m)” in the original LAHM online dataset made more than two-thirds of the “elevation” projects unsuitable for analysis here.
Pre-analysis data processing was required to provide consistency in collected data across different mitigation projects and to eliminate or minimize spurious data. Table 1 summarizes the solution for each step of data processing before imputation analysis. Each of these processes is described more in detail in the following paragraphs.
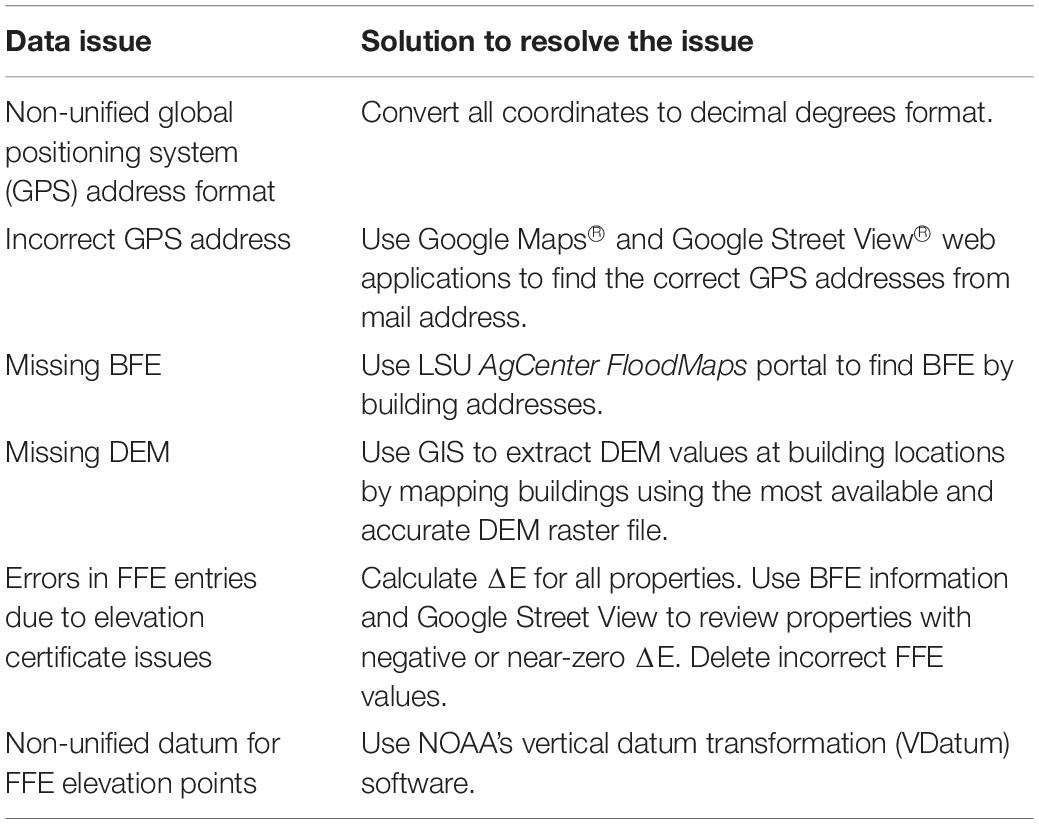
Table 1. Pre-analysis data processing summary for imputing first-floor elevation data for flood-mitigated properties (2005–2015) in Louisiana.
After converting geographical coordinates of buildings in some FEMA documents from degrees–minutes–seconds to decimal degree format, it was realized that some of the locations specified in documents did not match the addresses of projects as reported in the database, possibly because of improper completion of the FEMA grant application forms. Therefore, all collected data were re-checked for correspondence to actual project addresses. The Google Maps® and Google Street View® web applications were used to match the building addresses with written addresses on the application forms to clarify the suspect addresses.
Base flood elevation and digital elevation model were the two variables used for imputation of missing FFE data. The BFE data were collected from elevation certificates, which are commonly used and legitimate sources for confirming the building’s elevation above sea level, both before and after mitigation. Unfortunately, however, the BFE of many buildings is unavailable in FEMA documents due to missing elevation certificate documents. The missing BFE data for many such cases were acquired by using the LSU AgCenter FloodMaps Portal1. Some buildings had multiple elevation certificates for before and after mitigation. Since the elevation certificate does not indicate whether the elevation data are for pre- or post-mitigation, to ensure that FFE data appear valid for representing pre- and post-mitigation, the mitigated buildings with a lower FFE than before mitigation were discarded. For buildings in the elevation and reconstruction mitigation strategy categories, 17 properties of the 248 with available data (6.8%) have a negative change in elevation (ΔE), and five other properties (2.0%) have ΔE with a value between 0 and +30 cm (1 ft). After reviewing these properties on the Google Street View® web application, it was concluded that all 22 of the elevations were reported incorrectly in LAHM documents because the property photographs were shown to have ΔE exceeding one foot, so they were discarded. In addition, the presence of multiple elevation certificates for some buildings complicated the data collection process. Such cases were noted in the spreadsheet and values were removed and imputed as missing data by statistical analysis.
The ground elevation, obtained from the United States Geological Survey (USGS) DEMs at building locations, is vital information for both flood loss analysis and data imputation. DEM values at the building locations were obtained by extracting the building locations from the best available DEM raster file for Louisiana. Each elevation value in the elevation certificates is based on a vertical datum for measurement of heights above sea level. The FFE in some elevation certificates lacks a uniform vertical datum. Therefore, elevation data for the 124 observations that referenced the National Geodetic Vertical Datum of 1929 (NGVD29) were transformed to North American Vertical Datum of 1988 (NAVD88) using the National Oceanic and Atmospheric Administration’s (NOAA’s) vertical datum transformation (VDatum) software. To show the effect of using a non-uniform vertical datum, the datum difference (Δ) was calculated by subtracting the NAVD88 vertical height from NGVD29 vertical height (cm). Figure 1 shows that the maximum ΔD is 10 cm and the minimum is −4 cm.
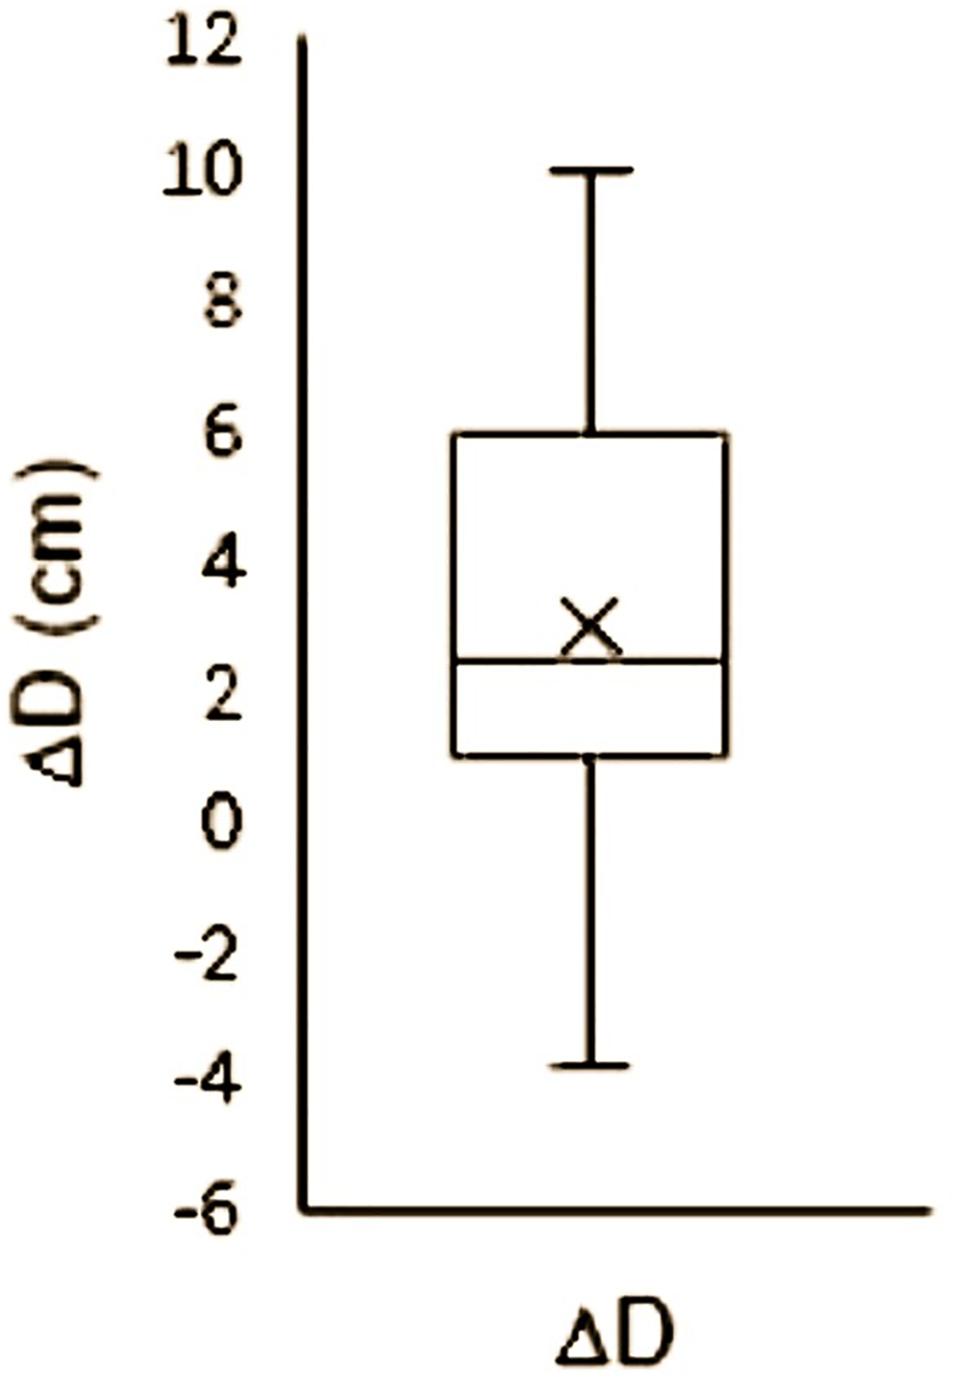
Figure 1. Boxplot for NGVD29 and NAVD88 datum difference for flood-mitigated buildings in Louisiana (2005–2015) with mean (× symbol), median, and interquartile data range.
Randomness of Data
Recognizing the features of the missing data is important to determine the most appropriate way to impute the data. Data can be missing completely at random, missing at random, or missing not at random. If data are missing completely at random, the missingness of observations would have the same probability for all cases. Therefore, the missing values can be deleted and only the observations with complete data may be selected for analysis. In contrast, data that are missing at random may have relationships between missing data and other observations; therefore, the imputation can populate the missing data based on the other related variables, which are important toward a valid analysis. When data are missing at random, their deletion may remove valuable information. Therefore, imputation methods must preserve that valuable information (Zhang, 2016). Data that are missing not at random depend on information that does not exist in the dataset. Therefore, these data cannot be imputed using observed information (Little and Rubin, 2014).
The missing information in this study resulted from documentation deficiencies or illegibility of scanned PDF documents. Therefore, the data were assumed to be either missing completely at random or missing at random. To test the data for missing completely at random, Little’s missing completely at random test (Little, 1988) was used. The null hypothesis of Little’s missing completely at random test is that data are missing completely at random. Therefore, a Chi-square p-value less than 0.05 suggests that null hypothesis of missing completely at random is rejected.
FEMA Data
Two publications (FEMA, 2013, 2015) are selected to use for FFE imputation. According to FEMA (2013), in St. Tammany Parish, Louisiana, after Hurricane Isaac in 2012, the default height above grade to top of finished floor (H) is estimated to be 1.22, 0.76, and 0.30 (m) above grade (D) for basement, crawl space or pier and beam, and slab foundations, respectively. FEMA (2013) obtained these estimates from FEMA (2011a). Equation 1 is used to calculate FFE0 based on the estimated values of H in the FEMA methodology.
To estimate the FFE0 by defined methodology in FEMA (2015), the distribution of foundation type (i.e., pile, pier, solid wall, basement, crawl space, fill, and slab on grade) in each area, based on the building flood zone as defined in FEMA guidelines (e.g., FEMA, 2007), must be determined. The building’s location regarding flood zones is recognized as riverine (areas with the probability of flood caused by water flow from rainfall) and coastal (areas prone to coastal flooding). Pre-flood insurance rate map (FIRM) and post-FIRM also needed to be considered. The pre-FIRM is used for buildings constructed or substantially improved before December 31, 1974, or before the effective date of an initial FIRM. The post-FIRM is used for buildings constructed or substantially improved after December 31, 1974, or after the effective date of an initial FIRM (FEMA, 2010). The distribution of foundation type for residential buildings relevant to Louisiana based on flood map location is provided in Table 2.
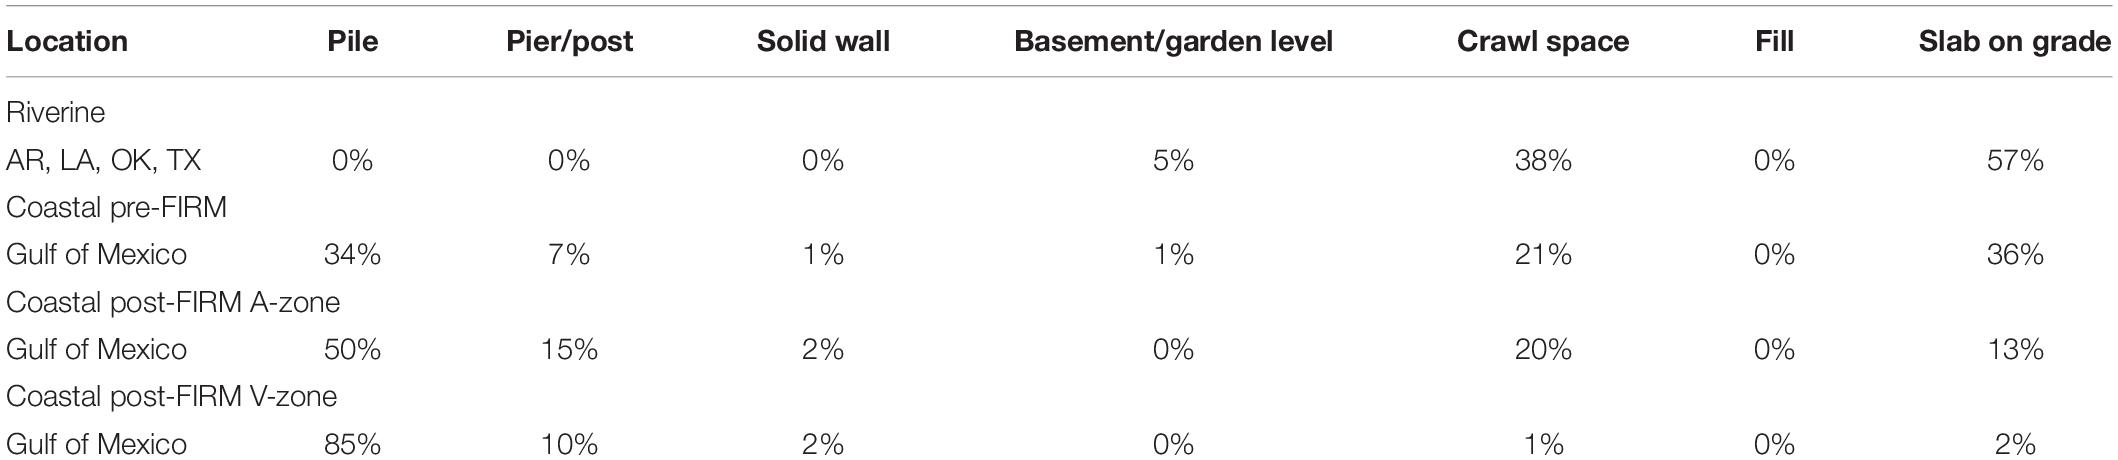
Table 2. Distribution of foundation type for sampled residential homes in Louisiana (FEMA, 2015).
The FFE0 in FEMA (2015) method was calculated by H values in Table 3 and Eq. 1. The H values in Table 3 were calculated using information from the foundation type estimates in the previous table and building conditions in the flood maps.
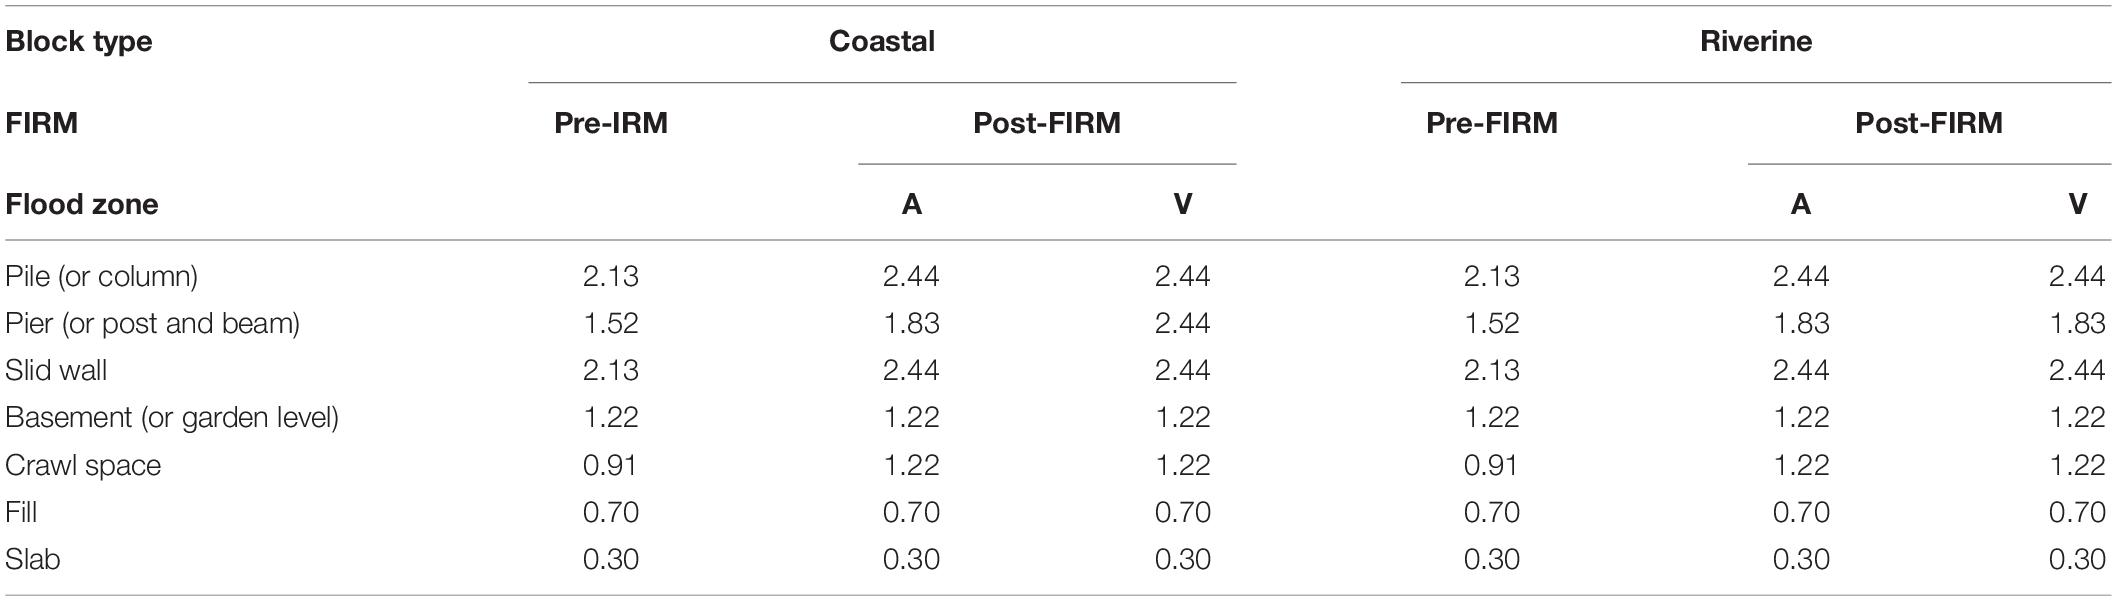
Table 3. Default height (m) above grade to top of finished floor (FEMA, 2015).
Materials and Methods
The methods described in this section were used to impute missing first floor elevation before elevating (FFE0) and first floor elevation after elevating (FFE1) data. The results from the FFE0 imputation were compared with FFE estimations from FEMA guidelines in the section “Results.” Resulting values from imputations from this methodology and estimations from FEMA methods were compared.
Leave-One-Out Cross-Validation RMSE
The LOOCV RMSE method was selected to find a statistical model with the lowest error rate for use in imputation. To obtain the RMSE, the model was built by separating the data into training and test sets. In LOOCV, the training set was constructed on N−1 observations, where LO is the LOOCV RMSE, N is the total number of observations in the dataset, and and Yi are the predicted and actual values of omitted observation i, respectively (Eq. 2). Thus, the RMSE of the fitted data vs. the training set only tests the prediction error on one random observation iteratively, until the error rate for all individual observations was calculated in the dataset.
Regression
Statistical regression techniques were used to impute the missing information of FFE based on the available data. Because DEM (D) and BFE (B) are two accessible, independent variables related to the FFE, these two variables were used in regression models to impute missing FFE data. The validity of assumptions was tested for each regression model, including Shapiro–Wilk for normality, Breusch–Pagan for homoscedasticity or homogeneity of variance, and variance inflation factor (VIF) for quantification of multicollinearity in multivariable models. The regression LOOCV RMSE, along with adjusted R2, R2, and consideration of regression assumptions, was used to enhance the selection of a proper imputation model for FFE0 and FFE1. Four models were examined to identify the best regression fit to predict the FFE0 and FFE1 (Table 4), where is the estimated intercept coefficient and, and are the coefficient estimates of the independent variables.
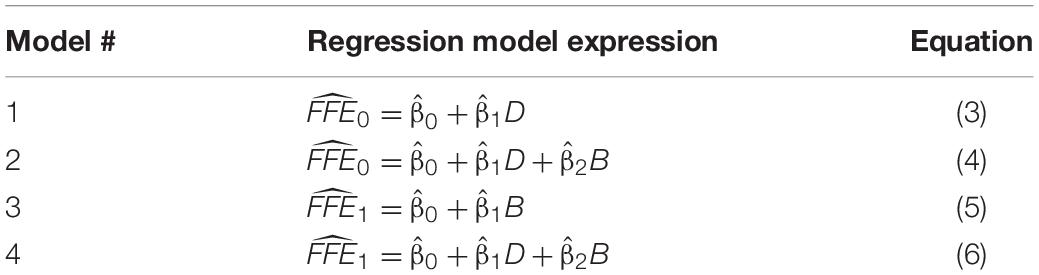
Table 4. Regression models evaluated.
Random Forest and GAM
Random forest (Breiman, 2001) is a robust data mining model used for both prediction (i.e., regression) and classification. This model is constructed based on the equal averaging of many random trees in the CART method (Breiman, 2001, 2017) to obtain a model with reduced variance (Trevor et al., 2009b). In the random forest, every tree is created by a bootstrap sample from the training data, a subset of variables are selected at each split of tree, and each tree grows to a maximum depth without pruning (Breiman, 2001; Cutler et al., 2007). Such trees are very adept to capture complex non-additive or interactive behavior among variables. Random forest imputes missing values using the median of numeric variables and the mode of categorical variables (Breiman, 2001). The “randomForest” package in the R program is used for random forest analysis in this study.
The other model tested for imputation is the GAM, which is an additive modeling technique to predict a dependent variable using independent variables and a flexible smoothing function on some or all of the independent variables (Hastie and Tibshirani, 1990). This model allows inclusion of a non-linear independent variable possibly having a non-normal error distribution (Guisan et al., 2002). In GAM, the shape of the relationship among variables is determined by observations; therefore, the relationships can have non-linear shapes (Trevor et al., 2009a). The general form of the GAM for use in imputation with two independent variables is shown in Eq. 7, where μ(X) is the conditional mean of the dependent variable (e.g., Gaussian), g is the link function (e.g., identity link with normal response) and, f1 and f2 are the arbitrary trends for independent variables f1 and f2, respectively, that can be estimated by non-linear smoothers (e.g., smoothing splines):
The “gam” package in R was used for GAM imputation, and the smoothing spline with four degrees of freedom was used as smoothing function for all independent variables in the model. Four models based on the random forest and GAM methods were examined to identify the best prediction models for FFE0 and FFE1; these models are represented in Table 5.
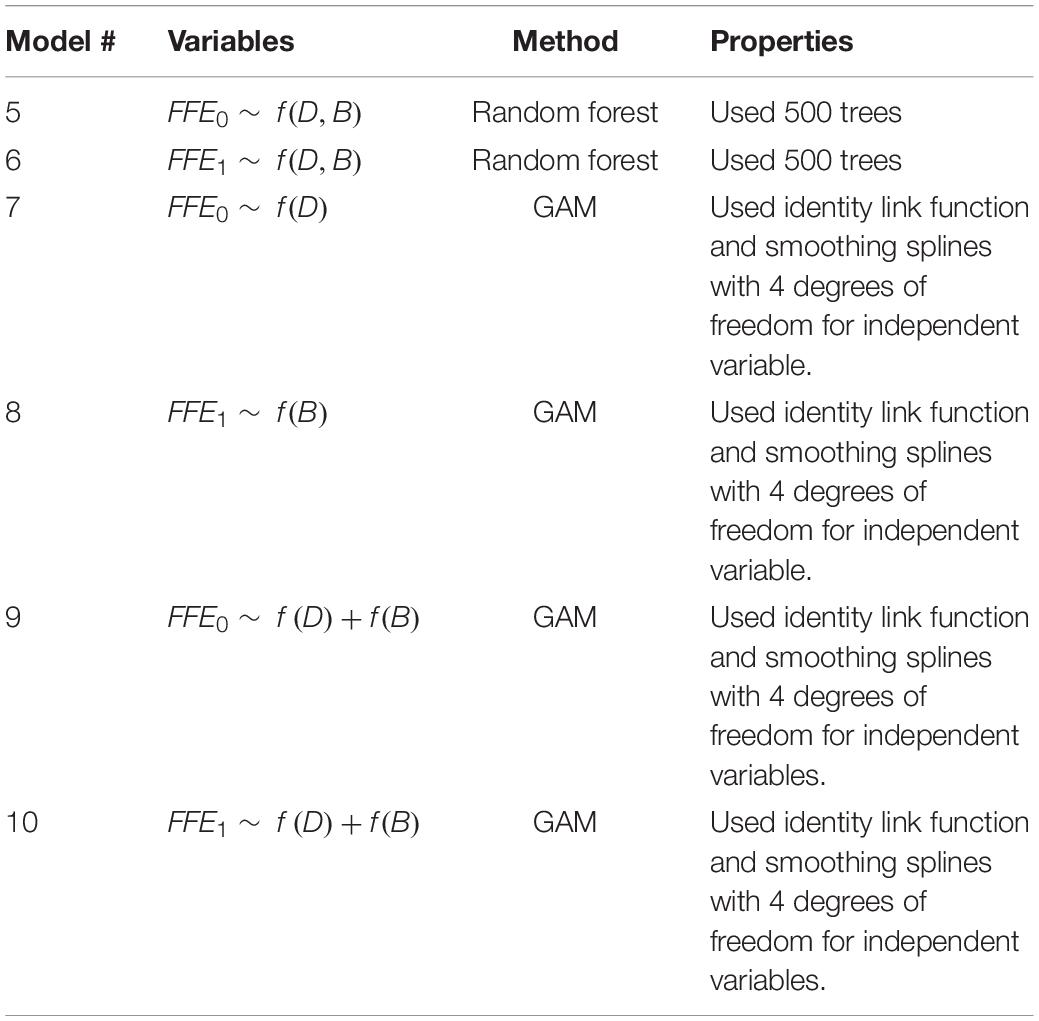
Table 5. Random forest and GAM models evaluated.
Comparison With Data in Literature
To compare the imputation results from selected statistical model and estimation results from FEMA guidance, the imputation and estimation results were compared with the LAHM data with no missing information. The MSE was used to measure the error rate of the imputation and FEMA prediction with the LAHM data. Thus, the model with minimum MSE has a lower error rate and better prediction accuracy. The statistical testing for equality of mean and variance between imputed or estimated data and LAHM data with no missing information was also implemented. The following comparisons were made:
• FFE0 (imputed) vs. FFE0 (LAHM).
• FFE0 [estimated by FEMA (2013)] vs. FFE0 (LAHM).
• FFE0 [estimated by FEMA (2015) with known foundation type] vs. FFE0 (LAHM).
• FFE0 [estimated by FEMA (2015) with simulated foundation type] vs. FFE0 (LAHM).
• FFE1 (imputed) vs. FFE1 (LAHM).
To test the equality of variance between each group, which is required to choose a correct t-test, the F-test is conducted as , where represents the variance of one sample (highest variance) and is the variance of the other sample (lowest variance).
After conducting the F-test, data were compared using a t-test for equality of mean for each tested group. The t-test (for equal sample size and equal variance) was implemented as , where and are the mean of group 1 and group 2, respectively, Sp is an estimator of pooled standard deviation of the two sample groups, and N is the number of observations in each group.
In addition to the F-test and t-test for each group of imputations or estimations vs. the LAHM data, a one-way ANOVA test was used to determine whether significant differences of mean exist across the groups. The null hypothesis (H0) in this case is the equality of the means for FFE0 in the LAHM data, the statistical imputation model, and estimation models by FEMA. For all inferential statistical analyses, a level of significance (α) of 0.05 was chosen as the threshold for assessing statistical significance.
Results
Little’s missing completely at random test for randomness of missing data showed a p-value of less than 0.001. Therefore, the data were assumed to be missing at random and imputation is recommended to populate the missing information. The imputation results from regression, random forest, and GAM models, along the results of a comparison study with data in the literature, are presented in this section.
Regression
The coefficient parameter estimates of the regression models are shown in Table 6. The coefficient p-value of the independent variables in all examined models is significant or near the significance level of 0.05.
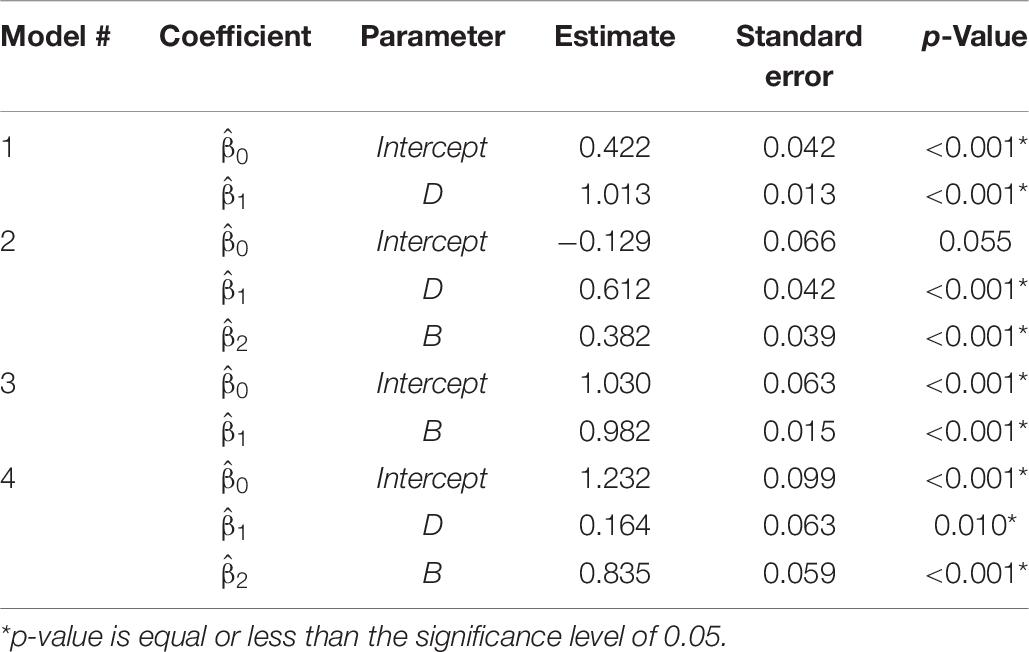
Table 6. Parameter estimates for selected regression models.
By testing the LOOCV RMSE along with R2 and adjusted R2, and considering the regression assumptions, the regression models were compared for FFE0 and FFE1 models (Table 7). The regression results suggest using Model 2 (adjusted R2 = 0.98, LOOCV RMSE = 1.15) for imputing FFE0 due to the slightly better R2 and LOOCV RMSE and Model 3 (adjusted R2 = 0.95, LOOCV RMSE = 1.89) for imputing FFE1 due to its lower cross-validation error and minimization of multicollinearity.
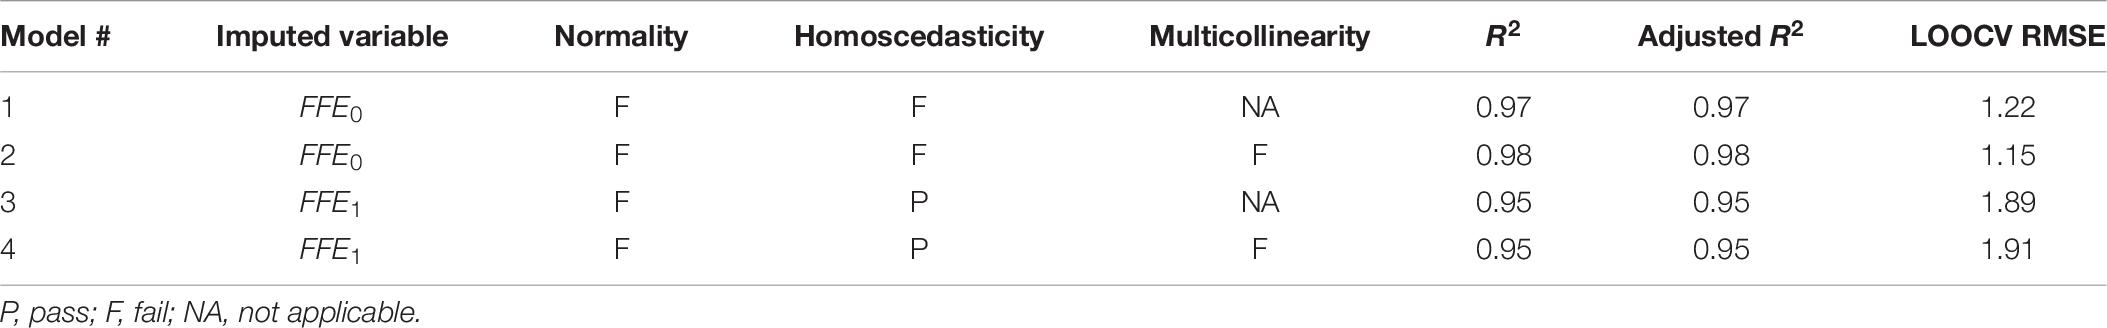
Table 7. Model evaluation results for regression models.
The regression assumptions test suggests that the normality assumption is violated in all equations. However, the large sample size makes the least squares regression robust to the normality violation assumption (Lumley et al., 2002). Figure 2 describes the relationship between the FFE0 and D based on Model 1 and the relationship between FFE1 and B based on Model 3.
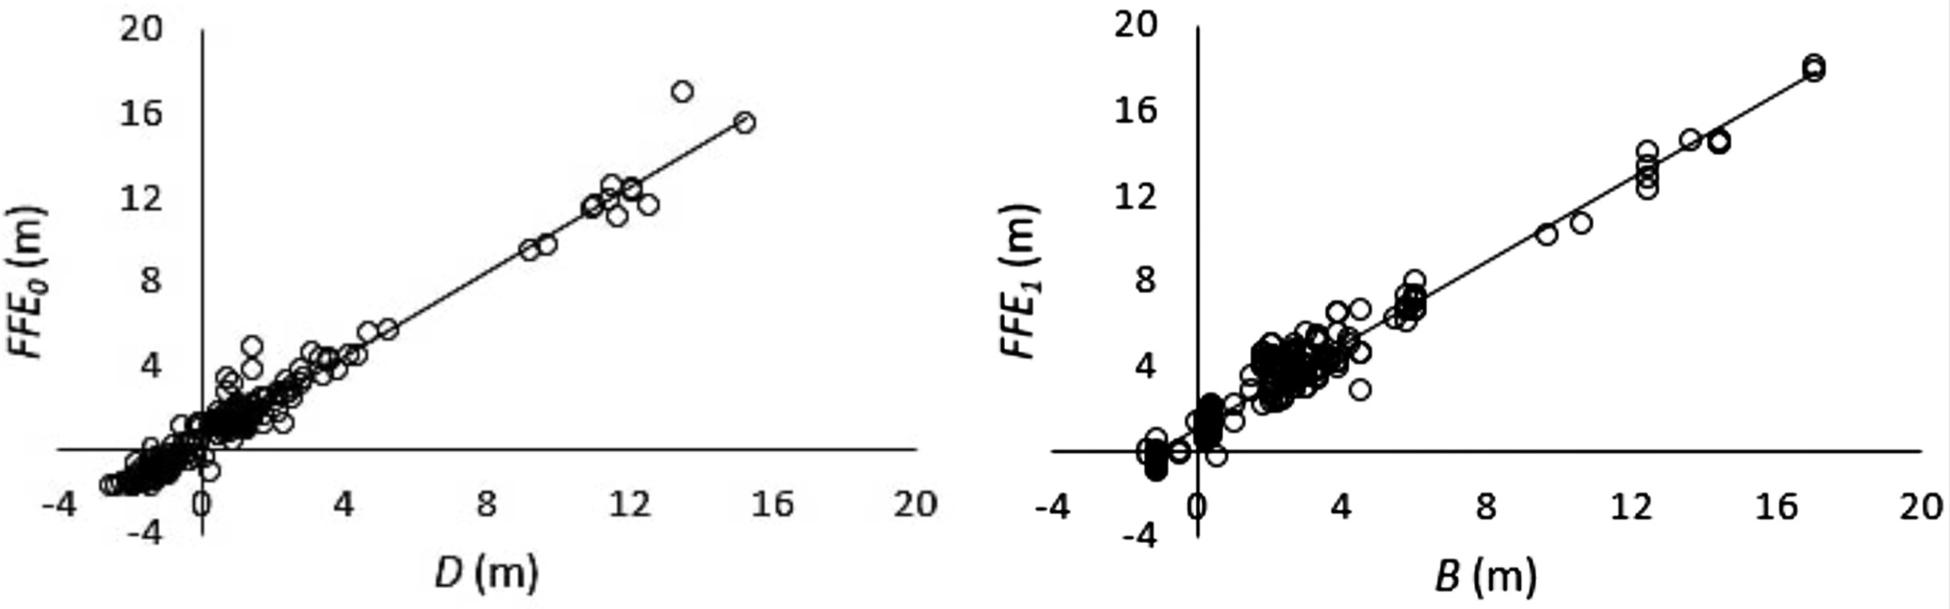
Figure 2. Relationship between FFE0 and D and relationship between FFE1 and B for elevation-mitigated projects (2005–2015) in Louisiana.
Random Forest and GAM
The random forest model performs best when it is applied with the optimum number of trees for prediction models. In this study, the out-of-bag (OOB) error in random forest decreased dramatically with the first 100 trees, and after 250 trees, the test error became nearly constant (Figure 3). Therefore, random forest is applied with 500 trees to obtain the best results.
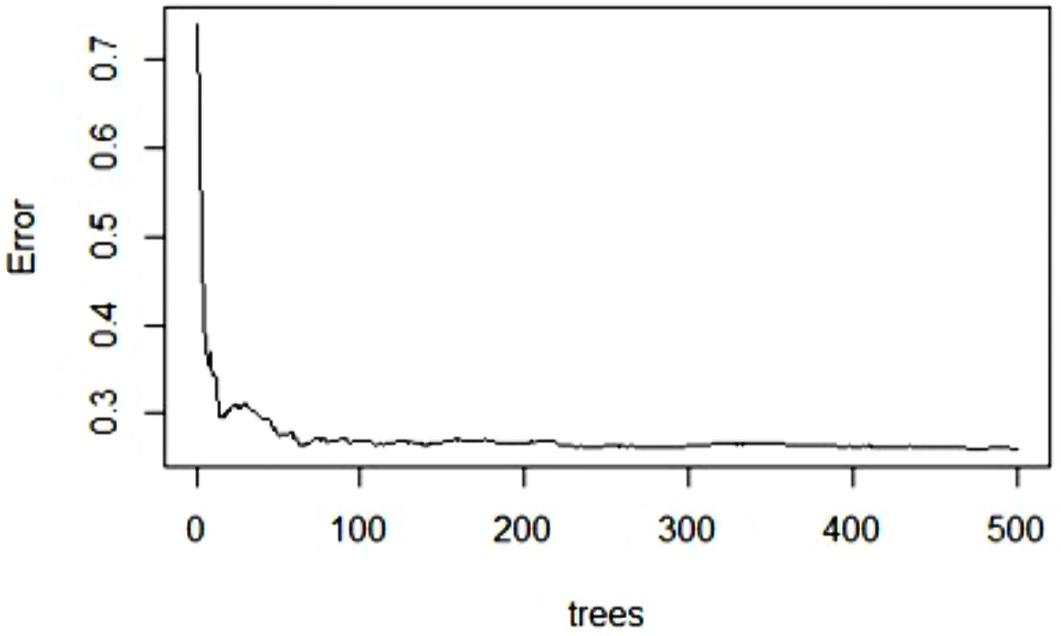
Figure 3. Random forest OOB error, based on the number of trees.
The LOOCV RMSEs for the regression, random forests, and GAM models are shown in Table 8. The smallest LOOCV RMSE values for missing FFE0 values occur for random forest (Model 5) and GAM (Model 9); the smallest LOOCV RMSE values for missing FFE1 values are the GAM (Model 10) and random forest (Model 6) models.
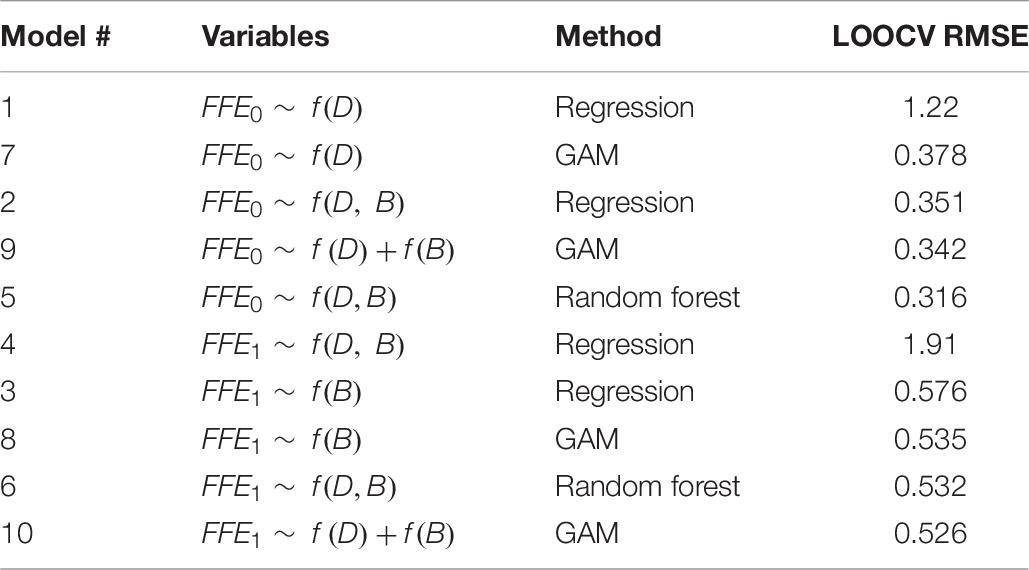
Table 8. LOOCV RMSE results for statistical models.
Since the random forest and GAM methods are very competitive in prediction results, this study suggests using either random forest or GAM methods for imputing the missing values of FFE0 and FFE1. Figure 4 shows that the smoothing function for both independent variables in GAM models of FFE0 and FFE1 is significant and both variables are effective in the imputation of missing FFE0 and FFE1 values; however, the changes in FFE1 are more related to BFE than to DEM.
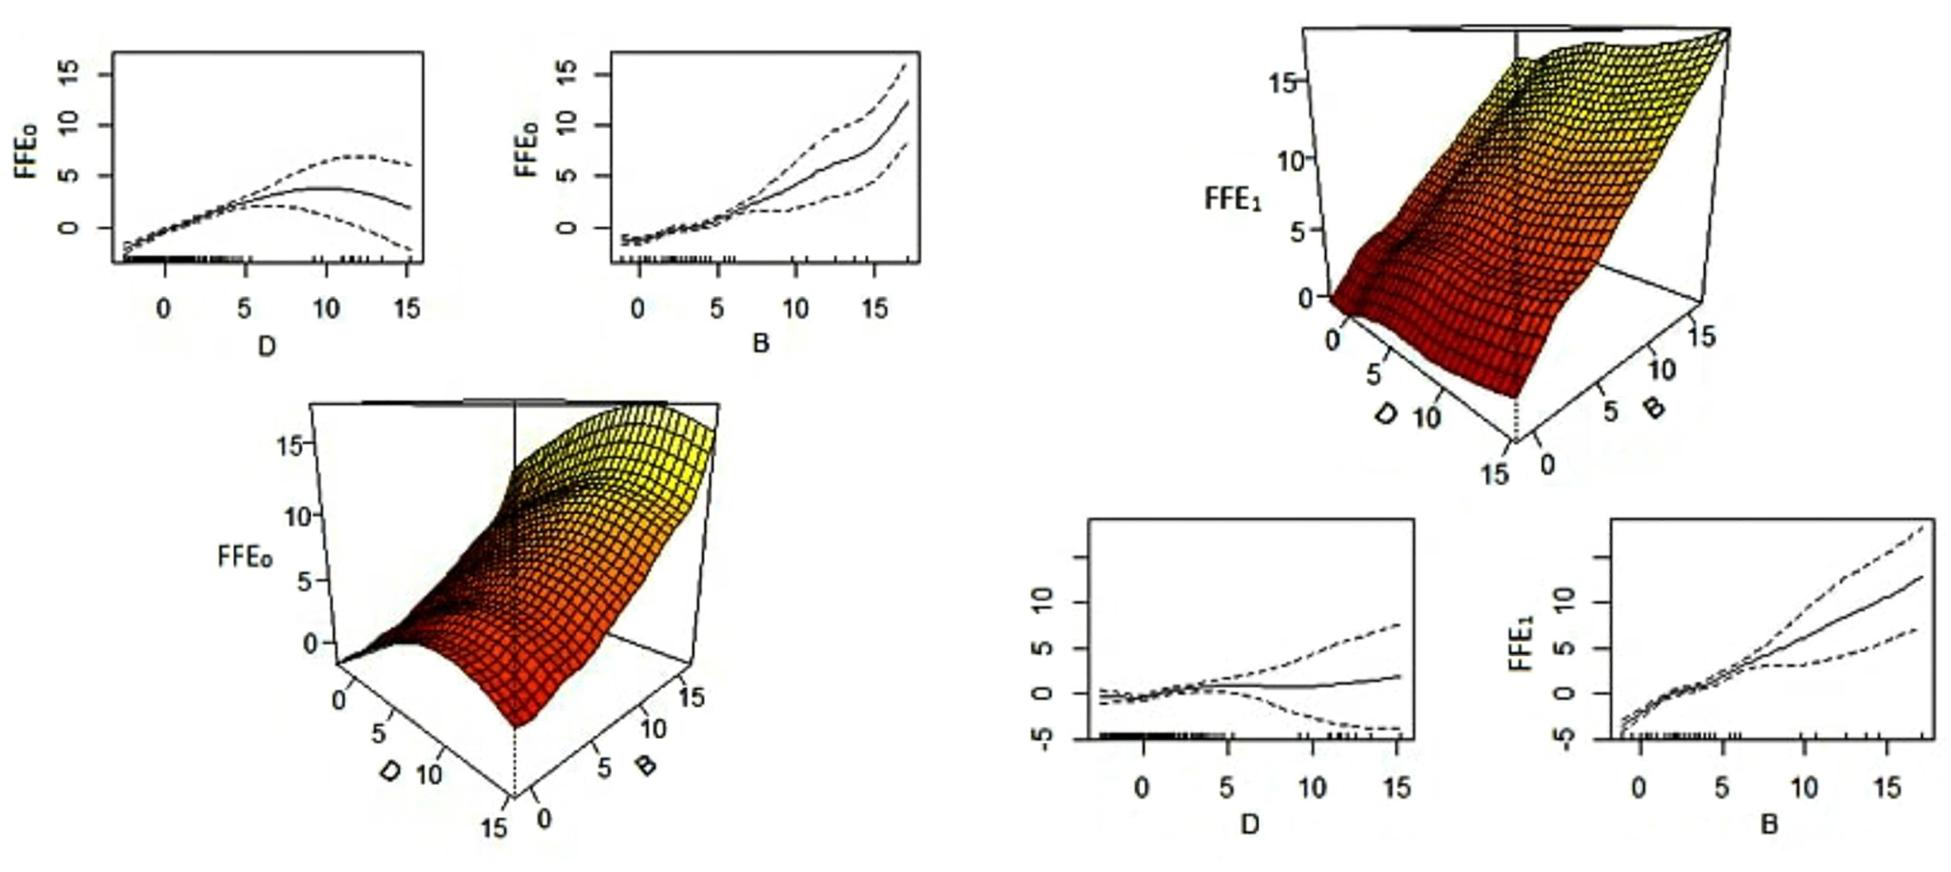
Figure 4. GAM smoothing fits with one standard error confidence interval and three-dimensional plot for imputation of FFE0 (left) and FFE1 (right).
Comparison With Data in Literature
For this section, 175 observations from the LAHM data were used as a basis for comparison. These data are from the non-missing data for foundation type (i.e., slab, crawl space, and pier), building occupancy (residential), BFE, DEM, FFE0, and FFE1.
Comparison of the known FFE0 data from LAHM (f0) with the imputation results from GAM Model 9 (if0; the study imputation model for missing FFE0 data for which foundation type is not required to be known), the FEMA 2013 method (ef013; an estimation method for missing FFE0 data for which foundation type is required to be known), FEMA 2015 method (ef015; an estimation method for imputing missing FFE0 data for which foundation type is required to be known), and FEMA 2015 method with estimated foundation type (ef015f; an estimation method for imputing FFE0 data for which foundation type is not required) yields MSEs of 0.134, 0.192, 0.213, and 0.365, respectively. Thus, all three methods have a nearly similar error rate. However, the imputation model from this study (i.e., GAM Model 5) has slightly better results than the ef013, ef015, and ef015f methods. The t-test p-values between f0 and if0, ef013, ef015, and ef015f were 0.95 [two-sample t-test with equal variance (F-test p-value = 0.81)], 0.79 [two-sample t-test with equal variance (F-test p-value = 0.70)], 0.90 [two-sample t-test with equal variance (F-test p-value = 0.85)], and 0.50 [two-sample t-test with equal variance (F-test p-value = 0.61)], respectively. The t-test results indicate that none of the three models differed significantly from the observations. However, if0 has the most similarly distributed mean and variance to f0 observations in LAHM data. In addition to the t-test, the one-way ANOVA with the p-value of 0.91 also shows no difference between f0, if0, ef013, ef015, and ef015f.
By comparing the known FFE1 data (f1; known FFE1 data from LAHM) with the imputation results from GAM Model 10 (if1; the study imputation model for missing FFE1 data which is not required to known the foundation type), the MSE was obtained as 0.392. Also, the t-test p-value between f1 and if1 was 0.93 [two-sample t-test with equal variance (F-test p-value = 0.77)]. The MSE, F-test, and t-test results indicate that the imputation results do not differ significantly from LAHM data.
Figure 5 shows the distribution of imputed and estimated FFE0 compared to known FFE0 data from LAHM and the distribution of imputed FFE1 compared to known FFE1 data from LAHM. The distributions of the imputation and estimation methods for FFE0 are near the distributions of FFE0 in LAHM, and the distribution of the imputation method for FFE1 is near the distributions of FFE1 data from LAHM. Results from MSEs for understanding the model error, F-tests for testing the variance, and t-tests for testing the mean are summarized in Table 9. It should be noted that F-tests are used to test the variance in each pair of data and the F-values are equivalent to T2.
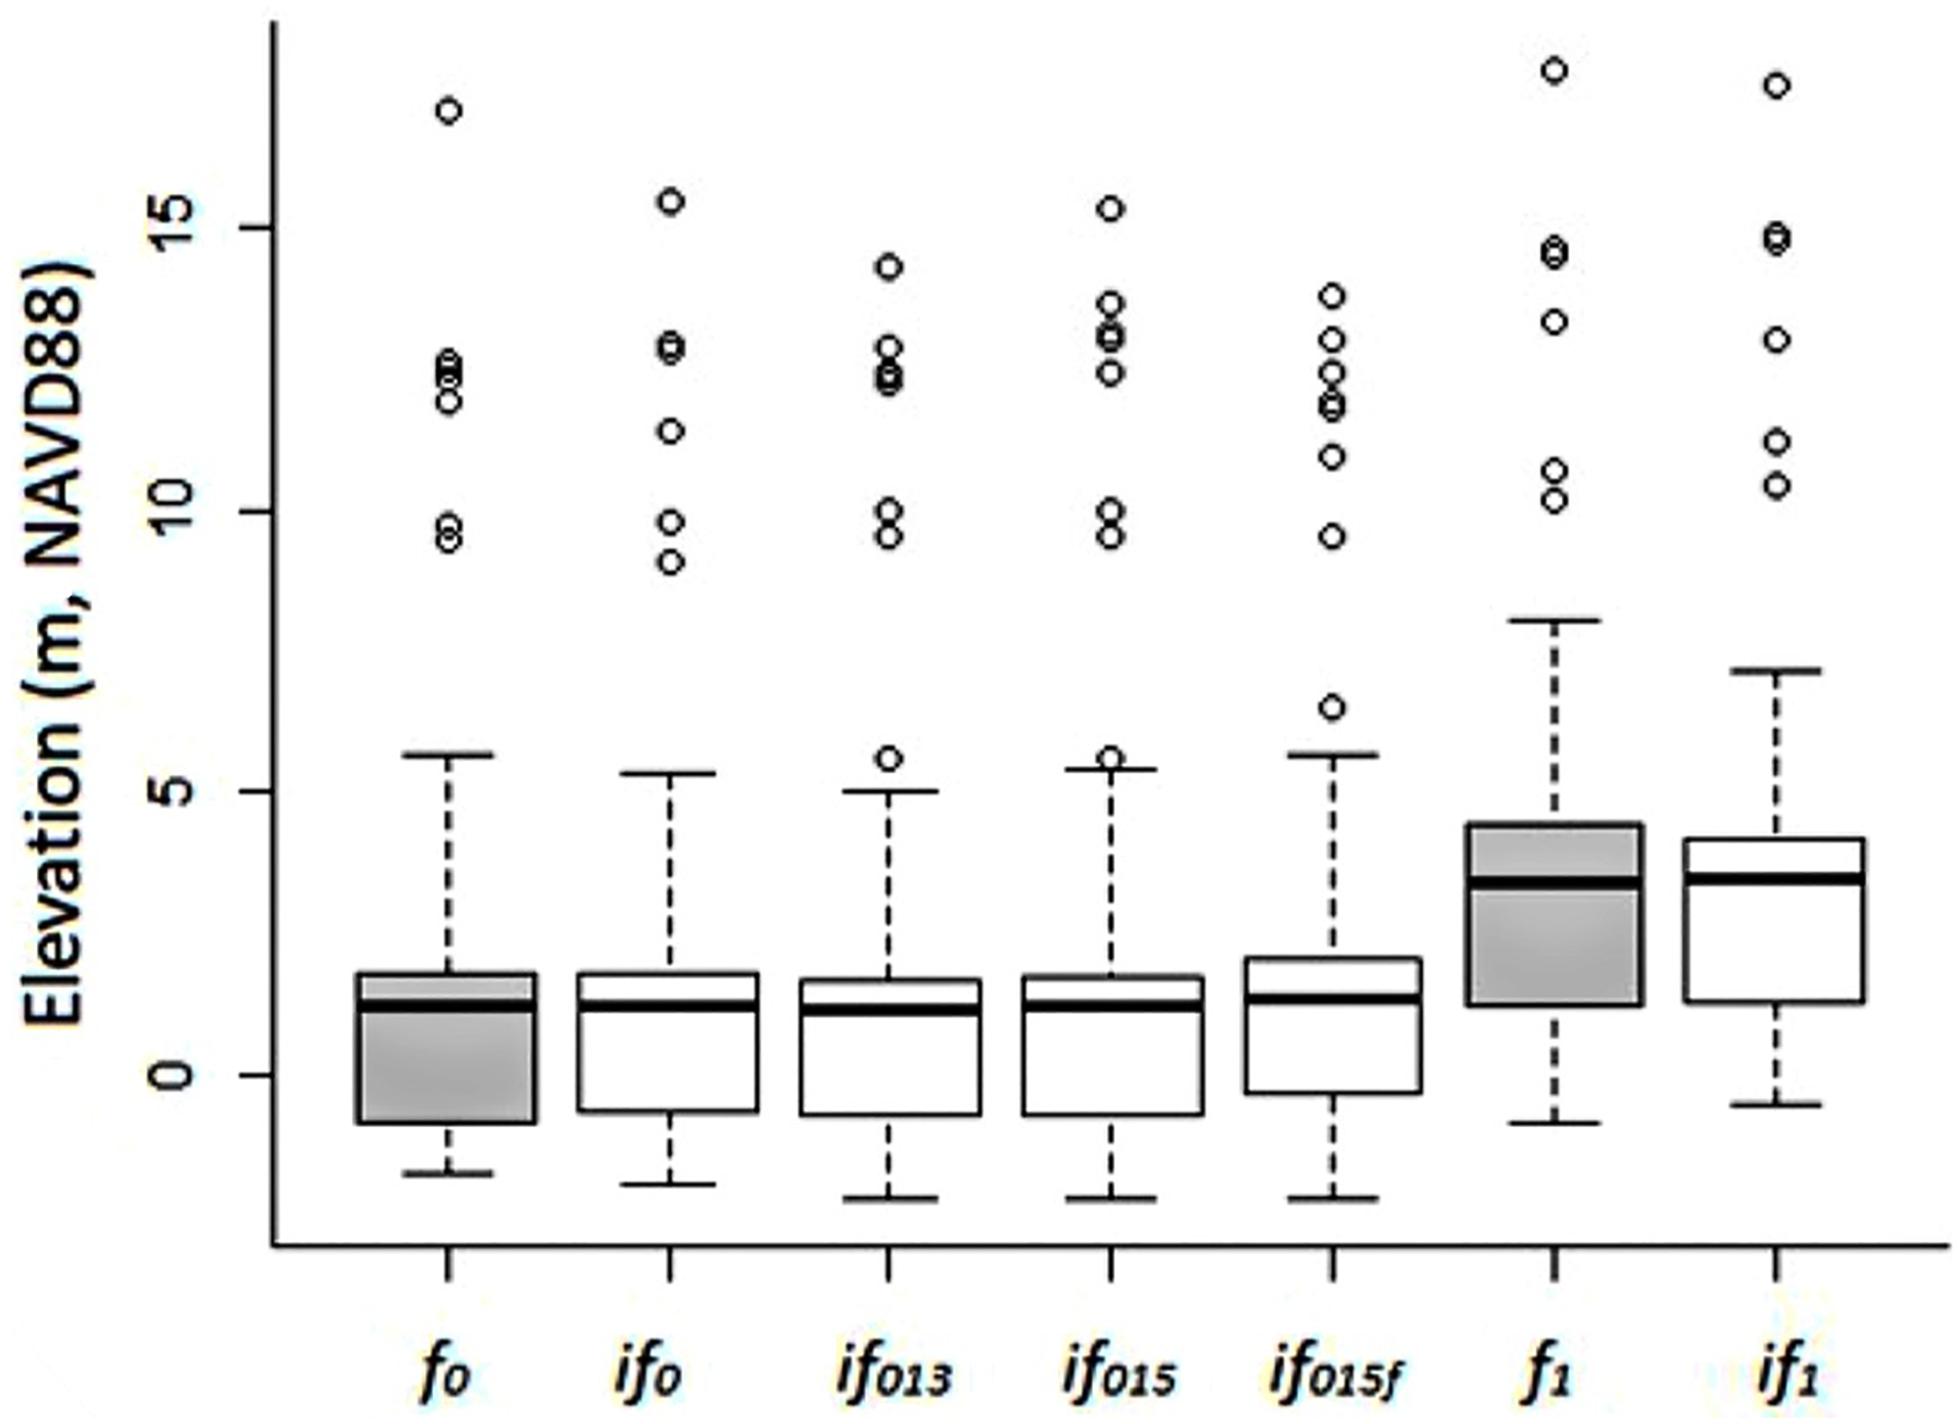
Figure 5. Boxplots of imputed and estimated FFE0 and FFE1 compared to FFE0 and FFE1 data from LAHM.
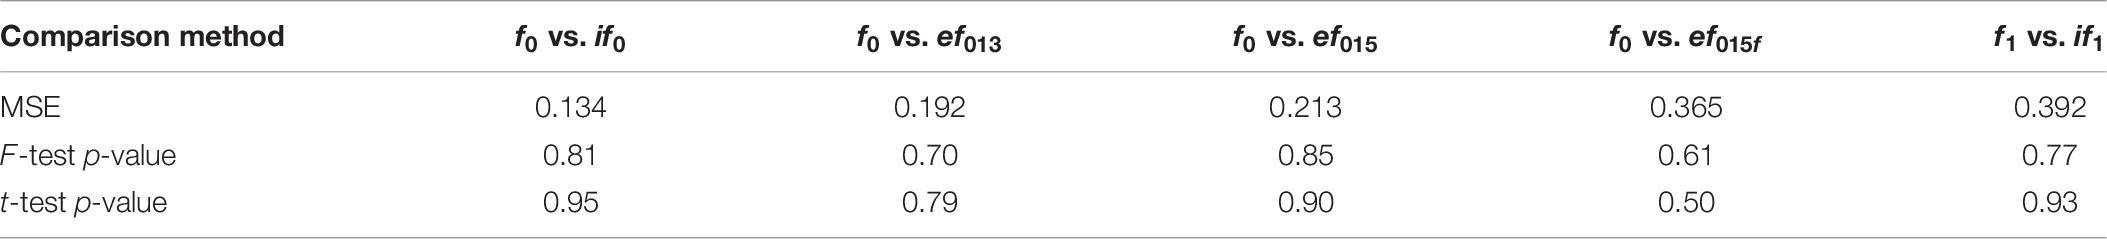
Table 9. MSE, F-test, and t-test results for FFE imputations and estimations vs. LAHM data on 175 observations.
Table 10 compares H (i.e., H = FFE0−D) and the distribution of four foundation types in FEMA studies for Louisiana and LAHM data. A considerable difference for H exists in the pier foundation type among the three studies. Also, in FEMA 2015, the distribution of pier foundation for the riverine area in Louisiana is 0%, but LAHM data show the existence of buildings by pier foundation (6%) in riverine area.
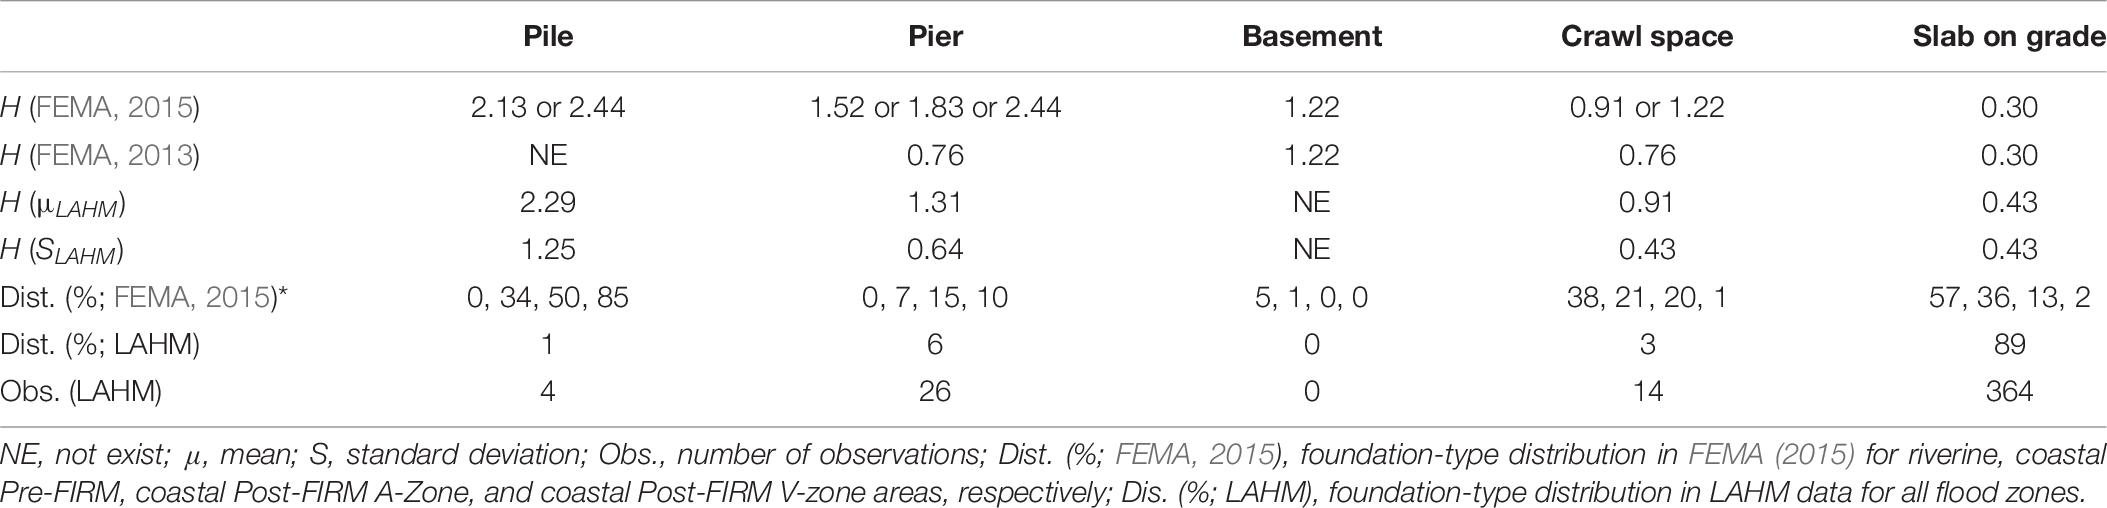
Table 10. H (m) for the FEMA, 2013 and FEMA, 2015 foundation types in Louisiana vs. LAHM foundation types.
Discussion
The motivation for this research arises from the absence of a significant portion of data on building attributes required for advanced construction engineering research such as research in the area of built environment information modeling and natural disaster loss analysis. In this research, the existence of some entries with no missing information provided an opportunity to use statistical imputation methods to predict the missing data based on the available data. Also, since the existence of missing information on building attributes is common in flood loss analysis, the results of this research are valuable for all decision-makers and stakeholders that are interested in assessing the benefit of mitigation.
The MSEs indicate that, if the foundation type is known, the study imputation method projects missing FFE0 data slightly better than FEMA estimation methods. Moreover, when the foundation type is unknown, the GAM in this study imputes the missing FFE0 data much better than the FEMA 2015 method. The GAM is an effective compromise between regression and random forest techniques. It adds non-linear flexibility, unlike regression, but in a more interpretable way than the random forest approach. Also, because the data are limited, more advanced methods such as neural networks are not examined in this study. The F- and t-test results confirm the accuracy of FFE0 imputation in this study and estimates by previous FEMA studies. However, FEMA 2013 is not applicable when the foundation type is unknown, and it was only specified to one geographic area in the United States. Furthermore, FEMA 2013 is limited to four specific foundation types, and the piling foundation, which is common in low-lying areas, was not included in that study. Also, FEMA 2015 is not applicable when the pre- or post-FIRM building information is unavailable. Additionally, in the absence of foundation type, the MSE results show an increase in error rate. Therefore, in the absence of information required for estimation methods in FEMA publications (i.e., foundation type, detailed FIRM information), the proposed imputation methods based on the locally collected data can be more effective than FEMA estimation methods, which require information about foundation type, building construction date, and flood zone in FIRM maps.
To ensure that the statistical imputation models can predict the missing FFE values well, the range of DEM and BFE for missing data should be within or close to the range of DEM and BFE data that are used in the imputation model. In the current study, the range of independent variables for imputation models is between −2.52 (m) and 15.27 (m) for the D variable and between −1.07 (m) and 17.07 (m) for the B variable. Therefore, caution should be exercised in the interpretation of results of imputation for cases in which the DEM and/or BFE for missing FFE data is not in the range of DEM and BFE in the study. Also, the range of data in this study indicates that many properties in southern Louisiana have DEM less than −2.52 m (NAVD88), which confirms that most mitigated buildings in this study are located in low-elevation areas.
The distributions of foundation types in LAHM data show that pier foundation in the riverine area consists of 6% of the mitigated buildings in Louisiana, while in the FEMA 2015 study, the distribution for this foundation type in riverine area is 0%. Therefore, it seems that the FEMA sources and studies for building elevation data should be updated.
Conclusion
This research contributes to the development of knowledge in the field of flood loss analysis by providing statistical imputation methods to find missing FFE0 and FFE1 data. These imputation methods can be used in any geographic area to populate the missing data for these two critical variables in AL analysis. Comparison between imputation in this study and existing estimation methods shows that imputation results are more accurate and flexible to populate the missing information based on the building conditions and geographic locations. Also, the statistical t-test shows that the results of estimation methods in the FEMA guidelines do not differ significantly from LAHM observations in this study.
The detailed steps for processing data to use in flood loss analysis and handling missing information were described in the major sections above. Imputation methods by knowing DEM and BFE information were applied for FFE0 and FFE1 missing data. The FFE0 and FFE1 imputation results were compared with LAHM data by using MSE and F-test and t-test methods. Also, the FEMA estimation methods for missing FFE0 data in the literature were evaluated and compared with LAHM data. The results indicate that imputed FFE0 and FFE1 information do not differ significantly from the LAHM data and the MSEs are small in imputations for both variables.
In addition, while the FEMA studies provide estimation methods for FFE, they do not separate their estimations for unmitigated and post-event mitigated buildings. However, in elevation-mitigation projects, because raised buildings typically provide above-code protection for mitigated homes, the FFE1 cannot be estimated by FEMA techniques for FFE estimation. For this reason, this study provides a separate imputation model for missing data of FFE1. The MSE, F-test, and t-test confirm the high accuracy of imputed data for this important variable in AL analysis.
Finally, to provide more robust loss analysis in the future, this study recommends that FEMA agencies store the critical information for loss analysis properly in a consistent format (e.g., use a same datum for all elevation data) through an online database system for future AL and benefit cost analysis. Some of the critical data fields for flood mitigation projects were recognized as “unique ID,” “construction date,” “address,” “GPS address,” “building replacement value” (the building value minus the land value), “building type,” “number of stories,” “foundation type,” “flood zone,” “BFE,” “project cost,” “initial elevation,” and “final elevation.”
Data Availability Statement
The datasets generated for this study will not be made publicly available. The data that support the findings of this study are available from the Louisiana Governor’s Office of Homeland Security. Restrictions apply to the availability of these data, which were used under license for this study.
Author Contributions
AT and CF contributed to conception and design of the study and organized the database. AT performed the statistical analysis and wrote the first draft of the manuscript. BM helped with statistical analysis. RR wrote sections of the manuscript. All authors contributed to manuscript revision, read and approved the submitted version.
Funding
This research was supported by FEMA Grant 4080-DR-LA (Project 0017 Statewide Hazard Mitigation Community Education and Outreach Project, CFDA 97-039) through the GOHSEP “Economic Benefit of Mitigation” Project. Any opinions, findings, and conclusions or recommendations expressed in this article are those of the authors and do not necessarily reflect the views of FEMA or GOHSEP.
Conflict of Interest
The authors declare that the research was conducted in the absence of any commercial or financial relationships that could be construed as a potential conflict of interest.
Abbreviations
AL, avoided loss; ANOVA, analysis of variance; AR, Arkansas, United States; BBN, Bayesian belief networks; BCA, benefit cost analysis; BFE, base flood elevation; CART, classification and regression tree; CV, cross-validation; Δ E, delta elevation (change in elevation); DEM, digital elevation model (a 3D model that shows ground elevation); FEMA, Federal Emergency Management Agency; FFE, first-floor elevation; FFE0, first-floor elevation before mitigation (before raising building); FFE1, first-floor elevation after mitigation (after raising building); FIA, Federal Insurance Administration; FIRM, flood insurance rate map; GAM, generalized additive model; GIS, geographic information system; GOHSEP, Louisiana Governor’s Office of Homeland Security & Emergency Preparedness; GPS, global positioning system; HMGP, Hazard Mitigation Grant Program; LA, Louisiana, United States; LAHM, Louisiana HMGP; LOOCV, leave-one-out cross-validation; LSU, Louisiana State University; MSE, mean square error; NAVD88, North American Vertical Datum of 1988; NGVD29, National Geodetic Vertical Datum of 1929; NOAA, National Oceanic and Atmospheric Administration; OK, Oklahoma, United States; OOB error, out-of-bag error; RMSE, root-mean-square Error; TX, Texas, United States; USACE, United States Army Corps of Engineers; VDatum, NOAA’s vertical datum transformation software; VIF, variance inflation factor.
Footnotes
References
Barnard, J., and Meng, X.-L. (1999). Applications of multiple imputation in medical studies: from AIDS to NHANES. Stat. Methods Med. Res. 8, 17–36. doi: 10.1177/096228029900800103
Breiman, L., Friedman, J., Stone, C. J., and Olshen, R. A. (1984). Classification and Regression Trees. London: CRC press.
Burton, A., Billingham, L. J., and Bryan, S. (2007). Cost-effectiveness in clinical trials: using multiple imputation to deal with incomplete cost data. Clin. Trials 4, 154–161. doi: 10.1177/1740774507076914
Chen, Z., Li, H., and Bao, Y. (2018). Analyzing and modeling inter-sensor relationships for strain monitoring data and missing data imputation: a copula and functional data-analytic approach. Struct. Health Monit. 18, 1168–1188. doi: 10.1177/1475921718788703
Cugliari, J., De Mello, S., and Renom, M. (2018). Imputation of temperature extremes using Generalized Additive Models. New Delhi: JDS.
Cutler, D. R., Edwards, T. C., Beard, K. H., Cutler, A., Hess, K. T., Gibson, J., et al. (2007). Random forests for classification in ecology. Ecology 88, 2783–2792. doi: 10.1890/07-0539.1
FEMA (2007). Selecting Appropriate Mitigation Measures for Foodprone Structures. Washington, DC: Federal Emergency Management Agency.
FEMA (2010). Home Builder’s Guide to Coastal Construction. Washington, DC: Federal Emergency Management Agency.
FEMA (2011a). Loss Avoidance Study: Riverine Flood Methodology Report (With Appendices). Washington, DC: Federal Emergency Management Agency.
FEMA (2011b). Supplement to the Benefit-Cost Analysis Reference Guide. Washington, DC: Federal Emergency Management Agency.
FEMA (2013). Loss Avoidance Study; St. Tammany Parish, Louisiana; Hurricane Isaac 2012. Washington, DC: Federal Emergency Management Agency.
FEMA (2014). Flooding: America’s #1 Natural Hazard! (1530-027). Washington, DC: Federal Emergency Management Agency.
FEMA (2015). Hazus–MH Technical Manual; Multi-Hazard Loss Estimation Methodology; Flood Model. Washington, DC: Federal Emergency Management Agency.
Guisan, A., Edwards, T. C. Jr., and Hastie, T. (2002). Generalized linear and generalized additive models in studies of species distributions: setting the scene. Ecol. Model. 157, 89–100. doi: 10.1016/S0304-3800(02)00204-1
Gulf Engineers & Consultants [GEC] (2006). Depth-Damage Relationships for Structures, Contents, and Vehicles and Content-to-Structure Value Ratios (CSVR) in Support of the Donaldsonville to the Gulf, Louisiana, Feasibility Study. New Orleans: U.S. Army Corps of Engineers.
Hastie, T., and Tibshirani, R. (1990). Generalized Additive Models. Horsham Township: Chapman&Hall/CRC.
Hawthorne, G., and Elliott, P. (2005). Imputing cross-sectional missing data: comparison of common techniques. Austral. N. Zeal. J. Psychiatry 39, 583–590. doi: 10.1080/j.1440-1614.2005.01630.x
Inman, D., Elmore, R., and Bush, B. (2015). A case study to examine the imputation of missing data to improve clustering analysis of building electrical demand. Build. Serv. Eng. Res. Technol. 36, 628–637. doi: 10.1177/0143624415573215
Little, R. J. (1988). A test of missing completely at random for multivariate data with missing values. J. Am. Stat. Assoc. 83, 1198–1202. doi: 10.1080/01621459.1988.10478722
Little, R. J., and Rubin, D. B. (2014). Statistical Analysis with Missing Data, Vol. 333. Hoboken, NJ: John Wiley & Sons.
Lumley, T., Diehr, P., Emerson, S., and Chen, L. (2002). The importance of the normality assumption in large public health data sets. Annu. Rev. Public Health 23, 151–169. doi: 10.1146/annurev.publhealth.23.100901.140546
Marwala, T. (2009). Computational Intelligence for Missing Data Imputation, Estimation, and Management: Knowledge Optimization Techniques: Knowledge Optimization Techniques. Pennsylvania: IGI Global.
McKechnie, S., Hoyle, S., and Harley, S. (2013). Longline CPUE Series that Account for Changes in the Spatial Extent of Fisheries. Kolonia: Western and Central Pacific Fisheries Commission.
Moore, L., Hanley, J., Turgeon, A., and Lavoie, A. (2011). A comparison of generalized additive models to other common modeling strategies for continuous covariates: implication for risk adjustment. J. Biomet. Biostat. 2:109. doi: 10.4172/2155-6180.1000109
Newgard, C. D., and Haukoos, J. S. (2007). Advanced statistics: missing data in clinical research—part 2: multiple imputation. Acad. Emerg. Med. 14, 669–678. doi: 10.1111/j.1553-2712.2007.tb01856.x
Nofal, O. M., and van de Lindt, J. W. (2020). Probabilistic flood loss assessment at the community scale: case study of 2016 flooding in Lumberton, North Carolina. ASCE ASME J. Risk Uncert. Eng. Syst. A Civil Eng. 6:05020001. doi: 10.1061/AJRUA6.0001060
Orooji, F. (2015). Risk-Based Wind Loss and Mitigation for Residential Wood Framed Construction. Doctoral dissertation, Louisiana State University, Baton Rouge, LA.
Pita, G. L., Francis, R., Liu, Z., Mitrani-Reiser, J., Guikema, S., and Pinelli, J.-P. (2011). “Statistical tools for populating/predicting input data of risk analysis models,” in Vulnerability, Uncertainty, and Risk: Analysis, Modeling, and Management (Reston: American Society of Civil Engineers), 468–476. doi: 10.1061/41170(400)57
Posenato, D., Kripakaran, P., Inaudi, D., and Smith, I. F. (2010). Methodologies for model-free data interpretation of civil engineering structures. Comput. Struct. 88, 467–482. doi: 10.1016/j.compstruc.2010.01.001
Shataee, S., Kalbi, S., Fallah, A., and Pelz, D. (2012). Forest attribute imputation using machine-learning methods and ASTER data: comparison of k-NN, SVR and random forest regression algorithms. Int. J. Remote Sens. 33, 6254–6280. doi: 10.1080/01431161.2012.682661
Taghinezhad, A., Friedland, C. J., and Rohli, R. V. (2020). Benefit-cost analysis of flood-mitigated residential buildings in Louisiana. Housing and Society. 1–18. doi: 10.1080/08882746.2020.1796120
Trevor, H., Robert, T., and Friedman, J. (2009a). “Additive models, trees, and related methods,” in The Elements of Statistical Learning: Data Mining, Inference, and Prediction, (New York, NY: Springer), 295–335.
Trevor, H., Robert, T., and Friedman, J. H. (2009b). “Radom forests,” in The Elements of Statistical Learning: Data Mining, Inference, and Prediction, (New York, NY: Springer), 587–603.
van Buuren, S., Boshuizen, H. C., and Knook, D. L. (1999). Multiple imputation of missing blood pressure covariates in survival analysis. Stat. Med. 18, 681–694. doi: 10.1002/(sici)1097-0258(19990330)18:6<681::aid-sim71>3.0.co;2-r
van der Heijden, G. J., Donders, A. R. T., Stijnen, T., and Moons, K. G. (2006). Imputation of missing values is superior to complete case analysis and the missing-indicator method in multivariable diagnostic research: a clinical example. J. Clin. Epidemiol. 59, 1102–1109. doi: 10.1016/j.jclinepi.2006.01.015
Keywords: data imputation, flood mitigation, generalized additive models, random forest, cross-validation, first-floor elevation, avoided loss, data analysis
Citation: Taghinezhad A, Friedland CJ, Rohli RV and Marx BD (2020) An Imputation of First-Floor Elevation Data for the Avoided Loss Analysis of Flood-Mitigated Single-Family Homes in Louisiana, United States. Front. Built Environ. 6:138. doi: 10.3389/fbuil.2020.00138
Received: 17 February 2020; Accepted: 27 July 2020;
Published: 26 August 2020.
Edited by:
Mohammed Mawlana, North Carolina Agricultural and Technical State University, United StatesReviewed by:
Yulong Li, Central University of Finance and Economics, ChinaJamal Younes Omran, Tishreen University, Syria
Copyright © 2020 Taghinezhad, Friedland, Rohli and Marx. This is an open-access article distributed under the terms of the Creative Commons Attribution License (CC BY). The use, distribution or reproduction in other forums is permitted, provided the original author(s) and the copyright owner(s) are credited and that the original publication in this journal is cited, in accordance with accepted academic practice. No use, distribution or reproduction is permitted which does not comply with these terms.
*Correspondence: Arash Taghinezhad, YXJhc2gyNm1AZ21haWwuY29t