 Audrey M. Bascoul1†
 Iris D. Tommelein
 Danielle Douthett
- 1Project Production Systems Laboratory, Civil and Environmental Engineering Department, University of California, Berkeley, Berkeley, CA, United States
- 2Independent Researcher, United States
Space is a construction resource not to be overlooked during project scheduling, production planning, and control. When space use over time is not planned, trades may get stacked in areas of the jobsite that are labor intensive, which may hamper productivity and cause safety concerns. Augmenting traditional scheduling representations, spatiotemporal modeling in construction considers both space and time to depict ongoing construction work. This paper presents a simple space scheduling program called LoSite that helps workers involved in doing the work visualize the work schedule, facilitates production control, and fosters transparency in daily coordination of work space among trades. LoSite was implemented in Microsoft Excel. The researchers prototyped, deployed, and tested the space scheduling program to visualize construction work being done during the interiors phase of an open-space office building. Successes of the program as well as limitations to its full adoption by the team are discussed in this paper. LoSite delivers proof-of-concept that space-use visualization, even on a large-scale project, can be accomplished effectively using software that is readily available and familiar to many people.
Introduction
Construction projects are being delivered at ever-increasing speeds. To shorten project durations, various scheduling methods including the Critical Path Method (CPM) encourage splitting activities, so that they can be done in parallel, and increasing manpower and their supporting resources. Informed by traditional schedule representations (e.g., Gantt charts with precedence relationships), those methods tend to result in more trades and more workers sharing the same limited work space on site. This increase in density of workers, leading to congestion and possibly resulting in trade stacking, must be thoughtfully managed so as to not pose production challenges, including quality and safety challenges. To address this management challenge, we developed a spatiotemporal computer model called LoSite (where Lo refers to “Location”). LoSite helps project teams visualize work being done, trade-by-trade and location-by-location.
This paper is structured as follows. We first expand on the existing literature in areas that are foundational to the presented work. One section refers to the literature that describes the lean practice called Visual Management (VM) in order to situate the research that led to the development of LoSite. The following two sections refer to the literature that describes the use of schedule representations and space use. The Section “Research Methodology” summarizes how we approached the development of LoSite. The follow-on section describes the project for which LoSite was developed, namely the interiors phase of a 40,000 m2 more-or-less open office space. Section “Design of Computer Program to Visualize Daily Space Use” details the LoSite program. We illustrate the use of the program with examples from the project. Section “Field Use and Assessment” expands on the technical specifics of the LoSite computer program to visualize space use. Section “Discussion” reflects on LoSite’s implementation, highlights key lessons learned, and gives direction for future research. Finally, Section “Conclusion” wraps up what was learned from this proof-of-concept study.
Visual Management (VM)
The development of the LoSite program was a study of the use of Visual Management (VM) in construction. VM promotes systemic thinking aimed at increasing the performance of an organization by stimulating human senses (Greif, 1991; Liff and Posey, 2004; Tezel and Koskela, 2009). Different classifications of VM practices and devices exist. For example, Galsworth (1997) classified visual devices based on the effect they have on people as (1) visual indicator, (2) visual signal, (3) visual control, or (4) visual guarantee. Tezel et al. (2009) identified nine visual management functions: (1) transparency, (2) discipline, (3) continuous improvement, (4) job facilitation, (5) on-the-job training, (6) creating shared ownership, (7) management by facts, (8) simplification and unification, and (9) visual controls. The LoSite program belongs to the visual control category, which appears in both classifications (also see Wikipedia, 2019).
VM is practiced in a variety of industry sectors including manufacturing, healthcare, and transportation. It is foundational in the Toyota Production System (TPS) and applies to all work done by the company, including both new product development as well as manufacturing, as illustrated in the House of Toyota (e.g., Figure 3-3 in Liker, 2004). Liker and Meier (2005) noted: “We cannot stress enough the importance to make it visual.” The TPS and lean production systems in general use many interrelated VM methods. Examples are: shadow boards, 5S, andon, mistakeproofing (poke yoke), and Kanban. In the development of standards, visual controls help to: (1) create alignment from the entire organization on the agreed-to standards, and (2) enable workers and supervisors to recognize deviations from these standards. In turn, once standards are consistently met, the organization can then raise them as part of its continuous improvement cycle.
While VM has been practiced for decades in various industry sectors, its uptake in construction has been slow (Formoso et al., 2002). Of course, graphical displays of construction plans, schedules, etc. have been in use for the longest time to serve various purposes. An essential aspect of VM is that it is deliberate in pursuing the purpose of making it easy for everyone to quickly recognize and comprehend what is being communicated. Accordingly, VM helps organizations to increase shared understanding and effective decisionmaking, and in turn improve their performance. By coupling ease of visual observation to immediate action-taking, it contributes to fostering systemic thinking with rapid feedback loops, of the kind practiced for example in in Lean construction.
Only more recently has VM been gaining increased attention in construction (Tezel et al., 2010; Brady, 2014; Valente et al., 2019). A number of VM tools are now available for use on jobsites. Some of these use Information and Communication Technologies (Dave et al., 2016) while others are low-tech, such as the deck of mistakeproofing cards developed based the work of Tommelein and Demirkesen(2018, Appendix IV). Aiming to develop a holistic VM approach for construction, Valente et al. (2019) created a model for designing VM systems. They translated the model into a metaphor of an iceberg, involving four steps, three of which are “non-visual work,” namely (1) observe the process, (2) analyze user needs, (3) integrate in process routine, and the last step is “visual work,” namely (4) define visual device attributes. We followed these steps to develop LoSite.
The next section offers examples of time- and space representations used in construction. These examples and others described in the literature served as points of departure for our development of a different means to communicate time-space needs on a construction jobsite using VM.
Time and Space Representations Used in Construction Management
Time- and space uses in construction have been documented in stand-alone, segregated models of time (schedules) and models of space (site layout and logistic plans), but gradually have become more integrated with one another.
Time and space have been depicted in construction schedules in many different ways, with some representations being more graphical than others. Kenley and Seppänen (2009) developed a typology of models. Examples include: a table with activity names, start- and end dates; a Gantt chart possibly also showing sequential relationships between activities; a Line of Balance diagram; or a takt plan (Frandson et al., 2015). These representations all display schedule-related data using different types of abstraction of space and time, that are chosen based on the purpose and audiences they are to serve (e.g., Kenley, 2004).
Schedule representations to some degree reflect what planning or scheduling approach is used on a project; “to some degree” because not all process details can be gleaned from a representation. One example is Gantt charts, which nowadays typically reflect the use of CPM (supported by commercial software such as Primavera P6 and Microsoft Project). A Gantt chart is a horizontal bar chart where each bar represents an activity and the length of the bar is proportional to the duration of the activity. Activities are listed one below the other, possibly grouped hierarchically. Bars may be connected by means of arrows to show dependencies governing the sequencing of activities, though the arrows tend to be generic and do not indicate any rationale for the sequencing. A different color for the bar may be used to highlight critical-path activities, activities belonging to a specific trade, etc. Milestones and embellishments may be added to this depiction. Despite being widely used, Gantt charts are rather limited in regard to how they represent space. At best, an activity’s individual description (e.g., “Place concrete in area A”) or a vertical grouping of several activities mention where on site the work will be done. Gantt charts fail at capturing spatial work flows of trades and materials (Birrell, 1987; Koskela, 2000). They are not well-suited for production planning, that is, planning at the level of detail needed to coordinate and execute work on a day-to-day or an even shorter-term basis.
Another example is Line-of-Balance (LoB) diagrams (e.g., Harris and Ioannou, 1998) (supported by commercial software such as VICO and TILOS), which indicate the use of location-based production planning (e.g., Kenley and Seppänen, 2006). A LoB diagram is a two-dimensional (2D) graph where each activity is represented by a segment described in terms of space on one axis [abstracted to a scalar variable, i.e., it is 1-dimensional (1D)] and time on the other. Segments may be connected by arrows to show precedence relationships. The slope of the segment depicts progress in one-dimensional space over time (a production rate) of the trade that performs the activity. Accordingly, this depiction of space-time requires data about the trade’s production rates tied to the location of their work. Notwithstanding the fact that the LoB thus conveys a kind of flow of work, people, or resources on site across areas, its graphical representation of space in 1D lacks specifics needed to serve well as a communication tool for superintendents and trades to coordinate their daily space use.
Space is, of course, inherently 3-dimensional (3D) but in use is also more varied than time is. For example, Riley and Sanvido (1995) distinguished many different types of spaces on construction projects: (1) layout area, (2) unloading area, (3) material path, (4) staging area, (5) personnel path, (6) storing area, (7) prefabrication area, (8) work area, (9) program and equipment area, (10) debris path, (11) hazard area, (12) protected area. Any or all of these space types are worthy of being modeled in 2D or 3D, depending on the purpose and objective pursued. This paper focuses on representing work areas to help coordinate the work of trade specialists on a day-by-day basis.
Time-space conflicts in work areas occur when concurrent activities have overlapping space requirements. Time-space conflicts (e.g., trade stacking) challenge all project teams. They negatively impact production, productivity, quality, and safety. They fuel adversarial relationships on site that can escalate and result in construction claims.
Different approaches exist to reduce if not eliminate occurrences of time-space conflicts. Among them are (1) layout planning and (2) space scheduling, with a fine boundary separating the two. Both space scheduling and layout planning are complex due to the nature of space itself: it is not cogently modeled by a scalar variable (Tommelein and Zouein, 1992) as is the case for resources such as materials, machines, and people. The boundary between space scheduling and layout planning is defined by the type of relationship that is established to model and manage space use and the schedule. In layout planning, the relationship between space requirements and the activity schedule is unidirectional: space requirements stem from the schedule (Tommelein and Zouein, 1992). In contrast, space scheduling consists of “allocating space to resources governed by a construction schedule, and conversely, changing the schedule when space availability is inadequate” (Tommelein and Zouein, 1993). That is, the relationship between space requirements and the activity schedule is bidirectional: space requirements influence the schedule and vice versa (Tommelein and Zouein, 1992). The VM tool presented in this paper uses as input schedule data and helps to visualize layout plans. This visualization may help people spot space-time conflicts, possibly triggering the need for follow-on action such as reassigning space or rescheduling activities at another time.
While computer-based 2D space modeling programs like AutoCAD, vector graphics, and 3D wireframes already were used in the 1980s to plan construction work, it is not until the rapid increase in computer power and advancements in computer graphics, combined with a decrease in the cost of hardware, leading to the advent of building information modeling (BIM) in the mid-1990s that spatiotemporal modeling became commonplace in construction. A chronological sample of the literature might include: Tommelein (1991), Thabet and Beliveau (1994), Cheng and O’Connor (1996), McKinney et al. (1996), Akinci and Fischer (2000), Cheng and Yang (2001), Akinci et al. (2002), Guo (2002), Sriprasert and Dawood (2003), Hosny (2013), Hosny et al. (2013), Kim et al. (2013), Liu et al. (2015), Fischer et al. (2018), and Francis (2019). It is not our intent to review here what is now a substantial body of literature on this subject, addressing issues of representation, model functionality and model use in pursuit of optimization.
Many models have since been developed based on nD BIM, with “n” referring to three dimensions of space, one dimension of time, one dimension for cost, and any number of additional dimensions to capture data to suit facility management or other representation needs. Such models can be of great sophistication. However, because their development and use still appear to require the involvement of BIM specialists and because they tend to not be integrated systematically with the schedule as it gets updated, they are not as widely used and thus not as useful as they could be. In fact, the project of study for our action research (described later) had been modeled with Digital Project and Revit and a sophisticated LOD350 BIM model existed. This notwithstanding, that BIM model was not used to schedule daily or weekly construction work. Recognizing this reality and striving to build a practical VM tool as an alternative, our experiment was to try out using software that “everyone knows,” namely Microsoft Excel, as the basis for creating a 2D spatiotemporal model for field use that would lend itself to immediate action in terms of helping to coordinate the daily space use of trades working on site and allowing for rapid updating as the project progressed.
Researchers have developed layout planning and space scheduling programs for use in construction for many years now, while gradually increasing the number of dimensions with which to model space as computer hardware and software technology made doing so feasible and practical. Nevertheless, modeling space in more dimensions does not necessarily result in a better system. The VM question we addressed was: How much of space to show for the model to be fit-for-purpose? With this question in mind, we defined the purpose to be straightforward, namely: visualize daily site space use so that everyone can spot potential trade stacking and identify open space where work could take place, and take corrective action where and when appropriate.
The LoSite program was designed to provide support mainly for layout planning, that is, to help direct crews to work areas and to visualize who would be working where on any given day. Inevitably in so-doing, space-time conflicts would be detected. This resulted in the team going back to the project schedule to identify activities that were planned at the time and location where the conflict existed, and the team would then manually assess where to relocate work or which activity to reschedule.
Research Methodology
We followed a research methodology based on the Plan Do Check Act (PDCA) cycle (Figure 1) to design and implement the LoSite computer program. We loosely refer to it as action research because the first author was embedded with the project team while conducting her research. However, the research focused on LoSite need identification, development, functionality, and use, rather than on studying people and organizational changes that might have stemmed from using the tool. Lewin (1946) defined action research as “a way of generating knowledge about a social system while, at the same time, attempting to change it.” Action research falls under the umbrella of design science methodology (Järvinen, 2007). Design science (e.g., Hevner et al., 2004; Gregor and Hevner, 2013) concerns itself with designing and making artifacts to fulfill a purpose, testing and validating that those artifacts indeed serve the intended purpose and do not have unintended consequences, and then improving them as needed.
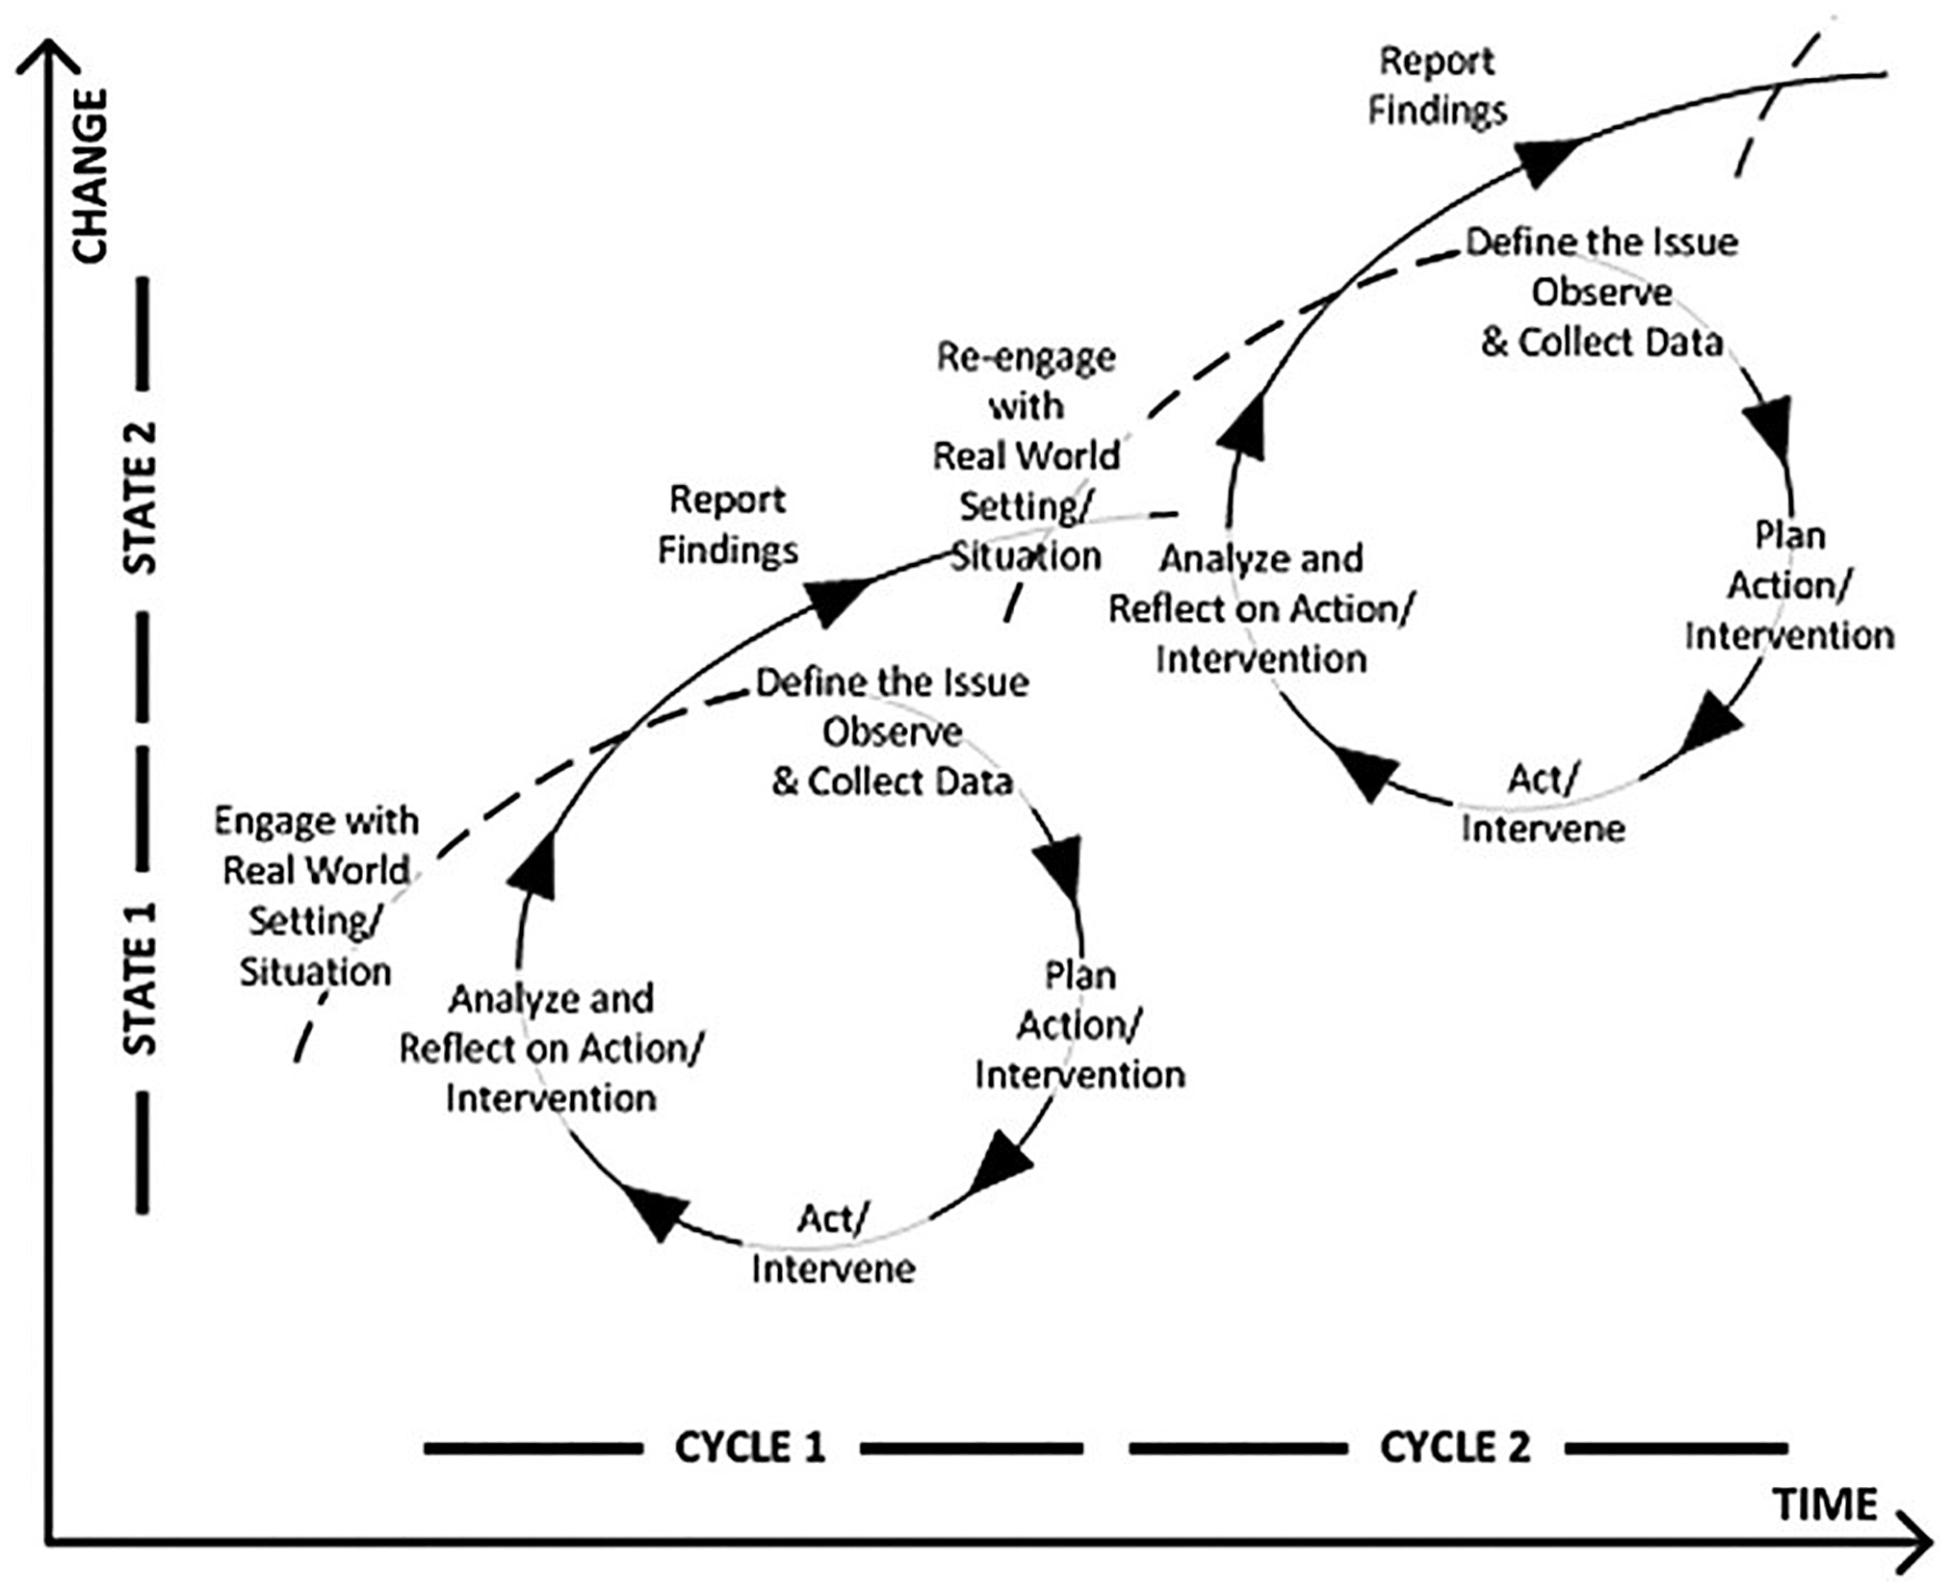
Figure 1. Action research cycle (image from www.brighthub.com, redrawn by Iris D. Tommelein and reprinted with permission from Carly Stockwell).
Baskerville (1999) presented action research as including five steps, which more-or-less match those illustrated in Figure 1:
1. Diagnose the existing situation and define the research problem.
2. Plan the action.
3. Implement the action plan.
4. Evaluate the outcomes.
5. Learn by repeating these steps.
The third author of this paper was the project executive for the general contractor (GC) on the project. The first author worked as a field engineer on site, the first 7 months full-time and the next 3 months for 2 days per week. This gave her the opportunity to attend weekly subcontractor meetings, observe work on site daily, and directly interact with trades and superintendents. The next sections describe how she used action research to develop and implement the spatiotemporal model with two objectives in mind: (1) to avoid trade stacking and (2) to identify areas where no-one was working so that trades could be spatially re-allocated to work in those areas (Bascoul and Tommelein, 2017).
Project Description
Project Overview
The project, located on the San Francisco Peninsula, included demolishing existing buildings and then constructing a 40,000 m2 (430,000 ft2) open-space office building. The office building consisted of three levels: a parking level, a first level, and a green roof. The project broke ground in October 2013. Construction took around 16 months. The owner started to occupy the building in Spring 2015. The first author joined the GC’s project team in June 2014 and conducted her research on site until March 2015.
The design of the interior of the first level resembles an immense warehouse composed of: (1) an open space also called “the Big Room” in which employees can work collaboratively, and (2) about 100 clusters of rooms (called “pods”) scattered throughout the open space. Each cluster comprises between 2 and 10 rooms and is more-or-less unique. This uniqueness of product features contributed to the complexity of managing this project.
Project Location Breakdown Structure
To manage of project of this physical size and complexity, the space and associated work had to be managed in a more piecemeal fashion. In fact, several Location Breakdown Structures (LBS) were used (although the team did not use that specific term). A LBS is a hierarchical spatial decomposition of construction work space, with the decomposition being developed to suit a specific purpose and informed by how work on the project is structured. To suit different purposes, one would expect the use of different LBSs. For example, the LBS for a high-rise building project to manage the interior build-out work may be tied to floor levels, which constitute a decomposition of the work space by elevation to plan and track how work will flow from one level up to the next one. Logically, the work structuring effort that leads to defining a LBS must account, phase by phase, for patterns of work flow (e.g., Riley and Sanvido, 1995), logistics requirements, etc. Different stakeholders are likely to have different preferences for one LBS or another, based on how they view the world.
On this project, two LBSs were used and their use varied by project phase.
1. The architect developed a LBS to produce the 2D floor plans and elevations of their design model, dividing the floor into five areas of approximately the same size. This met the needs of the practical problem: What to fit on which piece of paper (or on what page in a computer file) for display and printing purposes? However, the resulting LBS may have little if anything to do with production in the course of construction.
2. The design documents also depicted a LBS with four zones separated by seismic joints, thus catering more to the project engineers’ view on the project. These zones did inform the choice of construction methods, as well as batching and sequencing of activities. The BIM implementation team used this zone-LBS. In addition, the project’s contract documents required trades to submit their 3D model per this zone-LBS.
3. The GC developed their master schedule based on LBS (2) to plan the structural concrete work, an activity early in the schedule. Therefore, LoSite used this zone-LBS.
4. Not surprisingly, another LBS rationale could apply to the open space for finishes work (after structural concrete). That LBS would not necessarily have to be the same as (1) nor (2). The GC and the interiors team liked using the architect’s area-LBS because it divided the floor into five parts of approximately the same size, i.e., it appeared to define manageable chunks of work.
A potential reason for the co-existence of these two LBSs in one phase of work – a form of self-inflicted project complexity – is that, the building being mostly horizontal and geometrically irregular, a simple decomposition of the space to serve all purposes was not apparent. The practical consequence was that the interiors team’s juggling of two LBSs, the zone-LBS and the area-LBS, created confusion among trades, project engineers, and other personnel on- and off-site.
5. However, this area-LBS (as did the zone-LBS) defined areas that contained a combination of collaborative open spaces, some clusters, and some mezzanines with additional rooms and stairs. Arguably, neither one LBS, whether based on zones or areas, cogently distinguished work spaces so as to help manage the trades’ work space requirements. Neither one therefore was sufficient to manage the production schedule and the trades’ space needs on a day-to-day basis, which is why we developed LoSite.
Production Planning on the Project
The first author joined the project team when concrete rough-in work was underway and stayed on site through the end of the next phase, the finishes phase. By the time the finishes phase started, the team recognized that challenges were arising in terms of managing equipment location and travel time, of deciding on materials logistics, and especially of clearly communicating to everyone involved who was to be working where and when. People were getting dis-oriented when moving about in the project’s single-floor open work space with pods scattered in various locations. Pods were numbered but all too much looked alike. This was a very different type of work space, compared to what workers may have been used to when working floor by floor in a multi-story building. The spatiotemporal challenges on this project would only increase as manpower was building up, peaking at about 650–700 people on site per day, with everyone working in an area of about 40,000 m2.
The GC used Primavera (P6) to create the schedule of this project while intending to have that schedule serve many different purposes: (1) meet the contract requirements, (2) manage production, and (3) implement project controls. The GC created the master schedule in the preconstruction phase to study alternative execution strategies and assess their feasibility, and consulted at that time with all the major trades to get their scheduling input. The GC then used that CPM schedule not only to track project progress for contractual purposes but also to track on-site production. In our opinion, it is difficult if not impossible to serve all these purposes using essentially a single representation.
Nevertheless, the GC screened activities in the 3-week lookahead schedule created in P6, and updated that schedule on a weekly basis. Based on that schedule and feedback received from trades, trades were assigned tasks for the upcoming week. The GC assigned a work area to each task based on its superintendents’ and project managers’ tacit knowledge, and then distributed the 3-week rolling schedule to all trades concerned in weekly meetings. In the schedule, the GC further grouped activities in the lookahead schedule per cluster. For example, the lower half of Figure 2 shows cluster 1.93 that comprised six small conference rooms and three cozy rooms. Additionally, a typical activity line included: a location (aka. a cluster number), the activity name, its duration, start date, and finish date. Examples of activities included in the lookahead schedule were: “Frame walls and ceilings,” “Wall/ceiling rough in and backing,” “Pre-test and state inspection,” which was the finest level of granularity at which activities were described.
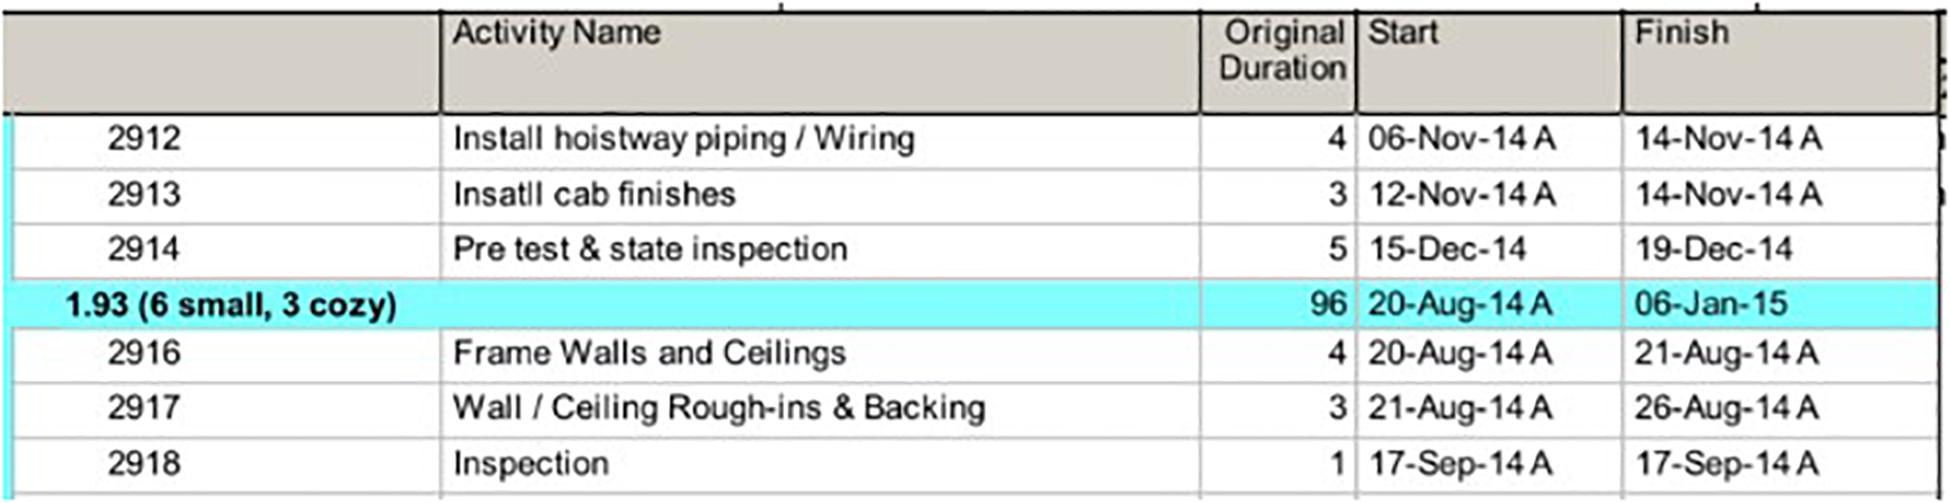
Figure 2. Example of line items in the 3-week rolling lookahead schedule.
An important fact in relation to the design of LoSite is that activity line-entries in the P6 schedule did not reference the name of the trade to which the activity was assigned. The GC saw no need to populate the P6 schedule with any of the trades’ company names, because the description of each activity in their schedule already referred to a certain scope of work, and all trades should know their scope of work and the corresponding P6 activities. When developing a schedule especially for a large complex project, omitting reference to the trade involved in any given activity is common, but this omission has consequences for the ease with which that schedule can be used in production planning and control.
Because references to trades were not explicitly shown activity by activity, the schedule could not be filtered by trade prior to its distribution in weekly meetings. As mentioned, the full 3-week rolling schedule (i.e., covering all on-going work in all areas of the entire project) was handed out to the trades every week, and the large number of tasks made it difficult for the trades to: (1) calculate and plan for the manpower they needed for the following week, and (2) relay instructions to their own crews on what work to do and where to do it. If trades had difficulties planning for their own crew sizes, then how could they commit to weekly work plans? In addition, hiccups in schedule communication were experienced on site: how could the GC rule in favor of one trade or another when two or more had to work in the same location at the same time? Not surprisingly, trades had difficulties anticipating and visualizing space handoffs with the preceding and the following trades. They also were concerned with sharing work spaces with other trades in areas with large work density (aka. clusters of rooms), where congestion appeared to be inevitable if too little attention was paid to space scheduling. Furthermore, progress control was difficult on the GC’s side as superintendents had no practical means to check every day whether trades had allocated enough resources to complete the work they were assigned.
As a result, the GC’s superintendents and the trades expressed the need for a better way to jointly develop and manage the schedule. Therefore, the conditions of satisfaction for the countermeasure, were for the researchers to make a schedule that would (1) be visual so as to foster transparency in daily coordination of the work space among trades, (2) be easy to use and time-effective, and that would not (3) require major training (4) rely on significant preparation work.
This completed one step in the action research process namely “Step 1: Diagnose the existing situation and define the research problem.” The researchers then set out to achieve this according to “Step 2: Plan the action,” by designing and programming a space use visualization program called LoSite, as described next.
Design of Computer Program to Visualize Daily Space Use
Objective for LoSite Development
The LoSite program was designed to better communicate the schedule to the trades than what could be communicated using a full 3-week rolling schedule extracted from P6. Concerns and requests raised by trades indicated that the program should help them: (1) identify where they had work to complete for a given day, (2) plan for the manpower they needed for the following week, and (3) identify space-time conflicts resulting from over-allocation of space. While trades had been identified as the main customers to the program, the GC also significantly benefited from using it.
Software Platform Selection and Implementation
Anecdotal evidence based on the authors’ first-hand industry experience and observation of superintendents’ use of software, indicates that Excel is widely used to manage field work on a day-to-day basis. When asked about the reason for choosing Excel, the response is that the interface is familiar and easy-to-use. Interestingly, Excel still has much of the look-and-feel of the program as it was 10, 20, or even 30 years ago even though, of course, the software has evolved significantly and major programming advances continue to be embedded as newer versions come onto the market. The researchers chose to develop LoSite as an Excel workbook for three reasons: (1) its availability on all computers, (2) its wide adoption by construction practitioners, and (3) the familiarity of the researchers with the Visual Basic for Applications (VBA) programming language from Microsoft. Accordingly, we wrote the LoSite program in VBA using Microsoft Excel 2014.
Figure 3 outlines the steps [1] to [7] a user must take to generate visual maps from the P6 schedule using LoSite; they are expanded on later in the paper. The LoSite program includes eight main spreadsheets: five spreadsheets contain the interiors 2D drawing of each area (A to E), one spreadsheet serves as user-friendly interface to the program, and two spreadsheets contain the data exported from P6 and imported into LoSite. In addition to those eight, other spreadsheets are used as intermediary steps to manipulate the data.
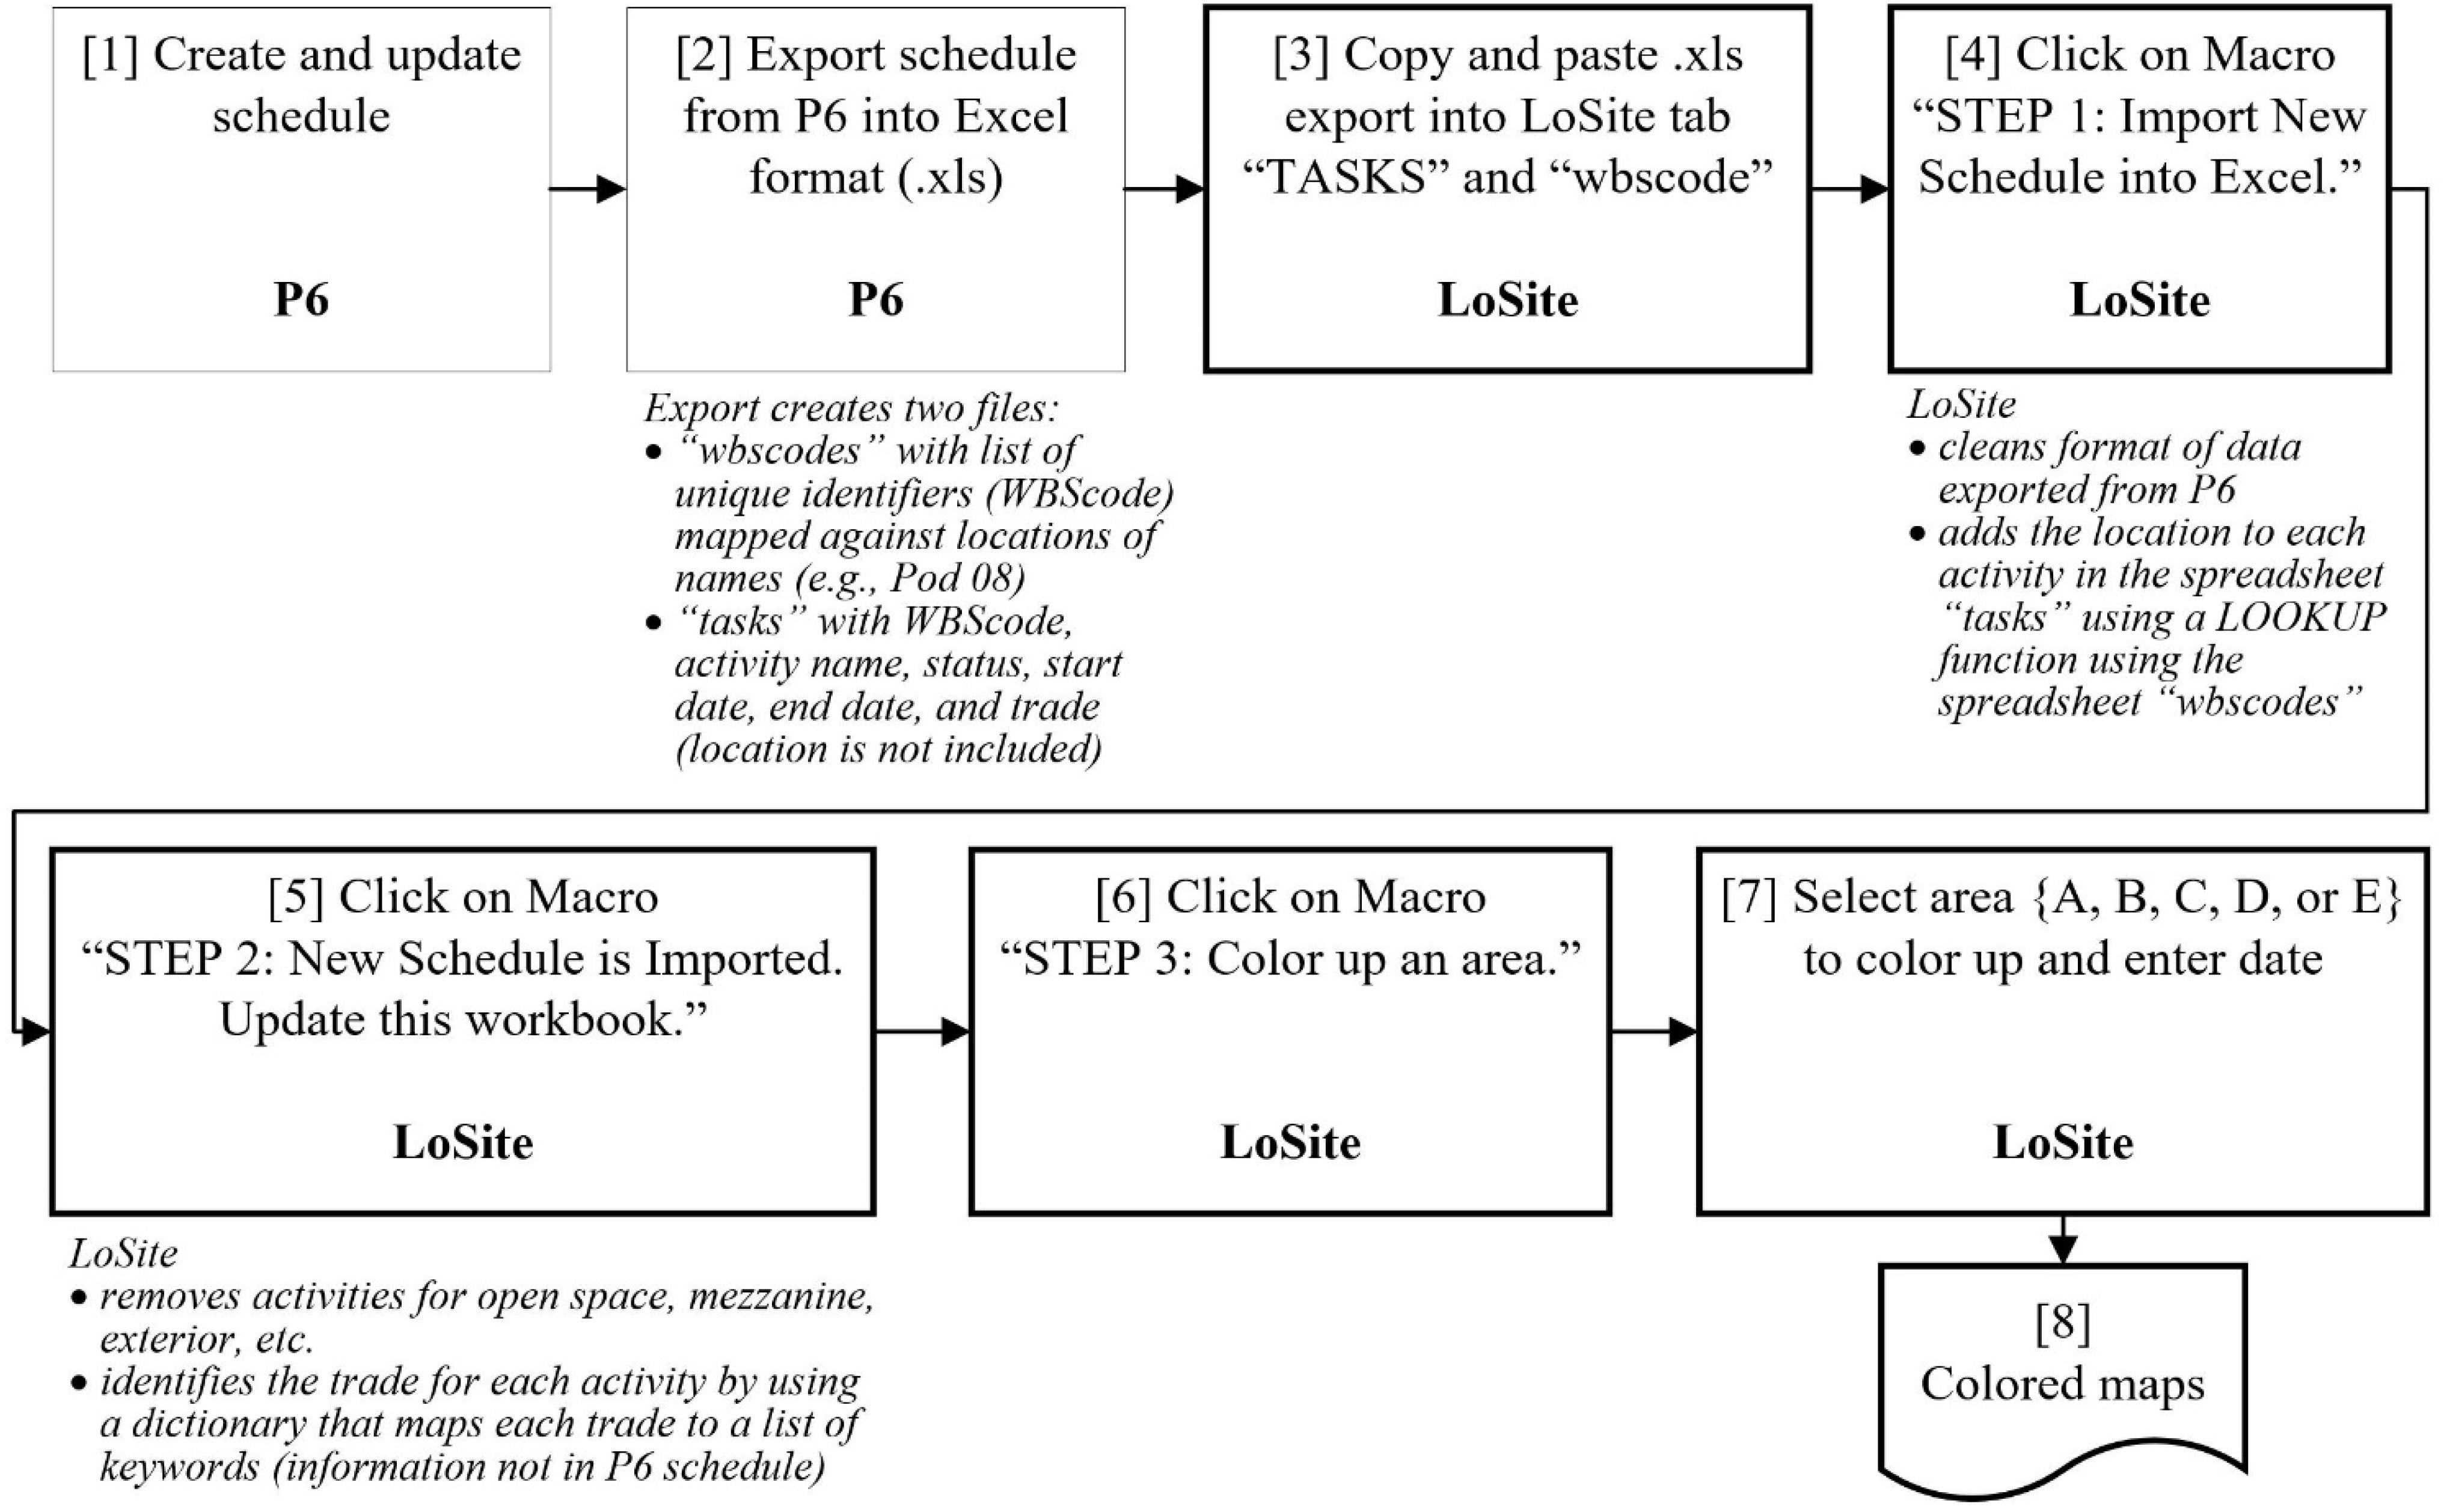
Figure 3. LoSite program design flowchart.
Figures 4, 5 depict samples of the files generated during Step [2] shown in Figure 3.
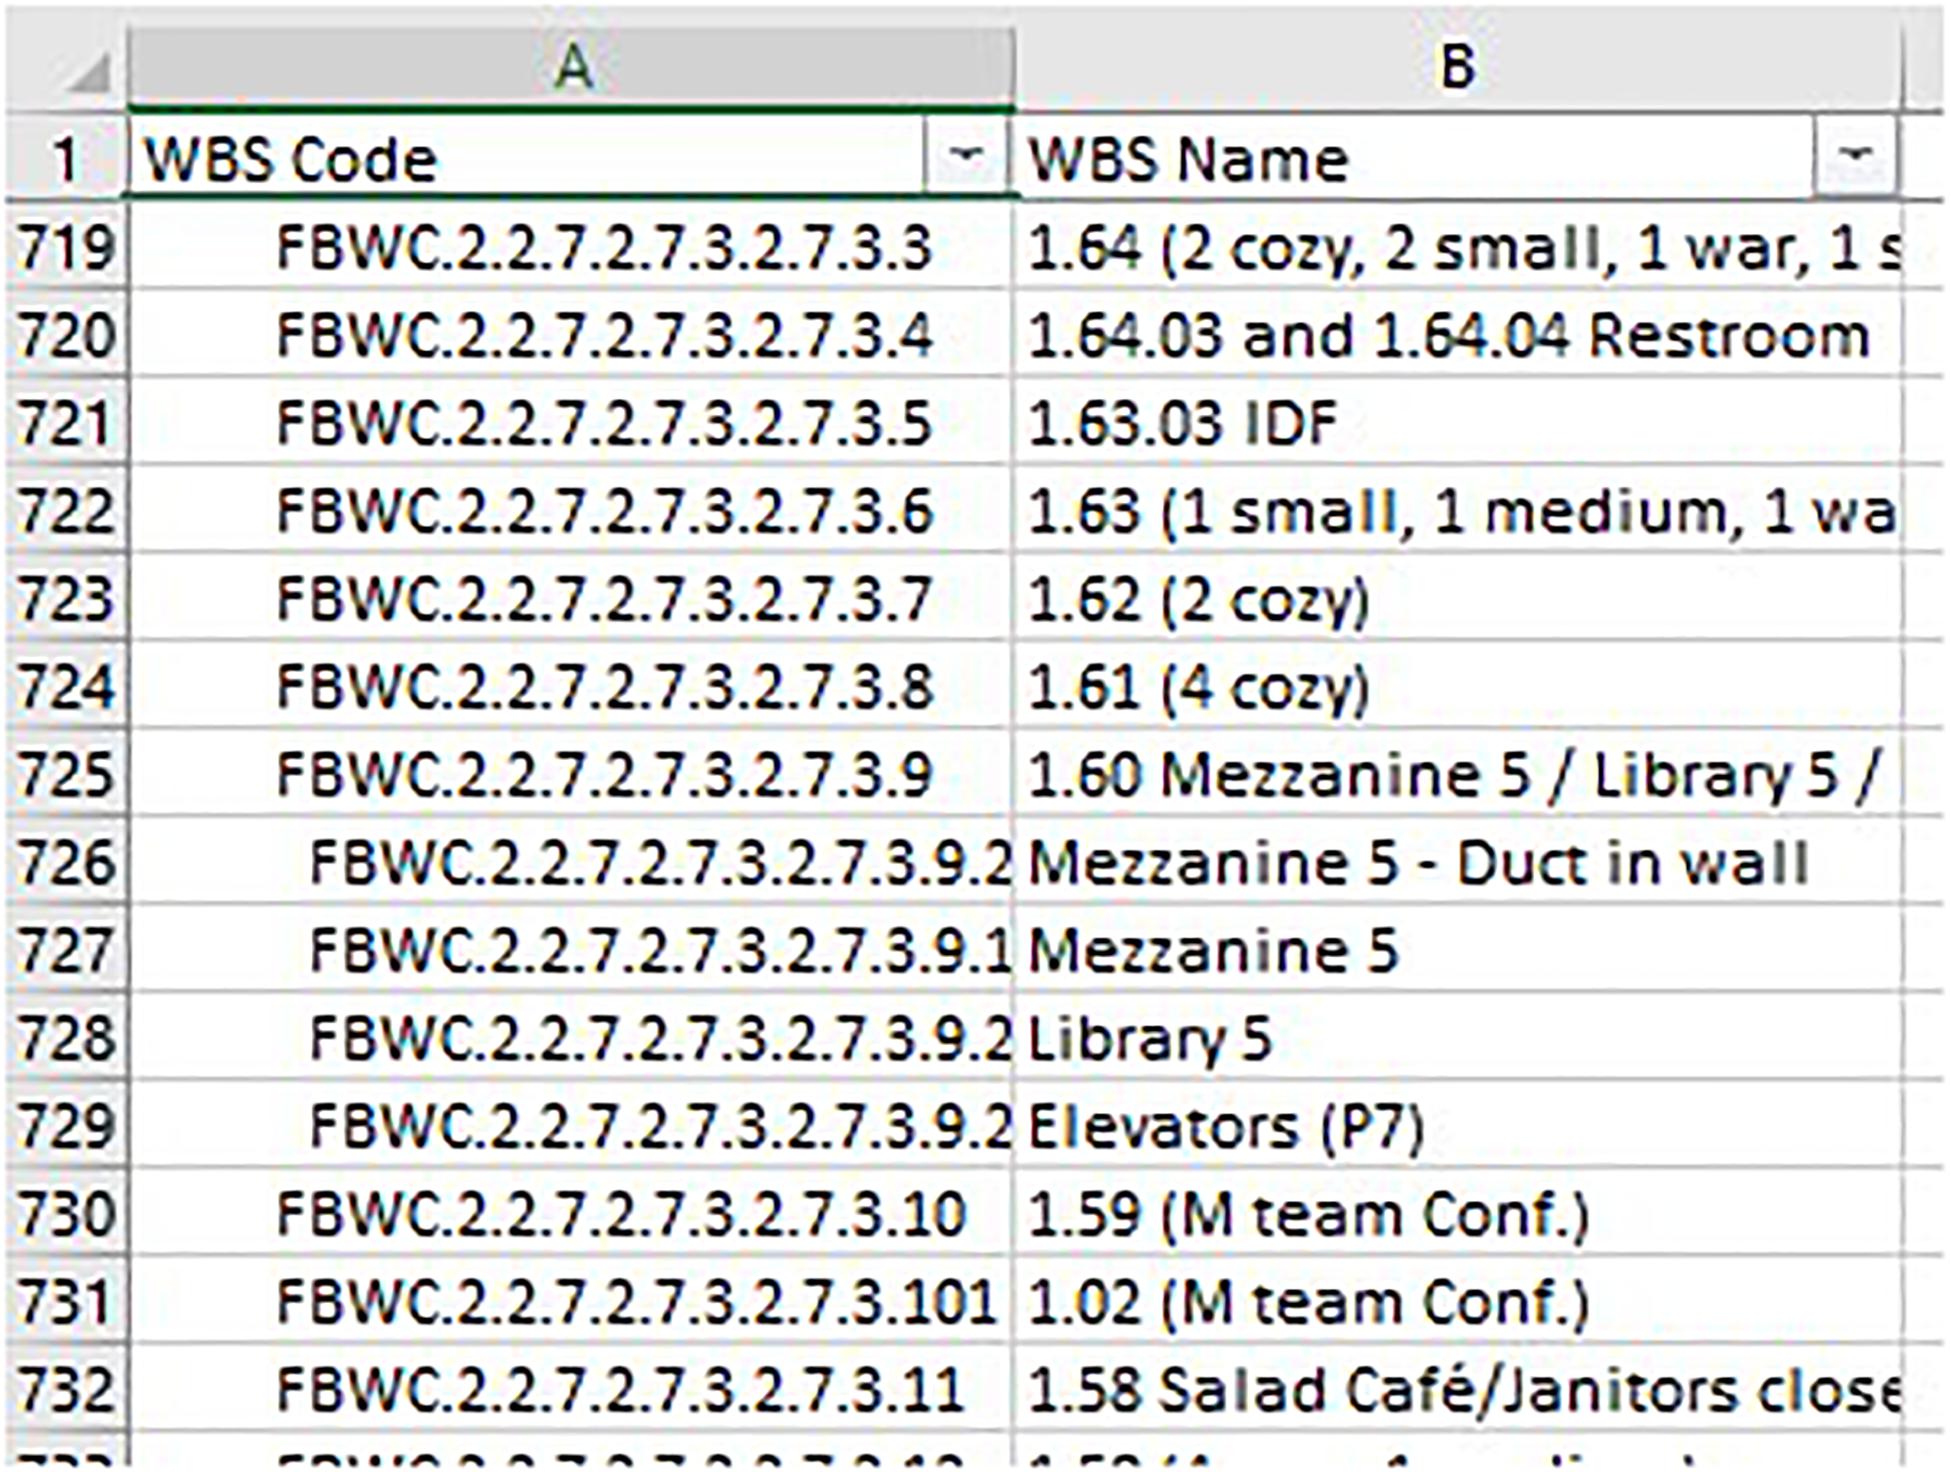
Figure 4. Sample of a WBScode spreadsheet exported from P6.
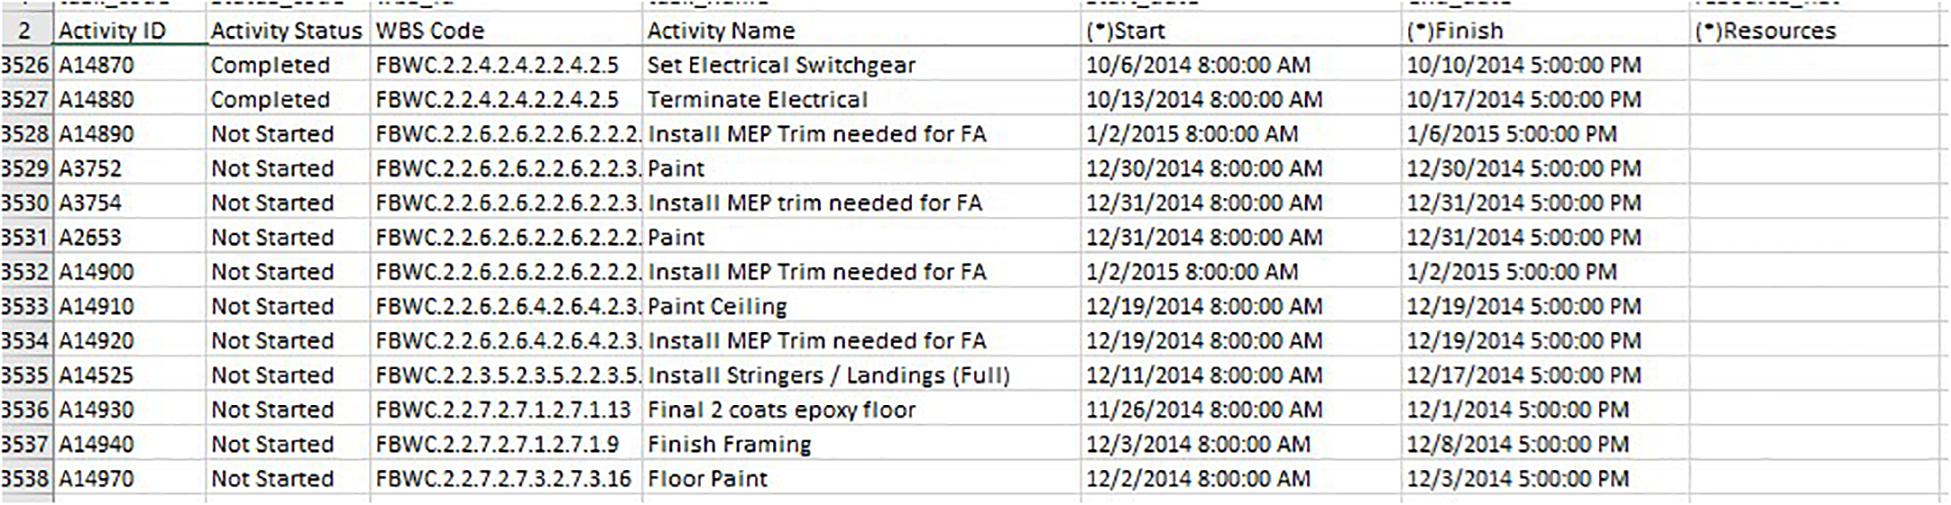
Figure 5. Sample of a “Tasks” spreadsheet exported from P6.
Besides programming Excel macros in VBA, additional preparatory work was needed in Excel to enable Step [6] shown in Figure 3. In the five spreadsheets representing the areas (A to E), each group of cells is named after its location on the floor plan. Because each cell’s name matches with the location name entered in the schedule, the program can identify which activity has to be performed in this cell. To enable the rendering shown in Figure 6, the researchers added to each area’s corresponding spreadsheet the floor plan as an image with a transparency filter.
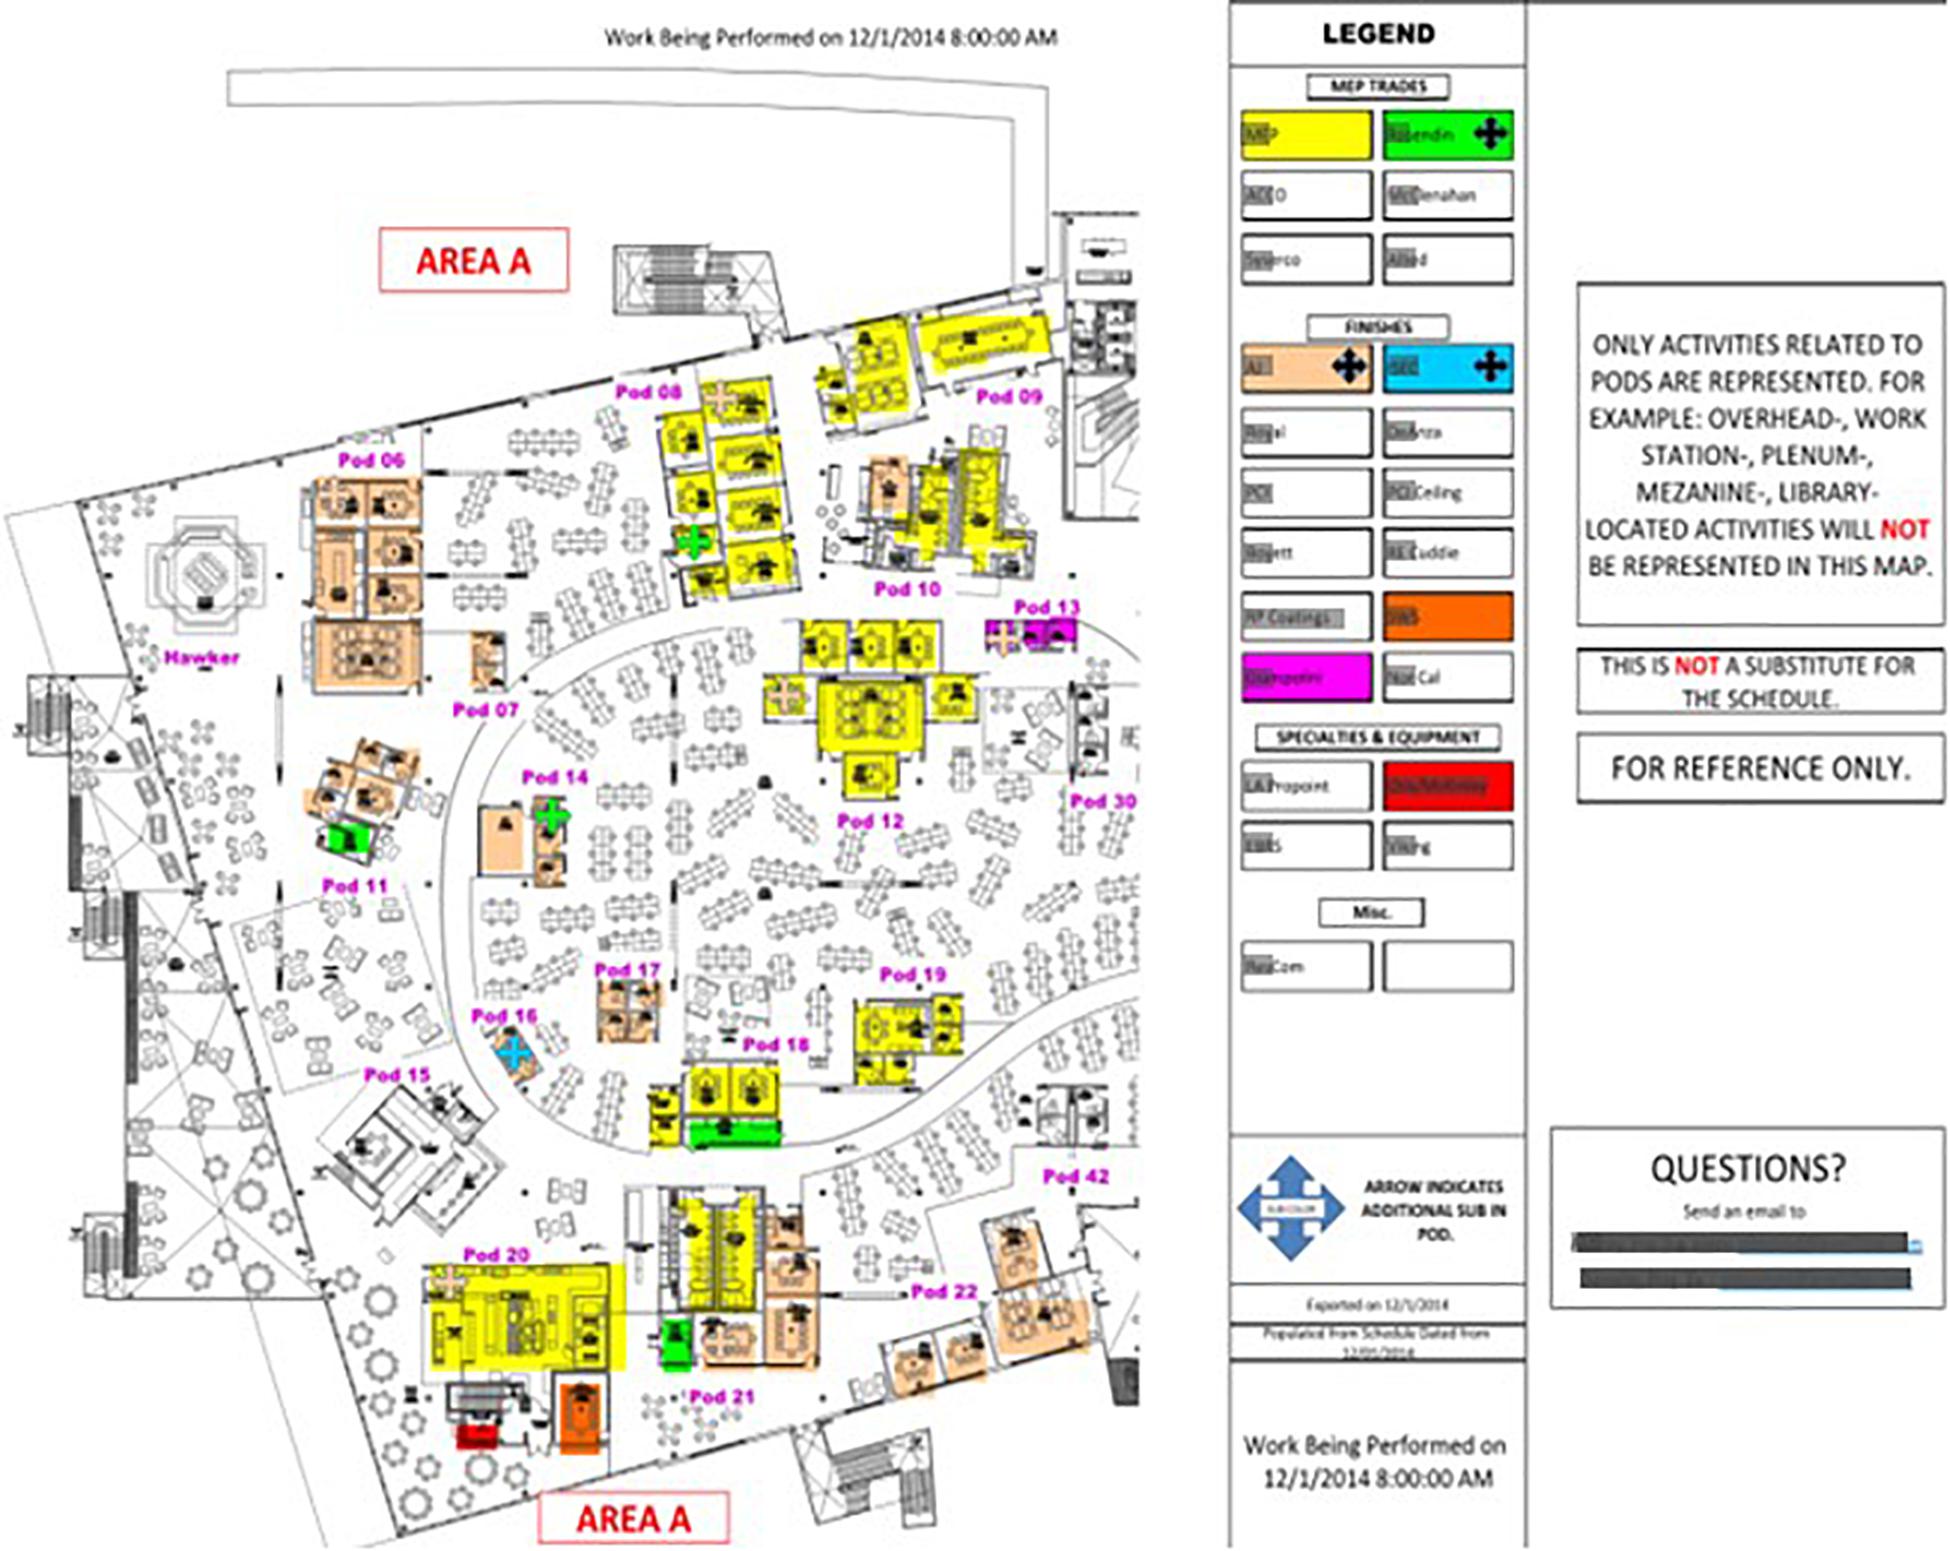
Figure 6. Output of LoSite for Area A.
During step [7], the program reads each line of the copied schedule. For each line, it checks whether or not the activity is occurring on the date the program user entered as the date for which to create a map. If so, the program identifies the corresponding trade and associated color code using a dictionary of keywords. The researchers developed this dictionary, that maps each trade to a list of keywords, so that they could “mine” the description of each activity in the P6 schedule and more-or-less automatically figure out what trade was involved. For example, the dictionary used the keywords “HM door” and “HM frame” to identify the subcontractor installing hollow metal frames and hollow metal doors respectively. The identification and selection of the keywords to uniquely identify subcontractors took trial and error. For example, the word “doors” alone could not be used to identify a subcontractor since two subcontractors were installing doors. With the trade identified for an activity, the program reads the activity location as written in the schedule, and colors up the corresponding range of cells that has a matching name. The program also colors up the corresponding name of the trade in the legend, which is divided into four main categories: (1) MEP trades, (2) Finishes, (3) Specialties and Equipment, (4) Miscellaneous. The program repeats this loop for each row of the schedule.
When two trades are scheduled to work in the same location, the program displays a four-direction arrow icon on the map. The color of the arrow corresponds to the color of the second trade sharing the space, the first trade being indicated by the color of the cells. The program also displays the arrow icon in the legend next to the second trade that shares the space. In this way, LoSite indicates where trades will be sharing space, but it provides no means to resolve space conflicts. The resolution of space conflicts is left to the people in charge of the construction schedule. When they adjust the schedule, LoSite can import the updated schedule data and depict a new map.
To summarize, the knowledge required to develop the LoSite program included: (1) Programming knowledge in VBA, (2) Familiarity with the project trades and their corresponding activities to develop the dictionary of trade keywords, and (3) Familiarity with the jobsite in order to name Excel cells after the corresponding location name as found in the P6 schedule.
User Experience
The researchers added an interface to the LoSite Excel workbook to make the program easy to use. This section elaborates on Figure 3, which described the steps taken to generate the daily space schedule. The first two steps [1] and [2] are necessary when updating the schedule. Otherwise, the user experience starts at step [3].
[1] and [2]: Create the schedule and export the data from P6 for import into LoSite.
[3], [4], and [5]: Update the LoSite workbook (Figure 7).
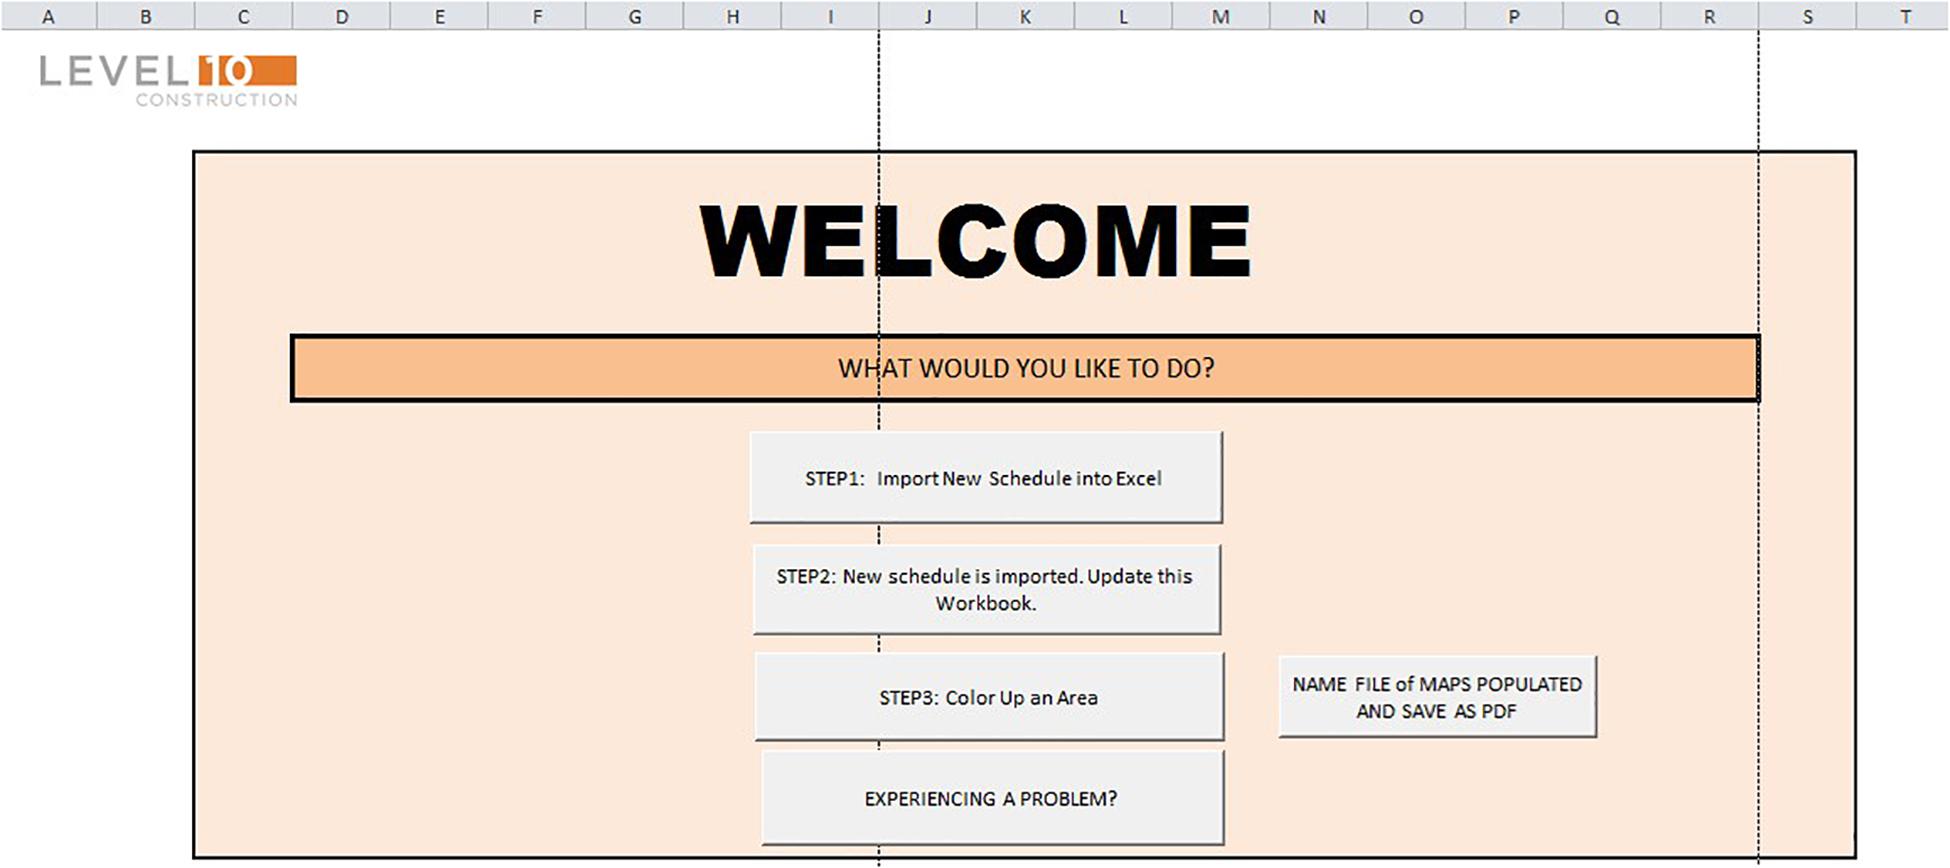
Figure 7. User interface of the daily space schedule generation program for steps [4], [5], and [6].
[6] and [7]: Select the area to color-up (Figure 8). The user can either generate the daily space schedule for a single area with a given date, or generate the daily space schedule for all areas for a given date.
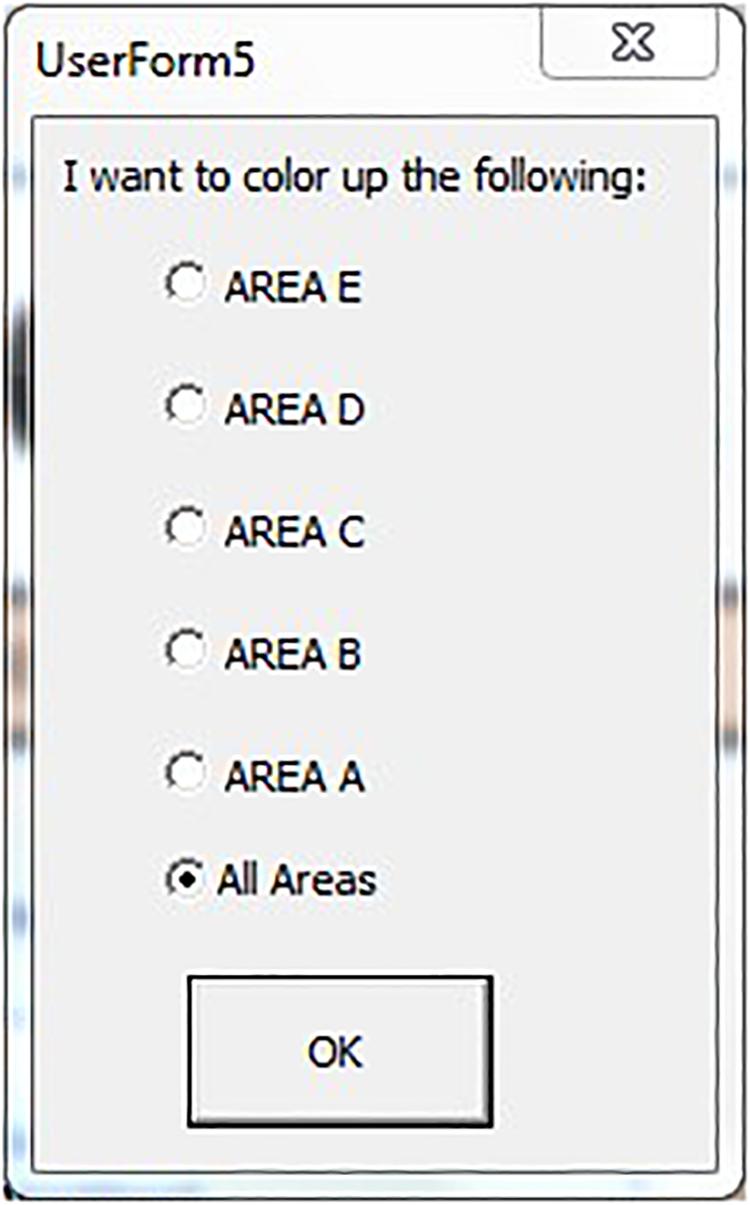
Figure 8. LoSite window for area selection in step [7].
[7]: Enter the date for schedule generation, and enter the date for the last schedule update (Figure 9).
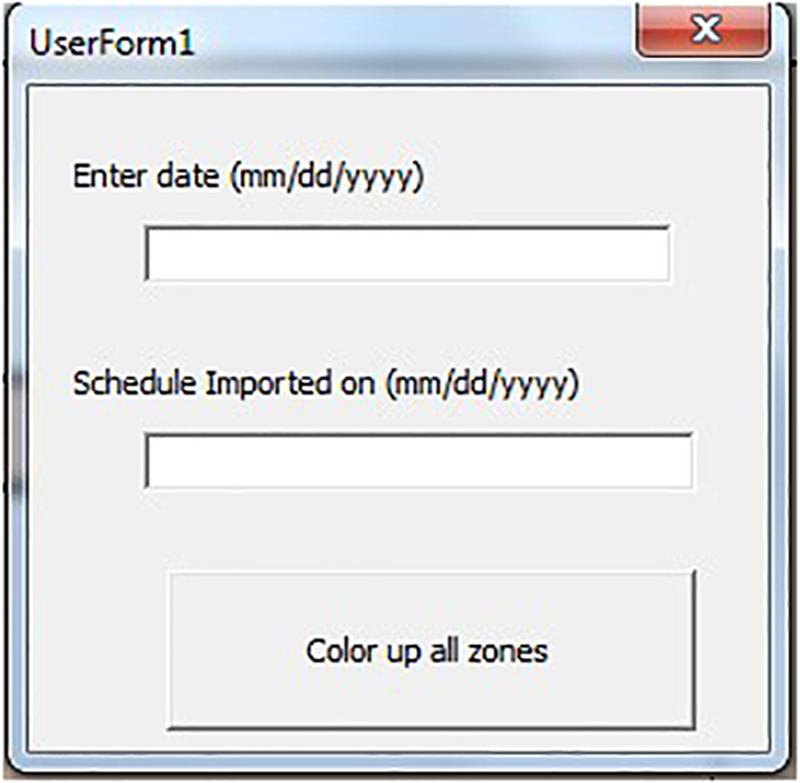
Figure 9. LoSite window for date input in step [7].
Output
Following research “Step 2: Plan the action,” which included designing the LoSite program, came “Step 3: Implement the action plan.” Figure 6 shows the output of LoSite (Step [8] in Figure 3) for a particular instance of Area A on December 1, 2014 as indicated in the top right corner. On that date, seven trades (colors: yellow, salmon, green, red, orange, blue, magenta) were scheduled to work in the different conference rooms and intermediate distribution frame (IDF) rooms. More trades may have been scheduled to work in the open space (since the open space was excluded from the program). In pods 08, 14, and 16, two trades were assigned the same space as indicated by the four-direction arrow overlaying the pods. Conversely, no trade had been assigned to work in pods 30, 42, 15 and the “Hawker” area (kitchen area) on this day. The visual representation in Figure 6 can inform the following actions:
1. The seven trades can use the map to coordinate and dispatch their crews.
2. The seven trades can use the map to relay to their respective teams the manpower, materials, tools and equipment needed for the day, so that they can come fully prepared to complete all work as planned.
3. The four trades being assigned to work in the same space are informed of the time-space conflict prior to dispatching their crews. They can work out an agreement on who will be working where among themselves or, if needed, they can escalate the issue to the GC.
4. The project manager and superintendent can revise the schedule in order to avoid that trades share the same confined space (on the same day) (four instances). A preferred output is a map showing no 4-direction arrows. On the project, the GC analyzed and eliminated time-space conflicts on a case by case basis after the generation of the maps and before handing the maps to the trades.
5. The project manager and the superintendent can assess whether they should assign a trade to work in the remaining uncolored areas (aka. unassigned work areas), based on backlog and other input.
6. Trades working in the open space area can be made aware of other trades occupying the site.
7. The superintendent can walk the site and use LoSite as a visual control for production planning and ensure that trades have dispatched manpower where needed.
While LoSite was designed with the specific goal of informing actions 1–3, the program also brought additional benefits with actions 4–7.
Field Use and Assessment
In the research process, the next step is “Step 4: Evaluate the outcomes.” Over the course of several weeks on site, the researchers generated daily space use maps every Monday for the current week, and made them available to the 5 superintendents and 22 foremen (1 per trade) on their iPad tablets. LoSite met the conditions of satisfaction that had been articulated. However, the time available for evaluating LoSite was relatively short. As mentioned, LoSite had been developed to help direct a workforce that peaked at around 650–700 people on site per day working in an area of 40,000 m2 during the finishes phase of construction. When that phase neared completion, the production focus transitioned to the approximately 2-months long inspections phase, with project completion targeted for late February, early March, and owner move-in to start right after. The need for spatiotemporal planning diminished in the inspections phase because the density of workers on site reduced significantly. As a result, LoSite was viewed as not being so useful anymore. With management staffing tapering off as well, no one on the project staff took ownership of LoSite when the researcher was no longer available to support its use.
Discussion with the trades and the superintendents to validate the capabilities and usefulness of LoSite revealed some challenges: (1) the open space area was not colored-up in LoSite so the program did not provide the functionality it did for the clusters (see aforementioned list of seven actions), and (2) the name of the activity to perform in a room was not indicated on the maps. These would not be hard to overcome in future software releases.
The first challenge stressed the importance of defining a LBS that facilitates production planning in all areas of the project, as well as the importance of allocating a clearly demarcated area to each activity in the schedule. This was not done for the open space. It was large and this made it (seemingly) acceptable to have multiple activities take place it in concurrently. Logistically, this was not a problem since the open space was large enough in each zone to allow multiple trades to work concurrently and not interfere with one another. However, temporary facilities (such as scaffolding for ceiling work) and materials staging did create obstructions. Moreover, because of its size and lacking demarcated zones, project progress was more difficult to assess in this area.
The second challenge was brought up by the GC even though the GC was initially not the intended beneficiary of the use of LoSite. Yet, the GC used LoSite for different purposes: (1) check the quality of the schedule, (2) schedule backlog activities in unassigned rooms, and (3) track resource commitments from trades. Regarding (1) and (2), when a room was not colored-up on a given day, no activity had been scheduled to take place there. It either meant that the schedule was incorrect (i.e., an activity had been overlooked, a finish-to-start relationship omitted, etc.) or that a backlog activity could be assigned. Regarding (3), superintendents were using the colored maps to check that trades were actually working in all of their assigned rooms on a given day.
Discussion
LoSite proved in concept that Excel could be used for daily site space management. Its use in practice showed that space use visualization can benefit both the trades and the GC. For the trades, understanding the work schedule is critical to plan for manpower. On large projects, this process is facilitated when the quantity of the work is conveyed location-by-location, in area quantities. Manpower depends on how scattered the work is that is to be done on the project site, which was also captured in the maps. For the GC, space use visualization helped to facilitate production control, avoid time space conflicts, and catch mistakes in the schedule. Because LoSite could not capture space use in areas that were not precisely delimited (see uncolored space in Figure 6), it emphasized the importance of the LBS for production control. Ill-defined work areas were a symptom of lack of work flow coordination from the GC. It also enabled superintendents to track resource commitments from trades. For the GC and the trades, LoSite fostered transparency in daily coordination of work space.
A key lesson learned in the development and use of LoSite is that, despite using software that is familiar, users must of course see value in using it and have time to embrace the process itself too. Not only BIM or sophisticated scheduling tools but also simple tools need people to embrace them. It is possible that, if the LoSite output had been marketed better to the trades (e.g., printouts posted around the site to facilitate discussions about time-space conflicts) and also to everyone involved in the inspection phase, trades and management might have been more vocal about wanting to see its use continue. This lesson has informed our follow-on research, pursued according to the last step of the research process: “Step 5: Learn by repeating these steps.”
In follow-on research, we have taken the use of simple tools for spatiotemporal modeling using Excel one step further than we did with LoSite. We reconceptualized our thinking about spatiotemporal modeling based on the recognition that what matters in trade coordination is how much time each trade spends in what area to do their work, a concept for which we coined the term “work density” (Tommelein, 2017). Work density is informed by data that may be modeled in a BIM (e.g., quantities and locations of products to be installed in situ, and temporary facilities, if modeled) but amalgamates the specifics of many other throttles that drive production in construction and tend to not be included in a BIM. Work density is expressed in unit of time per unit of area and helps decide how to divide site space into work zones. This method for zoning site space is very different from what is done when using the LoB. We developed the work density method to support takt planning using Excel for VM (Singh et al., 2020) and using mathematical optimization (Jabbari et al., 2020). We see value in developing more sophisticated models to support established approaches for spatiotemporal modeling (as many researchers do), as well as in rethinking the purpose and objectives to be achieved with such models.
Conclusion
Due to an increase in both project complexity and speed, scheduling the details of space use over time is increasingly necessary to facilitate production planning and project execution. Seeing the details helps people understand the work schedule, facilitates production control, and fosters transparency in daily coordination of work space among trades. It is done by means of work structuring and definition of Location Breakdown Structures for each phase of work.
Informed by the effectiveness of visual management (VM) in other domains, the researchers developed LoSite, a simple Excel program that helps people visualize daily construction site space use. The researchers prototyped, deployed, and tested the space scheduling program to visualize work being done during the interiors phase of a commercial office building.
Visual controls are designed to make problems, abnormalities, or deviations from standards visible to everyone. When these deviations are visible and apparent to all, action can be taken to immediately correct them. LoSite is a visual control tool designed for the GC and trades to spot space-time conflicts on a day-to-day basis so that these conflicts could be addressed right away.
In addition to the work density modeling and optimization already mentioned in the discussion section, further research is in order to assess the benefits of space use visualization on space hand-off reliability. As space use visualization facilitates the trades making commitments to complete activities in well-defined areas, doing so creates a win-win situation for everyone on the project.
Data Availability Statement
The datasets generated for this study will not be made publicly available. Only samples of the full data set were used to develop the program that is presented in this article. Several figures illustrate what the data looks like. The full data set pertains to a real construction project, neither do we have access to it, nor is it relevant to this publication to provide such.
Author Contributions
AB was the researcher on site who designed, developed, and piloted the LOSite computer program. IT was her academic adviser who provided input to this effort. DD was the project executive who also provided input to this effort by engaging her team and obtaining feedback. AB and IT took the lead on writing the manuscript and DD offered valuable feedback. All authors contributed to the manuscript and approved the submitted version.
Funding
This research was funded in part by gifts made to the Project Production Systems Laboratory (P2SL – https://p2sl.berkeley.edu). All support is gratefully acknowledged. Any opinions, findings, conclusions, or recommendations expressed in this manuscript are those of the authors and do not necessarily reflect the views of the P2SL members.
Conflict of Interest
The authors declare that the research was conducted in the absence of any commercial or financial relationships that could be construed as a potential conflict of interest.
Acknowledgments
We sincerely thank the general contractor and their trade-partner team for engaging with us in research on their complex project.
References
Akinci, B., and Fischer, M. (2000). “An automated approach for accounting for spaces required by construction activities,” in Proceedings of the ASCE, Constr. Congr. VI, Orlando, FL, 20–22.
Akinci, B., Fischer, M., Levitt, R., and Carlson, R. (2002). Formalization and automation of time-space conflict analysis. ASCE J. Comput. Civ. Eng. 16, 124–134. doi: 10.1061/(asce)0887-3801(2002)16:2(124)
Bascoul, A. M., and Tommelein, I. D. (2017). “Visualizing daily on-site space use,” in Proceedings of the 25th Ann. Conf. Int. Group for Lean Constr. (IGLC 25), Heraklion, 597–604.
Baskerville, R. L. (1999). Investigating Information Systems with Action Research. Commun. Assoc. Info. Syst. 2, 7–17.
Birrell, G. S. (1987). Discussion of ‘Criticism of CPM for Project Planning Analysis by Ali Jaafari. ASCE J. Constr. Eng. Manage 110, 343–345. doi: 10.1061/(ASCE)0733-93641987113:2(343)
Brady, D. A. (2014). Using Visual Management to Improve Transparency in Planning and Control in Construction. PhD Thesis, Univ. of Salford, Salford.
Cheng, M. Y., and O’Connor, J. T. (1996). ArcSite: enhanced GIS for Construction Site Layout. ASCE J. Constr. Eng. Manage. 122, 329–336. doi: 10.1061/(asce)0733-9364(1996)122:4(329)
Cheng, M. Y., and Yang, S. Y. (2001). GIS-based cost estimates integrating with material layout planning. ASCE J. Constr. Engrg. Manag. 291–299. doi: 10.1061/(asce)0733-9364(2001)127:4(291)
Dave, B., Kubler, S., Främling, K., and Koskela, L. (2016). Opportunities for enhanced lean construction management using internet of things standards. Autom. Constr. 61, 86–97. doi: 10.1016/j.autcon.2015.10.009
Fischer, M., Garcia-Lopez, N. P., and Morkos, R. (2018). “Making each workhour count: improving the prediction of construction durations and resource allocations,” in Proceedings of the 25th EG-ICE International Workshop Advanced Computing Strategies for Engineering, Lausanne.
Formoso, C. T., Dos Santos, A., and Powell, J. (2002). An exploratory study on the applicability of process transparency in construction sites. J. Constr. Res. 3, 35–54. doi: 10.1142/S1609945102000102
Francis, A. (2019). Chronological spatiotemporal scheduling optimization for building projects. Front. Built Environ. 5:36. doi: 10.3389/fbuil.2019.00036
Frandson, A. G., Seppänen, O., and Tommelein, I. D. (2015). “Comparison between location based management and takt time planning,” in Proceedings of the 24th Ann. Conf. Int. Group for Lean Construction (IGLC 24), Boston, MA.
Galsworth, G. D. (1997). Visual Systems: Harnessing the Power of the Visual Workplace. New York, NY: American Mgmt. Assoc.
Gregor, S., and Hevner, A. R. (2013). Positioning and presenting design science research for maximum impact. MIS Quarterly 37, 337–355. doi: 10.25300/misq/2013/37.2.01
Greif, M. (1991). The Visual Factory: Building Participation Through Shared Information. Portland, OR: Productivity Press.
Guo, S.-J. (2002). Identification and resolution of work space conflicts in building construction. J. Constr. Eng. Manage. 128, 287–295. doi: 10.1061/(asce)0733-9364(2002)128:4(287)
Harris, R. B., and Ioannou, P. G. (1998). Scheduling projects with repeating activities. J. Constr. Eng. Manage. 124, 269–278. doi: 10.1061/(asce)0733-9364(1998)124:4(269)
Hevner, A. R., March, S. T., Park, J., and Ram, S. (2004). Design science in information systems research. MIS Quarterly 28, 75–105.
Hosny, A. H., Nassar, K., and Hosny, O. (2013). “Analysis and definition of spatial temporal measures,” in Proceedings of the ISEC-7 New Developments in Structural Engineering and Construction, Honolulu, HI, 18–23.
Hosny, A. H. O. A. H. (2013). Spatial and Temporal Measures: A New Dimension for Planning. MS Thesis, American Univ., Cairo.
Jabbari, A., Tommelein, I. D., and Kaminsky, P. M. (2020). Workload leveling based on work space zoning for takt planning. Autom. Constr. 118:103223 doi: 10.1016/j.autcon.2020.103223
Järvinen, P. (2007). Action research is similar to design science. Qual. Quant. 41, 37–54. doi: 10.1007/s11135-005-5427-1
Kenley, R. (2004). “Project micro-management: practical site planning and management of work flow,” in Proceedings of the 12th Ann. Conf. Int. Group for Lean Construction, eds S. Bertelsen and C. T. Formoso (Helsingør).
Kenley, R., and Seppänen, O. (2006). Location-Based Management for Construction: Planning, Scheduling and Control. London: Routledge.
Kenley, R., and Seppänen, O. (2009). “Location-based management of construction projects: part of a new typology for project scheduling methodologies,” in Proceedings of the 2009 Winter Simul. Conf. (WSC) (Piscataway, NJ: IEEE), 2563–2570.
Kim, C., Kim, B., and Kim, H. (2013). 4D CAD model updating using image processing-based construction progress monitoring. Autom. Constr. 35, 44–52. doi: 10.1016/j.autcon.2013.03.005
Koskela, L. (2000). An Exploration Towards a Production Theory and its Application to Construction. PhD Thesis, VTT Technical Res. Centre of Finland, Finland.
Lewin, K. (1946). Action research and minority problems. J. Social Issues 2, 34–46. doi: 10.1111/j.1540-4560.1946.tb02295.x
Liker, J. (2004). The Toyota Way: 14 Management Principles from the World’s Greatest Manufacturer. New York, NY: McGraw-Hill Education.
Liu, H., Al-Hussein, M., and Liu, M. (2015). BIM-based integrated approach for detailed construction scheduling under resource constraints. Autom. Constr. 53, 29–43. doi: 10.1016/j.autcon.2015.03.008
McKinney, K., Kim, J., Fischer, M., and Howard, C. (1996). Interactive 4D CAD. Comput. Civil Engrg. 20, 381–389.
Riley, D. R., and Sanvido, V. E. (1995). Patterns of const.-space use in multistory buildings. ASCE J. Constr. Eng. Mgmt. 121, 464–473. doi: 10.1061/(asce)0733-9364(1995)121:4(464)
Singh, V. V., Tommelein, I. D., and Bardaweel, L. (2020). “Visual tool for workload leveling using the work density method for takt planning,” in Proceedings of the 28th Annual Conference of the International Group for Lean Construction (IGLC28), Berkeley, CA. doi: 10.24928/2020/0061
Sriprasert, E., and Dawood, N. N. (2003). Multi-constraint information management and visualisation for collaborative planning and control in construction. Electr. J. Info. Tech. Constr. 8, 341–366.
Tezel, A., and Koskela, L. (2009). “Visual management - a general overview,” in Proceedings of the 5th Int’l Conf. on Constr. in the 21st Century (CITC-V), Istanbul.
Tezel, A., Koskela, L., and Tzortzopoulos, P. (2009). “The functions of visual management,” in Proceedings of the Int’l. Research Symp, Salford.
Tezel, A., Koskela, L., and Tzortzopoulos, P. (2010). Visual Management in Construction: Study Report on Brazilian Cases. SCRI Research Report 3, Salford Centre for Research and Innovation in the built and human environment (SCRI). Salford: Univ. of Salford.
Thabet, W., and Beliveau, Y. (1994). Modeling workspace to schedule repetitive floors in multistory buildings. ASCE J. Constr. Eng. Manage. 120, 96–116. doi: 10.1061/(asce)0733-9364(1994)120:1(96)
Tommelein, I. D. (1991). “Site layout: where should it go?,” in Proceedings of the Constr. in the 21st Century, Proc. Constr. Congr. 91 (Cambridge, MA: ASCE), 632–637.
Tommelein, I. D. (2017). “Collaborative takt time planning of non-repetitive work,” in Proceedings of the 25th Ann. Conf. Int. Group for Lean Construction, Heraklion, 745–752.
Tommelein, I. D., and Demirkesen, S. (2018). Mistakeproofing the Design of Construction Processes Using Inventive Problem Solving. Silver Spring, MD: CPWR.
Tommelein, I. D., and Zouein, P. P. (1992). “Activity-level space scheduling,” in Proceedings of the 9th Int’l. Symp. on Autom. And Robotics in Constr, Tokyo.
Tommelein, I. D., and Zouein, P. P. (1993). Interactive dynamic layout planning. ASCE J. Constr. Eng. Manage. 119, 266–287. doi: 10.1061/(asce)0733-9364(1993)119:2(266)
Valente, C. P., Brandalise, F. M. P., and Formoso, C. T. (2019). Model for devising visual management systems on construction sites. ASCE J. Constr. Eng. Manage. 145:04018138. doi: 10.1061/(ASCE)CO.1943-7862.0001596
Wikipedia (2019). Visual Control. Available online at: https://en.wikipedia.org/wiki/Visual_control (accessed June 6, 2020).
Keywords: lean construction, visual management, daily space use, space scheduling, contractor coordination
Citation: Bascoul AM, Tommelein ID and Douthett D (2020) Visual Management of Daily Construction Site Space Use. Front. Built Environ. 6:139. doi: 10.3389/fbuil.2020.00139
Received: 02 March 2020; Accepted: 27 July 2020;
Published: 11 September 2020.
Edited by:
Borja Garcia de Soto, New York University Abu Dhabi, United Arab EmiratesReviewed by:
Daniel Mark Hall, ETH Zürich, SwitzerlandAnne Susan Fitchett, University of the Witwatersrand, South Africa
Patricia Tzortzopoulos, University of Huddersfield, United Kingdom
Copyright © 2020 Bascoul, Tommelein and Douthett. This is an open-access article distributed under the terms of the Creative Commons Attribution License (CC BY). The use, distribution or reproduction in other forums is permitted, provided the original author(s) and the copyright owner(s) are credited and that the original publication in this journal is cited, in accordance with accepted academic practice. No use, distribution or reproduction is permitted which does not comply with these terms.
*Correspondence: Iris D. Tommelein, dG9tbWVsZWluQGJlcmtlbGV5LmVkdQ==
†ORCID: Audrey M. Bascoul, orcid.org/0000-0001-8176-0041; Iris D. Tommelein, orcid.org/0000-0002-9941-6596; Danielle Douthett, orcid.org/0000-0003-4700-575X