 Yaohan Li
 You Dong
 Deming Zhu
- Department of Civil and Environmental Engineering, The Hong Kong Polytechnic University, Hong Kong, China
Coastal civil infrastructure can be susceptible to damages caused by hurricanes throughout its service life. Vulnerability assessment is a key component in hazard risk management of civil infrastructure systems. Previously, most studies assume storm parameters are independent when computing the vulnerability of infrastructure to hurricanes. Due to the complicated interactive effects between storm parameters during hurricanes, the independent model may mis-specify such intercorrelation, thus resulting in inaccurate estimation of the probability of failure. This paper proposes a copula-based vulnerability assessment framework to investigate the impact of dependent storm parameters on the vulnerability of civil infrastructure subjected to hurricanes. The developed framework is applied to a typical simply supported bridge to compute the probability with respect to deck unseating failure under hurricane hazards. The copula approach provides superior efficiency in modeling dependency between the maximum wave height and peak water level, by separately considering marginal distributions and the joint effects. Probabilistic wave-induced load acting on the bridge deck is computed using a three-dimensional computational fluid dynamics model, incorporating uncertainties associated with hazard parameters. The effect of correlated storm parameters and the tail dependence characteristics on the bridge vulnerability is investigated by using different copula models, including Clayton, Gaussian, and Hüsler-Reiss copula functions. By incorporating dependent hazard parameters, the failure probability of the bridge may be significantly increased for non-major hurricanes (e.g., with a 50-year return period), while the failure probability under major hurricanes (e.g., with a 500-year return period) may not be severely affected.
Introduction
Recently, substantial financial and social losses caused by hurricane events, such as Hurricane Harvey 2017 and Hurricane Irma 2017, raised awareness of the government and the public to risk assessment and management. For instance, as stated by the U.S. Federal Emergency Agency (FEMA), commodities and essential resources including water and meals were exhausted during the emergency responses to Hurricanes Harvey and Irma (Raymond et al., 2020). Though efforts were made to minimize damages and losses, hurricanes remain one of the most hazardous and costly natural hazards [NOAA National Centers for Environmental Information (NECI), 2020]. In hurricane-prone areas, coastal civil infrastructure systems, such as highway bridges, are exposed to hurricane hazards throughout their lifetime. The repair and replacement of these systems may cause significant social disruption and economic consequences to the community. In order to manage such risks and enhance the resilience of coastal communities, it is crucial to assess the vulnerability of civil infrastructure under hurricane hazards.
Hazards have either independent or interacting effects with respect to their source, frequency, intensity, and region of impact. Multiple hazards can be divided into three categories: independent, successive, and concurrent. For instance, independent hazards are discrete and there is no natural interaction. Successive hazards refer to the scenario that a hazard is triggered, broadened, or intensified by another, while concurrent hazards are defined as hazards that overlap or occur simultaneously over time (Zaghi et al., 2016; Akiyama et al., 2020). A hurricane reflects a multi-hazard feature, due to the joint occurrence of strong wind, high waves, and significant storm surge (Bjarnadottir et al., 2014; Gidaris et al., 2017). During hurricanes, coastal infrastructure systems are vulnerable to damages resulting from hurricane-induced storm surge and wave loading. For instance, a total number of 44 highway bridges along the American Gulf Coast region were damaged during Hurricane Katrina [Technical Lifelines Council for Earthquake Engineering (TCLEE), 2006]. Most of these bridges were simply supported and destroyed due to wave and surge forces, thus resulting in unseating of bridge superstructures (Padgett et al., 2008). Such unseating failure occurs when the uplift wave force on the deck exceeds vertical capacity (Ataei and Padgett, 2013; Mondoro et al., 2017; Zhu and Dong, 2020). Subsequently, the impact of hurricanes on coastal infrastructure and bridges is widely investigated, in terms of the vulnerability assessment (Ataei and Padgett, 2013; Saeidpour et al., 2019). By considering uncertainties in structural and hazard parameters, probabilistic modeling of capacity and demand of bridges can be performed. Based on the modeling, fragility models of a bridge considering different intensity measures can be developed and the probability of failure can be assessed (Porter, 2003; Qian and Dong, 2020). These results are significant information for the subsequent risk assessment with respect to loss estimation and decision making on the repair and retrofitting (Frangopol et al., 2017).
In the vulnerability assessment, appropriate modeling of capacity and demand plays a vital role. A conventional approach to assess vulnerability subjected to hurricane hazards is based on a single parameter, e.g., the wave height. The main limitation of such univariate assessment is that the prediction of failure probability of infrastructure is highly dependent on the selected parameter. In consequence, the impact of model parameter variation on infrastructure performance has to be assessed by costly re-analysis of different sets of parameter combinations (Ghosh et al., 2013). To address such limitations, multivariate fragility analysis has been increasingly applied in hazard risk assessment. For instance, Jane et al. (2018) presented a fragility representation for shingle beaches based on multiple variables, including wave height, period, and water level. The dependence between geometric parameters was modeled by a Gaussian copula. By incorporating the inundation hazard assessment model, Vorogushyn et al. (2010) conducted a comprehensive flood hazard assessment to compute the probability of failure of dike breaches. Multiple intensity indicators were involved in their work, such as flow velocity, inundation depth, and inundation duration. Charvet et al. (2015) proposed the representation of multivariate fragility functions for the city of Kesennuma subjected to tsunami damage, by considering different tsunami intensity measures (e.g., the surveyed flow depth, simulated flow velocity, and the debris impact). Segura et al. (2020) presented a multivariate fragility assessment framework to generate seismic fragility surfaces of concrete gravity dams incorporating machine learning techniques.
For the multivariate analysis under extreme events, it is commonly necessary to evaluate the interaction of hydrodynamic variables, as the sea state condition primarily relies on these parameters simultaneously [DET NORSKE VERITAS (DNV), 2014]. For instance, during hurricanes, elevated sea level and extreme waves can be caused by atmospheric pressure change and extreme wind (Mousavi et al., 2011). Masina et al. (2015) demonstrated that there is a non-negligible positive correlation among variables such as significant wave height and peak water level under storm events. Chebana and Ouarda (2011) showed that the univariate variables cannot provide a comprehensive representation of the multivariate nature of hydrological events. Moreover, due to the interaction between parameters, the compounding impact of non-severe environmental activities may result in significant consequences. For instance, Serafin et al. (2019) investigated the impact of multiple loads on along-river water levels and indicated that there was a portion of peak storm surge observed during low-wave events along the coastal river. In their study, a surrogate model was applied to simulate the joint relationship between river discharge and wave height based on hydraulic modeling. Hence, analyses based on exclusively univariate distributions may mis-specify the coastal conditions, thus resulting in inaccurate estimation of the associated damages or consequences, e.g., Corbella and Stretch (2012). Therefore, the joint impact of storm variables should be accounted for the vulnerability assessment and risk management of coastal infrastructure.
In previous studies, the multivariate impact was commonly taken into account by assuming the joint probability distribution based on empirical models. For instance, Ataei and Padgett (2013) conducted a fragility analysis of coastal bridges subjected to hurricanes considering intensity measures with respect to relative surge elevation and wave height. A joint probabilistic density function was used to describe the dependence between wave height and wave period. Lucas and Soares (2015) proposed the bivariate distributions of the mean wave period and significant wave height based on a conditional modeling method. Nevertheless, the dependency structure between variables using the joint probability distributions is limited to simple relationships with constant correlation coefficients. Consequently, advanced mathematical techniques such as copulas should be employed to address such limitations.
The copula approach can be employed to model the dependence of storm variables for the probabilistic vulnerability assessment of infrastructure subjected to hurricanes. A copula function couples the multivariate distribution function to their marginal distribution functions (Nelsen, 2006). Compared with the conventional joint model, the copula approach provides significant flexibility, as it specifies the dependence structure and the univariate distributions separately. Due to its merits, the copula tool has been widely applied to coastal hazard analysis to model dependency among hazard parameters. For instance, De Michele and Salvadori (2003) proposed a 2-Copula to describe the dependence between the average rainfall intensity and storm duration during storm rainfall, in which both variables have heavy tail distributions. Bushra et al. (2019) employed the Gumbel copula to model the dependence of storm surge on the cyclone wind speed along the coastline of the Bay of Bengal. Another study performed by Trepanier et al. (2017) assessed the risk of more than 20 coastal cities in the United States Gulf of Mexico under the combined effects of extreme cyclone winds and storm surge. The dependence structure between the two storm parameters was modeled by the extreme value Archimedean copula. Moftakhari et al. (2017) assessed the increase in flooding probability caused by sea level rise in a warming climate. The proposed bivariate copula model provided an effective approach for computing the combined effects of fluvial flooding and sea level rise.
Copula models are also increasingly applied to investigate the dependence between wave height and water levels. As stated by Gouldby et al. (2014), extreme sea condition parameters (e.g., significant wave height and sea level) are essential parameters for coastal structural design and flood risk analysis. In their study, a multivariate extreme value method was applied to estimate the joint probability distribution of sea condition variables, e.g., significant wave height, sea level, and mean wave period. Another study conducted by Wahl et al. (2016) evaluated the flooding and erosion risk in the northern Gulf of Mexico based on a large number of observations of wave and water level from 1980 to 2013. Dependency analysis between six hydrodynamic parameters affecting the total water level was performed based on the goodness-of-fit test of the data. The Student's t-copula was suggested to model the dependence structure between variables. Additionally, a copula-based approach was applied to evaluate the probability of flooding at a coastal site under storm events (Masina et al., 2015). In their study, the positive correlation of significant wave height and peak water level was modeled by a copula function, and the tail behavior of storm variables was quantified in the copula modeling using the tail dependence coefficients.
In this context, dependence (or correlation) refers to the statistical association between random variables (Joe, 2014). The tail dependence implies the correlation between variables at the tail of the distribution. For instance, the lower tail dependence indicates correlation in the lower-left quadrant and the upper tail dependence is associated with the upper-right quadrant (Nelsen, 2006; Joe, 2014). Such tail phenomena are commonly observed in data associated with extreme events (Salvadori et al., 2007), particularly among storm (Wahl et al., 2015) and marine variables (Zhang et al., 2018). Different copula functions are capable of representing different degrees of tail dependence. Therefore, the copula approach can be an efficient tool to model the correlation of hazard parameters, thus aiding the vulnerability assessment and hazard risk management. To the best of the authors' knowledge, copula models have not been incorporated in hurricane hazard analysis to identify the effect of correlated storm parameters on infrastructure vulnerability.
This paper aims to propose a copula-based probabilistic framework for coastal infrastructure to assess vulnerability subjected to hurricanes. The copula function is applied to model the dependence between storm parameters when modeling the probabilistic demand of highway bridges. An illustrative example is provided to calculate the probability with respect to deck unseating failure of a typical simply supported highway bridge. A three-dimensional computational fluid dynamics (CFD) model of the bridge is established to compute the surge and wave loads acting on the bridge deck. The vulnerability of the investigated bridge is assessed considering various uncertainties springing from parameters associated with demand and capacity. Dependence between peak water level and maximum wave height is modeled by the fitted Clayton copula based on the data record extracted from Wahl et al. (2016). The peak water level refers to the fluctuation peaks of sea level, consisting of the impact of storm surge and tide in this context. Different copula models, including Gaussian and a special case of the Extreme Value copula, are used to identify the impact of tail dependence behavior in storm parameters on structural vulnerability. The dependence between peak water level and maximum wave height is considered only for hurricane events. Due to the flexibility of the copula approach, the proposed framework is not limited to illustrate the interrelationship of hurricane parameters, which can be implemented to dependence analyses under various hazards. Consequently, a copula-based framework for vulnerability analysis is developed to aid risk assessment and management of civil infrastructure by considering dependent hazard parameters.
Copula-Based Dependence Model
A copula couples the marginal distributions to the multivariate distribution function, in which the marginal distribution for each variable is uniform over the unit interval (Nelsen, 2006). Let a series of random variables X1, X2, …, Xd have marginal distribution functions Fi(xi), i = 1, …, d. The joint distribution function of these random variables is defined as J. According to Sklar's theorem (Sklar, 1959), there exists a copula C: [0, 1]d → [0, 1] such that
If the marginals Fi(xi) are all continuous, the d-dimensional copula C is unique
The probabilistic density function of copula C can be denoted as c(u)
Accordingly, the joint density fX(x1, x2, …, xd) of random variables can be expressed as
As shown in Equation (4), the copula function establishes the dependency structure separately from the marginals. In other words, the dependence between random variables is governed by a copula regardless of the selection of univariate distributions. Compared to directly dealing with the complex joint probability J, the theorem of copula offers significant flexibility during applications (Jane et al., 2018; Zhang et al., 2018).
In this study, the bivariate relationships are considered. The three most commonly used copula families are introduced: elliptical copulas, Archimedean copulas, and Extreme Value copulas. The elliptical family is based on elliptical distribution functions and consists of the Gaussian copula and Student's t-copula. The Gaussian copula is the most popular one in practice. It is given by
in which Φ(.) is the cumulative distribution function (CDF) of a multivariate normal distribution; ζ is the correlation matrix; and Φ−1(.) is the inverse CDF of the standard normal distribution. The Gaussian copula does not have tail dependence, i.e., lower and upper tail dependence are zero.
The Student's t-copula is a generalization of the Gaussian copula. Compared with the Gaussian copula having one dependence parameter, the Student's t-copula is associated with two parameters, resulting in more probability density at the tails. The function of the Student's t-copula can be written as
where tv(.) is the CDF of a multivariate standardized student's t distribution; v is the parameter indicating degree of freedom; ζ is the correlation matrix; and tv−1(.) is the inverse of the CDF of the standard student's t variable. The Student's t-copula has identical lower and upper tail dependence, which can be computed as
Instead of relying on probabilistic distribution functions, the Archimedean copulas are constructed incorporating monotonic characteristics. Commonly used Archimedean copulas include Clayton, Gumbel, and Frank copulas, in which the Gumbel copula is also an Extreme Value copula (Genest and Rivest, 1989). The three copulas have only one dependence parameter and exhibit different tail dependence conditions. For instance, the Clayton copula has lower tail dependence but has no upper tail dependence. In contrast, the Gumbel copula interprets upper tail dependence with no lower tail dependence. The Frank copula has no tail dependence. Table 1 gives the copula functions and tail dependence characteristics of the Clayton, Gumbel, and Frank copulas using the dependence parameter θ.
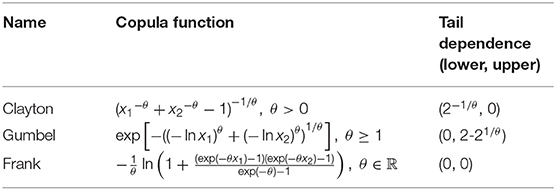
Table 1. Examples of Archimedean copulas and their tail dependence characteristics.
In addition to elliptical and Archimedean copulas, the Extreme Value family plays an important role in dependence analysis. As the Extreme Value copulas arise naturally from the extreme value theory, they are able to model the tail dependence associated with extreme events (Gudendorf and Segers, 2010). The Extreme Value copulas are generated from the Extreme Value theory to describe the limit characteristics of values associated with extreme events, such as natural hazards (Joe, 1997; Gudendorf and Segers, 2010). The Hüsler-Reiss copula, as a special case of Extreme Value copulas, is introduced herein. It is given by (Hüsler and Reiss, 1989)
in which the dependence parameter θ is larger than or equal to zero; ; and . For the Extreme Value copulas, the parametric submodel can be determined by using the Pickands dependence function (Gudendorf and Segers, 2010). For instance, the Pickands dependence function of Hüsler-Reiss copula can be written as
By using Equation (9), the upper tail dependence λu associated with the Hüsler-Reiss copula can be computed as shown in Equation (10).
The lower tail dependence of Extreme Value copulas is zero, except for the case with perfect dependence A(1/2) = 1/2. In other words, lower tails of Extreme Value copulas are asymptotically independent.
Copula models can be applied to describe various dependence relationships. Statistical inference of the dependence structure relies on the measure of association. Previously, the degree of dependence among variables is widely assessed by Pearson's correlation coefficient due to its simplicity and convenience. Pearson's coefficient measures the linear correlation between variables (Joe, 2014). Due to its limited application range, other measures such as Kendall's tau and Spearman's rho are developed to evaluate the association. In this paper, Kendall's tau is employed. This correlation coefficient computes the variation between probabilities of discordance and concordance (Joe, 2014). For two independently and identically distributed random vectors (X1, Y1) and (X2, Y2) with the identical joint probability distribution, Kendall's τ is given by
Let C(u, v) refers to the copula function of X and Y, Kendall's tau can be written as
For the random vector (X, Y) with a sample size of n, Kendall's tau can be presented as
where Nc and Nd are the number of concordant pairs and the number of discordant pairs, respectively.
Vulnerability Analysis Under Hurricanes
The vulnerability analysis evaluates the performance and the probability of failure of civil infrastructure subjected to hazards. The hurricane-induced wave and surge forces may lead to deck unseating damage of coastal simply supported bridges. The vulnerability assessment considering probabilistic modeling of demand and capacity incorporating dependent storm parameters is presented in this section.
Evaluating the failure probability under hurricanes is conditioned on the intensity measure. Due to the complex interaction between storm parameters, it is inappropriate to concentrate on a single wave or surge parameter to quantify the demand or failure probability. Thus, there should be at least two intensity measure parameters employed to maintain the efficiency and accuracy of the probabilistic vulnerability analysis. There are several parameters associated with the hurricane hazard, such as wave height, wave period, and relative surge elevation. Ataei and Padgett (2013) selected the maximum wave height and relative surge height as the intensity measures to conduct fragility analysis for coastal highway bridges, as these two parameters are essential inputs for the equations of wave and surge loads [American Association of State Highway Transportation Officials (AASHTO), 2008].
Herein, owing to the dependency analysis in Wahl et al. (2016) and Masina et al. (2015) and the inputs for the proposed probabilistic demand model, the dependence between the peak water level and maximum wave height is considered. Such dependence is considered only for hurricane events. These two parameters are utilized to compute the probabilistic demand. The peak water level refers to the relative elevation of storm surge and tide, above mean sea level. The mean value of storm surge can be computed from the maximum wind speed. For instance, Liang and Julius (2017) proposed a linear relationship between the storm surge and maximum wind speed, based on 58 wind-surge events that occurred near Chesapeake Bay, Virginia, from 1995 to 2015. The surge height is assumed to be uniformly distributed ranging from 80 to 120% of the mean (Saeidpour et al., 2019). The initial water depth is assumed to be deterministic. The average tide level is set as zero. The probabilistic distribution of annual tidal is determined by using the density histogram of the hydrodynamic model presented in McInnes et al. (2013). Subsequently, the marginal distribution of the peak water level can be fitted based on the surge and tide. Wahl et al. (2016) indicated that the water level can be fitted by the generalized extreme value (GEV) distribution using historical observations. The PDF of the GEV distributed peak water level W is
where ξ is the shape parameter; ε is the location parameter; and σ is the scale parameter. It should be noted that the wind speed informs the parameters of the surge distribution, thus the wind speed also affects the marginal parameters of the GEV distributed peak water level. When different return period scenarios of hurricanes are considered, the marginal parameters of the peak water level should be assessed by using the hurricane-induced wind speed for each return period. The maximum wave height H can be computed by a classical Rayleigh model (Longuet-Higgins, 1980)
where fH(h) is the PDF of the maximum wave height and Hs is the significant wave height, defined as the mean height of the highest third of waves.
Given the marginal density functions associated with storm parameters, the CDFs of both the peak water level W and maximum wave height H can be determined, and they are denoted as FW(w) and FH(h), respectively. Subsequently, the copula function of the random vector (W, H) is given by
As the relevant parameters (e.g., water level) are sensitive to regional/local factors, e.g., bathymetry and the shape of the coast, different copulas could be selected for different investigated regions. When there are data available, the copula model can be determined by using goodness-of-fit tests (Jane et al., 2018; Zhang et al., 2018). The process of finding the optimal copula model typically requires two stages. The first stage is to determine appropriate distributions for the univariate variables. Candidate distributions can be chosen from empirical models for the investigated storm variable (Trepanier et al., 2017). Graphical approaches such as the L-moments method (Hosking and Wallis, 1997) can be applied. L-moments refer to linear combinations of order statistics (similar to the statistical moments), which can be used to describe information about the shape, location, and dispersion of a probability distribution (Hosking and Wallis, 1997). By plotting the L-moment ratio diagram, the candidate distribution that has the closest L-skewness and L-kurtosis values to data should be adopted for the following copula analysis (Um et al., 2017). Subsequently, the probability plot correlation coefficient (PPCC) test (Vogel and Kroll, 1989; Heo et al., 2008) can be used to perform the goodness-of-fit test for the univariate distribution. The second stage is to find the optimal copula model. Candidate copulas can be selected from different copula families, as introduced in the previous section. Dependence parameters with respect to each copula function can be determined by the maximum likelihood method. For instance, by incorporating the corrected Akaike and/or Bayesian information criterion (Burnham and Anderson, 2004), the candidate copula with the smallest information criterion is recommended (Masina et al., 2015). For validation, the goodness-of-fit assessment for this stage can be checked by using the approach delivered by Genest et al. (2006), by checking the Cramér-von Mises statistics Sn. A smaller value of Sn indicates a better copula model among the candidates. The bootstrap method presented by Genest et al. (2009) can be applied to compute the p-value associated with the statistics Sn, and a larger p-value implies a better fit.
For the vulnerability assessment, the probability of failure of the bridge under the unseating failure mode can be determined by assessing the structural capacity and demand incorporating uncertainties. The failure probability of the bridge Pf is the likelihood that the demand D exceeds structural capacity C (Li and Ellingwood, 2006; Li et al., 2020)
The demand, i.e., the maximum vertical wave loads acting upon the deck, can be assessed by the CFD modeling. Two-dimensional CFD models are commonly adopted in fragility analysis (Li et al., 2020; Zhu and Dong, 2020). Although the two-dimensional numerical model reduces the computation cost, the analysis of the fluid-structure interaction is limited to the longitudinal axis, thus providing less accurate results. The simulation results attained by the two-dimensional model can be relatively different from the analytical outcomes (Jin and Meng, 2011). Xu et al. (2016) indicated that the wave-bridge interaction based on the two-dimensional model may not completely capture the wave components. Moreover, inappropriate simplification by the two-dimensional model may result in errors in the wave results (Bozorgnia and Lee, 2012). Therefore, a three-dimensional CFD model is established in this paper to study the fluid-structure interaction and evaluate the external wave loads on the bridge model. The correlated maximum wave height and peak water level are inputs for the CFD modeling. The wave loads acting upon the bridge deck can be assessed accordingly. The detailed CFD model is described in the illustrative example.
The capacity of the bridge under hurricane-induced wave force refers to the vertical resistance, consisting of the self-weight of the bridge deck and connection strength between deck and substructure (Ataei and Padgett, 2013; Mondoro et al., 2017). The weight of superstructure Ws can be computed as
in which db and W0 are the thickness and width of the deck, respectively; Ag is the cross-sectional area of girders; ng is the number of girders; γ is the unit weight of the material; and l is the length of span. For simply supported bridges, the vertical connectivity provided by the anchor bolts can be estimated by the concrete breakout strength. The total breakout strength Fc can be computed as the product of the total number of bolts and the connection strength of a single bolt, as shown in Equation (19) [American Concrete Institute (ACI), 2005]
in which ncb is the number of bolts; AN is the projected area of the failure for the anchor; AN0 is the projected area of the failure surface of a single anchor remote from edges; Nb is the basic concrete breakout strength of a single anchor; and ψ2 and ψ3 are modification factors.
The above functions illustrate the computation process of deterministic demand and capacity. Subsequently, the vulnerability of the bridge can be assessed by the probabilistic demand and capacity considering various uncertainties in hazard and structural parameters based on Monte Carlo simulation (Tu et al., 2017). Uncertainties in the probabilistic demand modeling focus on the hazard parameters, i.e., wave height and peak water level. Uncertainties associated with the structural capacity mainly result from construction materials, construction error, and workmanship error, etc. The densities of concrete and steel are assumed to be normally distributed [Joint Committee on Structural Safety (JCSS), 2001]. The expected density of reinforced concrete is 2,400 kg/m3, with a coefficient of variation of 0.04. The mean density for steel is 7,850 kg/m3 and the coefficient of variation is 0.01. The deck thickness follows a uniform distribution with the mean ranging from 95 to 105% considering construction and workmanship errors. Additionally, a model error is used to account for the uncertainty in concrete strength, with a mean of one and the coefficient of variation of 0.23 (Eligehausen et al., 2006).
Illustrative Example
The proposed copula-based vulnerability assessment framework is applied to compute the vulnerability of a highway bridge under hurricanes. The investigated bridge is an I-10 bridge over Escambia Bay, Florida, and it was severely damaged by Hurricane Ivan in 2004 (Douglass et al., 2004). The bridge is simply supported and susceptible to deck unseating during hurricanes. The study area graphic and tracks of historical tropical cyclones (the track of Hurricane Ivan is highlighted) are shown in Figure 1. A three-dimensional CFD model of the bridge is established to assess the probabilistic wave-induced load. Four scenarios of hurricane hazard are considered, with return periods of 50 years, 75 years, 100 years, and 500 years, respectively. The vulnerability of a bridge subjected to these hurricane scenarios is assessed. Dependent storm parameters are modeled using copula functions. The Clayton, Gaussian, and Hüsler-Reiss copulas are employed to explore the effect of different copula families and tail dependence characteristics on the structural vulnerability.
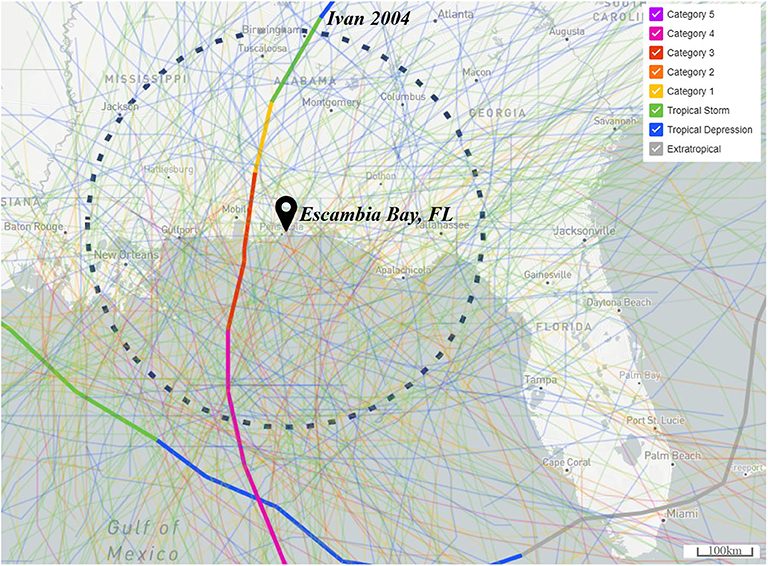
Figure 1. The study area of the bridge in Escambia Bay, Florida, and tracks of historical tropical cyclones, including Hurricane Ivan (adapted from NOAA 2020).
The bridge has a span of 15.85 m and a width of 9.14 m. Dimensions of the bridge superstructure are illustrated in Figure 2A. The distance from the initial water level to the bottom of girder is assumed to be 6.3 m. A three-dimensional numerical model of the bridge superstructure is established by using the CFD software ANSYS Fluent (V.17.2). The I-shaped girders are modeled with rectangular sections to reduce the computational expense. The CFD model of the bridge is shown in Figure 2B, and the diagram of computation domain of the CFD model is demonstrated in Figure 2C. The plane CD is the water level, which indicates the interface between air and water. Planes AE and BF refer to the velocity inlet and pressure outlet, respectively. The top plane AB is set as the constant atmospheric pressure, and the bottom EF is defined as the no-slip stationary wall condition. The total force component is computed as the sum of the dot product of the pressure and viscous forces on each face with the specified force vector (ANSYS, 2009). Based on the CFD modeling, the wave-air-structure interaction can be evaluated. The three-dimensional model shows insights about the interactive effects. For instance, the wave-air-deck interaction with a relative clearance (Zc) at 1.5 m and a maximum wave height (H) of 3 m is shown in Figure 3. The wave-air-deck interaction effects are shown on the left column [i.e., Figures 3A,C,E], and the associated wave profiles are shown on the right column [i.e., Figures 3B,D,F]. The solitary wave starts from the origin and flows along the x-axis. The water volume fraction is represented by different colors according to the volume of fluid method. For instance, the water volume fraction of the water phase is one, while the value of the air phase is zero. In Figure 3, three chronological stages of the wave acting upon the deck are presented. Initially, there is a constant water level. When there is a wave generated, the water surface starts to rise. Subsequently, the wave arrives, and overtopping occurs, thus resulting in loading acting on the bridge deck.
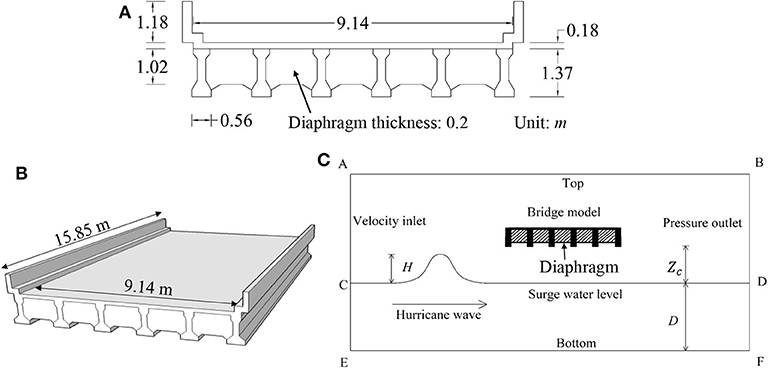
Figure 2. (A) Geometry of the bridge deck; (B) The three-dimensional model of the bridge deck; and (C) Diagram of the computational domain of the CFD modeling.
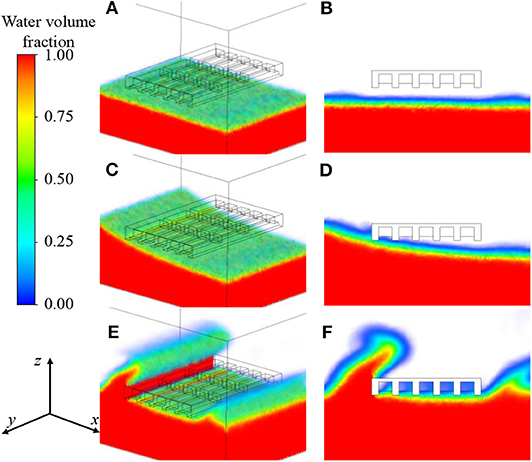
Figure 3. An illustrative diagram of the wave-air-structure interaction effects in the three-dimensional CFD model. (A,C,E) Show the wave-air-deck interaction at three different chronological stages when the wave acts upon the deck; (B,D,F) indicate the associated wave profiles, respectively.
Given the return period, the relevant hurricane-induced wind speed can be computed using the model developed by Vickery et al. (2000). Li and Ellingwood (2006) and Mondoro et al. (2017) indicated that the Weibull distribution can be adopted to describe the wind speed V. For instance, the log transform of the CDF of the Weibull distributed wind speed FV(v) can be written as
in which μv and αv are scale and shape parameters. The CDF of wind speed FV(v) can be expressed by the return period T (Vickery et al., 2000)
Accordingly, scale and shape parameters for Equation (20) can be determined from the design wind speed maps (i.e., maps of hurricane-induced wind speeds) associated with different storm return levels (Vickery et al., 2000).
Subsequently, the wind speed of the four investigated hurricane scenarios with return periods of 50, 75, 100, and 500 years can be computed as 47 m/s, 57 m/s, 63 m/s, and 72 m/s, respectively. Other models of the estimated return levels can also be applied, e.g., Malmstadt et al. (2010). Herein, the analytical approach developed by Vickery et al. (2000) is adopted. Based on the Saffir–Simpson Hurricane wind scale (Schott et al., 2019), the hurricane scenario with a 50-year return period can be considered as a non-major hurricane, while the other three scenarios can be classified as major hurricanes. The wind speed informs the mean value of storm surge following the model of Liang and Julius (2017) as introduced in the previous section. Probabilistic surge and tide are computed based on the aforementioned empirical models. Subsequently, the marginal distribution of the peak water level is fitted to a GEV distribution. Herein, the estimation of tide and surge is based on empirical models, and the interaction between them is not considered. Tide and surge are independently modeled using their univariate probabilistic distribution. Based on Wahl et al. (2016), there can be some dependence between these two parameters, which could affect the peak water level. Further studies are needed to assess the interaction and pairing of tides and surges. The significant wave height Hs can be assessed from the wind speed based on the Shore Protection Manual [Coastal Engineering Research Center (CERC), 1984]
in which UA = 0.71V1.23 is the adjusted wind velocity based on the wind velocity V; and F is the fetch length and assumed to be 1,000 m. The maximum wave height H is taken as 1.8 times of the significant wave height Hs (e.g., H = 1.8 Hs) [American Association of State Highway Transportation Officials (AASHTO), 2008]. Consequently, different parameters of the marginal distributions associated with the peak water level and maximum wave height are related to the wind speeds at different return periods. Based on these marginal parameters, the two storm parameters (i.e., W and H) can be simulated from the copula function and transformed back to the original scale.
The copula function associated with the maximum wave height and peak water level can be determined using goodness-of-fit tests based on observed data. Wahl et al. (2016) assessed the flooding and erosion risk in the northern Gulf of Mexico by modeling six hydrodynamic variables (i.e., astronomical tide, storm surge, significant wave height, peak wave period, wave direction, and sea-storm event duration) affecting the total water level. In their study, 67 groups of annual average significant wave height and the averaged peak water level for sea-storm events were extracted from observation records at a tide gauge on Dauphin Island from 1980 to 2013. According to Wahl et al. (2016), sea-storm events are identified when the hourly total water level exceeding a critical threshold, i.e., 1.2 m above the North American Vertical Datum of 1988. Additionally, average significant wave heights associated with the events are selected when the heights exceed 1.6 m and 1.4 m for winter and summer, respectively. The detailed processing procedure of the data can be found in Wahl et al. (2016).
Based on their 67 groups of observed data, we assessed the copula function of the correlated maximum wave height and peak water level using goodness-of-fit tests. Herein, the impact of seasonal cycles on the dependence structure between variables is neglected, but it can be considered in future studies. For the marginal distribution, it is identified that there are many distribution options to fit the marginal distribution, due to the limited data record. In this study, marginal distributions of the significant wave height and peak water level are fitted using the Rayleigh and GEV distributions, respectively. For dependence modeling, Kendall's tau correlation coefficient is 0.41. Different copula candidates are employed for the goodness-of-fit tests, including Gaussian, Student's t, Clayton, Gumbel, Frank, and Hüsler-Reiss copulas. Subsequently, based on the Akaike information criterion (AIC), the Clayton copula is adopted among the copula candidates, with the smallest Sn (= 0.0191) and largest p-value (= 0.6176). In comparison, the elliptical and Extreme Value families show deficient performance in fitting the dataset. For instance, the Sn and p-value for the Gaussian copula are 0.0350 and 0.0490, respectively, while values for the Hüsler-Reiss copula are 0.0652 and 0.0098, respectively. Figure 4 shows the scatter plot of observed and simulated values at the site in the Gulf of Mexico, in which there are 500 samples simulated from the Clayton copula.
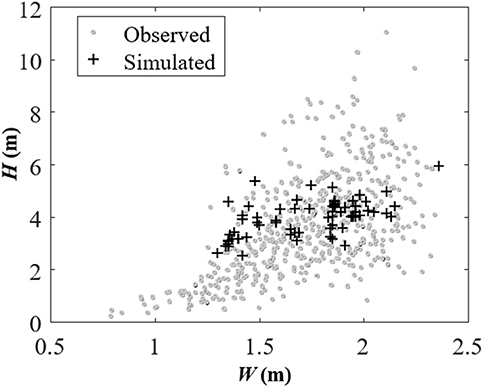
Figure 4. Scatter plot of observed and simulated maximum wave height and peak water level based on the selected Clayton copula.
In this illustrative example, as the data record extracted from Wahl et al. (2016) are close to the investigated region, the fitted Clayton copula can be an appropriate option to model the positive correlation between the maximum wave height and peak water level. In the field of risk assessment, when there is a lack of data, dependence models may be constructed based on the correlation coefficient (Hong et al., 2014; Wang et al., 2020). In order to investigate the effect of copula family and tail dependence behavior between hazard parameters on the structural vulnerability, the Gaussian and Hüsler-Reiss copulas are also employed in this study. The Clayton copula allows for lower tail dependence, while the Hüsler-Reiss interprets upper tail dependence. The Gaussian copula indicates no tail dependence. Different values of Kendall's tau (equal to 0.1, 0.5, and 0.9) are considered to identify the impact of the degree of dependence between storm parameters on the bridge vulnerability. An illustrated diagram of correlated maximum wave height H and peak water level W in the copula domain with 1,000 samples is shown in Figure 5. It can be identified that the correlation between variables increases with Kendall's tau. The tail dependence behavior can also be observed. For instance, the correlation resulting from the Hüsler-Reiss copula is more pronounced in the upper tail area, while the correlation caused by Clayton copula is more prominent in the lower tail region.
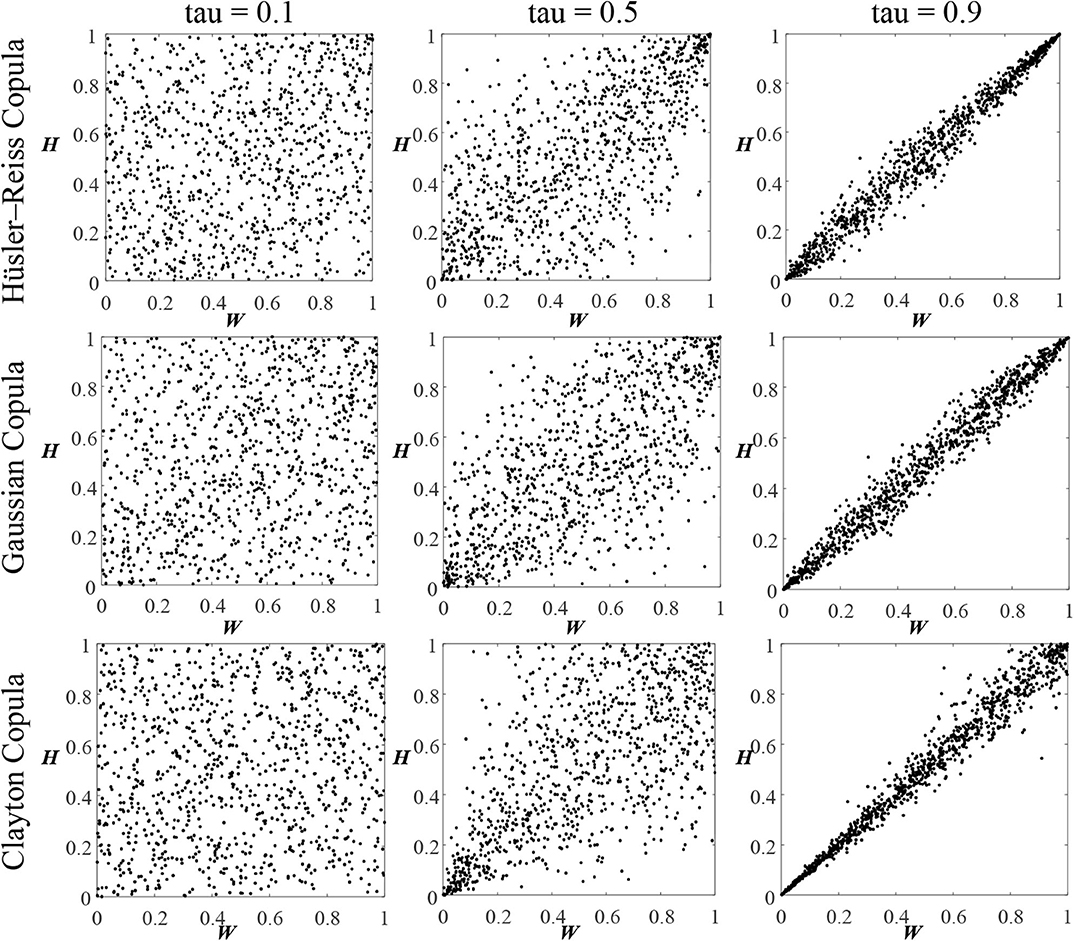
Figure 5. Samples of correlated H and W in the copula domain using Hüsler-Reiss, Gaussian, and Clayton copula functions considering Kendall's tau equal to 0.1, 0.5, and 0.9.
The vulnerability of a bridge associated with the four hazard scenarios (50-, 75-, 100-, and 500-year return periods) is calculated by performing Monte Carlo simulations, as shown in Table 2. For a given return period and Kendall's tau value, a range of storm and structural parameters are generated with a sample size of 500,000. When the maximum wave height and peak water level are independent, the structural vulnerability can be computed by setting Kendall's tau as zero. At the 50-year return period, the probability of the bridge failing under the case with dependent storm parameters increases significantly compared with the independent case. For example, the failure probability associated with the Clayton copula model is nearly tripled compared to the independent result. For the scenario with a 75-year return period, copulas have a moderate impact on the probability of failure (i.e., a modest increase in the failure probability), compared with the 50-year return period scenario. Under the same degree of correlation (e.g., with the same Kendall's tau), the vulnerability of the bridge differs with respect to each copula model, due to different tail dependence characteristics in copula models. For instance, for the 50-year scenario, when there is medium correlation (Kendall's tau equal to 0.5), the probability of failure is 0.0445 with the Clayton copula and is 0.0605 with the Hüsler-Reiss copula.
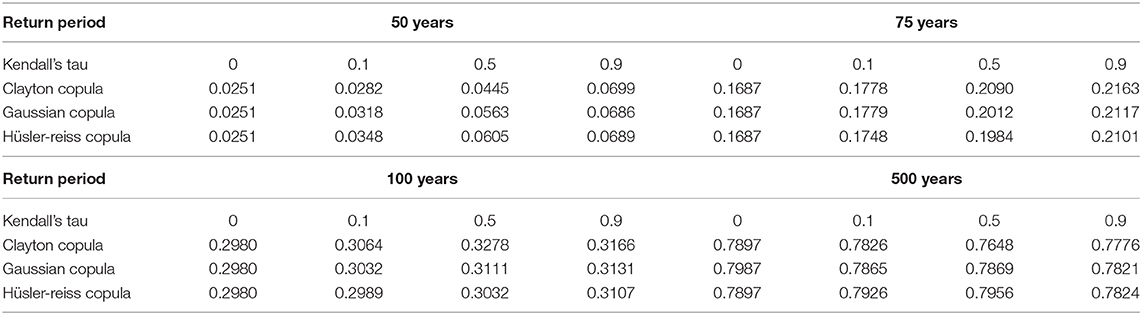
Table 2. Probability of failure of the bridge associated with different copula models under 50-, 75-, 100-, and 500-year hurricane scenarios.
For hurricane scenarios with return periods of 100 and 500 years, the vulnerability of a bridge is not significantly affected by the dependent hazard parameters. The failure probability computed using different copula functions may experience a slight increase (e.g., at the 100-year return period) or fluctuate around the result of independent case (e.g., at the 500-year return period). Probably, under such intense hurricanes, uncertainties caused by probabilistic modeling of demand and capacity have a greater influence on the vulnerability of the bridge, compared to uncertainties resulting from the copula modeling. For instance, there may exist a larger dispersion (i.e., standard deviation) in terms of the storm surge for the 500-year return period scenario than the 50-year return period scenario. In this example, the storm surge is uniformly distributed ranging from 80 to 120% of the mean. When there are strong hurricanes, both the mean and standard deviation of surge are escalated with the hurricane intensity. Subsequently, uncertainties associated with probabilistic demand may be amplified. Additionally, under the investigated scenarios, for a given Kendall's tau, the Hüsler-Reiss copula gives consistently greater failure probability estimates than the other copulas at the 500-year return period. Further studies should be conducted to investigate the effect of the upper tail dependence on the extremes of storm variables by considering different Extreme Value copulas and different intensity measures.
There are several limitations of the proposed approach. Due to the limited data record, the Clayton copula is fitted based on the annual average significant wave height and water level. Under the circumstance, the goodness-of-fit result associated with the Clayton copula may not be optimal for the investigated area. The fitting of marginal distribution functions can also be enhanced given more data. As sea condition parameters can be influenced by seasonal cycles, further studies may investigate the impact of seasonal change on the dependence structure between storm parameters. The interaction between tide and surge needs to be considered in future studies, as their pairing may have an impact on the peak water levels.
Conclusions
This paper develops a copula-based vulnerability assessment framework for civil infrastructure subjected to hurricane hazards. A mathematical tool using copula function is introduced to model dependent hazard parameters for the vulnerability assessment. The proposed framework is applied to a typical simply supported bridge. The Clayton, Gaussian, and Hüsler-Reiss copulas are used to model the dependence structure between the maximum wave height and peak water level. These copula models are employed to identify the impact of different tail dependence characteristics on the vulnerability of a bridge. Given the deck unseating failure, probabilistic modeling of demand, referring to hurricane-induced surge and wave loading acting on the bridge deck, is calculated by establishing a three-dimensional CFD model. The mathematical copula tool delivers desired performance in modeling of dependent hazard parameters, as the marginal distribution and the correlated effects are considered separately.
The probability of failure with respect to the investigated bridge can be affected by incorporating dependent storm parameters. In the illustrative example, such effects may be more pronounced for non-major hurricanes, compared with the results for major hurricanes. Different degrees of correlation between the maximum wave height and peak water level are considered. For the investigated scenarios with return periods of 50 and 75 years, the probability of the bridge failing increases with the correlation coefficient. For scenarios with return periods of 100 and 500 years, the vulnerability incorporating the fitted Clayton copula is close to the result of the independent case, which is insensitive to the change in correlation coefficient. Three copula models, including Clayton, Gaussian, and Hüsler-Reiss copulas, are employed to identify the impact of tail dependence between storm parameters on the structural vulnerability. Under the identical degree of correlation, the vulnerability of the bridge differs with the tail dependence behavior. Therefore, the tail dependence between hazard parameters should be carefully considered and evaluated during the assessment.
The proposed framework can be implied to the risk management of civil infrastructure. Further studies may also investigate the correlation between parameters in terms of the probabilistic modeling of structural capacity. More efforts should be performed to consider the upper tail dependence coefficient in the process of copula selection, as the coefficient can be an important indicator in the extreme value analysis (Masina et al., 2015).
Data Availability Statement
The original contributions presented in the study are included in the article/supplementary material, further inquiries can be directed to the corresponding author/s.
Author Contributions
YL and YD conceived the conceptual idea. YL developed the theoretical framework, numerical computations, and wrote the original draft. YD supervised the project and commented on the manuscript. DZ made bibliographic research and constructed the computational fluid dynamics model. All authors contributed to the article and approved the submitted version.
Funding
The study has been supported by National Key R&D Program of China (No. 2019YFB1600702) and Research Grant Council of Hong Kong (No. T22-502/18-R and ECS project No. PolyU 252161/18E). The opinions and conclusions presented in this paper are those of the authors and do not necessarily reflect the views of the sponsoring organizations.
Conflict of Interest
The authors declare that the research was conducted in the absence of any commercial or financial relationships that could be construed as a potential conflict of interest.
References
Akiyama, M., Frangopol, D. M., and Ishibashi, H. (2020). Toward life-cycle reliability-, risk-and resilience-based design and assessment of bridges and bridge networks under independent and interacting hazards: emphasis on earthquake, tsunami and corrosion. Struct. Infrastruct. Eng. 16, 26–50. doi: 10.1080/15732479.2019.1604770
American Association of State and Highway Transportation Officials (AASHTO) (2008). AASHTO Guide Specifications for Bridges Vulnerable to Coastal Storms. Washington, DC.
American Concrete Institute (ACI) (2005). Building Code Requirements for Structural Concrete and Commentary (ACI 318R-05). Detroit, MI: American Concrete Institute.
Ataei, N., and Padgett, J. E. (2013). Probabilistic modeling of bridge deck unseating during hurricane events. J. Bridge Eng. 18, 275–286. doi: 10.1061/(ASCE)BE.1943-5592.0000371
Bjarnadottir, S., Li, Y., and Stewart, M. G. (2014). Regional loss estimation due to hurricane wind and hurricane-induced surge considering climate variability. Struct. Infrastruct. Eng. 10, 1369–1384. doi: 10.1080/15732479.2013.816973
Bozorgnia, M., and Lee, J.-J. (2012). “Computational fuid dynamic analysis of highway bridges exposed to hurricane waves,” Paper presented at the Proceedings of 33rd Conference on Coastal Engineering, (Santander: Spain). doi: 10.9753/icce.v33.waves.70
Burnham, K. P., and Anderson, D. R. (2004). Multimodel inference: understanding AIC and BIC in model selection. Sociol. Methods Res. 33, 261–304. doi: 10.1177/0049124104268644
Bushra, N., Trepanier, J. C., and Rohli, R. V. (2019). Joint probability risk modelling of storm surge and cyclone wind along the coast of bay of bengal using a statistical copula. Int. J. Climatol. 39, 4206–4217. doi: 10.1002/joc.6068
Charvet, I., Suppasri, A., Kimura, H., Sugawara, D., and Imamura, F. (2015). A multivariate generalized linear tsunami fragility model for kesennuma city based on maximum flow depths, velocities and debris impact, with evaluation of predictive accuracy. Nat. Hazards 79, 2073–2099. doi: 10.1007/s11069-015-1947-8
Chebana, F., and Ouarda, T. B. M. J. (2011). Multivariate extreme value identification using depth functions. Environmetrics 22, 441–455. doi: 10.1002/env.1089
Coastal Engineering Research Center (CERC) (1984). Shore Protection Manual in Department of the Army, Waterways Experiment Station, Corps of Engineers. Vicksburg, MS: The U.S. Army Engineer Waterways Experiment Station Coastal Engineering Research Center.
Corbella, S., and Stretch, D. D. (2012). Multivariate return periods of sea storms for coastal erosion risk assessment. Nat. Hazards Earth Syst. Sci. 12, 2699–2708. doi: 10.5194/nhess-12-2699-2012
De Michele, C., and Salvadori, G. (2003). A generalized pareto intensity-duration model of storm rainfall exploiting 2-copulas. J. Geophys. Res. 108:4067. doi: 10.1029/2002JD002534
DET NORSKE VERITAS (DNV) (2014). DNV-RP-C205: Environmental Conditions and Environmental Loads. Høvik, Norway: DET NORSKE VERITAS
Douglass, S. L., Hughes, S., Rogers, S., and Chen, Q. (2004). “The impact of Hurricane Ivan on the coastal roads of Florida and Alabama: a preliminary report,” in Rep. to Coastal Transportation Engineering Research Education Center, Univ. of South Alabama, Ala.
Eligehausen, R., Mallée, R., and Silva, J. F. (2006). Anchorage in Concrete Construction. Berlin: Ernst & Sohn.
Frangopol, D. M., Dong, Y., and Sabatino, S. (2017). Bridge life-cycle performance and cost: analysis, prediction, optimisation and decision-making. Struct. Infrastruct. Eng. 13, 1239–1257. doi: 10.1080/15732479.2016.1267772
Genest, C., Quessy, J. F., and Rémillard, B. (2006). Goodness of fit procedures for copula models based on the probability integral transformation. Scand. J. Statist. 33, 337–366. doi: 10.1111/j.1467-9469.2006.00470.x
Genest, C., Rémillard, B., and Beaudoin, D. (2009). Goodness-of-fit tests for copulas: a review and a power study. Insur. Math. Econ. 44, 199–213. doi: 10.1016/j.insmatheco.2007.10.005
Genest, C., and Rivest, L.-P. (1989). A characterization of gumbel's family of extreme value distributions. Stat. Probab. Lett, 8, 207–211. doi: 10.1016/0167-7152(89)90123-5
Ghosh, J., Padgett, J. E., and Dueñas-Osorio, L. (2013). Surrogate modeling and failure surface visualization for efficient seismic vulnerability assessment of highway bridges. Probabil. Eng. Mech. 34, 189–199. doi: 10.1016/j.probengmech.2013.09.003
Gidaris, I., Padgett, J. E., Barbosa, A. R., Chen, S., Cox, D., Webb, B., et al. (2017). Multiple-hazard fragility and restoration models of highway bridges for regional risk and resilience assessment in the United States: state-of-the-art review. J. Struct. Eng. 143:04016188. doi: 10.1061/(ASCE)ST.1943-541X.0001672
Gouldby, B., Méndez, F., Guanche, Y., Rueda, A., and Mínguez, R. (2014). A methodology for deriving extreme nearshore sea conditions for structural design and flood risk analysis. Coast. Eng. 88, 15–26. doi: 10.1016/j.coastaleng.2014.01.012
Gudendorf, G., and Segers, J. (2010). Extreme-Value Copulas. In Copula Theory and its Applications. New York, NY: Springer. doi: 10.1007/978-3-642-12465-5_6
Heo, J.-H., Kho, Y. W., Shin, H., Kim, S., and Kim, T. (2008). Regression equations of probability plot correlation coefficient test statistics from several probability distributions. J. Hydrol. 355, 1–15. doi: 10.1016/j.jhydrol.2008.01.027
Hong, H.-P., Zhou, W., Zhang, S., and Ye, W. (2014). Optimal condition-based maintenance decisions for systems with dependent stochastic degradation of components. Reliabil. Eng. Syst. Saf. 121, 276–288. doi: 10.1016/j.ress.2013.09.004
Hosking, J. R. M., and Wallis, J. R. (1997). Regional Frequency Analysis: an Approach Based on L-moments. New York, NY: Cambridge university press. doi: 10.1017/CBO9780511529443
Hüsler, J., and Reiss, R.-D. (1989). Maxima of normal random vectors: between independence and complete dependence. Statist. Probabil. Lett. 7, 283–286. doi: 10.1016/0167-7152(89)90106-5
Jane, R. A., Simmonds, D. J., Gouldby, B. P., Simm, J. D., Dalla Valle, L., and Raby, A. C. (2018). Exploring the potential for multivariate fragility representations to alter flood risk estimates. Risk Anal. 38, 1847–1870. doi: 10.1111/risa.13007
Jin, J., and Meng, B. (2011). Computation of wave loads on the superstructures of coastal highway bridges. Ocean Eng. 38, 2185–2200. doi: 10.1016/j.oceaneng.2011.09.029
Joe, H. (1997). Multivariate Models and Multivariate Dependence Concepts. New York, NY: CRC Press. doi: 10.1201/b13150
Joint Committee on Structural Safety (JCSS). (2001). Probabilistic Model Code. Part 3: Resistance Models. Available online at: https://www.jcss-lc.org/jcss-probabilistic-model-code/ (accessed July 5, 2020).
Li, Y., and Ellingwood, B. R. (2006). Hurricane damage to residential construction in the US: importance of uncertainty modeling in risk assessment. Eng. Struct. 28, 1009–1018. doi: 10.1016/j.engstruct.2005.11.005
Li, Y. H., Dong, Y., Frangopol, D. M., and Gautam, D. (2020). Long-term resilience and loss assessment of highway bridges under multiple natural hazards. Struct. Infrastruct. Eng. 16, 626–641. doi: 10.1080/15732479.2019.1699936
Liang, M. S., and Julius, S. (2017). “On the coastal topography and storm surge for infrastructure risk assessment and adaptation,” in Paper presented at the World Environmental and Water Resources Congress 2017, (California). doi: 10.1061/9780784480618.023
Longuet-Higgins, M. S. (1980). On the distribution of the heights of sea waves: some effects of non-linearity and finite band width. J. Geophys. Res. Oceans 85, 1519–1523. doi: 10.1029/JC085iC03p01519
Lucas, C., and Soares, C. G. (2015). Bivariate distributions of significant wave height and mean wave period of combined sea states. Ocean Eng. 106, 341–353. doi: 10.1016/j.oceaneng.2015.07.010
Malmstadt, J. C., Elsner, J. B., and Jagger, T. H. (2010). Risk of strong hurricane winds to Florida cities. J. Appl. Meteorol. Climatol. 49, 2121–2132. doi: 10.1175/2010JAMC2420.1
Masina, M., Lamberti, A., and Archetti, R. (2015). Coastal flooding: a copula based approach for estimating the joint probability of water levels and waves. Coast. Eng. 97, 37–52. doi: 10.1016/j.coastaleng.2014.12.010
McInnes, K. L., Macadam, I., Hubbert, G., and O'Grady, J. (2013). An assessment of current and future vulnerability to coastal inundation due to sea level extremes in Victoria, southeast Australia. Int. J. Climatol. 33, 33–47. doi: 10.1002/joc.3405
Moftakhari, H. R., Salvadori, G., AghaKouchak, A., Sanders, B. F., and Matthew, R. A. (2017). Compounding effects of sea level rise and fluvial flooding. Proc. Natl Acade. Sci. U.S.A. 114, 9785–9790. doi: 10.1073/pnas.1620325114
Mondoro, A., Frangopol, D. M., and Soliman, M. (2017). Optimal risk-based management of coastal bridges vulnerable to hurricanes. J. Infrastruct. Syst. 23, 1–12. doi: 10.1061/(ASCE)IS.1943-555X.0000346
Mousavi, M. E., Irish, J. L., Frey, A. E., Olivera, F., and Edge, B. L. (2011). Global warming and hurricanes: the potential impact of hurricane intensification and sea level rise on coastal flooding. Clim. Change 104, 575–597. doi: 10.1007/s10584-009-9790-0
NOAA National Centers for Environmental Information (NECI) (2020). U.S. Billion-Dollar Weather and Climate Disasters. Available online at: https://www.ncdc.noaa.gov/billions/ (accessed July 17, 2020).
Padgett, J., DesRoches, R., Nielson, B., Yashinsky, M., Kwon, O. S., Burdette, N., et al. (2008). Bridge damage and repair costs from hurricane katrina. J. Bridge Eng. 13, 6–14. doi: 10.1061/(ASCE)1084-0702(2008)13:1(6)
Porter, K. A. (2003). “An overview of PEER's performance-based earthquake engineering methodology,” in Paper presented at the Proceedings of Ninth International Conference on Applications of Statistics and Probability in Civil Engineering (ICASP9), San Francisco.
Qian, J., and Dong, Y. (2020). Multi-criteria decision making for seismic intensity measure selection considering uncertainty. Earthquake Eng. Struct. Dyn. 49, 1095–1114. doi: 10.1002/eqe.3280
Raymond, C., Horton, R. M., Zscheischler, J., Martius, O., AghaKouchak, A., Balch, J., et al. (2020). Understanding and managing connected extreme events. Nat. Clim. Change 10, 611–621. doi: 10.1038/s41558-020-0790-4
Saeidpour, A., Chorzepa, M. G., Christian, J., and Durham, S. (2019). Probabilistic hurricane risk analysis of coastal bridges incorporating extreme wave statistics. Eng. Struct. 182, 379–390. doi: 10.1016/j.engstruct.2018.11.069
Salvadori, G., De Michele, C., Kottegoda, N. T., and Rosso, R. (2007). Extremes in Nature: an Approach using Copulas. Netherlands: Springer Science & Business Media. doi: 10.1007/1-4020-4415-1
Schott, T., Landsea, C., Hafele, G., Lorens, J., Taylor, A., Thurm, H., et al. (2019). The Saffir-Simpson Hurricane Wind Scale. National Weather Services, National Hurricane Centre, National Oceanic and Atmospheric Administration (NOAA) Factsheet. Available online at: https://www.nhc.noaa.gov/pdf/sshws.pdf (accessed July 17, 2020).
Segura, R., Padgett, J. E., and Paultre, P. (2020). Metamodel-based seismic fragility analysis of concrete gravity dams. J. Struct. Eng. 146:04020121. doi: 10.1061/(ASCE)ST.1943-541X.0002629
Serafin, K. A., Ruggiero, P., and Parker, K. (2019). What's streamflow got to do with it? A probabilistic simulation of the competing oceanographic and fluvial processes driving extreme along-river water levels. Nat. Hazards Earth Syst. Sci. 19, 1415–1431. doi: 10.5194/nhess-19-1415-2019
Sklar, A. (1959). Fonctions de répartition à n dimensions et leurs marges. Publications de l'Inst. Statist. l'Univ. Paris, 8, 229–231.
Technical Lifelines Council for Earthquake Engineering (TCLEE) (2006). “Hurricane katrina: performance of transportation systems,” in ASCE Technical Council on Lifeline Earthquake Engineering Monograph No. 29, ed. R. DesRoches (Reston, VA: American Society of Civil Engineers).
Trepanier, J., Yuan, J., and Jagger, T. (2017). The combined risk of extreme tropical cyclone winds and storm surges along the US gulf of Mexico Coast. J. Geophys. Res. Atmos. 122, 3299–3316. doi: 10.1002/2016JD026180
Tu, B., Fang, Z., Dong, Y., and Frangopol, D. M. (2017). Time-variant reliability analysis of widened deteriorating prestressed concrete bridges considering shrinkage and creep. Eng. Struct. 153, 1–16. doi: 10.1016/j.engstruct.2017.09.060
Um, M. J., Joo, K., Nam, W., and Heo, J. H. (2017). A comparative study to determine the optimal copula model for the wind speed and precipitation of typhoons. Int. J. Climatol. 37, 2051–2062. doi: 10.1002/joc.4834
Vickery, P. J., Skerlj, P. F., and Twisdale, L. A. (2000). Simulation of hurricane risk in the US using empirical track model. J. Struct. Eng. 126, 1222–1237. doi: 10.1061/(ASCE)0733-9445(2000)126:10(1222)
Vogel, R. M., and Kroll, C. N. (1989). Low-flow frequency analysis using probability-plot correlation coefficients. J. Water Resour. Plan. Manag. 115, 338–357. doi: 10.1061/(ASCE)0733-9496(1989)115:3(338)
Vorogushyn, S., Merz, B., Lindenschmidt, K. E., and Apel, H. (2010). A new methodology for flood hazard assessment considering dike breaches. Water Resour. Res. 46, 1–17. doi: 10.1029/2009WR008475
Wahl, T., Jain, S., Bender, J., Meyers, S. D., and Luther, M. E. (2015). Increasing risk of compound flooding from storm surge and rainfall for major US cities. Nat. Clim. Chang. 5, 1093–1097. doi: 10.1038/nclimate2736
Wahl, T., Plant, N. G., and Long, J. W. (2016). Probabilistic assessment of erosion and flooding risk in the northern Gulf of Mexico. J. Geophys. Res. Oceans 121, 3029–3043. doi: 10.1002/2015JC011482
Wang, M. X., Huang, D., Wang, G., Du, W., and Li, D. Q. (2020). Vine copula based dependence modeling of multivariate ground-motion intensity measures and the impact on probabilistic seismic slope displacement hazard analysis. Bull. Seismol. Soc. Am. doi: 10.1785/0120190244. [Epub ahead of print].
Xu, G., Cai, C., Hu, P., and Dong, Z. (2016). Component level–based assessment of the solitary wave forces on a typical coastal bridge deck and the countermeasure of air venting holes. Pract. Period. Struct. Des. Construct. 21:04016012. doi: 10.1061/(ASCE)SC.1943-5576.0000291
Zaghi, A. E., Padgett, J. E., Bruneau, M., Barbato, M., Li, Y., Mitrani-Reiser, J., et al. (2016). Establishing common nomenclature, characterizing the problem, and identifying future opportunities in multihazard design. J. Struct. Eng. 142:H2516001. doi: 10.1061/(ASCE)ST.1943-541X.0001586
Zhang, Y., Kim, C.-W., Beer, M., Dai, H., and Soares, C. G. (2018). Modeling multivariate ocean data using asymmetric copulas. Coast. Eng. 135, 91–111. doi: 10.1016/j.coastaleng.2018.01.008
Keywords: hurricanes, natural hazard, copula, joint probability, vulnerability analysis
Citation: Li Y, Dong Y and Zhu D (2020) Copula-Based Vulnerability Analysis of Civil Infrastructure Subjected to Hurricanes. Front. Built Environ. 6:571911. doi: 10.3389/fbuil.2020.571911
Received: 12 June 2020; Accepted: 08 September 2020;
Published: 22 October 2020.
Edited by:
Reza Marsooli, Stevens Institute of Technology, United StatesReviewed by:
Robert A. Jane, University of Central Florida, United StatesJill Trepanier, Louisiana State University, United States
Copyright © 2020 Li, Dong and Zhu. This is an open-access article distributed under the terms of the Creative Commons Attribution License (CC BY). The use, distribution or reproduction in other forums is permitted, provided the original author(s) and the copyright owner(s) are credited and that the original publication in this journal is cited, in accordance with accepted academic practice. No use, distribution or reproduction is permitted which does not comply with these terms.
*Correspondence: You Dong, eW91LmRvbmdAcG9seXUuZWR1Lmhr