 Ken Ishibashi
 Hitoshi Furuta
 Koichiro Nakatsu3
- 1School of Social Information Science, University of Hyogo, Hyogo, Japan
- 2Graduate School of Engineering, Osaka City University, Osaka, Japan
- 3Department of Modern Life, Osaka Jonan Women’s Junior College, Osaka, Japan
This study aims to develop a bridge maintenance plan in consideration of the resilience of a road network against natural disasters. Toward this end, the reliability of a road network is calculated using the failure probability of bridges as an evaluation index. Bridges are a form of social infrastructure that are essential for maintaining daily life; however, their repair and reinforcement can cause the partial disruption of road networks. Nonetheless, insufficient bridge maintenance can cause serious harm to people in an emergency, such as after an earthquake. Therefore, studies have aimed to develop long-term plans to minimize the life-cycle cost (LCC) of bridges. Other studies have measured the probability of bridge failure and developed countermeasures against natural disasters to improve the reliability and resilience of bridges. Unfortunately, past studies have focused on these aspects independently of one another, even though an effective bridge maintenance plan requires them to be considered together. A plan that both minimizes LCCs and improves resilience is expected to be useful for sustainable bridge management. We search for candidates for optimal plans for long-term bridge maintenance by using a genetic algorithm (GA). The proposed method has three objectives: (1) minimization of bridge repair and reinforcement costs, (2) minimization of disruption to social activities (i.e., user cost) due to bridge maintenance, and (3) maximization of resilience against natural disasters. First, the GA is used to search for a plan with minimized maintenance cost and a flexible work period by considering the uncertainties related to bridges. The remaining indices are optimized based on the flexible period. The resilience of bridges is measured through Monte Carlo simulations by using the failure probability based on the bridge state at a certain point. Numerical experiments are conducted to demonstrate the usefulness of this method for establishing a sustainable bridge maintenance plan.
Introduction
Sustainable bridge management is necessary for maintaining daily life and social activities. Unfortunately, bridge networks are managed on limited budgets. Thus, a management plan that minimizes the bridge repair cost (i.e., life-cycle cost, LCC) is essential. Developing a medium- and long-term plan is effective for estimating maintenance costs for ensuring the safety of a bridge, and it is expected to reduce the LCC by prolonging the lifespan of the bridge. Further, this type of plan is optimized to maximize the safety and reduce the LCC in consideration of factors such as repair methods, working years, and number of bridges. Therefore, a genetic algorithm (GA), which is effective for solving combinatorial optimization problems (Goldberg, 1989), has been applied to develop an optimal plan (Furuta et al., 2006a).
The concept of resilience has attracted much attention in relation to infrastructure since the Great East Japan Earthquake of March 2011. The resilience of a bridge network depends on not only the capacity for maintaining its normal functions in any situation but also the capacity for rapidly restoring them in the event of an interruption (Bruneau et al., 2003). Various quantitative studies have investigated the resilience of bridge networks against natural disasters. However, few studies have investigated indices of resilience that are applicable to the medium- and long-term scheduling of maintenance works for a bridge network (Yang and Frangopol, 2019). Medium- and long-term plans should include measures to handle a natural disaster. Many routes are closed when performing bridge maintenance works. If a natural disaster occurs during this time, rapid emergency recovery will be hindered regardless of the damage scale. Therefore, medium- and long-term plans that enable activities for restoring resilience are essential for sustainable bridge management.
This study proposes new indices of resilience that are applicable to the medium- and long-term scheduling of maintenance works for a bridge network. The working probability of emergency network recovery and the distance from a recovery base to stricken areas are calculated based on a reliability analysis of a bridge network. Then, these values are used to calculate the proposed indices of resilience. Such indices are expected to be useful for identifying bridges that should be prioritized for restoration work and for evaluating annual budget allocations. As a first step toward this end, this study investigates the relationship between resilience and user cost, a social loss, under a minimized maintenance cost. Numerical examples using a 20-bridge network are presented to verify the usefulness of the proposed indices for developing medium- and long-term maintenance plans.
Bridge Management and Resilience Against Natural Disasters
Sustainable Bridge Management
A bridge network is an essential social infrastructure for daily life. Bridge management plays an important role in maintaining this infrastructure. Periodic inspection of bridges is effective for evaluating their safety. Unfortunately, limited annual budgets are generally available for conducting bridge repairs. Therefore, medium- and long-term bridge management plans are useful for reducing maintenance costs and maintaining bridges safely. Bridge maintenance is classified as preventative or reactive maintenance depending on whether it is performed before or after the safety of a bridge is reduced, respectively. Preventive maintenance increases the number of repairs performed; nonetheless, it is relatively cheaper than reactive maintenance. The condition of a bridge must be understood well for performing preventative maintenance. In particular, medium- and long-term management plans have proved to be effective for increasing the transparency of the need for bridge maintenance. Therefore, various studies have been conducted on bridge management (Doebling et al., 1998; Furuta et al., 2006a).
Studies have investigated the scheduling of bridge maintenance works to improve various aspects of bridge management, such as the maintenance cost, influence of maintenance works on bridge users (i.e., user cost), and safety. For example, studies on optimizing maintenance schedules have examined the minimization of various costs (Frangopol et al., 2001) and uncertainties such as changes in the deterioration rate (Furuta et al., 2013). Many studies have adopted a method that defines the LCC by weighting the maintenance cost and the user cost (Shinha et al., 2009). Uncertainties such as changes in the deterioration rate were handled as an evaluation index or as a constraint condition (Bukhsh et al., 2020). Then, an optimal solution was obtained by considering multiple indices or constraint conditions. Another approach optimized each index in stages without weighting the maintenance cost and user cost (Ishibashi et al., 2013). In this approach, a preventive maintenance plan was developed subject to a minimum maintenance cost set previously. In a preventive maintenance plan, a maintenance work is implemented during a period in which a bridge part has safety. That is, a maintenance work has a grace period until the time that the safety of a part is lost. This approach optimized the maintenance schedule by reducing the user cost and reducing the influence of uncertainties by using the grace period of work.
In this light, the present study examines the scheduling of maintenance works in medium- and long-term bridge management plans. The risk of large-scale natural disasters such as earthquakes has not been examined sufficiently in the optimization of such plans because the scale of loss due to such disasters is much larger than the maintenance cost. Therefore, this study examines a method to minimize the risk of natural disasters based on the approach of Ishibashi et al. (2013).
Resilience Against Natural Disasters
The concept of resilience for taking countermeasures against large-scale disasters such as earthquakes and tsunamis has attracted much attention since the Great East Japan Earthquake of March 2011. Resilience generally refers to the capacity for maintaining the original functional state and the ability to repair damage to restore this state. In the specific context of the present study, Holling (1973), Birkmann (2006), and Norris et al. (2008) discussed the definition of resilience and suggested that resilience implies the ability to restore a system to its original state even if it is damaged in a disaster. In this regard, resilience against natural disasters includes countermeasures such as preemptive disaster prevention, disaster reduction (i.e., reactive maintenance of a system), and the ability to repair damage to restore the original state via the flexible handling of unexpected damage.
Various studies have examined quantitative measurements of resilience against natural disasters. For example, Bruneau et al. (2003) stated that resilience against natural disasters involves the “4R” elements, namely, robustness, redundancy, resourcefulness, and rapidity. Based on these 4R elements, Furuta et al. (2014) proposed an index for quantitatively evaluating the resilience of a road network. Furthermore, Yang and Frangopol (2019) investigated the optimization of a management plan by defining an index of resilience with a focus on the deterioration curve of a structure. Existing studies have considered resilience quantitatively when developing plans. This study proposes indices of resilience for scheduling medium- and long-term maintenance works based on an analysis of the reliability of a bridge network.
Development of Bridge Management Plan
Problem
The target problem is a maintenance schedule for a coastal road network consisting of 20 concrete bridges, as shown in Figure 1. Each bridge consists of six components, as shown in Figure 2. The scheduling period is 100 years.
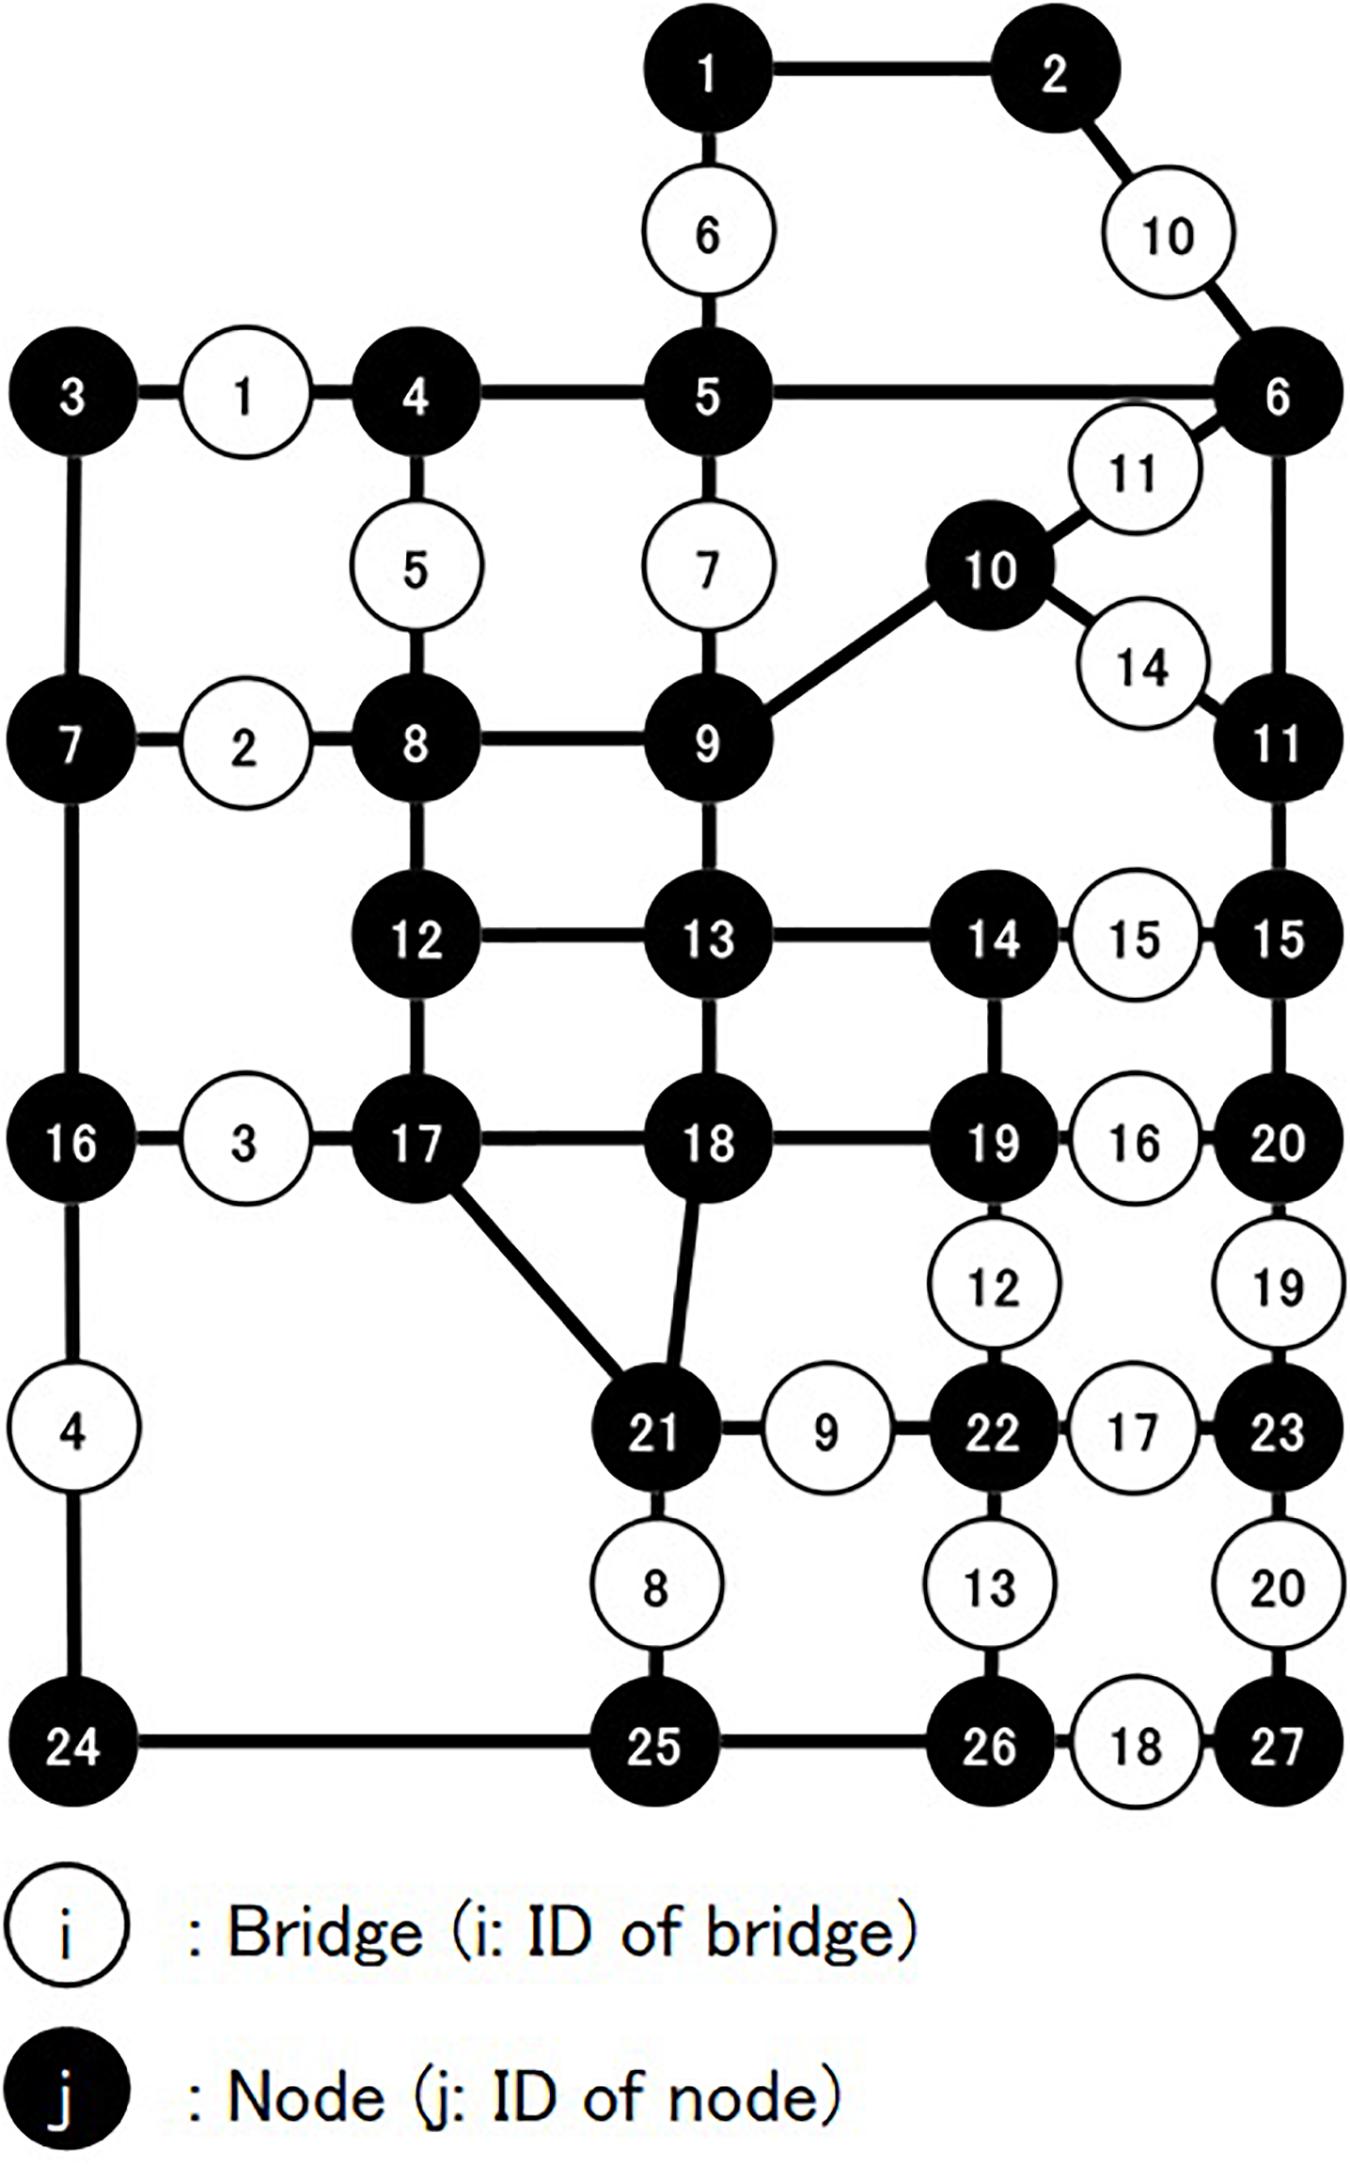
Figure 1. Road network.
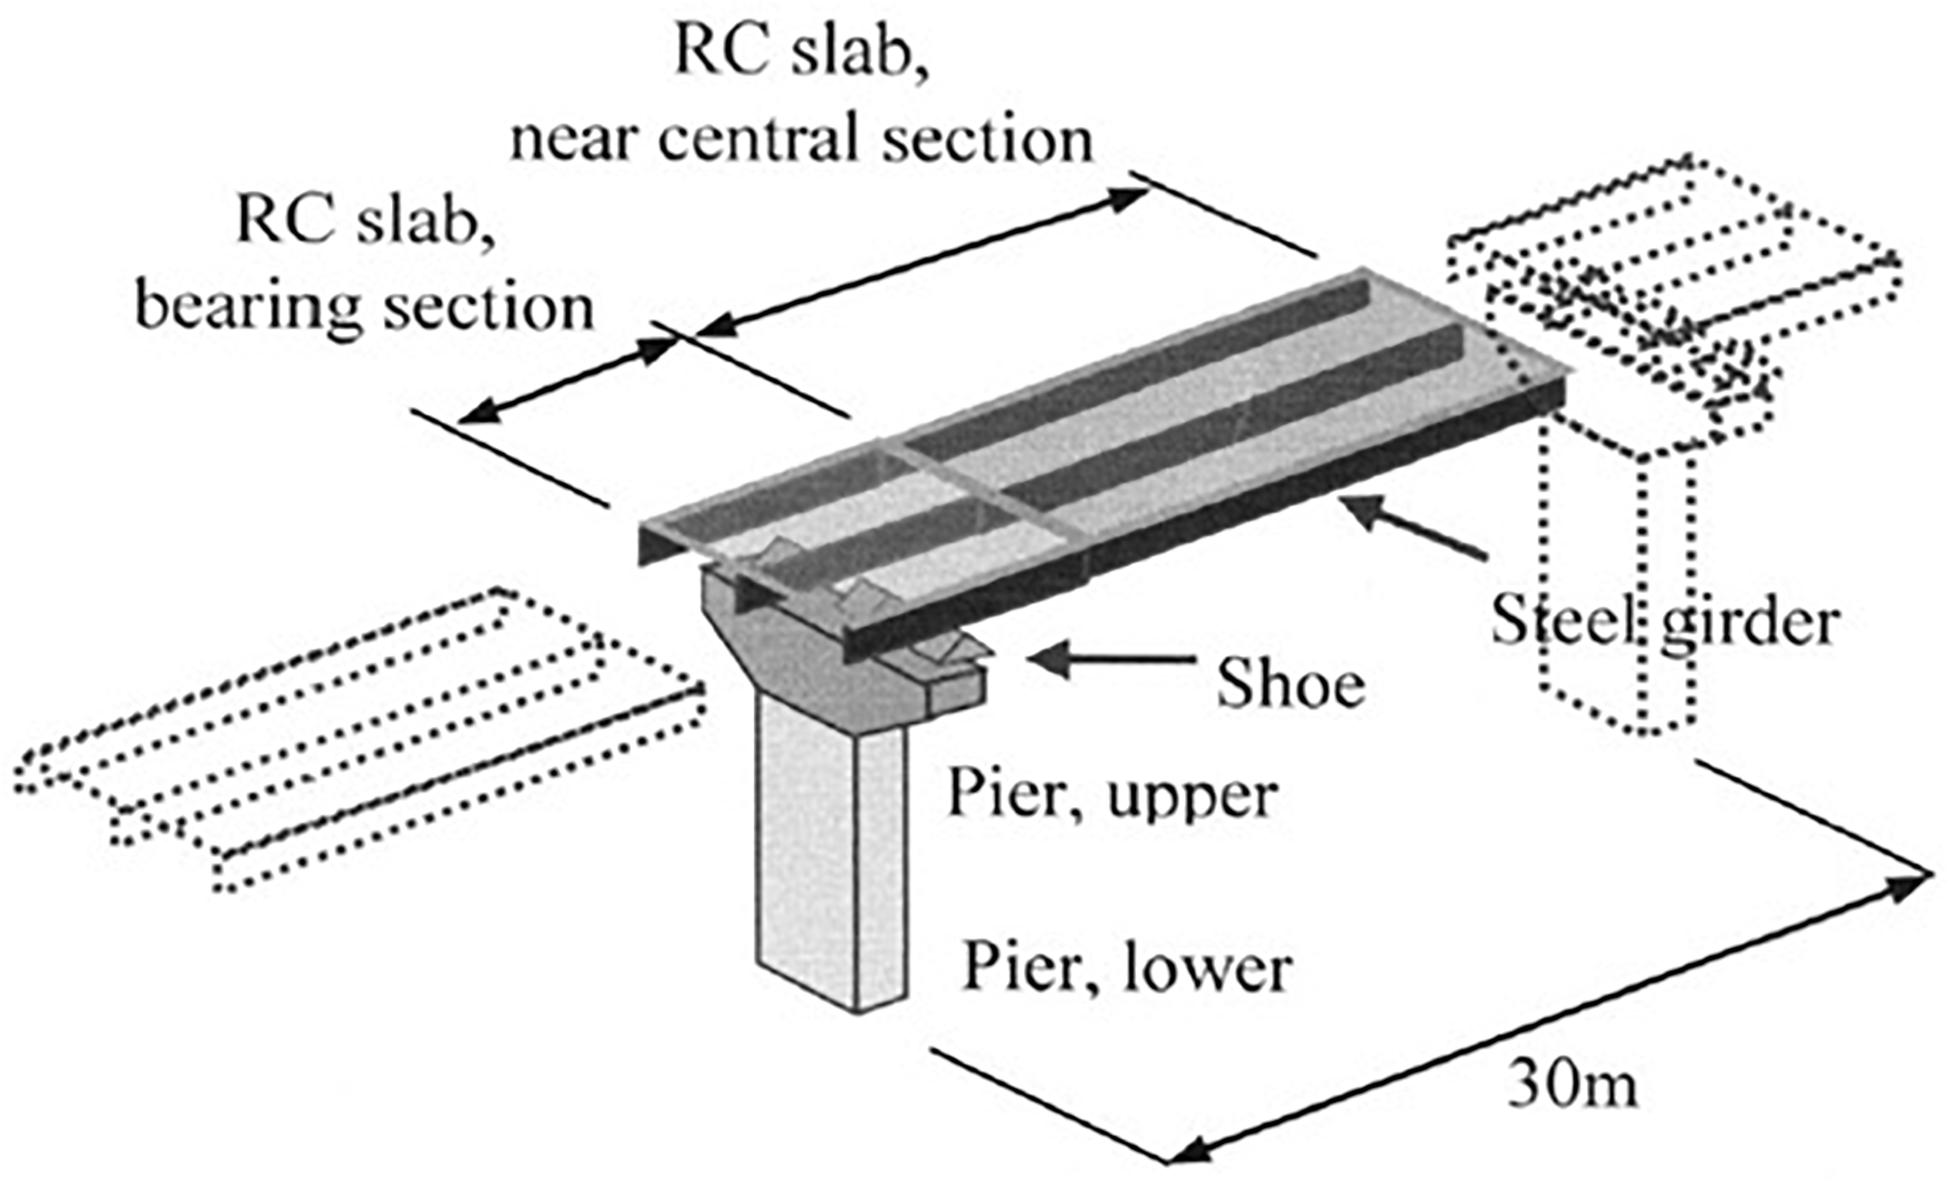
Figure 2. Bridge model.
Deterioration Model of Bridge Components
This study uses the bridge model applied in Nakatsu et al. (2011). The degradation model refers to the study by Furuta et al. (2006b). In this degradation model, the structural performance of a part deteriorates over time; the degradation process consists of the latency phase, progress phase, and accelerated phase. The degradation phase changes according to turning points T0, T1, and T2 shown in Figure 3A. These turning points depend on the extent of the influence of external environmental factors such as chloride attack. As shown in Figure 4, the stronger the chloride attack, the shorter the intervals are among turning points. In this study, the performances of a pier and a reinforced concrete slab were evaluated based on this degradation system. The degradation of a shoe and a steel girder does not depend on external environmental factors, as shown in Figure 3B. The performance of the shoe is 1.0, and the number of years for which it has been used is less than the service life of the rubber bearing. The performance of the steel girder is maintained while its surface coating remains undamaged. In addition, the importance of a given bridge in the road network is randomized.
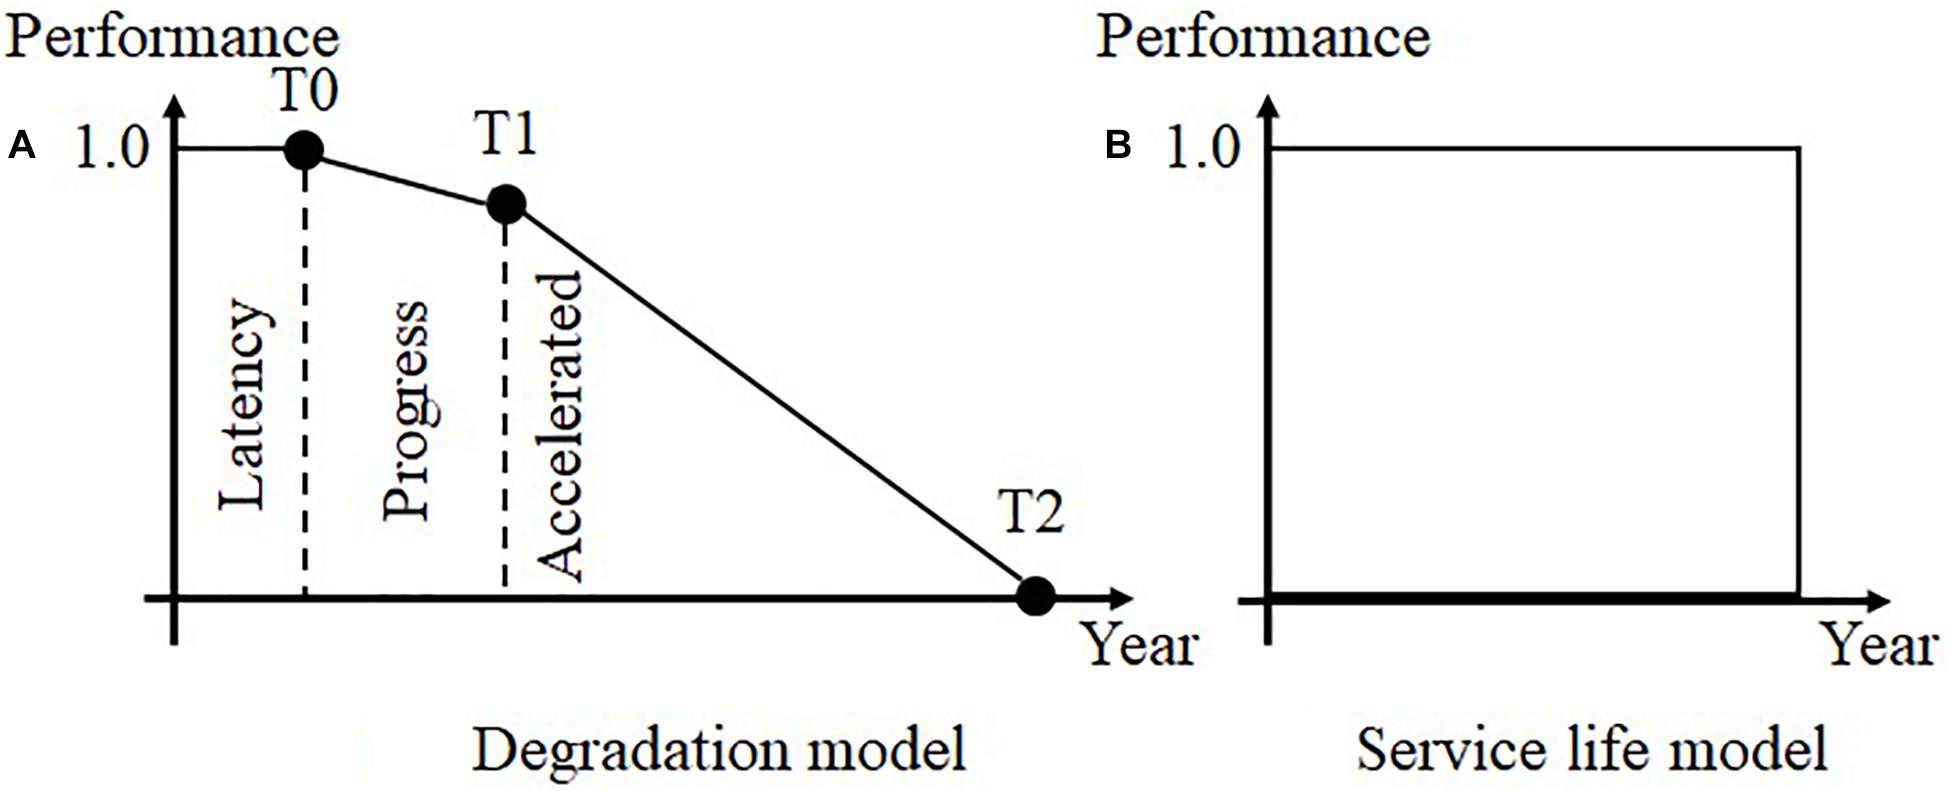
Figure 3. Deterioration model of bridge. (A) Degradation model, and (B) Service life model.
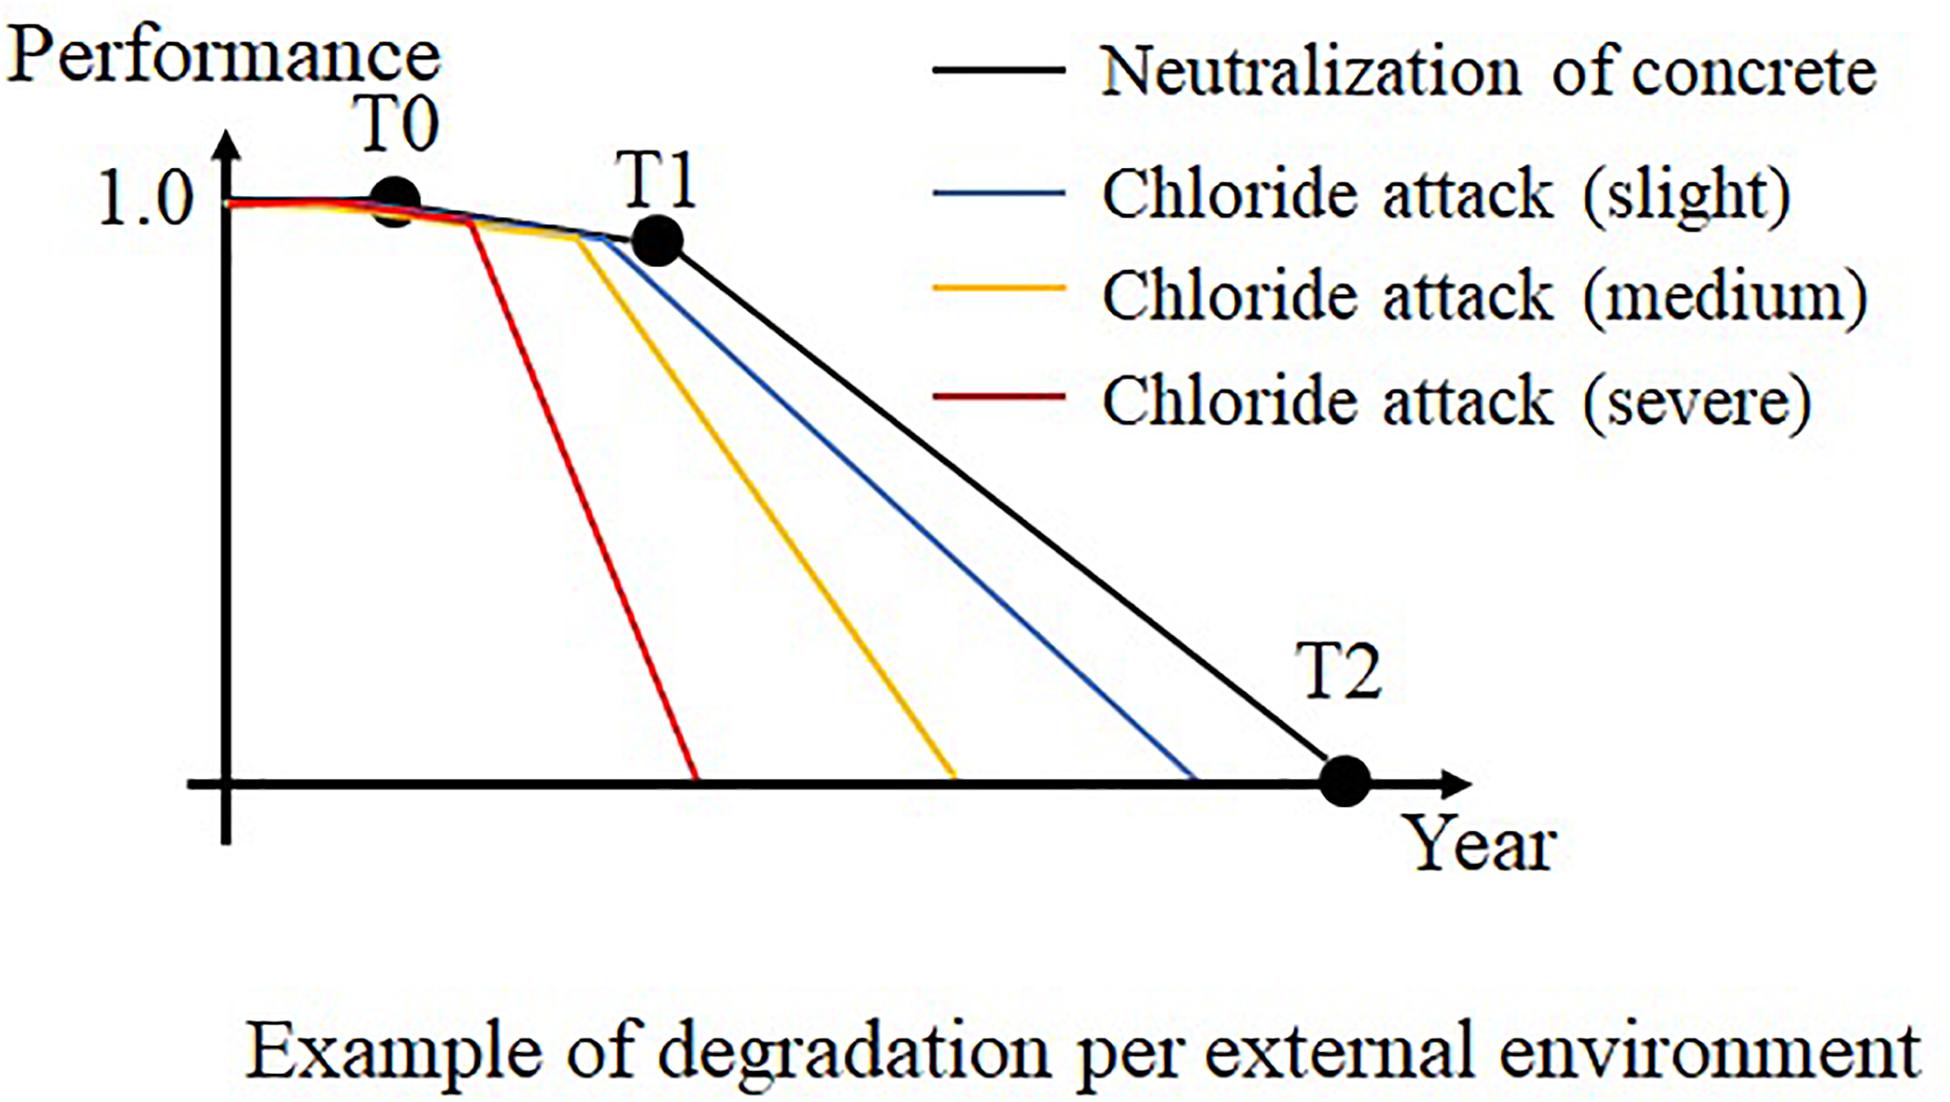
Figure 4. Example of degradation.
Life-Cycle Cost
As defined by Nakatsu et al. (2011), this study considers the LCC to be the summation of several annual costs such as the construction cost and user cost. Figure 5 shows a breakdown of the construction cost. The construction cost is defined according to the Cost Estimation Standards for Civil Construction (Ministry of Land, Infrastructure, and Transportation [MLIT], 2001). The direct construction cost is adopted as the construction cost. The direct construction cost consists of material, labor, and scaffold costs. In particular, material and labor costs depend on the maintenance plan. The user cost is the cost incurred when a bridge is not available. For example, bridge users are diverted to different routes while a bridge is under maintenance. The social loss caused by maintenance works cannot be ignored in the long-term use of a bridge. Therefore, the maintenance plan must include the user cost in the LCC (Bai et al., 2013). In keeping with Furuta et al. (2010), this study considers the user cost in medium- and long-term plans. The performance deterioration of each component can be recovered or prevented through repairs and reinforcement. For example, bearings, steel girder paint, and exchange slabs are repaired or restored in shoes, girders, and slabs, respectively, for maintaining them. The repair cost is estimated by adding the construction cost, which is determined by the area of a component and the repair method, to the scaffolding cost. A scaffold can be shared among multiple components when they are repaired in the same year. Basically, the scaffold required by certain components can be shared with other components below it.
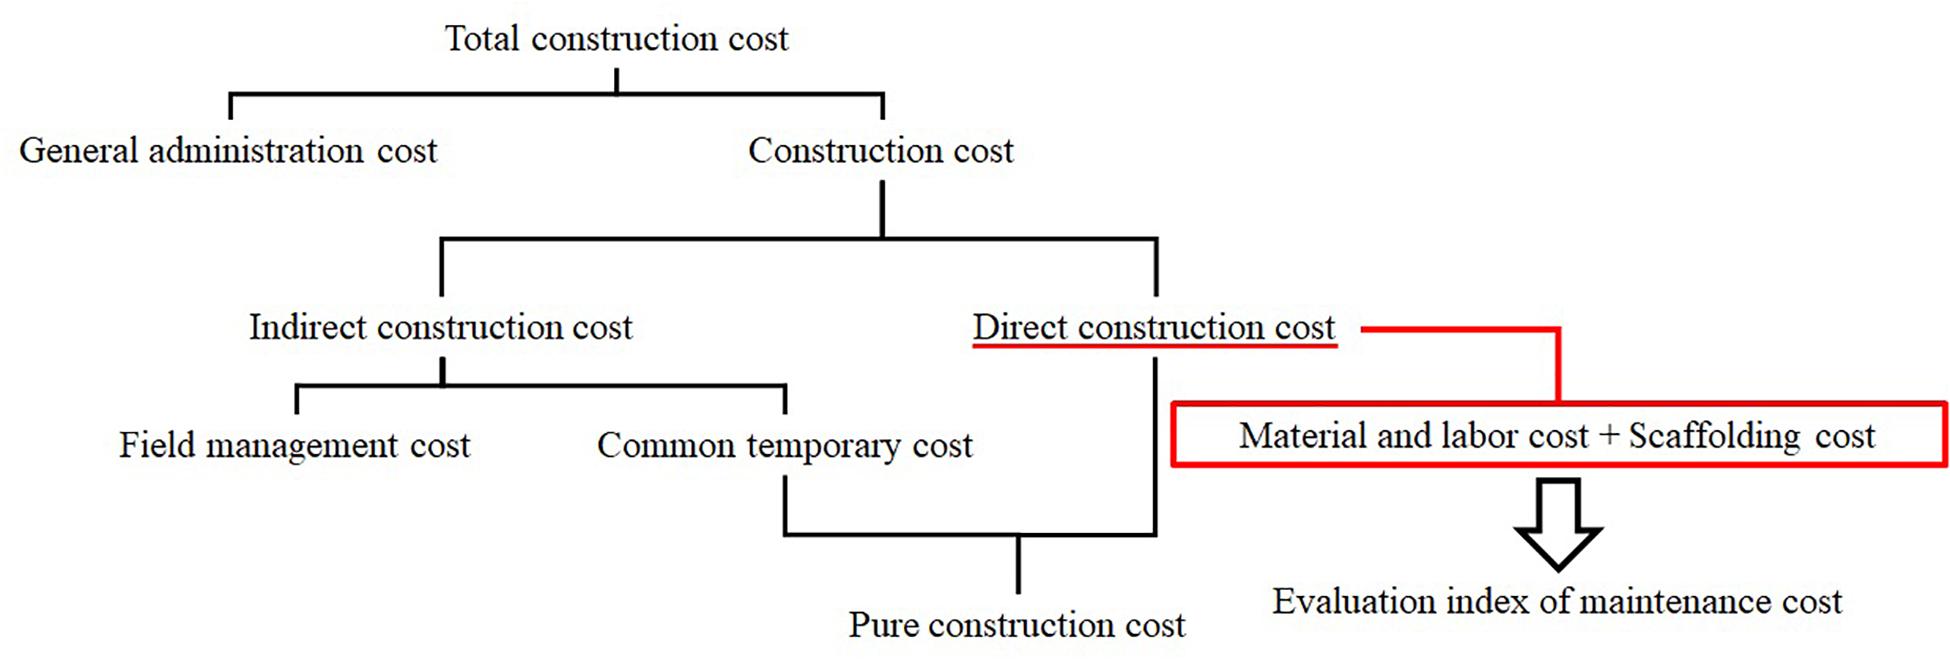
Figure 5. Breakdown of construction cost.
Problem Setting
In maintenance planning, the safety of all components must be maintained during their service lifetime. This study set a service lifetime of 100 years. Therefore, the plan must minimize the maintenance cost under these conditions. The maintenance cost is calculated based on each individual bridge component as follows:
The user cost of the bridge network is calculated as follows:
Equation (3) gives a constraint condition on the safety performance. The safety performance of a bridge component is required to be at least 0.8, as per Furuta et al. (2006b). This is because this study aims to verify the usefulness of the proposed indices of resilience through numerical examples.
This value should be determined on the basis of safety required in the real-world maintenance management.
Evaluation of Resilience for the Bridge Network
This study proposes indices of resilience based on the reliability analysis of a bridge network. Specifically, it develops indices of resilience for robustness and rapidity. To evaluate the resilience in emergency recovery against seismic disasters, this study examines whether the bridge network shown in Figure 6 with a base at node 13 works. The network state is determined by the connection from base node 13 to terminal nodes 1, 5, 7, 15, 22, 23, 25, and 27. To reach a terminal node from the base node, a restoration team has to cross a bridge, as shown in Figure 6. If even one path between the base node and each terminal node is disconnected, the road network is considered to not be working. The distance between all nodes is set to 1, and the difference in minimal distances between normal and damaged states is calculated. Furthermore, the reliability of the road network in a day is calculated by aggregating the working states of the network and the differences in distance in a Monte-Carlo simulation. The working probability of the road network is calculated from aggregated simulation results. Moreover, from the simulation results, the mean of the difference between the minimal distances in the normal and the damaged states is used as the average moving distance.
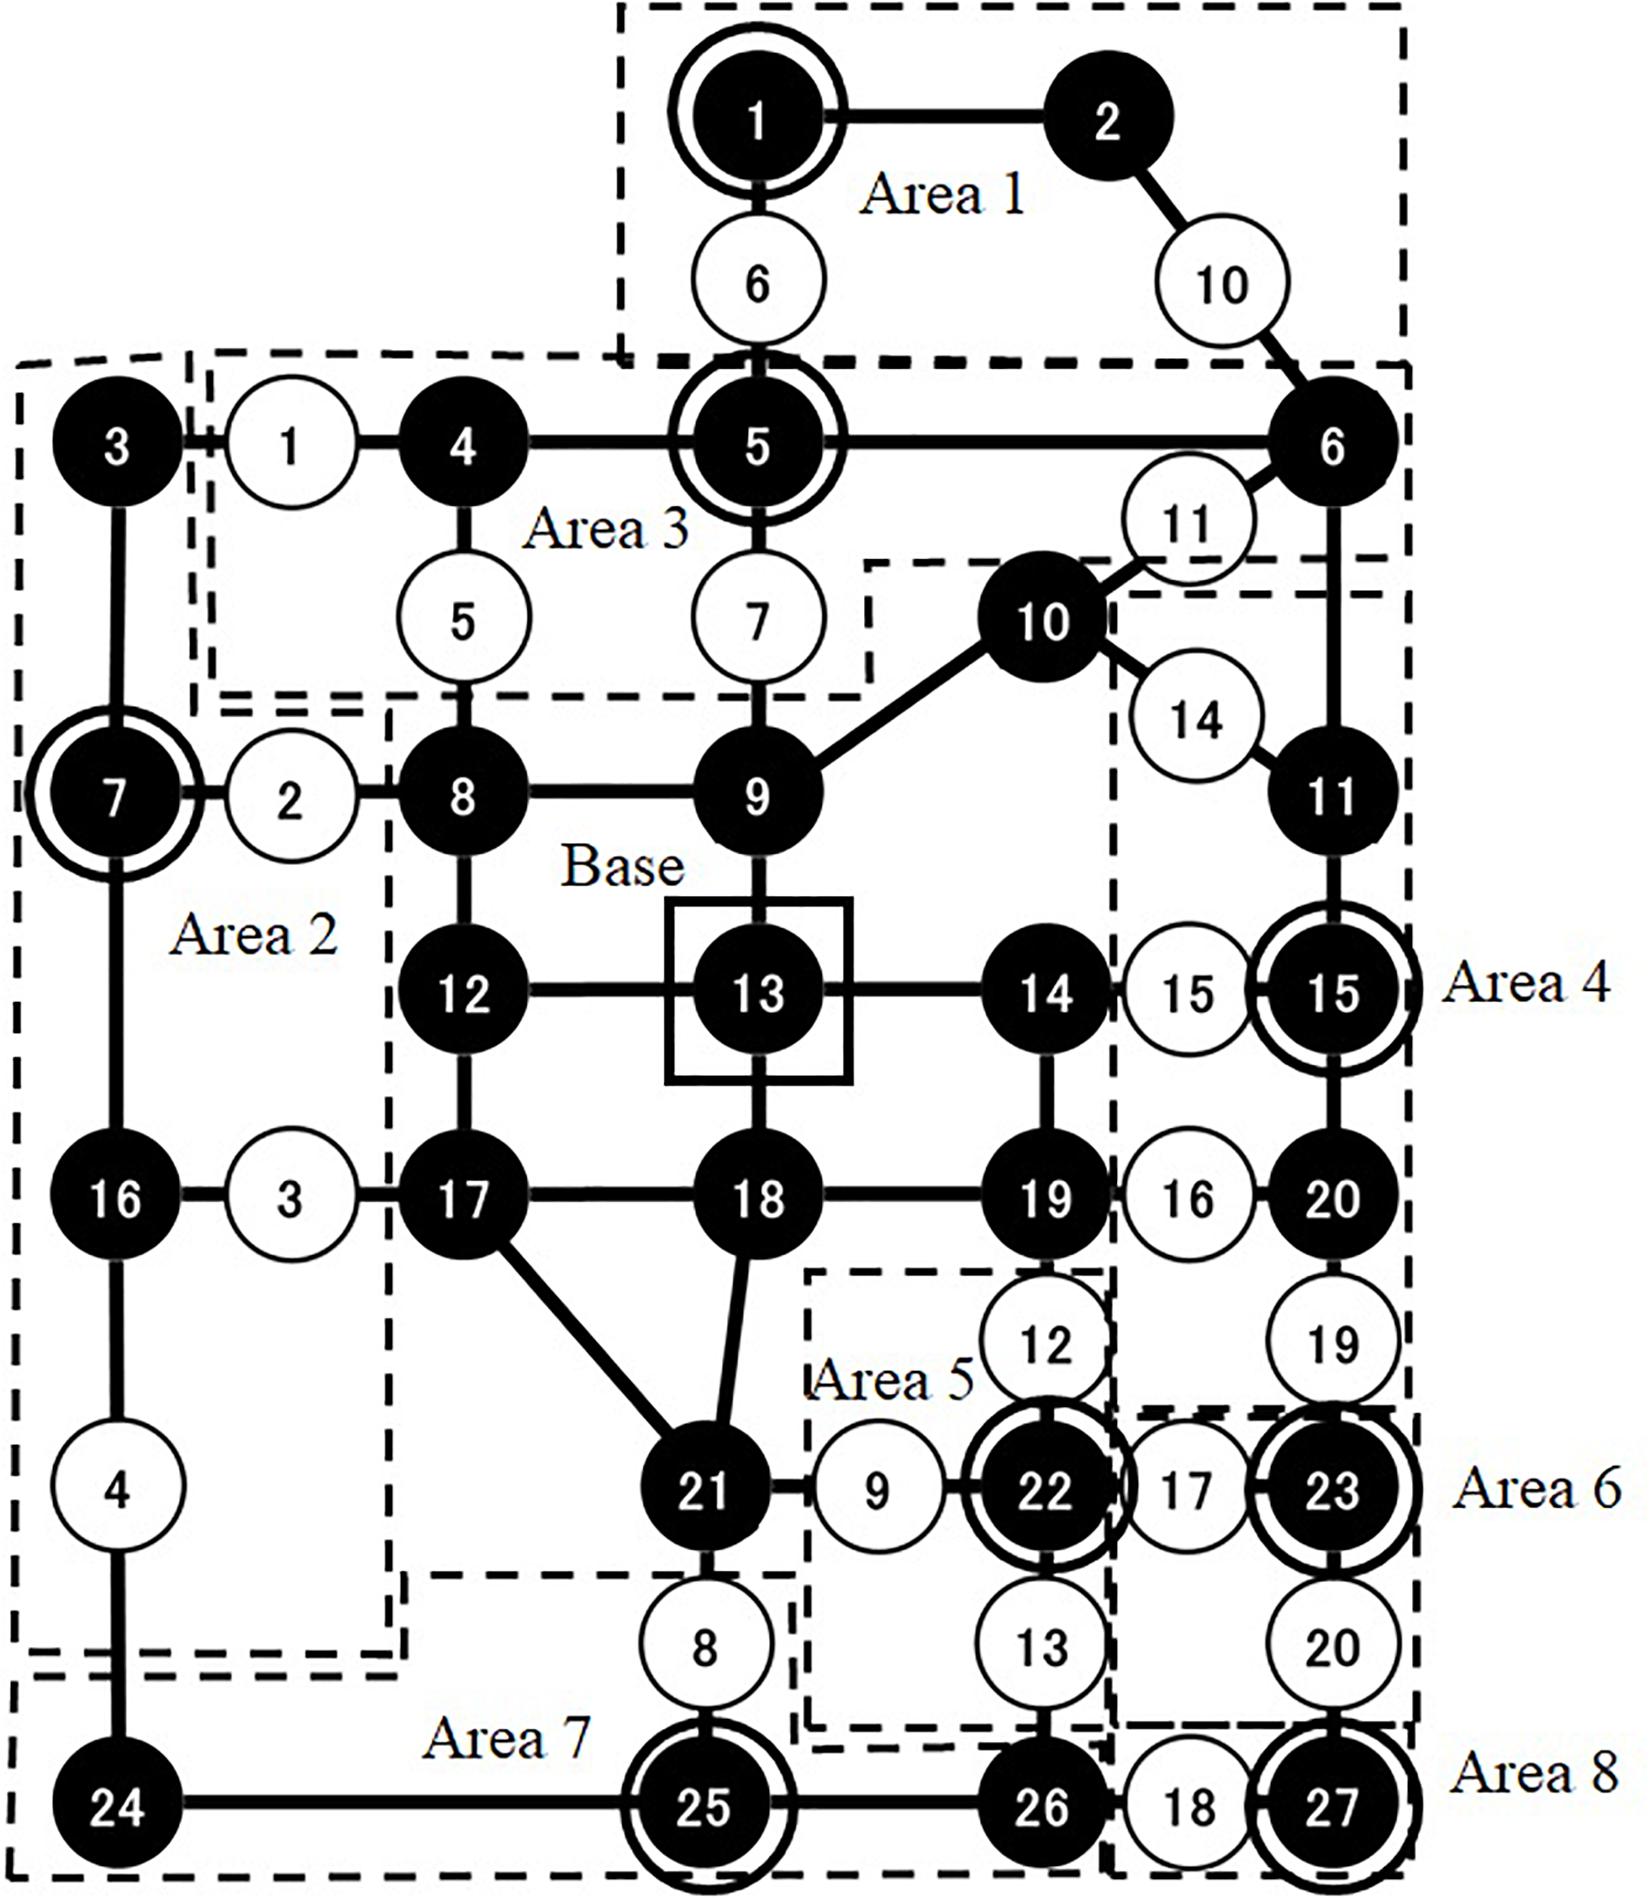
Figure 6. Problem setting for emergency recovery.
Indices of resilience are defined using the results of the reliability analysis of a road network during the term of the maintenance plan. In this study, large-scale seismic disasters may occur more than once because the term is 100 years. Therefore, the reliability of a road network under a daily work plan is used to calculate the indices. In this case, a bridge (link) that is under maintenance is impassable regardless of its damage state for that day. As shown in Figure 7, the index of robustness (hereafter, simply “robustness”) is defined as the summation of the working probability per day as follows:
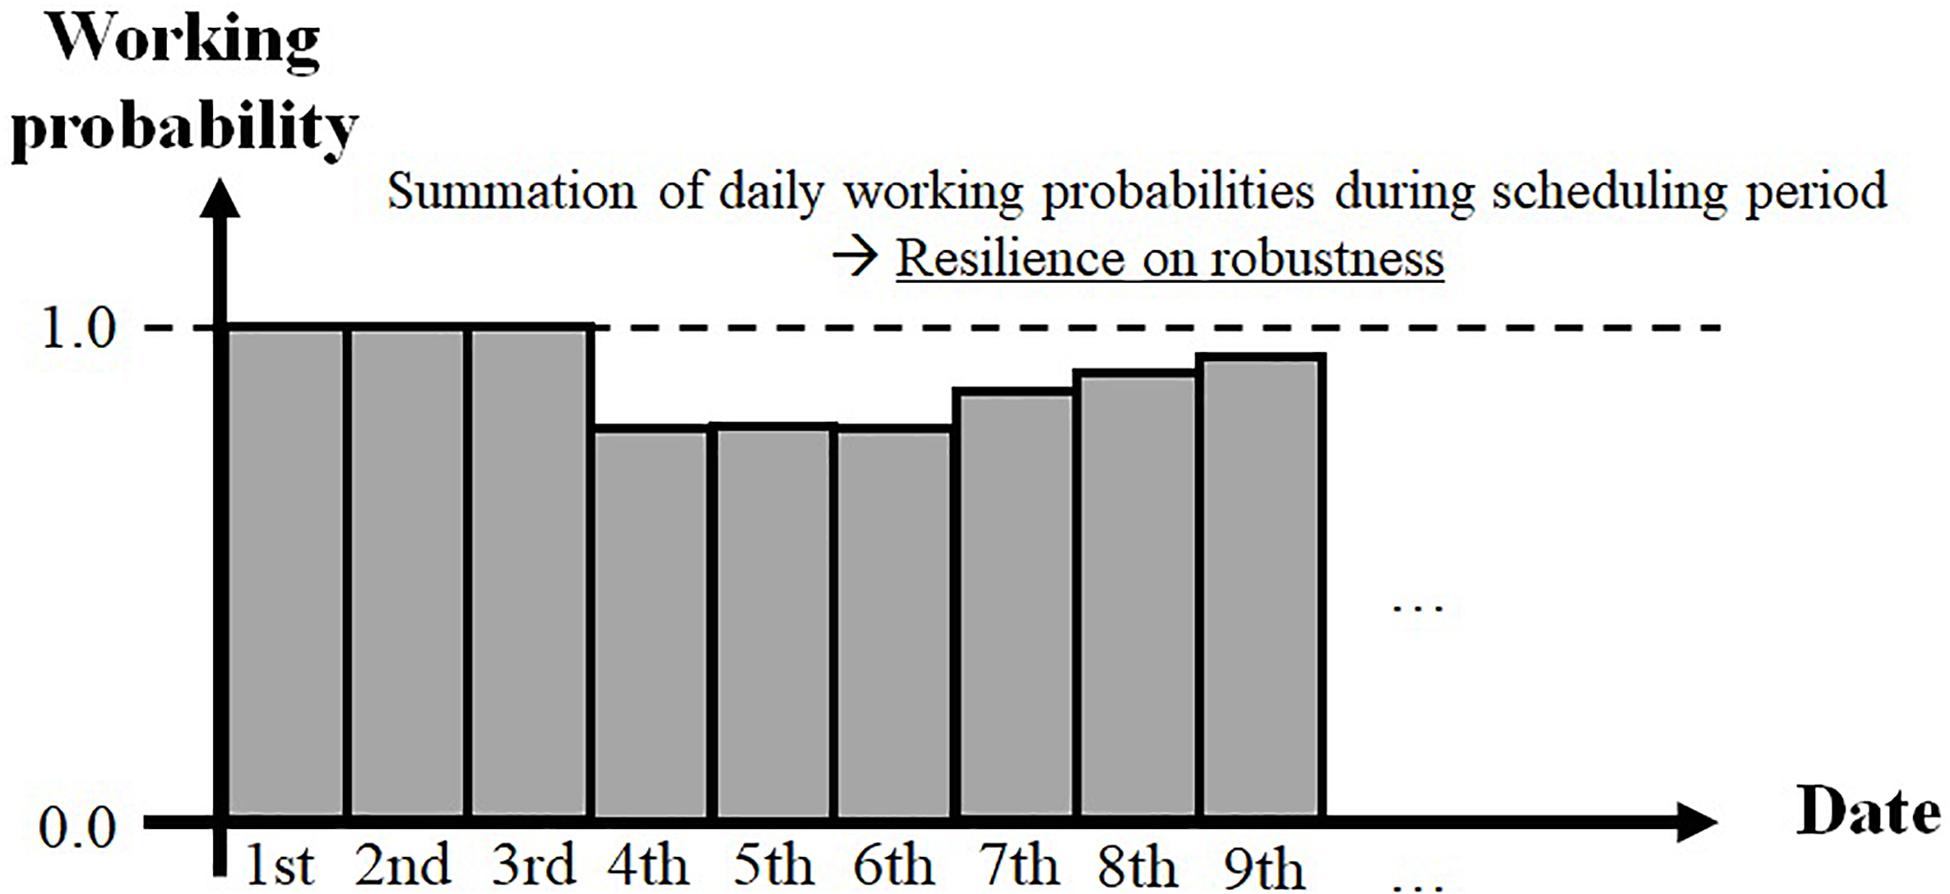
Figure 7. Index of robustness.
In addition, the index of rapidity (hereafter, simply “rapidity”) is defined as the summation of the average moving distance per day as follows:
The larger the value, the more resilient the robustness becomes. However, the smaller the value, the more resilient the rapidity becomes. The resilience of the bridge maintenance plan is calculated by using these indices.
Optimizing a bridge maintenance schedule requires enormous computation time to run parallel simulations to analyze the reliability of the road network using a daily work plan. Thus, this study created a database of previous simulation results with various working patterns. In the Monte-Carlo simulation, every link has a set failure probability. For example, the failure probability of a bridge link was set as 5%, whereas that of a road link was set as 30%; this is because roads may become impassable due to damage such as neighboring structures collapsing, whereas bridges do not. The probability of each bridge link did not change depending on the safety performance because the constraint conditions were set to ensure the safety of all bridges. Moreover, a bridge link under maintenance becomes impassable, as described above. The upper limit of the number of bridges being repaired per day was set to six. This is because the road network hardly worked when seven or more bridges were being repaired. From 1,000 Monte Carlo simulations, the working probability of cases without impassable bridges was 91.2% and the average moving distance was 13.306. Table 1 shows the simulation results of patterns with one impassable bridge. From these results, bridge 6 was found to have the strongest impact on the resilience of the road network among the 20 bridges.
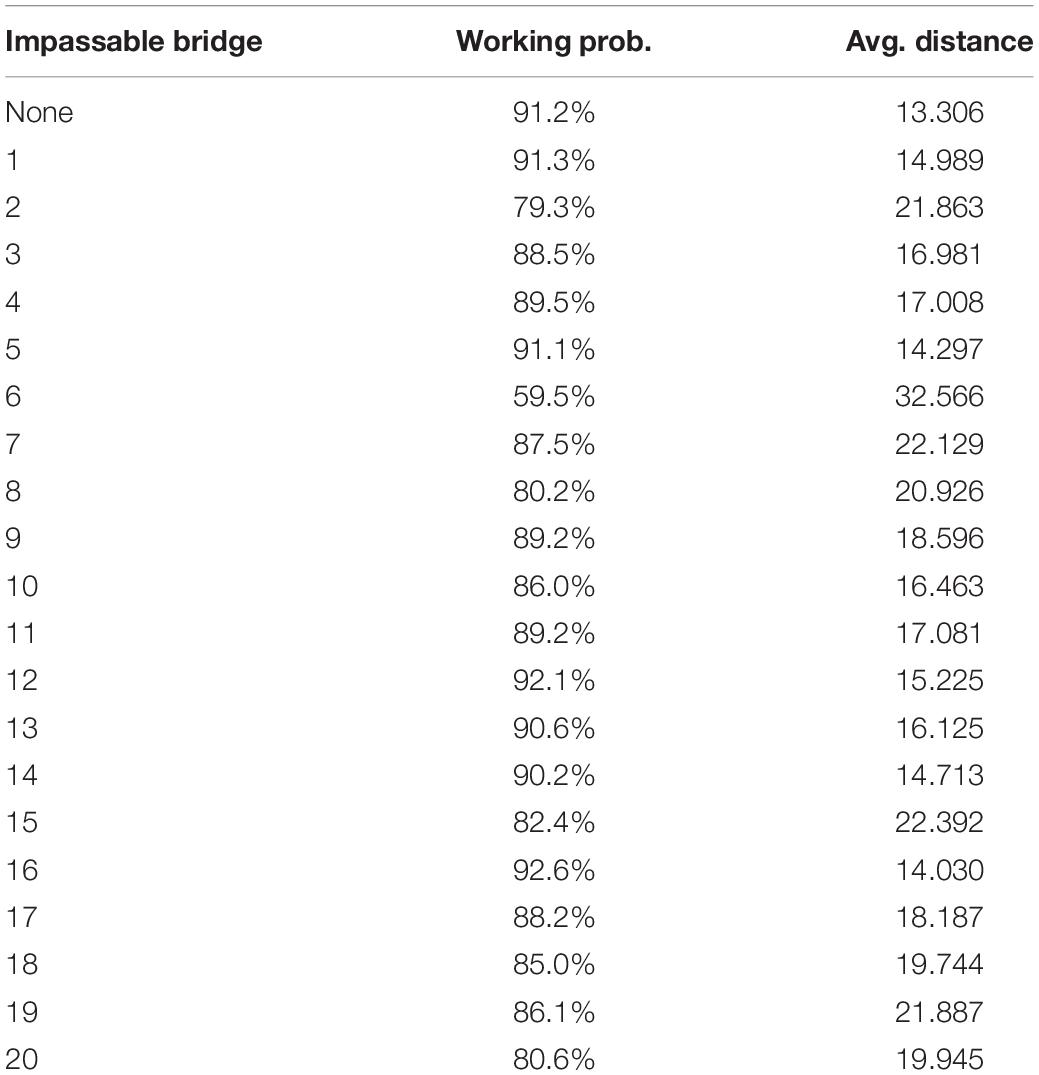
Table 1. Simulation results of patterns with one impassable bridge.
Scheduling a Maintenance Plan Using a Genetic Algorithm
Studies have already applied various improved GAs and multi-objective GAs to maintenance scheduling (Furuta et al., 2006b). The present study uses the improved GA proposed by Ishibashi et al. (2013) to compare several patterns of evaluation indices and to verify the applicability of these indices of resilience.
Scheduling a Maintenance Plan With Flexibility Against Changes of Situations
Based on the method of Ishibashi et al. (2013), (1) this study makes a preventive maintenance plan with minimized maintenance costs (direct construction costs are shown in Figure 5). Then, (2) indices on resilience are optimized in periods when an implemented year of work is changeable (hereinafter, referred to as “flexible periods”) derived from preventive maintenance.
(1) In scheduling a preventive maintenance plan, the minimized maintenance cost of each bridge, as given by Eq. (1), was previously calculated using a GA. Here, the safety performance given by Eq. (3) is used as the constraint condition. Next, under the constraint conditions with the minimized maintenance cost of each bridge, the safety performance and the length of flexible periods are maximized using the GA to schedule maintenance works for each bridge. A flexible period of work refers to a period in which an implementation year can be changed without changing the maintenance cost while maintaining the safety performance. In this method, the flexible period uses preventive maintenance, that is, maintenance performed ahead of schedule. In this manner, a preventive maintenance plan is developed for each bridge.
(2) For optimizing the indices of resilience, first, the GA decides the month in which each work is implemented during the flexible period. Then, the indices of resilience given by Eqs (4) and (5) and the user cost given by Eq. (2) are calculated according to a monthly work plan. Then, the results with each optimized index are compared. In this manner, this study verifies the usefulness of the proposed indices on resilience based on a reliability analysis of the bridge network.
Optimization in Flexible Periods Using a Genetic Algorithm
In the optimization, a genetic array is created according to the number of works in the maintenance plan, and it is decoded by following the rule shown in Figure 8. In addition, this method considers the influence of simultaneous works on the user cost and indices of resilience by treating the implemented month of work as a design variable. Changing years of work is converted into a real value in the range [0, 1] from a binary array, as shown in Figure 8. This is because a genetic array with integer values is not suitable for genetic operators such as crossover and mutation. The changed years of work are obtained by multiplying the length of the flexible periods by this value. Uniform crossover is adopted as the crossover operator, and mutations occur by randomly changing the value. The fitness of an individual is determined by following the rule shown in Figure 9. The user cost and indices of resilience are used as the sorting indices. Different sorting rules are formulated depending on the purpose of verification.
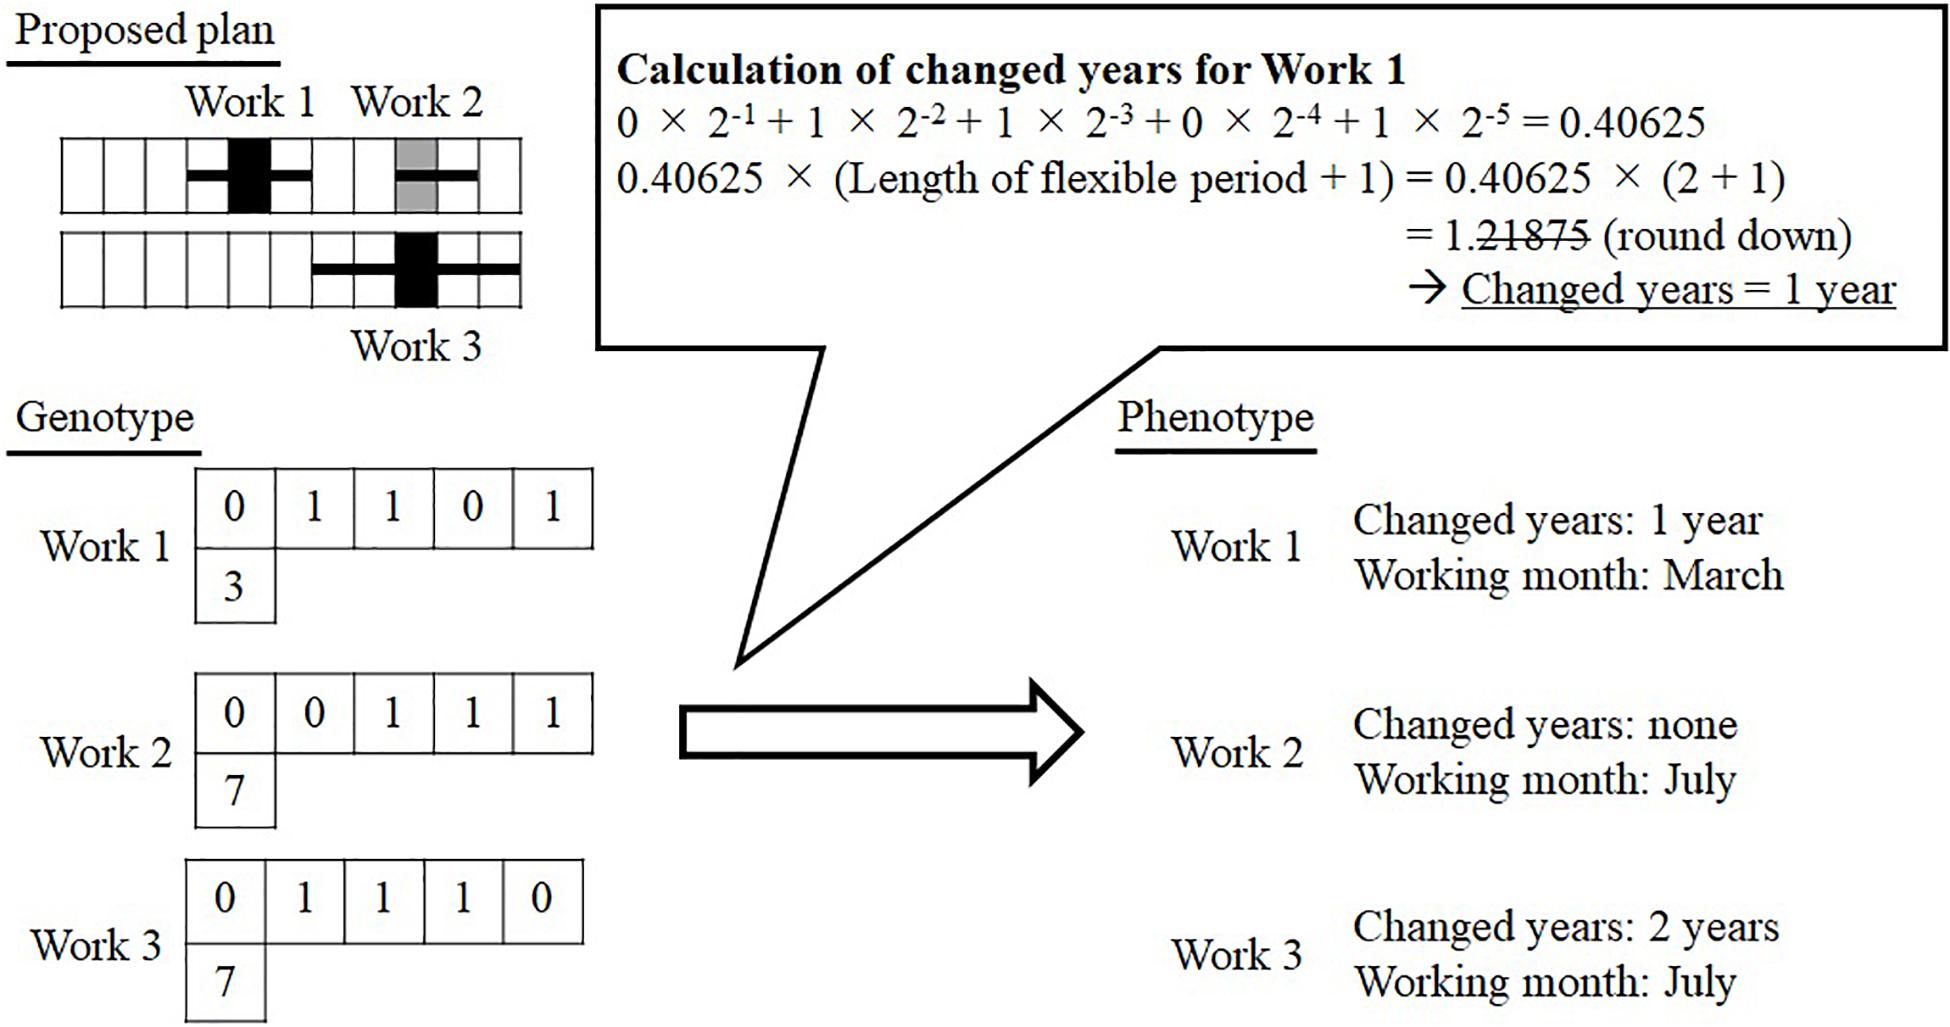
Figure 8. Coding rule for flexible periods.
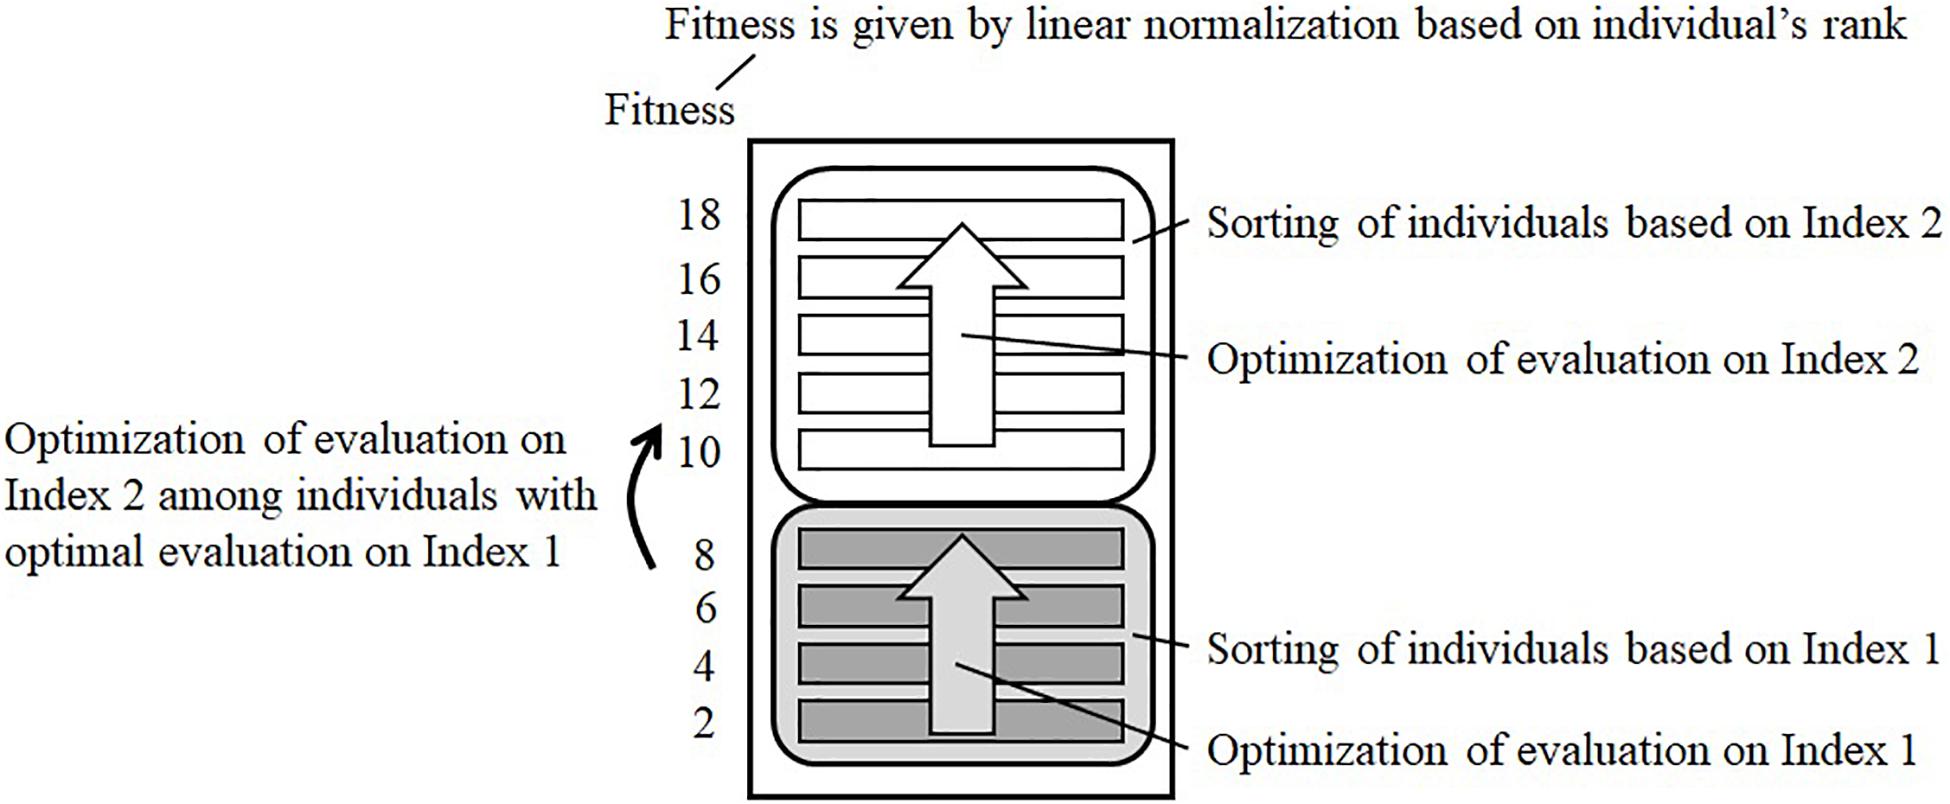
Figure 9. Determination of fitness.
Numerical Examples
To verify the usefulness of the proposed indices, some numerical examples are evaluated. First, a preventive maintenance plan with minimized cost is developed using the GA. Next, the user cost and indices of resilience are optimized in flexible periods contained in the preventive maintenance plan. Second-stage optimization is also performed using the GA; here, the relationship between user cost and indices of resilience is investigated by applying several patterns with rules that determine an individual’s fitness.
Minimization of Maintenance Cost
A plan with minimized direct construction cost is developed using the following procedure:
Step 1. Minimize the cost per bridge (the smallest value among three trials is adopted)
Step 2. Maximize the safety performance of each component and the length of flexible periods under the constraint conditions of minimized cost.
In Step 2, the fitness of an individual is determined by following the rule shown in Figure 9. The first objective is set as minimizing the violation of cost from the constraint condition, the second objective is set as maximizing the safety performance, and the third objective is set as maximizing the length of flexible periods. In the parameter settings of the GA, the number of individuals, crossover rate, mutation rate, and number of iterations are set as 1,000, 60%, 0.5% per genetic array, and 1,000, respectively. The direct construction cost of the developed plan was obtained as 3,648,300 million Japanese yen. The number of works with flexible periods was 248 of 365. The mean length of the flexible periods was 5.279 years. Figure 10 shows a part of the developed plan; here, the horizontal and vertical axes respectively represent years and bridge components. The year in which a component has been worked on is colored according to the repair method. In addition, the horizontal line extending from a work represents its flexible period.
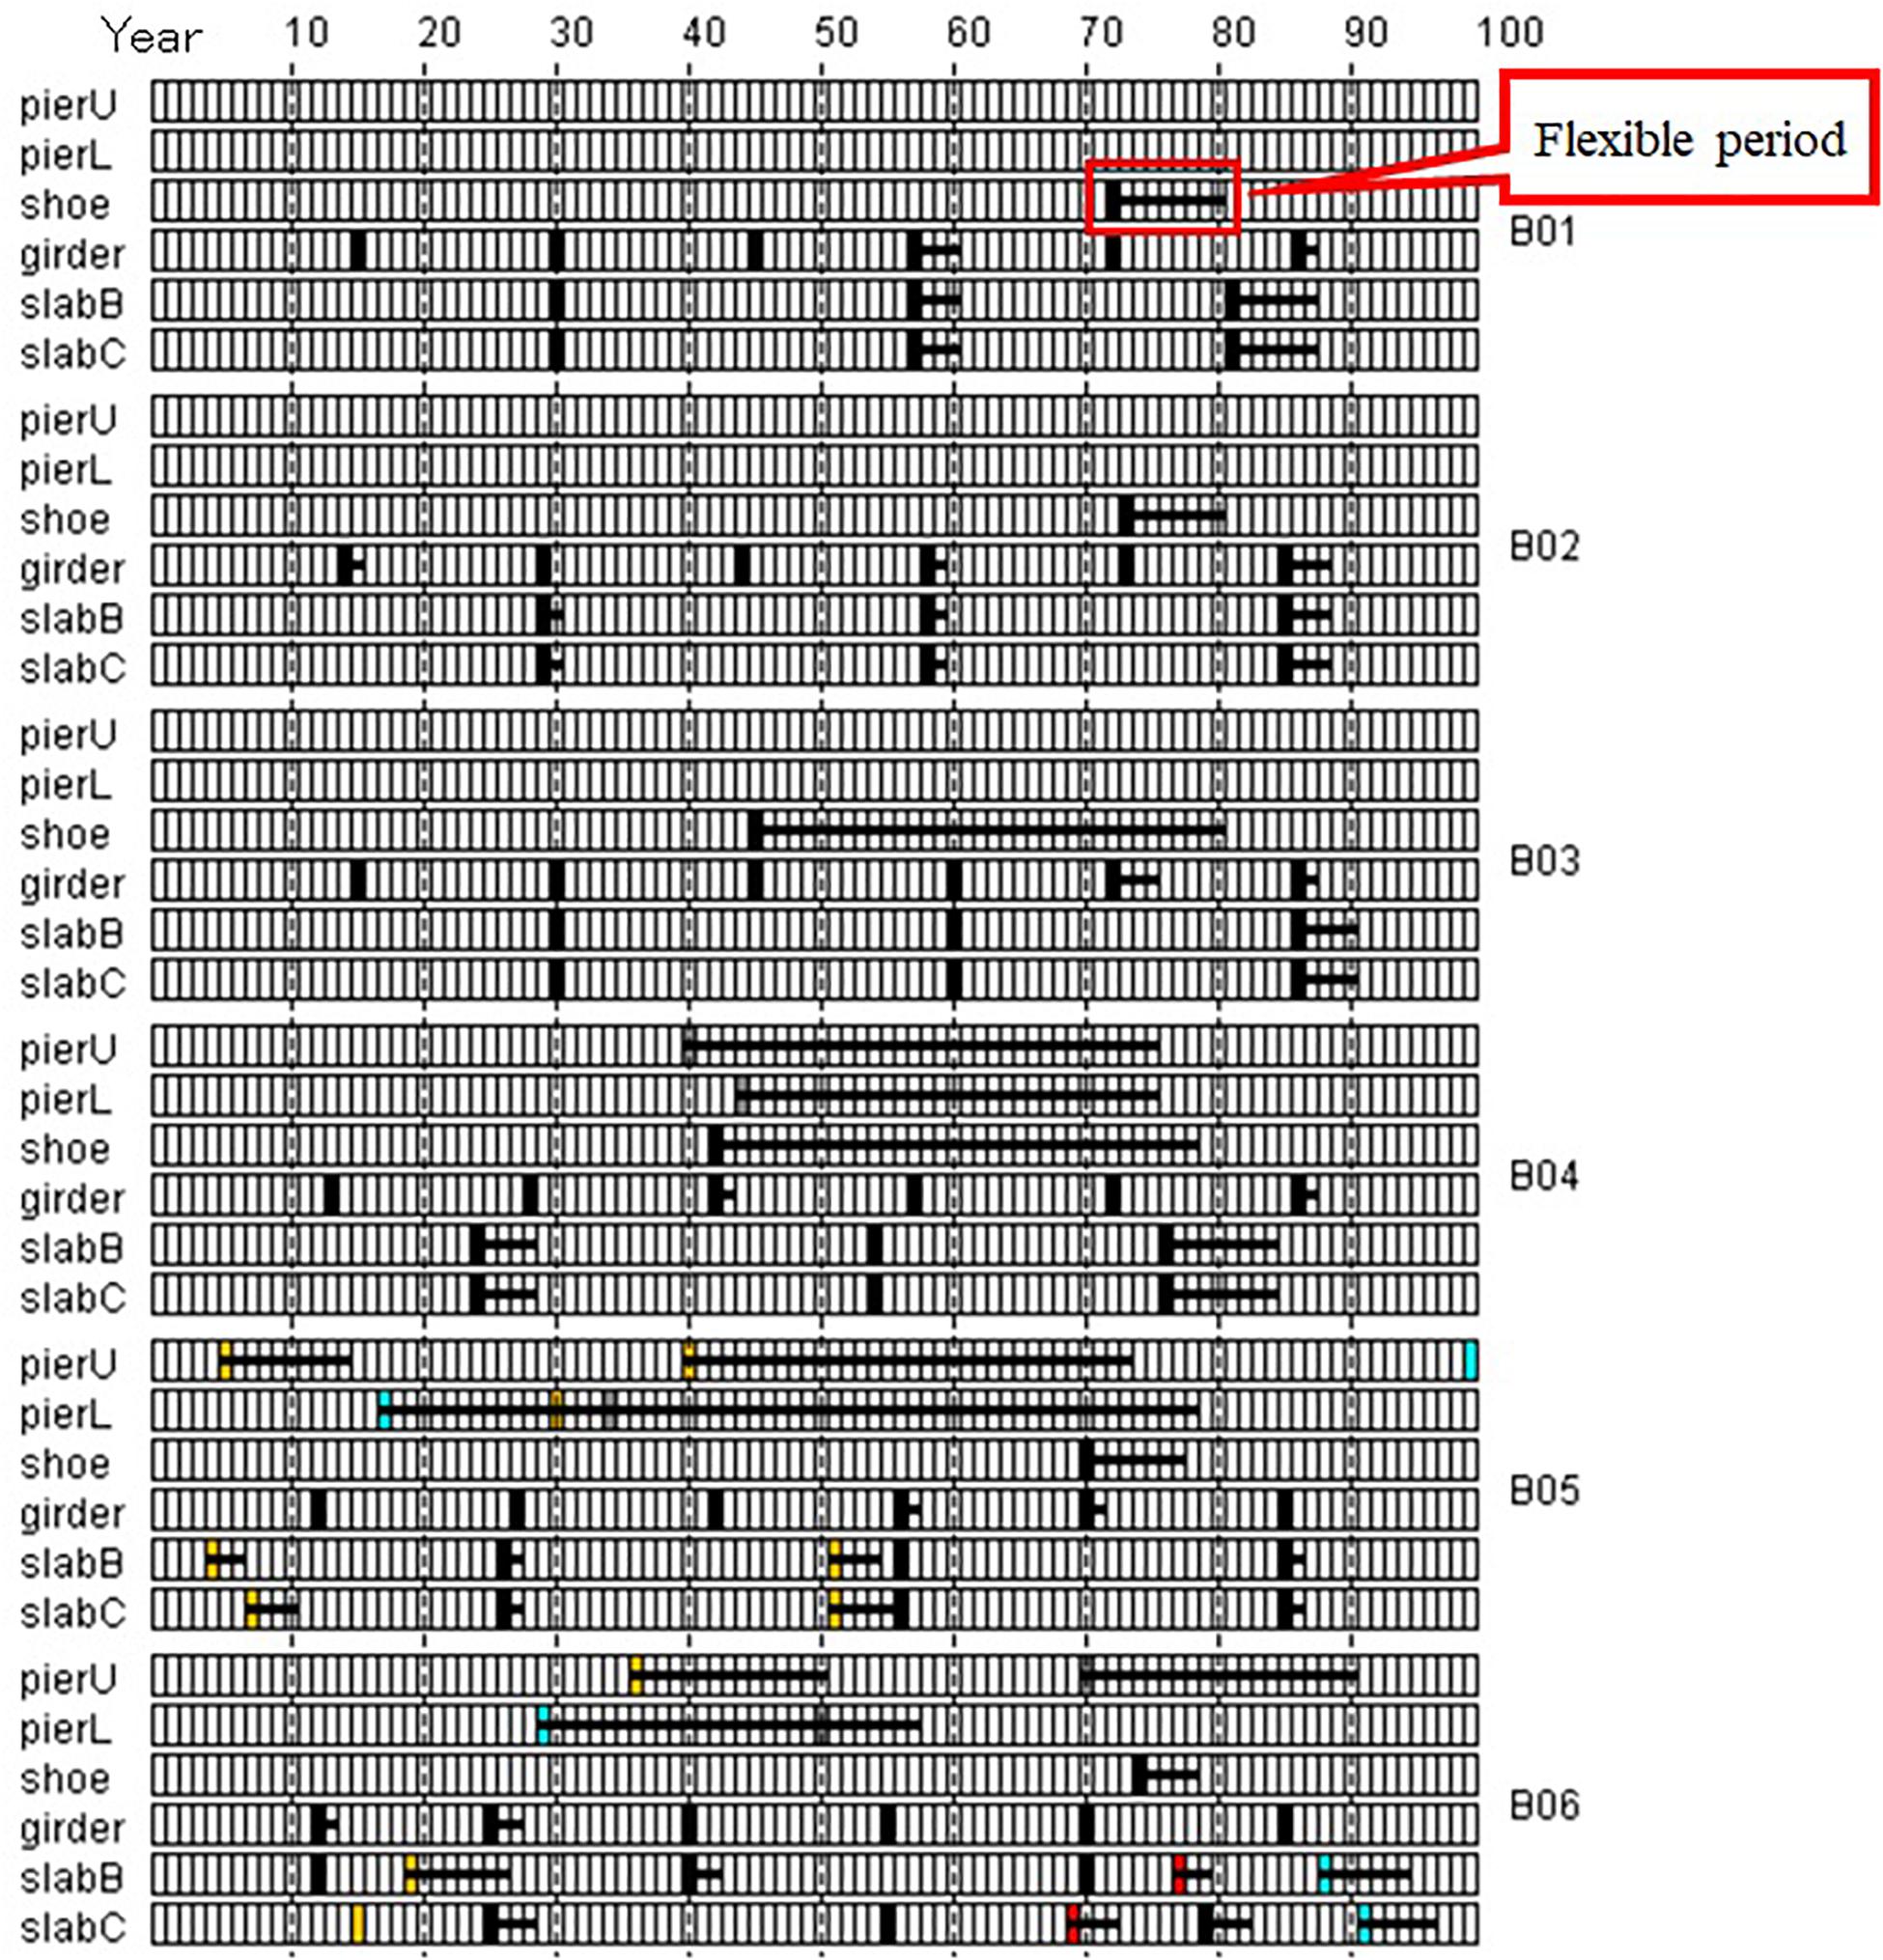
Figure 10. Part of schedule with minimized construction cost.
Optimization in Periods of Preventive Maintenance
This study attempts to optimize indices of resilience and user cost in flexible periods by using a developed preventive maintenance plan with a minimized cost. A GA was used for optimizing the plan. In the parameter settings of the GA, the number of individuals, crossover rate, mutation rate, and number of iterations are set as 1,000, 60%, 0.5% per genetic array, and 2,000, respectively. The patterns for deciding the fitness of individuals are set as follows:
Pattern 1: minimize only user cost
Pattern 2: maximize only robustness
Pattern 3: minimize only rapidity
Pattern 4: first, minimize user cost, and second, minimize rapidity
Pattern 5: first, minimize rapidity, and second, minimize user cost.
Table 2 shows the aggregate results of the best solution of three trials for each pattern. The underlined values are the best values of the indices obtained in the numerical examples. First, compared with pattern 1 (minimize only user cost), patterns 2 and 3 had better indices of resilience. However, the range of change in robustness was small. In addition, pattern 3 (minimize only rapidity) could also improve robustness. Next, in pattern 4, the ranks of fitness among individuals with equivalent user cost were determined by comparing their rapidity. However, in pattern 5, the ranks of fitness among individuals with equivalent rapidity were determined by using the user cost. Figure 11 shows a scatter plot of the average user cost and rapidity of each pattern. A comparison of the patterns showed that user cost and indices of resilience could partly improve an index by improving one another. However, the best values of the indices had a trade-off, as shown in Figure 11. In particular, optimization improved the user cost to a large extent. This is because both user cost and rapidity were improved by reducing the number of works per day. Here, because a small road network was considered in the numerical examples, these indices could indicate a common trend. Furthermore, indices of resilience were based on the reliability analysis of the road network. Therefore, indices of resilience are expected to be applied when re-examining the importance of bridges and their safety level by investigating paths that strongly impact emergency recovery. For example, by giving high priority to a bridge that affects the working probability of a network and the average moving distance, as shown in Table 1, the resilience of the road network in the medium- and long-term is expected to improve.
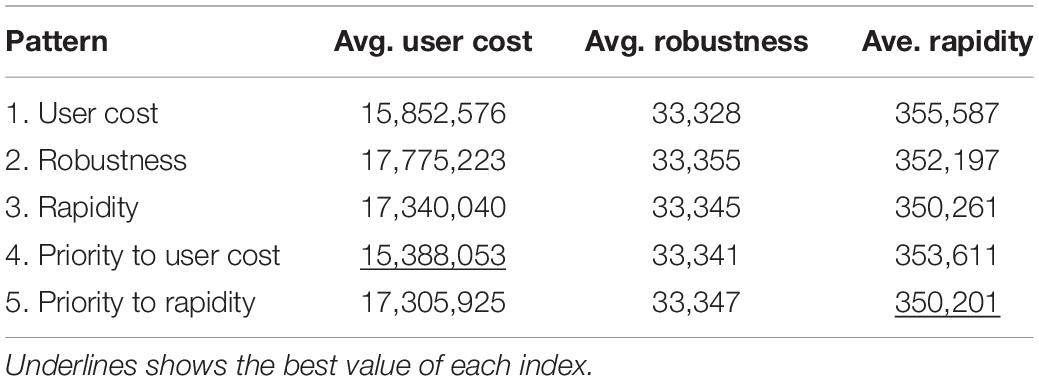
Table 2. Comparison of each pattern.
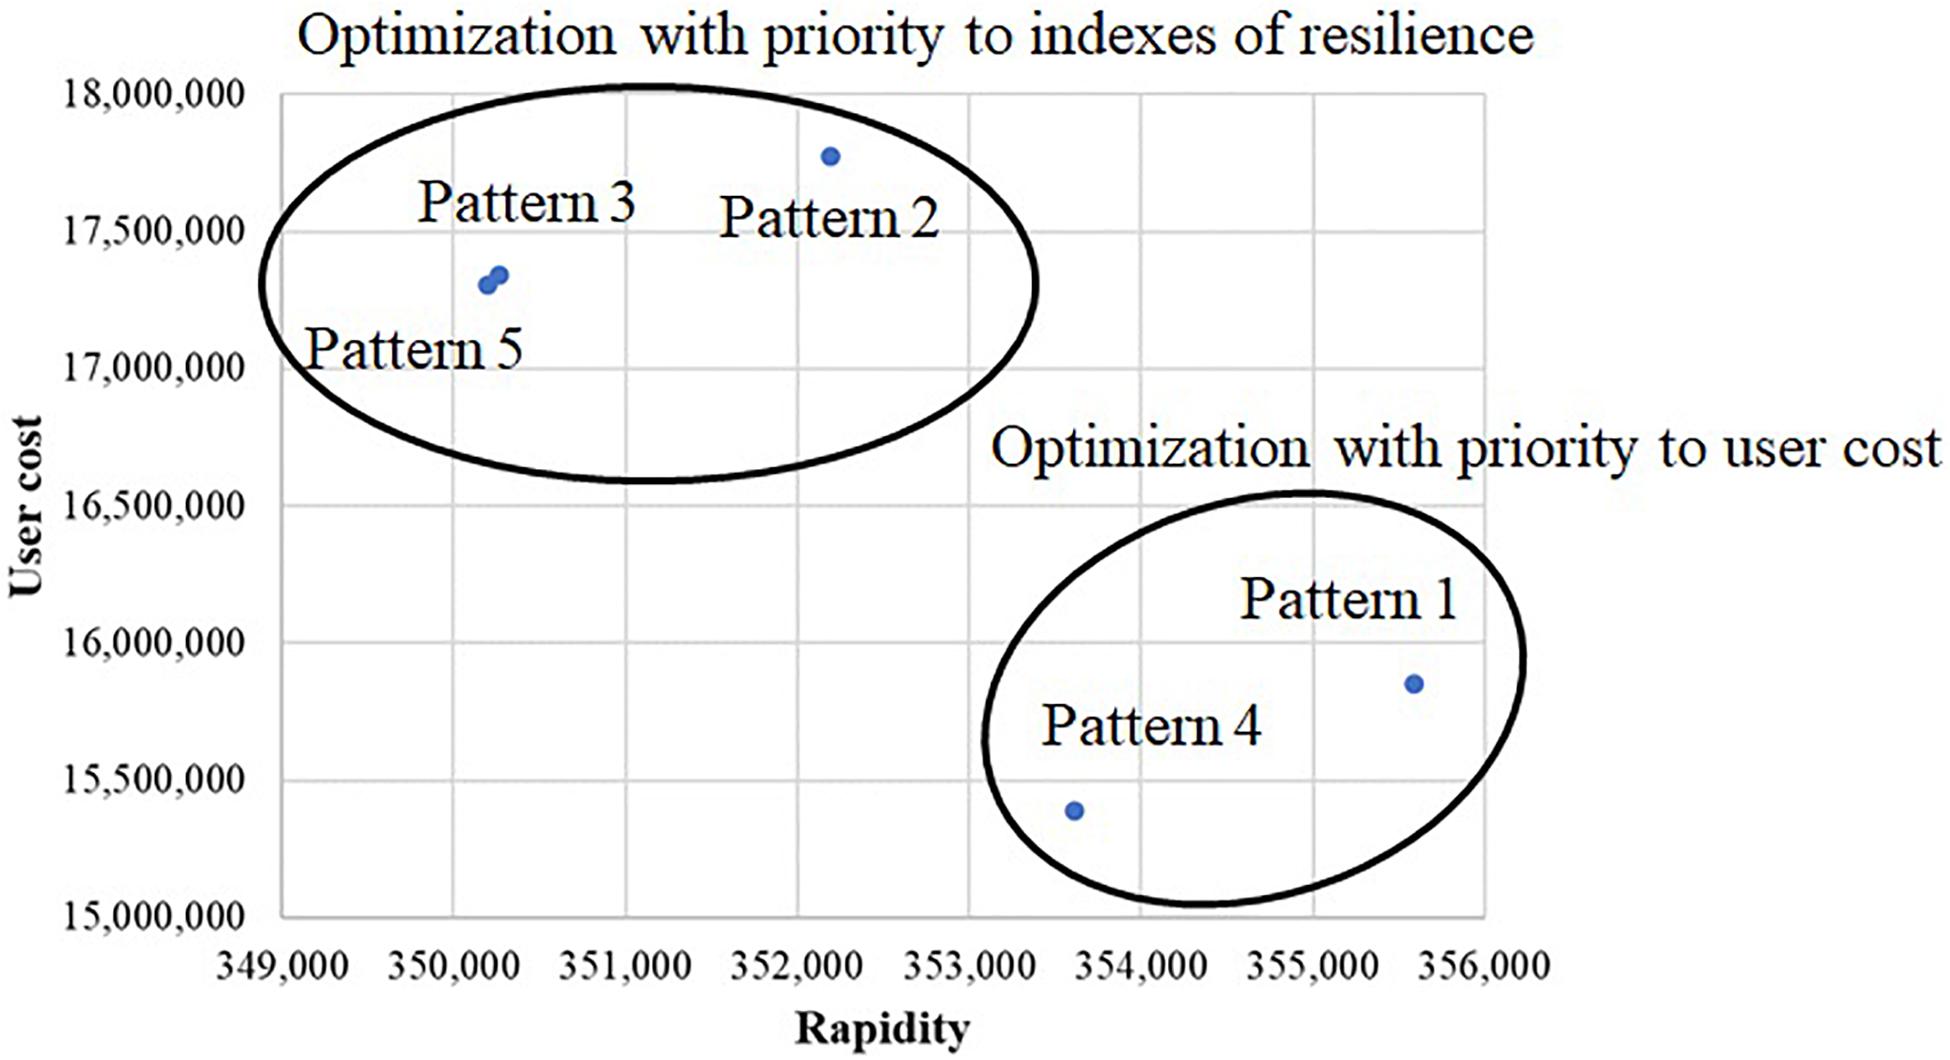
Figure 11. Relationship between rapidity and user cost.
Conclusion
This study proposed indices to measure the resilience against natural disasters in bridge management scheduling. The proposed indices are defined based on the working probability of a network and variation of moving distance based on the reliability analysis of road networks after seismic disasters. As indices of resilience, the robustness was defined based on the working probability and the rapidity was defined based on the moving distance. By optimizing the user cost and these indices of resilience using a GA, bridge management plans were developed for a road network consisting of 20 bridges. The results indicated that the user cost and indices of resilience had common features. Both indices were improved by reducing the number of works per day. However, the best values of the indices had a trade-off. Therefore, this study indicated that the proposed indices could improve the resilience of a road network in the medium- and long-term future.
The development of medium- and long-term plans in consideration of resilience is a new approach. This study examined indices of resilience in flexible periods derived from preventive maintenance. However, a schedule optimized for resilience against natural disasters has yet to be clarified. Specifically, the relationship between direct construction costs and indices of resilience remains unclear. This is because an index applicable for scheduling an annual maintenance plan has not yet been defined. The proposed indices were applicable for scheduling and implementing the year and month of works in flexible periods. However, the optimization of these indices requires enormous computation time in scheduling an annual plan. Therefore, future studies must develop a new index applicable for scheduling annual plans and improve the computational efficiency.
Data Availability Statement
The raw data supporting the conclusions of this article will be made available by the authors, without undue reservation.
Author Contributions
KI mainly contributed to the proposal of an index based on reliability analysis (see sections “Introduction,” “Resilience Against Natural Disaster,” “Evaluation of Resilience for Bridge Network,” “Numerical Examples,” and “Conclusion”). KN mainly contributed to the application of the GA (see section “Scheduling a Maintenance Plan Using Genetic Algorithm”). HF mainly contributed to a survey of literature on bridge management and examining the bridge network model (see sections “Sustainable Bridge Management” and “Problem”). All authors contributed to the article and approved the submitted version.
Conflict of Interest
The authors declare that the research was conducted in the absence of any commercial or financial relationships that could be construed as a potential conflict of interest.
Acknowledgments
This work was supported by The Research Institute for Socionetwork Strategies, Kansai University.
References
Bai, Q., Labi, S., Sinha, K. C., and Thompson, P. D. (2013). Bridge user cost estimation – a synthesis of existing methods and addressing the issues of multiple counting, workzones and traffic capacity limitation. Struct. Infrastruct. Eng. 9, 849–859. doi: 10.1080/15732479.2011.627348
Birkmann, J. (2006). Measurement Vulnerability to Natural Hazards: Towards Disaster Resilient Societies. Tokyo: United Nations University Press.
Bruneau, M., Chang, S. E., Eguchi, R. T., Lee, G. C., O’Rourke, T. D., Reinhorn, A. M., et al. (2003). A framework to quantitatively assess and enhance the seismic resilience of communities. Earthq. Spect. 19, 733–752. doi: 10.1193/1.1623497
Bukhsh, Z. A., Stipanovic, I., and Doree, G. (2020). Muti-year maintenance planning framework using multi-attribute utility theory and genetic algorithms. Euro. Transp. Res. Rev. 12:3. doi: 10.1186/s12544-019-0388-y
Doebling, S. W., Farrar, C. R., and Prime, M. B. (1998). A summary review of vibration-based damage identification methods. Shock Vibr. Digest 30, 91–105. doi: 10.1177/058310249803000201
Frangopol, D. M., Kong, J. S., and Gharaibeh, E. S. (2001). Reliability-based life-cycle management of highway bridges. J. Comput. Civil Eng. 15, 27–34. doi: 10.1061/(asce)0887-3801(2001)15:1(27)
Furuta, H., Kameda, T., and Nakahara, K. (2006a). Practical use of bridge management system by improved genetic algorithm. J. Jpn. Soc. Civil Eng. 62, 656–668. doi: 10.2208/jsceja.62.656
Furuta, H., Kameda, T., Nakahara, K., Takahashi, Y., and Frangopol, D. M. (2006b). Optimal bridge maintenance planning using improved multi-objective genetic algorithm. Struct. Infrastruct. Eng. 2, 33–41. doi: 10.1080/15732470500031040
Furuta, H., Nakatsu, K., Takahashi, K., Ishibashi, K., and Kagawa, Y. (2014). Evaluation of earthquake preparedness by analysing the reliability of road network in consideration of regional resilience. J. Jpn. Soc. Civil Eng. Ser. 70, I-73–I-80. doi: 10.2208/jscejsp.70.I_73
Furuta, H., Takahashi, K., Nakatsu, K., Ishibashi, K., and Aira, M. (2013). “Robust maintenance planning with flexible periods against uncertainty of deterioration prediction. Safety, reliability, risk and life-cycle performance of structures and infrastructures,” in Proceedings of the 11th International Conference on Structural Safety and Reliability, ICOSSAR 2013, New York, NY.
Furuta, H., Yasuda, K., Kawatani, M., and Takebayashi, M. (2010). Infrastructure Asset Management. Tokyo: Morikita Publishing.
Goldberg, D. E. (1989). Genetic Algorithm in Search, Optimization and Machine Learning. Boston, MA: Addison-Wesley.
Holling, C. (1973). Resilience and stability of ecological systems. Annu. Rev. Ecol. Syst. 13, 1–23. doi: 10.1007/978-3-030-54560-4_1
Ishibashi, K., Nakatsu, K., Furuta, H., Nomura, Y., and Takahashi, K. (2013). Optimization of long-term plan for a large number of bridges by using genetic algorithm. J. Jpn. Soc. Civil Eng. Ser. A2 69, I-731–I-740. doi: 10.2208/jscejam.69.I_731
Ministry of Land, Infrastructure, and Transportation [MLIT] (2001). Cost Estimation Standards for Civil Constructions. Kasumigaseki: MLIT.
Nakatsu, K., Furuta, H., Nomura, Y., Takahashi, K., and Ishibashi, K. (2011). Practical application of long-term bridge management system using genetic algorithm. J. Jpn. Soc. Fuzzy Theory Intellig. Inform. 23, 469–479. doi: 10.3156/jsoft.23.469
Norris, F. H., Stevens, S. P., Pfefferbaum, B., Wyche, K. F., and Pfeffrbaum, R. L. (2008). Community resilience as a metaphor, theory set of capacities and strategy for disaster readiness. Am. J. Commun. Psycol. 41, 127–150. doi: 10.1007/s10464-007-9156-6
Shinha, K. C., Labi, S. A., McCullouch, B. G., Bhargava, A., and Bai, Q. (2009). Updating and Enhancing the Indiana Bridge Management System (IBMS). Joint Transportation Research Program, Report FHWA/IN/JTRP-2008/30. West Lafayette: Purdue University Press. doi: 10.5703/1288284314306
Keywords: bridge management, maintenance plan, optimal scheduling, reliability analysis, resilience, genetic algorithm
Citation: Ishibashi K, Furuta H and Nakatsu K (2020) Bridge Maintenance Scheduling in Consideration of Resilience Against Natural Disasters. Front. Built Environ. 6:574467. doi: 10.3389/fbuil.2020.574467
Received: 19 June 2020; Accepted: 23 September 2020;
Published: 13 November 2020.
Edited by:
Luca Sgambi, Catholic University of Louvain, BelgiumReviewed by:
David De Leon, Universidad Autónoma del Estado de México, MexicoSamuel Labi, Purdue University, United States
Copyright © 2020 Ishibashi, Furuta and Nakatsu. This is an open-access article distributed under the terms of the Creative Commons Attribution License (CC BY). The use, distribution or reproduction in other forums is permitted, provided the original author(s) and the copyright owner(s) are credited and that the original publication in this journal is cited, in accordance with accepted academic practice. No use, distribution or reproduction is permitted which does not comply with these terms.
*Correspondence: Ken Ishibashi, a19pc2hpYmFzaGlAc2lzLnUtaHlvZ28uYWMuanA=