 Pramodit Adhikari
 Mohamed A. Abdelhafez
 Yue Dong
 Hussam N. Mahmoud
- Department of Civil and Environmental Engineering, Colorado State University, Collins, CO, United States
Coastal cities in the Southeast and Gulf Coast of the United States are at an increased risk of tropical cyclones (hurricanes) due to the combined effects of urbanization, rapid economic development, and climate change. Current building codes and standards focus on minimum performance criteria for individual buildings exposed to severe hazard events to ensure occupant safety. However, they do not consider the resilience of buildings and building portfolios, which are key factors in determining whether a community can respond to and recover from a severe natural hazard event. Light-frame wood residential buildings dominate the residential market in the US, represent a significant percentage of the investment in the built environment, and are especially vulnerable to hurricane winds and storm surge in coastal areas. Our study of the impact of various hurricane and climate change scenarios on the performance of coastal residential communities reveals that decision-making at the community level is needed to develop rational engineering and urban planning policies, to mitigate the impact of hurricane wind and storm surge, and to adapt to climate change. The results suggest that fundamental changes in the current building regulatory process may be necessary.
Introduction
Background
Over 625 million (nearly 10%) of the global population lives in low-lying coastal regions that are less than 10 m above sea level (Neumann et al., 2015). Thus, inundation from even moderate sea level rise will have a destructive economic and social impact on coastal communities, especially on their vulnerable populations. Sea level rise may drive millions further inland (Hauer et al., 2016), causing immense social disruptions. In the US, forty percent of the population currently lives and works within 100 km of the ocean shoreline, with population growth in coastal areas projected to rise by 50% by the end of the 21st Century (Melillo et al., 2014). Many of the nation’s commercial, industrial, and recreation facilities, military installations, and energy production facilities are located in coastal regions of the US. The economic contribution of these facilities to the US GDP was $7.9 trillion, or 46% of GDP in 2014 (NOAA, 2017). Moreover, present coastal flood defenses are at risk of damage or collapse from future sea level rise, indicating that design criteria for such protective structures should be revised to meet the high rates of sea level rise that have been forecast (Rajabalinejad and Demirbilek, 2013).
Population and economic growth along the Gulf Coast of the US and in Southeast Florida have exceeded the national average in the past three decades. Communities in these regions are vulnerable to tropical cyclones (hurricanes) and storm surge. Sea level rise may cause these hazards and their impacts on the social fabric to be intensified. Severe damage to residential buildings, which dominate the residential market in the US, may have catastrophic impacts on social and economic institutions within the community. In most areas of the US, 90% of single-family and low-density residential construction is light-frame wood construction (McKeever and Elling, 2015). Such construction is especially vulnerable to the impacts of tropical cyclones (Kijewski et al., 2018), as shown by its performance in recent major hurricanes1—Hurricane Andrew (1992), Hurricane Katrina (2005), Hurricane Ike (2008), Hurricane Matthew (2016), Hurricane Harvey (2017), Hurricane Irma (2017), and Hurricane Michael (2018), to name a few. Notwithstanding the changes in residential building construction in the past three decades (IRC, 2018; WFCM, 2018), losses to residential construction remain disproportionately high compared with other engineering building constructions. Assuming 2017 conditions for climate, sea levels, and development in areas at risk of hurricane winds or storm-related flooding, the expected annual losses due to hurricane winds and storm-related flood in the US total $54 billion (0.3% of the nation’s gross domestic product), of which $34 billion occurs in the residential sector (Congressional Budget Office, 2019).
Current building codes and standards in the US focus on minimum performance criteria of individual buildings exposed to severe hazard events to ensure occupant safety and functionality (e.g., ASCE 7–16; IRC, 2018). However, they do not consider the resilience of buildings and building portfolios, which are key factors in determining whether a community can respond to and recover from a severe natural hazard event. Many probabilistic loss assessment approaches that have been developed over the past two decades to forecast expected damage and losses to residential buildings due to hurricanes (e.g., Pinelli et al., 2004; Deierlein et al., 2020; Pinelli et al., 2020) have focused on wind-related damage to individual buildings under stationary conditions. Enhancements to community resilience will require well-thought-out strategies by policymakers, urban planners, and engineers, involving a mix of land use policies, incentives, improved building practices, and targeted public and private investments in the built environment, to address the intensification of multiple hazards associated with climate effects.
Objectives and Scope of the Article
In this study, we integrate recent research on hurricane wind field modeling with residential building hurricane fragilities and economic loss data to model the likely impact of various hurricane and sea level rise scenarios on the performance and resilience of residential coastal communities. Taking a broad view of the problem, we utilize a scenario (or conditional risk assessment) approach to analyze damage to residential building portfolios rather than a fully coupled risk analysis for the following reasons: first, many community planners feel more comfortable in basing their decision-making on scenario events because they can easily relate the consequences of such events to historical data and prior experiences; most, being risk-averse (Cha and Ellingwood, 2013), are content to develop policies addressed at mitigating that damage. Second, as a risk communication strategy, a scenario analysis may better convey to a community the consequences of future hazard events (Ellingwood et al., 2016). Finally, the scenario approach is consistent with the approach taken by the NIST Community Resilience Planning Guide (NIST, 2016), which does not advocate the use of a full distribution analysis in community resilience planning.
We begin by establishing a digital elevation model (DEM) coupled with sea level rise, wind data, and hurricane track for the region of interest. We simulate wind and storm surge impacts on a coastal community and utilize previously developed fragilities (e.g., Adhikari et al., 2020) to predict damage to residential construction. We project economic losses under increasing hazard intensities out to 2100 under various climate scenarios to identify possible practices for achieving resilient buildings and communities and further assess the economic impact of different mitigation alternatives. We show that a decision at the community level is needed to develop rational engineering and planning policies to mitigate hurricane risk and to adapt to climate change, suggesting that fundamental changes in the current building regulatory process might be required.
Natural Hazards Impacting Coastal Communities
In this section, we summarize the impact of hurricane winds, sea level rise, and storm surge/wave action in a changing climate on coastal communities. We consider the impact of these hazard events on a coastal community located near Mobile, AL, beginning with a projection of hurricane intensities, frequencies, and tracks under climate change, followed by a discussion of climate effects on sea level rise and storm surge. Climate change effects typically are evaluated based on emission scenarios associated with representative concentration pathways (RCPs) adopted in the Intergovernmental Panel on Climate Change (IPCC)’s Fifth Assessment Report (AR5) (IPCC, 2014)—RCPs 8.5, 6.0, 4.5, and 2.6—which identify radiative forcing2 values in the year 2100 (2.6, 4.5, 6, and 8.5 W/m2, respectively) (Moss et al., 2010). RCP 2.6 represents the lowest emission and is based on the assumption that CO2 emissions begin declining almost immediately and are reduced to zero by 2100, to comply with the Paris Agreement’s primary objective of the United Nations Framework Convention on Climate Change, i.e., lowering means global warming to below 2°C by 2100. In contrast, RCP 8.5 assumes that no action is taken to prevent additional emissions of CO2 (van Vuuren et al., 2011), resulting in mean global warming of around 4.8°C by 2100. RCP 4.5 is an intermediate case, based on the assumption that climate policies to achieve the goal of limiting emissions, concentrations, and radiative forcing, leading to mean global warming around 2.6°C by 2100 are invoked (IPCC, 2014). In the following, the climate change effects will be discussed based on scenarios RCP 4.5 and RCP 8.5 to show the impact of moderate vs. conservative climate assumptions.
Projection of Hurricanes Under Climate Change
The change of hurricane frequency/intensity under climate change not only may increase the hurricane wind risk but also might increase the risk of hurricane-induced storm surge (Lin et al., 2012). A comprehensive review of eleven studies by Knutson et al. (2019) considered a number of recent studies of projected changes in future hurricane activities. For comparison, they rescaled the projections under different climate change scenarios to represent the projections for a 2°C global mean surface air temperature increase occurring during the late twenty-first century under the RCP 4.5 scenario. The projected changes in hurricane activity in the local area of interest in this study (within 300 km of Mobile City) are considered to be the same as those for the Atlantic basin.
Hurricane Intensity (Maximum Wind Speed Over Hurricane Duration)
Ten of the eleven authors in the above-cited review by Knutson et al. (2019) had at least medium-to-high confidence3 that the global average hurricane intensity of all categories will increase. The histograms of projected changes in average hurricane intensity are summarized in Figure 1, which depicts global changes and changes in the Atlantic basin, respectively. The median of the average hurricane intensity change in the Atlantic basin is +5%. Hence, the local (within 300 km of Mobile) projected change in the maximum wind speed is assumed to be a 5% increase in this study.
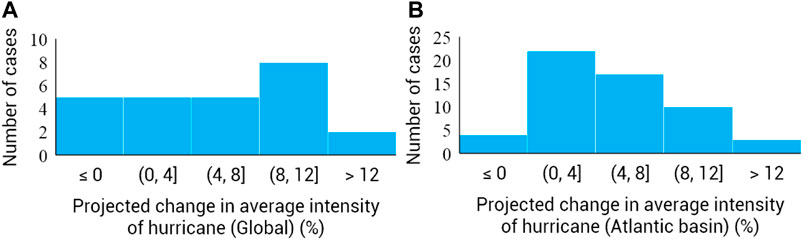
FIGURE 1. Histograms of projected changes of average hurricane intensity in different studies (Knutson et al., 2019): (A) global; (B) Atlantic basin.
The evaluation of the intensified joint hazards of hurricane and storm surge due to climate change and their impact on community resilience, which is the objective of this study, requires not only the projected hurricane intensity (i.e., maximum wind speed) but also the projections of the radius of maximum wind (RMW) and central pressure, which are needed to simulate the entire hurricane wind field. Once the projected change in the maximum wind speed is determined, the projected central pressure and RMW can be derived subsequently. Specifically, central pressure can be projected from the wind-pressure relationship (WPR) proposed by Knaff and Zehr (2007). Their model can be simplified as a quadratic polynomial, P = aV2 + bV + c, where the coefficients (a, b, and c) are determined by the storm motion, latitude, and size of the hurricane. However, some parameters, such as the size of the hurricane, are not readily available. In other quadratic polynomial WPRs (Dvorak, 1975; Wooten, 2011; Kossin, 2015), the coefficients (a, b, and c) were treated as constants and determined based on historical North Atlantic hurricane data. The constants found in these three studies (Dvorak, 1975; Wooten, 2011; Kossin, 2015) are very similar, with a, b, and c being about −0.0025, −0.36, and 1,021.36, respectively. Knutson et al. (2015) proposed a projection of WPR in the late twenty-first century under the RCP 4.5 scenario, in which a 2°C global temperature increase occurs. Their projected WPR was obtained by fitting the projected hurricane data of several basins with a quadratic polynomial, with a = −0.0029, b = −0.35, and c = 1,013.3. The coefficients of the projected WPR and historical WPR are similar. Furthermore, the historical WPR is regional, while the projected WPR is global. Hence, the historical WPR, modeled as a quadratic polynomial with coefficients −0.0025, −0.36, and 1,021.36, will be used to simulate the joint hurricane wind and storm surge hazard in Community Damage Assessment Under Scenario Events. After obtaining the projected central pressure, the RMW is estimated using the statistical model proposed by Vickery and Wadhera (2008), which is developed based on the flight-level and H*Wind data in the Atlantic basin between 1900 and 1985:
where
Frequency of Category 3–5 Hurricanes
Eight of the eleven authors in the review by Knutson et al. (2019) had at least medium-to-high confidence that the frequency for high-intensity hurricanes (Category 4–5) will increase with the 2°C global warming, and three of them rated it as high confidence. Among these studies, the median of the projected frequency change for the Atlantic basin is +33%. The number of strong hurricanes (Categories 3–5 during their lifetime) that impacted Mobile (within 300 km) between 1851 and 2018 is 28, or approximately 19.6 hurricanes per century. Due to the lack of studies about the projected change of Category 3 hurricanes, the local projected increase in frequency for Category 3–5 hurricanes is also assumed to be 33%. Accordingly, the projected frequency of strong hurricanes that will strike Mobile is 26 per one hundred years with 2°C global warming (i.e., late twenty-first century under the RCP 4.5 scenario).
Hurricane Track
There is a considerable difference in opinion in the studies reviewed by Knutson et al. (2019) on hurricane tracks under climate change. Those projections of hurricane track were usually conducted at the basin level and it is difficult to downscale those studies to a local area. Hence, the hurricane track is simulated based on the historical tracks in the local area using a data-driven hurricane simulation method (e.g., Guo and van de Lindt, 2019), which requires a user to provide the landfall location and heading angle to initiate the simulation. Plausible landfall locations and heading angles in this study, shown in Figure 2, are analyzed based on the historical tracks of intense hurricanes (Categories 3–5) within 300 km of Mobile between 1851 and 2018. The coastline in this region is divided into four areas (A1–A4 in Figure 2). The variation of proportions of hurricanes in each area (A1–A4) does not exhibit an obvious trend over the historical period considered, implying that one may assume that potential landfall locations are uniformly distributed along the coastline. The heading angle at landfall is defined as a counterclockwise angle from the east direction and estimated using Eq. 2,
where
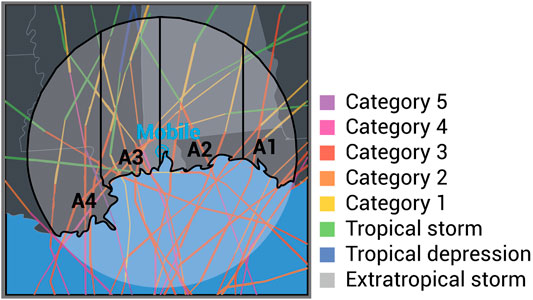
FIGURE 2. Historical hurricane tracks of Category 3-5 hurricanes (1851–2019): data from NOAA (2020).
Climate Effects on Sea Level Rise and Storm Surge
Storm surge is a phenomenon in which water rises beyond what would be expected by the normal water body movement related to astronomical tides. It is generated as a result of atmospheric pressure changes and wind associated with a storm, with a period varying from a few minutes up to a few days (Webb, 2017). Storm surge often is the source of most of the damage from tropical cyclones (Baradaranshoraka et al., 2017). The characteristics of storm surge depend on the characteristics of a tropical storm, such as storm intensity (i.e., maximum lifetime wind speed), central pressure, translational speed, approaching angle, landfall location, and size (NHC, 2020), among which the central pressure and wind are the most dominant contributing factors. Every 1 hPa decrease in the air pressure causes an elevation in water level of approximately 1 cm (McInnes et al., 2002), while the wind determined the magnitude of shear force pushing the water inland from the ocean and has an even larger impact on the storm surge intensity than air pressure.
Storm surge is also greatly influenced by sea level rise, which may cause a future storm to generate higher surges and further flooding. Sea level rise is typically predicted based on the RCPs adopted by the IPCC. The likely range (over 66% probability) of global mean sea level rise by the end of the century is 0.26–0.55 m for RCP 2.6 scenario and 0.52–0.98 m for the RCP 8.5 scenario (IPCC, 2014). Many agencies have presented future anticipated sea level rise in various locations of the US. For example, the U.S. Army Corps of Engineers (USACE) provides a sea level change calculator tool to help engineers and planners apply three USACE possible forecasts of sea level rise (low, intermediate, and high) in future coastal engineering projects at any of 142 coastal tide stations in the U.S. (USACE, 2013). The National Oceanographic and Atmospheric Administration (NOAA, 2013) presented six possible projections of sea level rise: 30, 50, 100, 150, 200, and 250 cm denoted as Low, Intermediate-Low, Intermediate, Intermediate-High, High, and Extreme, respectively (Sweet et al., 2017), for most coastal locations in the US at 10-year intervals up to 2100. Figure 3 shows the differences in the NOAA and USACE projections of global mean sea level rise. Three studies have found that the peak of storm surge increases nonlinearly with sea level rise (Smith et al., 2010; Bilskie et al., 2016; Yin et al., 2017), while a fourth study showed that the relationship was linear (Yang et al., 2015).
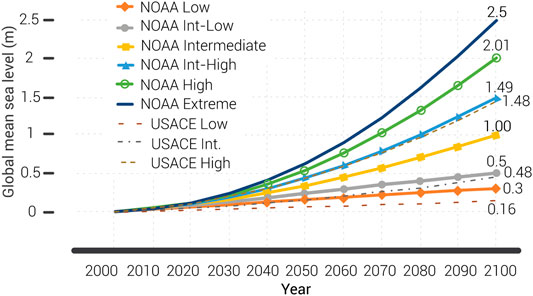
FIGURE 3. Comparison between NOAA and USACE projections for SLR up to the year 2100 extracted from the tool developed by USACE.
Based on the projected changes of tropical storm characteristics discussed in Projection of Hurricanes under Climate Change and in sea level rise using the tool developed by USACE, the potential change of storm surge due to a changing future tropical storm and sea level rise will be evaluated on a scenario basis in Community Damage Assessment Under Scenario Events. There is great uncertainty in the projected future tropical cyclone behaviors, as discussed in Projection of Hurricanes under Climate Change, while the future sea level rise has been predicted with high confidence. Thus, even assuming no future changes in tropical cyclone characteristics, storm surge is expected to intensify due to sea level rise (Knutson, et al., 2010).
Archetype Coastal Residential Community
We consider a small coastal residential community located on the west side of Mobile Bay, just south of the City of Mobile, AL. Mobile County has a population of approximately 400,000 inhabitants, approximately 75% of whom live in Mobile City. The Port of Mobile, which was founded as a deep water port on the Mobile River, is a major employer in the County, along with shipbuilding and steel, aviation, higher education, and chemical and healthcare (Mobile Area Chamber of Commerce, 2016).
Description of Community
Figure 4 illustrates a portion of the residential community considered, which is 1.3 km by 0.8 km (0.8 miles × 0.5 miles) in area and includes 965 residential buildings and approximately 2,500 inhabitants. The open-source collaborative project, OpenStreetMap (OSM), was used as a tool to obtain its geodata. We chose to analyze only a portion of the community in this initial study because considering possible hazard mitigation strategies for a larger community that extends further inland may require various actions (e.g., relocating public infrastructure) that are outside its scope. Even a community of this size is a complex system with buildings, residential and commercial, as well as civil infrastructure systems consisting of transportation and lifeline networks (electric power, natural gas, and water/wastewater systems). Only residential buildings are considered in this study because large-scale damage from a hurricane (including wind and storm surge/wave action) accompanied by sea level rise in the presence of a changing climate will lead to massive outmigration of residents with an accompanying severe impact on the local economy and social services. We assume that all buildings in the community are constructed as slab-on-grade, an assumption confirmed with Google Earth for residential buildings in near-shore regions of Mobile, AL.
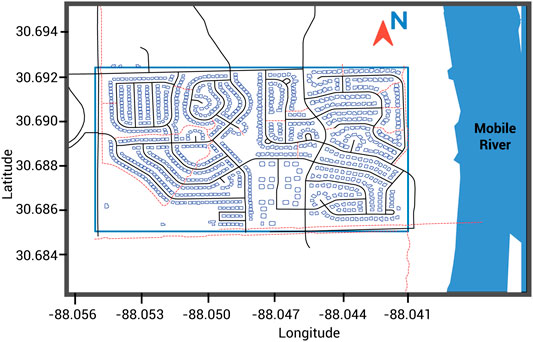
FIGURE 4. Portion of the community considered in the resilience assessment.
Building Fragility Models for Structural Performance, Damage, and Loss Assessment
Fragilities are common tools for assessing damage to buildings and other civil infrastructures. A fragility is defined as the conditional probability of reaching a performance limit state, LS, as a function of an intensity measure, D, appropriately defined for the hazard and the structure, system, or component (SSC) involved and the needs of the performance assessment (Kennedy and Ravindra, 1984; Ellingwood, 1990; Singhal and Kiremidjian, 1996; Shinozuka et al., 2000; Porter, 2015). In the past three decades, fragility analysis has evolved from a tool used for probabilistic risk assessment (PRA) of complex industrial systems exposed to low-probability, high-consequence events to one for describing uncertainties in the performance of common buildings and other physical infrastructure systems.
A building fragility depicts the uncertainty in the performance of a building system as a function of a deterministic variable (or variables), often termed the interface or control variable, that defines the intensity of the hazard. Using the definition in the preceding paragraph, fragility is defined as follows:
where LS is the specified limit state for the component (described subsequently) and y is the control variable, i.e., the value of IM defining the hazard intensity. For extreme winds, the intensity measure in the US is the 3-second gust wind speed, while for storm surge and coastal inundation from sea level rise, the measure is water depth (coupled with water velocity, depending on circumstances).
The most common method of describing the fragility of an engineered SSC is with a two-parameter lognormal distribution (Ellingwood, 1990; Porter, 2015):
in which
Fragilities for Hurricane Wind Damage
Wind pressures acting on low-rise buildings are (ASCE, 2016),
in which the velocity pressure at the mean roof height, h, (in m) is
and V is 3-second gust wind speed; Kz is wind profile coefficient; Kd is directionality coefficient; and GCp and GCpi are aerodynamic coefficients for exterior and interior building surfaces, respectively, all of which are random variables. Since damaging hurricane wind effects usually cause uplift or suction on building surfaces, W generally acts in a direction opposite to
Fragilities of structural components and systems and expected damage are developed using building component failures—roof sheathing (including shingles and panels), roof-to-wall connections, and wall-foundation connections—as suggested by Pinelli et al. (2004) and as defined in (Adhikari et al., 2020). Equations 5, 6 capture the physics of wind effects on buildings correctly. In the reliability analyses that follow, they are used to determine the wind pressures, with aerodynamic coefficients applicable to hurricane-prone regions, but the variables in those equations are random variables rather than the nominal values in ASCE Standard 7-16 that are used for design.
The building is assumed to be a series system; i.e., vertical load path from roof to foundation is assumed to be in a series—panels to roof-to-wall connection to wall-to-foundation connection (Standohar-Alfano et al., 2017). Monte Carlo simulation is used to calculate the failure probabilities for each component along the vertical load path and an event tree is utilized to illustrate possible outcomes from the limit state analysis. In-depth fragility analysis of roof and wall performance in hurricanes is carried out assuming structure is intact while the failure is initiated at the connection being investigated. For developing the system-level fragilities, only failure of components along the load path is considered. In a series system, failure of any component is tantamount to failure of the system. Survival of all the components is used to calculate the system survival probability. This gives the system failure probabilities as in Eq. 8:
where Pf is the probability of failure and Ps is the probability of survival of the system. The probability that all the components survive is P(A∩B∩C), where A, B, and C can be considered survival of roof sheathing, roof-to-wall, and wall-to-foundation connections, respectively. Therefore, the probability of survival is as follows:
The system fragility, determined as FV(v) = 1 – Ps, is calculated using Eq. 9, as shown in Figure 5. The fragilities are developed for construction practices that represent pre- and post-Hurricane Andrew construction4; many of the changes made around that time, including changes to nailing patterns attaching roof panels to roof trusses and eliminating toenailing roof trusses to upper sill plates in favor of hurricane straps, were in response to excessive roof damage. They are similar, in order of magnitude, to damage state probabilities reported for minimum and enhanced construction practices by Li and Ellingwood (2009).
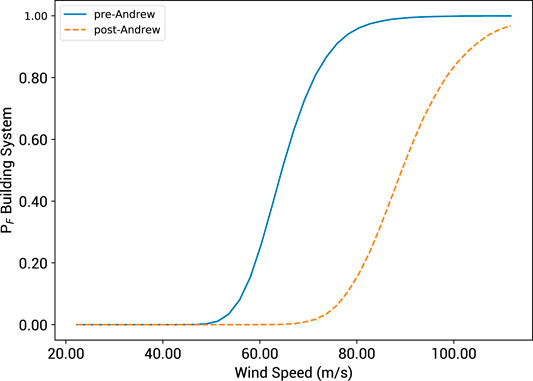
FIGURE 5. Fragility of residential buildings, wind pressures.
Fragilities for Storm Surge/Wave Action and Coastal Flooding
The fragilities for residential buildings were developed using a regression-based formulation previously developed by Tomiczek et al. (2014) and Tomiczek et al. (2017), which includes wave height, freeboard, age of building, and velocity of waves. This method was selected because it offers the ability to rapidly construct fragility functions for a large ensemble of buildings with different geometrical configurations and different storm surge levels without relying on computational fluid dynamics.
where PF is the probability of failure of the structure; HS is the significant wave height; FBHS is the freeboard = ds + 0.7*HS; ds is the surge depth; Vw is the maximum velocity of the wave for a given event. Surge fragilities are a function of the wave height and surge depth and are event-dependent. Figures 6, 7 show example fragilities for pre- and post-Andrew construction.
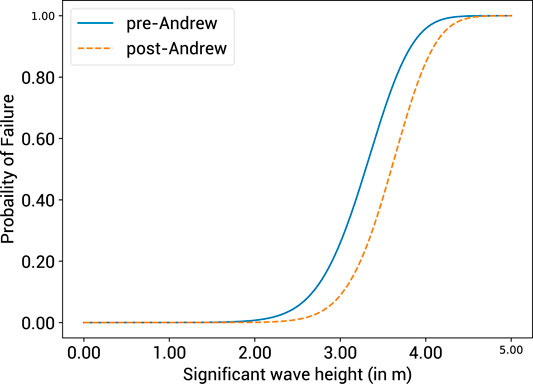
FIGURE 6. Fragilities of residential buildings, wave velocity Vw = 0.18 m/s.
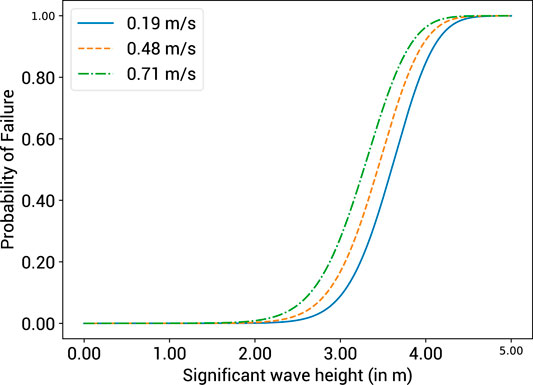
FIGURE 7. Fragilities of residential post-Andrew buildings for different wave velocities (Vw= 0.18, 0.63, 0.865 m/s).
Community Damage Assessment Under Scenario Events
Two major hurricanes have damaged the Alabama coastal region significantly in the past two decades: Ivan (2004) and Katrina (2005). However, the surge caused by Katrina (see Figure 8), which resulted in a total of 1,833 deaths and approximately $107 billion (2005 USD) in total property damage (Knabb et al., 2006), was larger than that caused by Ivan. Katrina was formed as a tropical depression near the Bahamas and became a Category 5 hurricane over the Gulf of Mexico (Figure 8), with maximum winds of 75 m/s and a central pressure of 909 millibars (NOAA, 2019a), but made landfall as a Category 3 hurricane in Southeast Louisiana and Mississippi with a maximum wind speed of 57 m/s and a central pressure of 920 millibars (Knabb et al., 2006). While Mobile City was not impacted significantly by the wind, the storm surge ranged from 3.4 to 3.8 m, resulting in disabled roads and large areas of inundation (Choate et al., 2014). In this study, we will consider the impact of a number of scenarios constructed from Hurricane Katrina in performing a damage and loss assessment of the residential community described above, varying the track and intensity of the wind field under various climate change scenarios summarized in Selection of Scenarios. These competing hazards analyses will show that the mechanisms impacting the coastal community—wind, surge/waves, flooding—are strongly dependent on the scenario.
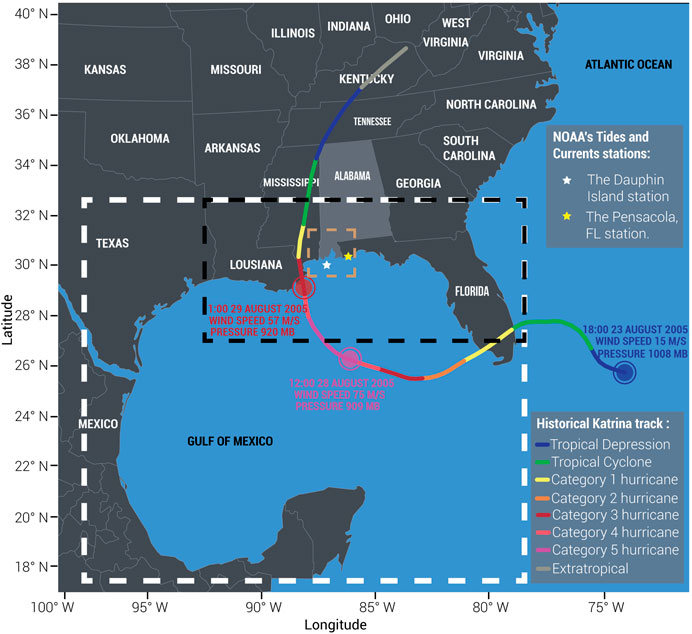
FIGURE 8. Modeling domains with Katrina natural track and tides observation stations used in this study.
Multihazard Modeling
There are several storm surge modeling platforms based on similar principles of computational fluid dynamics, e.g., ADCIRC (Luettich et al., 1992) and Delft3D (Stelling, 1996) that are used mainly to model tides, storm surge, waves (when coupled with SWAN (Booij et al., 1999)), and erosion in the presence of sea level rise near the coast. In contrast to many of these CFD models, Delft3D is relatively simple to use and has been validated for predicting the storm surge generated by Hurricanes Ike and Irene (Veeramony et al., 2017). For simulating current and future storm surge magnitude and extent induced by a hurricane and/or sea level rise, then, Delft3D is utilized for computing unsteady hydrodynamic flow on a rectangular or curvilinear grid domain arising from external forces, including wind, tides, and waves.
Model Grid, Bathymetry, and Bottom Roughness
To simulate the hurricane wind profile throughout its track, the analysis domain must include the point of hurricane formation to capture the water propagated from the Gulf of Mexico (GOM) accurately. Accordingly, a nesting grid modeling technique is used to simulate a broad selection of spatial scales. Following a previous study (Veeramony et al., 2017), three different scale model domains, as shown in Figures 9A–C, are selected. A large lower resolution grid of about 10 km is chosen to cover the GOM region as the first stage of the analysis. Then, the output information from the GOM model is passed to a higher resolution grid of about 2 km that covers the northern part of the Gulf (NG). Finally, the results of the previous two domains are passed to the highest resolution grid domain of about 0.38 km surrounding Mobile Bay (MB). Bathymetry and topography data are based on the U.S. Coastal Relief Model (CRM) (NOAA, 2001), which has a horizontal resolution of three arc seconds (approximately 90 m). The vertical datum in the CRM model is mean sea level. In areas where the CRM data are not available, the General Bathymetric Chart of the Oceans (GEBCO, 2010) (900 m horizontal resolution) is used. The seafloor roughness factor is defined by the spatial variations of the Manning coefficient, which is extracted from the land use data using the National Land Cover Database (NLCD) and then transformed to compatible Manning’s values by implementing the method developed by Mattocks and Forbes (2008).
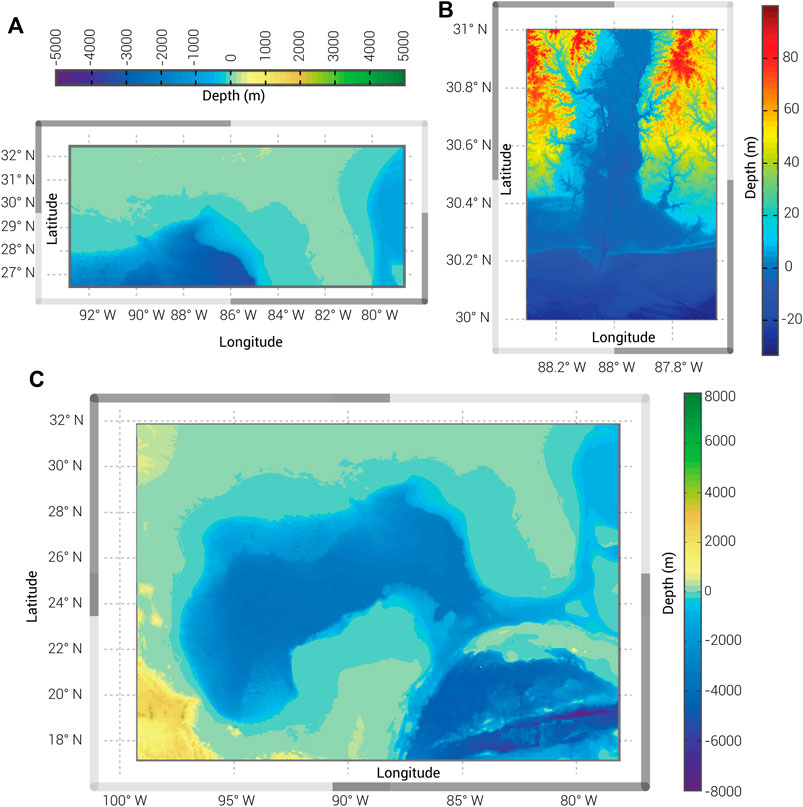
FIGURE 9. Bathymetry and topography for the three nested domains used in this study: (A) NG domain, (B) MB domain, and (C) GOM domain.
Wind Profile
Delft3D is capable of calculating the wind profile, presented by spiderweb grid data, by using the Wind Enhancement Schema (WES) approach (Heming et al., 1995) informed by analytical formulations by either Holland (1980), revised Holland (2010), or modified Rankine vortex (MRV) models (Phadke et al., 2003). We employ the Holland model to simulate current and future wind profiles for storm surge assessment because it is widely used in engineering applications. In this study, Hurricane Katrina track data are extracted from the National Hurricane Center second-generation HURDAT2 dataset (NOAA, 2014). The HURDAT2 data provide 1-minute maximum sustained wind speeds. To facilitate surge simulation, WES converts this wind speed to a 10-minute surface mean wind speed for an open-sea exposure. When evaluating the wind-induced damage using an ASCE Standard 7-16–based approach (Damage and Loss Assessment), the 10-minute wind speed for open-sea must be converted to 3-second gust wind speed at 10 m height for open terrain exposure (i.e., the standard exposure C), which is consistent with the design wind speed specified in ASCE Standard 7-16 (ASCE, 2016).
Boundary Condition Tidal Forcing
Many boundary conditions can be implemented in Delft3D to force the model domain. These include water level, current, discharge, Neumann, and Riemann (water level and current) boundaries (Caldwell and Edmonds, 2014). Tidal forcing can be applied as harmonic, astronomical, or time series elements. In this study, we used a Riemann astronomical boundary condition, extracted from the TPXO 7.2 Global Inverse Tidal Model (Egbert et al., 1994; Egbert and Erofeeva, 2002), to define the 13 tidal components used to force the open ocean boundary of the GOM domain. For the NG and MB domains (see Figure 9), the Riemann time series are used to define the open boundary conditions needed to pass the water level and current data from the GOM domain to the nested domains.
Validation of Multihazard Modeling
NOAA Tides and Currents (NOAA, 2019b) Stations at Dauphin Island (ID: 8735180) and Pensacola, FL (ID: 8729840), are used to test the accuracy of the storm surge simulations in this study, as they are the only two stations that had recorded data during Hurricane Katrina. The predicted water levels determined by Delft3D at the Dauphin Island station, shown in Figure 10A, capture the measured peak storm surge, although the predicted astronomical tides are slightly less than at the observation station. At the Pensacola Station (Figure 10B), the Delft3D model produces the same shape and duration of storm surge and tides during Hurricane Katrina but overestimates the peak of the surge by around 0.13 m. That behavior can be attributed to the fact that this station is some distance from the hurricane track. The simulation captures the peak of the storm surge of about 3.5 m southwest of downtown Mobile, our area of interest, which matches the FEMA high water marks at this location (FEMA, 2006). It is clear that this model can be used to couple future sea level rise with hurricanes to study the impact of different scenarios on the region of interest.
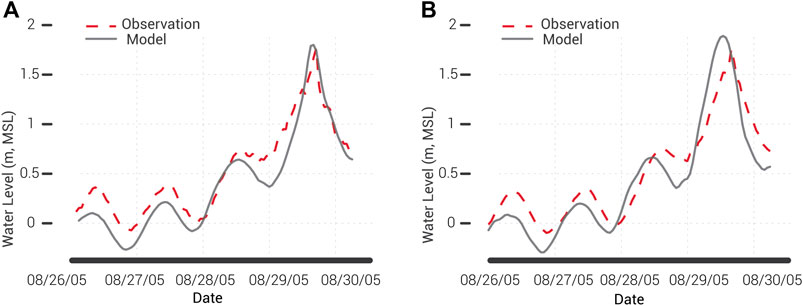
FIGURE 10. Comparison of water level from observation stations (red dashed lines) and model simulation (gray lines) for baseline scenario at (A) Dauphin island and (B) Pensacola, FL observation stations.
Selection of Scenarios
The hurricane wind and storm surge present two competing hazards for the community, in the sense that hurricane tracks located at some distance from the community may, nonetheless, produce damaging storm surges, while tracks close to the community may produce significant wind damage. To consider the influence of these hazards on community resilience planning and decision-making, the historical track of Hurricane Katrina (baseline) is used in simulating scenarios representing surge-dominant hazards, while a synthetic (shifted) Katrina-like track, chosen to maximize the wind speed at Mobile, is simulated based on the natural Katrina track to account for wind dominant hazard scenarios. The landfall location for the shifted track (close to Mobile) will likely be located in areas A2 or A3 (Figure 2). According to the plausible ranges of heading angles of A2 and A3 discussed in Hurricane Track, the heading angle of the shifted track is selected as the angle of the natural Katrina track, which is close to 90o. The landfall location is determined by maximizing the wind speed experienced by Mobile during the passage of the hurricane. The corresponding landfall location, the natural Katrina track, and the synthetic (shifted) track are illustrated in Figure 11.
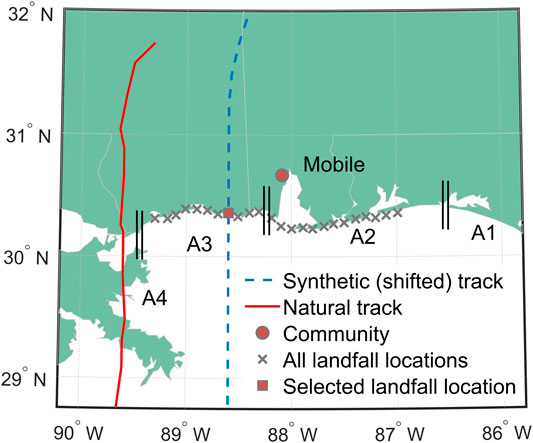
FIGURE 11. The landfall locations and hurricane tracks.
Climate change effects may influence the increases in hurricane intensity and sea level rise, which, in turn. may affect the storm surge and hurricane wind field. However, as noted in Hurricane Intensity (Maximum Wind Speed over Hurricane Duration, the increase of hurricane intensity is projected to be 5% around the late twenty-first century under the RCP 4.5 scenario. Therefore, the impact of changing hurricane intensity will not be considered further in the scenario-based damage assessment in this study.
The actual hydrodynamic parameters of water level and characteristics of the existing hurricane track are used in the baseline storm surge scenario, illustrated in Figure 11, while for the future scenarios, the water level and characteristics were updated by the Army Corps of Engineers (USACE, 2020) for Dauphin Island gauge station based on NOAA climate projections (Sweet et al., 2017) scenarios. Two sea level rise scenarios are selected, 1.21 and 3.28 m, to represent the intermediate and extreme scenarios in NOAA’s scale (Sweet et al., 2017), which correspond to about 3% probability of exceedance for RCP 4.5 and 0.1% probability of exceedance for RCP 8.5 in IPCC’s scale (IPCC, 2014) by 2100, respectively.
Six scenarios are utilized with different combinations of hurricane tracks and climate change projections and are identified using the following designation SKWXXXX-Y.Z, where S is scenario; K is Katrina; W is N or S (natural or shifted track); XXXX is year considered; Y.Z is RCP.
• SKN2005 represents the 2005 multihazard event, where the natural Hurricane Katrina track data are used as the input in the modeling of the hurricane wind field and storm surge without considering climate change (see Figures 8, 11).
• SKS2005 represents the 2005 multihazard event with a shifted Hurricane Katrina track (See Figure 11) to expose the community to the maximum possible wind speed without considering climate change.
• SKN2100-4.5 simulates the storm surge for the natural Hurricane Katrina track (SKN2005) while considering the sea level rise under RCP 4.5 by the end of the 21st century. This scenario models the effects of intermediate climate change on the storm surge.
• SKS2100-4.5 represents the multihazard event with a shifted Hurricane Katrina track (SKS2005) while considering the sea level rise under RCP 4.5 by the end of the 21st century. This scenario exposes the community to the maximum possible wind speed while modeling the effects of intermediate climate change on storm surge.
• SKN2100-8.5 simulates the storm surge for the natural Hurricane Katrina track while considering the sea level rise under RCP 8.5 by the end of the 21st century, while the hurricane wind field is kept unchanged compared with SKN2005. This scenario models the effects of extreme climate change on the storm surge.
• SKS2100-8.5 represents the multihazard event with a shifted Hurricane Katrina track (see Figure 11) while considering the sea level rise under RCP 8.5 by the end of the 21st century. This scenario exposes the community to the maximum possible wind speed while modeling the effects of extreme climate change on storm surge.
Additional subscenarios, denoted by SKSXXXX-4.5 in Table 1, occurring at different times during the 21st century under RCP 4.5 are defined for the shifted Katrina to investigate the evolution of losses over time.
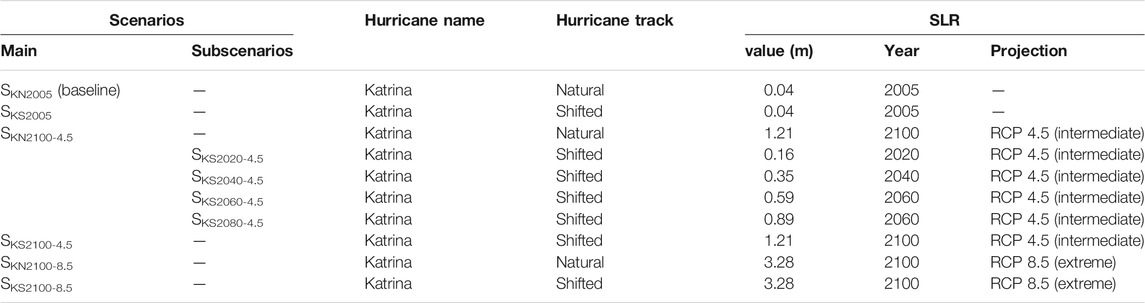
TABLE 1. List of six hurricane scenarios considered for this study.
Damage and Loss Assessment
Flooding due to Storm Surge
The extent of peak storm surge flooding for each scenario in Table 1 is shown in Figure 12. Comparing flooding between the natural and shifted track, the area inundated by the shifted track (blue color in Figure 12B) is 24% larger than the area inundated by the natural track (blue color in Figure 12A). That increase is derived by the increase in storm surge associated with the peaking of wind speed when the Katrina track is shifted. These simulations highlight the effect of sea level rise on the inundated area, where for the natural track, the area flooded increased by 54% and 100%, respectively, for the intermediate and extreme sea level rise events. The inundation areas from the six scenarios are summarized in Table 2. Changing the landfall location so that the area of interest is impacted by the maximum wind speed has not only contributed to a higher storm surge but also to a higher inundated area due to flooding. Sea level rise with RCP 8.5, in combination with the hurricane, almost doubled the flooded area for the natural track and increased it by more than 65% for the shifted track, as shown in Figure 12 and Table 2.
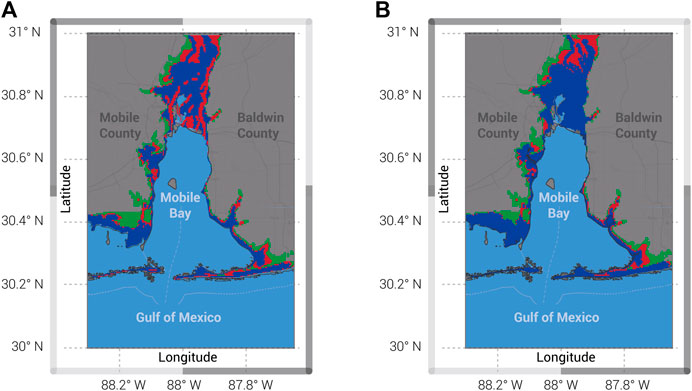
FIGURE 12. Inundations for (A) natural Hurricane Katrina track and (B) shifted Hurricane Katrina track. Blue color dominates the area inundated by scenario SKN2005 for (A) and SKS2005 for (B) only; red represents the extra area flooded by SKN2100-4.5 for (A) and SKS2100-4.5 for (B). Green is the extra area inundated by SKN2100-8.5 for (A) and SKS2100-8.5 for (B).
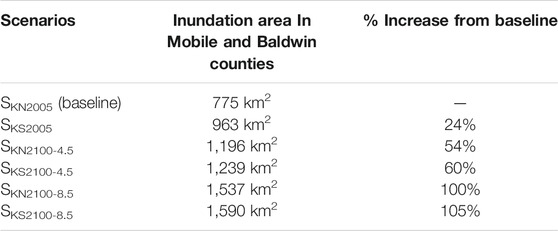
TABLE 2. Inundation areas in Mobile and Baldwin counties under different scenarios.
Damage and Loss Assessment for Joint Wind and Surge Hazards
We now consider the impact of the above scenarios on the bayside residential community depicted in Figure 3. The three cells (1A, 6A, and 11A) in Figure 13 represent the extension of the flooded area caused by scenario SKS2100-8.5 (shifted track coupled with RCP 8.5). Sample simulation outputs of six cells, representing a cross-section of land elevation, for three of the scenarios, are illustrated in Table 3.
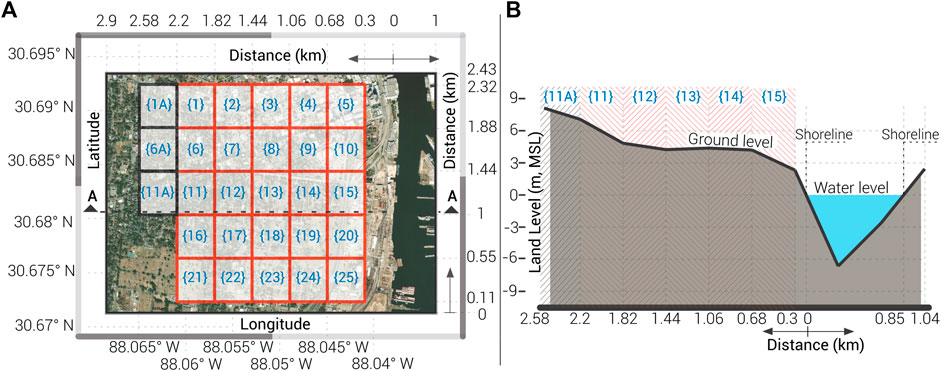
FIGURE 13. (A) The cells considered in this study analysis and (B) section A-A from (A) showing the cross-section of the land elevations and the Mobile River.
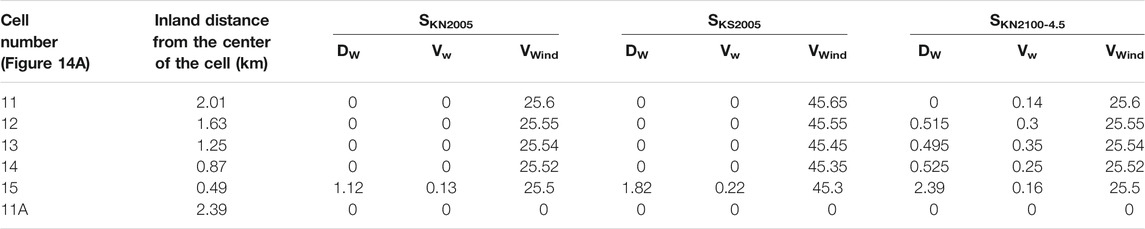
TABLE 3. Water depth, velocity, and wind speed for the first three scenarios (SKN2005–SKN2100-4.5), in which DW represents water depth in meters, Vw represents water velocity in m/s, and VWind represents wind speed in m/s.
To assess building damage, we considered the community to be geographically located across cells 2–5, 6–10, and 11–15 in Figure 13A. Figure 14A shows the community layout with respect to different identified cells, while Figure 14B displays cell identifier and number of houses in each cell while. The community is assumed to have developed in the westerly direction, beginning at the shoreline where buildings constructed near the shoreline prior to Hurricane Andrew in 1992 are referred to as zone 1 and those constructed following Andrew are referred to as zone 2. In zone 1, “standard” construction, which is typical to practices prior to Hurricane Andrew, is assumed, whereas in zone 2, “improved” construction is utilized, reflecting changes in construction practices that followed Hurricane Andrew. Building damage due to combined wave-surge-hurricane action is assessed based on assumptions made by Masoomi et al. (2018):
where ds is the water depth, Hs is the wave height, h1 is the height to a first-story window sill, h2 is the height to the top of the window, and H is height of the building. Calculations of losses to residential buildings due to wind are based on aggregating costs of repairing/replacing damaged building component damages (R.S. Means 2018; Adhikari, 2020), with an allowance added for nonstructural and contents damage, while losses due to surge are based on HAZUS (2020). In both cases, damages and losses exceeding 50% of assessed values are considered as total losses. We did not consider interdependencies in building performance due to proximity, debris shielding, and other effects (Hatzikyriakou and Lin, 2016).
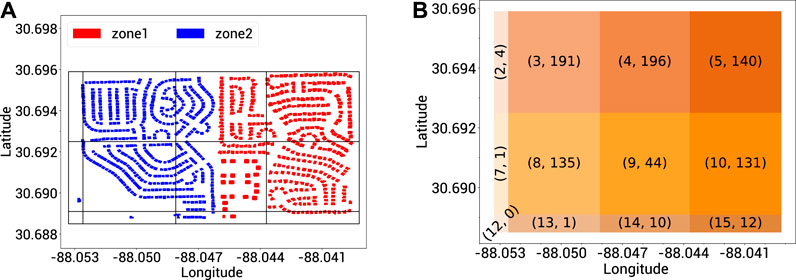
FIGURE 14. (A) Community layout with respect to different identified cells. (B) Cell identifier and number of houses in each cell.
Figures 15–17 show heatmaps of the expected losses to the community. In all three figures, losses caused by the shifted track (close to Mobile) are substantially higher than the natural track. Figure 15 shows the expected loss from both the natural and shifted Hurricane Katrina tracks to be dominated by wind losses (marked by WD). Losses projected for 2100 under RCP 4.5 (Figure 16) show the expected losses to be dominated by water (marked by WR), particularly for buildings located near the shoreline, with a slight increase in losses when compared with the 2005 tracks. Under the extreme scenario, i.e., RCP 8.5 for the year 2100 (Figure 17), the losses are predominantly water-driven, resulting from the combined effects of coastal flooding, storm surge, and wave action.

FIGURE 15. Expected losses for scenarios (A) SKN2005 and (B) SKS2005.
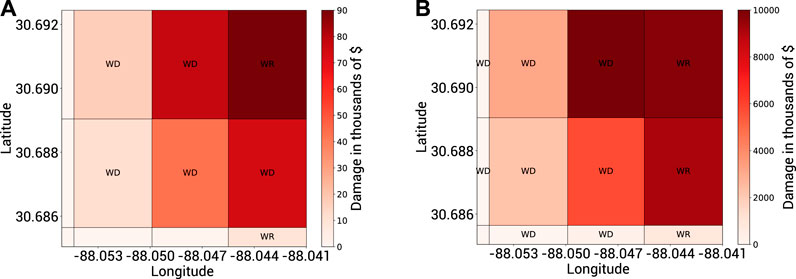
FIGURE 16. Expected losses for scenarios (A) SKN2100-4.5 and (B) SKS2100-4.5.
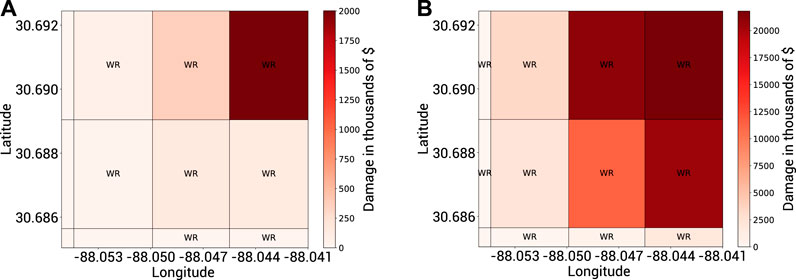
FIGURE 17. Expected losses for scenarios (A) SKN2100-8.5 and (B) SKS2100-8.5.
Mitigating Risk to Residential Communities in Coastal Areas
Life Cycle Perspective
The analyses presented in the previous section clearly show the risk posed to coastal residential communities by sea level rise and tropical cyclones in the presence of a changing climate during the remainder of the 21st century. The nature of the risk will evolve as sea level rise causes the impact of storm surge accompanying tropical cyclones to become an overwhelming threat to this residential coastal community. In addition to the damage to physical infrastructure, such hazards may lead to substantial disruption or closure of commerce and industry, outmigration of community residents, healthcare and social stresses. Risk mitigation through appropriate planning of new development and protection of existing communities must recognize the changing nature of the risk posed by these hazards. Appropriate strategies will differ, depending on the characteristics of the community. While the focus of this article is on residential building portfolios, which form the core of most communities, the spectrum of disruptions caused by these multihazards should be considered in any comprehensive and integrated risk mitigation plan.
Risk mitigation for coastal communities is an interdisciplinary endeavor, with a number of components (Burby and French, 1981; Aerts, et al., 2018), among them, protection (e.g., shore protection and elevating new buildings), regulation (building codes, land use), relocation (public, private), taxation, public and private financing and expenditures, education (public awareness), and emergency response. All have been employed with mixed success in the past. As noted previously, our existing community on Mobile Bay contains a mix of pre-Andrew and post-Andrew residences. Since the purpose of this article is to define the potential scope of the problem and we are dealing with existing residences rather than new development, elevation of existing buildings is a feasible option. A recent study (Xian et al., 2017) considered this option from an optimal life cycle cost perspective that might be useful for insurance underwriting, under the assumption that the hurricane threat was stationary. To avoid having to randomly simulate the occurrence of hurricanes and, at the same time, capture the nonstationary effects of sea level rise, we imagine a decision to mitigate future losses is taken in 2020 (as described in Estimated Life Cycle Cost for the Different Alternatives) and stipulate that a major hurricane event can occur at any of the following times: 2040, 2060, 2080, and 2100 under sea level rise driven by RCP 4.5 (see subscenarios in Table 1); this enables us to utilize the previous analyses in damage assessment in showing how the risk profile of the community evolves over the remainder of the 21st century. For simplicity, we consider two alternative mitigation strategies to establish a perspective on life cycle performance and costs: Alternative A is to do nothing, while Alternative B involves retrofitting for flood protection by increasing the building elevations (Xian et al., 2017), either immediately or in phases.
In Alternative A, we perform the loss assessment at 20-year intervals. The present value of damage caused by each tropical storm is
where C is loss, n is the number of years in the future when the storm occurs, r is the effective discount rate, herein assumed to be 3 and 5%. A value of 3% is consistent with the rate of return on long-term financial instruments, while the higher discount rate, 5%, is provided simply for comparison.
In Alternative B, we begin with the same current community as in A. We then perform a hurricane wind/sea level rise/surge analysis to determine what the still water elevation (design flood) would be throughout the community in 2100. In B.1, we elevate the entire community in 2020.5 In B.2, we elevate the near-shore half of the community in 2020 and the western half in 2060. In all analyses, the damage due to storm occurrence at 20-year intervals is discounted to PV. Since the topography of the studied community varies (see Figure 14B), buildings in different areas must be elevated to different levels depending upon the predicted design flood in 2100. Furthermore, because the Mobile County Flood Damage Prevention Ordinance (Mobile County Commission, 2010) requires freeboard of 0.6 m (2 ft) in the coastal areas, 0.6 m is added to the predicted 2100 still water level. Thus, buildings near the shoreline are raised as high as 3.8 m (12.4 ft) and those on the western end of the community are raised as high as 2.1 m (6.76 ft). The approximate cost of elevating a single-family dwelling as reported in FEMA (2009b) and adapted from Aerts et al. (2013) is $33,239 for 0.6 m (2 ft), $35,464 for 1.2 m (4 ft), $37,319 for 1.8 m (6 ft), and $39,173 for 2.4 m (8 ft). In this study, we assumed the cost of elevating the structure to be $31,000 + $1,000 per foot elevation. The PV equals the cost of retrofit, CR, plus the (reduced) cost of damage caused by the hurricane, performed once or twice, depending on the number of stages of retrofit:
where ΔC is reduction in cost of damage due to retrofit. Clearly, if the discounted savings exceed the cost of retrofit, option (2) is preferable to option (1).
Estimated Life Cycle Cost for the Different Alternatives
Figures 18–20 show the costs associated with these three alternatives, i.e., strategies A, B.1, and B2, respectively. When the elevation of the whole community is carried out at once, the total cost shouldered by the investors is $41.69 million, while the cost due to phased elevation for 3% is $27.43 million and for 5% discount rate is $24.05 million. There is a significant benefit to be gained by elevating the community: $14.26 million and $17.64 million (based on 3% and 5% discount rates). Also, the damage to the community is obviously less when the elevations are carried out all at once.
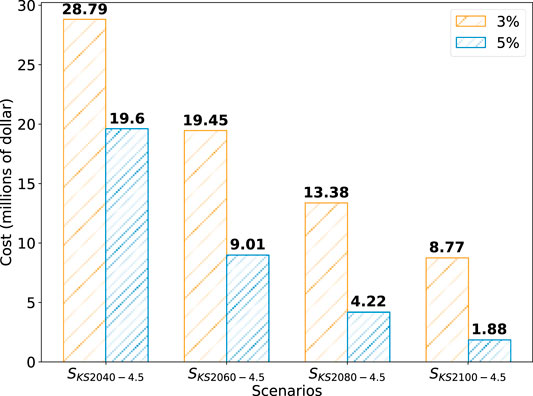
FIGURE 18. Hurricane damage cost when no retrofit is done (A).
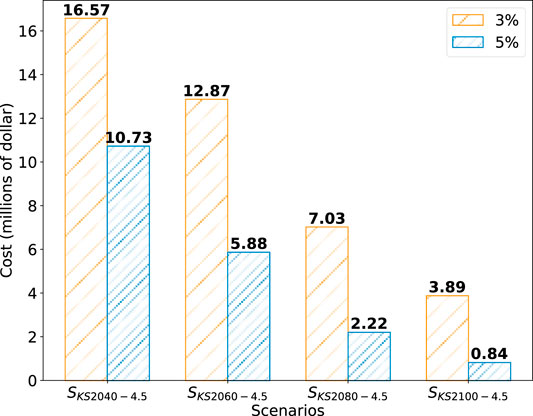
FIGURE 19. Hurricane damage cost when the retrofit is done at the present time all at once (B.1).
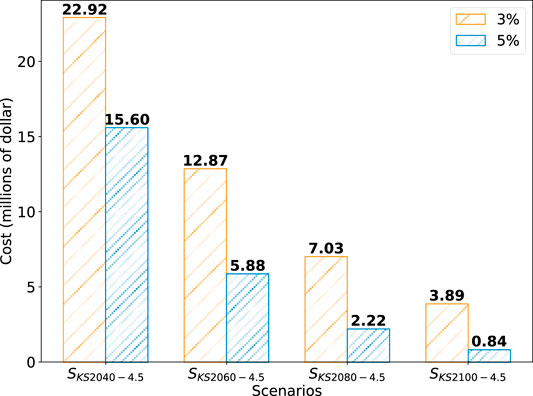
FIGURE 20. Hurricane damage cost retrofit is carried out in two phases (B.2).
Conclusions and Recommendations for Further Study
Coastal communities in the Southeast and Gulf Coast of the United States are at increasing risk from tropical cyclones (hurricanes) due to sea level rise brought upon by climate change. In this study, we have examined the performance of a residential building community to a number of plausible scenarios involving Katrina-like hurricanes coupled with storm surge effects intensified by sea level rise under climate projections based on RCP 4.5 (moderate) and RCP 8.5 (severe) warming over the remainder of the 21st century. We also have provided a simple illustration of an assessment of how the risk to this community might be assessed in terms of economic loss under various hurricane and global warming scenarios and risk mitigation strategies. Effects of interdependencies in performance of adjacent buildings (e.g., shielding and debris impact) were not considered; moreover, postdisaster recovery of a residential building portfolio following a hurricane depends on numerous socioeconomic factors that were outside the scope of this initial study.
Our study of the impact of the various hurricane and climate change scenarios on the performance of coastal residential communities reveals that decision-making at the community level is needed to develop rational engineering and urban planning policies to mitigate hurricane risk and to adapt to climate change. Based on the analysis presented in 4.4.2, we found that the dominant hazard changed over a relatively short period of time, as follows:
• Through 2040, hurricane winds are the major source of damage, accounting for 66% of the total damage attributed to the storm, whereas surge accounted for 34%.
• Years 2040–2060 signaled a shift in damage. With sea level rise, the damage pattern shifted from being dominated by wind to include the increased contribution from surge, with 47% of the damage being attributed to surge.
• Beyond 2070, the storm surge, intensified by sea level rise due to climate change, becomes the major source of damage (73%), and by 2100, storm surge accounted for virtually all damage.
• If the buildings are elevated at once in 2020 based on the storm surge/inundation predictions for the year 2100, the relative damage due to surge, in comparison to wind, is minimal because all buildings are elevated beyond the inundation level.
• If the decision to elevate portions of the community is deferred until resources and incentives can be identified, the total damage is due initially to the combination of both wind and storm surge, and later on due only to wind. Fundamental changes in the current building regulatory process away from a focus on the performance of individual buildings are warranted.
Although the conclusions drawn are community-specific, it is clear that local planners and building officials must take a broader view of the threat their coastal communities face than suggested by local building code provisions. A life cycle analysis can provide a reasonable way to ensure that limited resources available to them are expended efficiently and wisely. The changing nature of the risk over time revealed by this type of analysis will allow more targeted decision-making on what to invest (e.g., wind damage reduction vs. surge damage reduction) and when to invest.
Data Availability Statement
The original data presented in the study are included in the article/Supplementary Material; further inquiries can be directed to the corresponding author.
Author Contributions
PA, MA, and YD carried out the simulations and contributed to the final version of the article. YG, HM, and BE conceived the idea, supervised the project, and contributed to the final version of the article.
Funding
The research herein was funded, in part, by the Center for Risk-Based Community Resilience Planning, a Center of Excellence funded through a cooperative agreement between the U.S. National Institute of Science and Technology and Colorado State University (NIST Financial Assistance Award Number: 70NANB15H044).
Conflict of Interest
The authors declare that the research was conducted in the absence of any commercial or financial relationships that could be construed as a potential conflict of interest.
Acknowledgments
This support is gratefully acknowledged. The views expressed herein are those of the authors and may not represent the official position of the National Institute of Standards and Technology, the US Department of Commerce. The authors also acknowledge the support and insight provided by Bret Webb from the University of South Alabama regarding the coupled SLR and hurricane simulations.
Footnotes
1The U.S. National Hurricane Center classifies hurricanes of Category 3 and above as major hurricanes.
2Radiative forcing is the difference between the insolation (sunlight) absorbed by the Earth and the energy radiated back to space (albedo) in units of watts per square meter (W/m2) of the Earth’s surface.
3The confidence in projection is based on the author teams’ evaluations of underlying scientific understanding and is expressed as a qualitative level of confidence (i.e., very low, low, medium, high, and very high), according to the IPCC AR5’s framework (IPCC, 2014).
4We chose Hurricane Andrew as the delimiter because Andrew was the initiating event that caused a major change in wind design loads (maps) and availability of engineered solutions for wind design of wood structures. Wind loads have been on an increasing trajectory since that time, with a positive effect on residential building performance to this day. The International Residential Code now requires engineered design in hurricane-prone regions that line up with engineered solutions in the Wood Frame Construction Manual (developed following Andrew).
5We leave aside the question as to whether this strategy is practically feasible because we are interested in understanding the difference between an immediate and a phased investment in community resilience.
References
Adhikari, P., Mahmoud, H., Xie, A., Simonen, K., and Ellingwood, B. R. (2020). Life-cycle cost and carbon footprint analysis for light-framed residential buildings subjected to tornado hazard. J. Building Engineering. 32, 101657. doi:10.1016/j.jobe.2020.101657
Aerts, J. C., Barnard, P. L., Botzen, W., Grifman, P., Hart, J. F., De Moel, H., et al. (2018). Pathways to resilience: adapting to sea level rise in Los Angeles. Ann. N.Y. Acad. Sci. 1427, 1–90. doi:10.1111/nyas.13917
Aerts, J. C., Botzen, W. W., de Moel, H., and Bowman, M. (2013). Cost estimates for flood resilience and protection strategies in New York City. Ann. N.Y. Acad. Sci. 1294, 1–104. doi:10.1111/nyas.12200
ASCE. (2016). Minimum design loads and associated criteria for buildings and other structures. ASCE/SEI Standard 7-16. Reston, VA: American Society of Civil Engineers. doi:10.1061/9780784414248
Baradaranshoraka, M., Pinelli, J. P., Gurley, K., Peng, X., and Zhao, M. (2017). Hurricane wind versus storm surge damage in the context of a risk prediction model. J. Struct. Eng. 143, 4017103. doi:10.1061/(ASCE)ST.1943-541X.0001824
Bilskie, M. V., Hagen, S. C., Alizad, K. A., Medeiros, S. C., Passeri, D. L., and Needham, H. (2016). Dynamic simulation and numerical analysis of hurricane storm surge under sea level rise with geomorphologic changes along the northern Gulf of Mexico. Earth's Future. 4 (5), 177–193. doi:10.1002/2015EF000347
Booij, N., Ris, R. C., and Holthuijsen, L. H. (1999). A third-generation wave model for coastal regions 1. Model description and validation. J. Geophys. Res. 104, 7649– 7666. doi:10.1029/98JC02622
Burby, R. J., and French, S. P. (1981). Coping with floods: the land use management paradox. J. Am. Plann. Assoc. 47, 289–300. doi:10.1080/01944368108976511
Caldwell, R. L., and Edmonds, D. A. (2014). The effects of sediment properties on deltaic processes and morphologies: a numerical modeling study, J. Geophys. Res. Earth Surf. 119, 961–982. doi:10.1002/2013JF002965
Cha, E. J., and Ellingwood, B. R. (2013). The role of risk aversion in nuclear plant safety decisions. Struct. Saf. 44, 28–36. doi:10.1016/j.strusafe.2013.05.002
Choate, A., Evans, C., Rodehorst, B., Saavedra, R., Snow, C., Snyder, J., et al. (2014). Report No. FHWA-HEP-14-033. Impacts of climate change and variability on transportation systems and infrastructure: the Gulf Coast study, phase 2. US Department of Transportation. Available at: https://www.fhwa.dot.gov/environment/sustainability/resilience/ongoing_and_current_research/gulf_coast_study/phase2_task3/task_3.1/phase2task3.pdf (Accessed April 17, 2020).
Congressional Budget Office. (2019). Expected costs of damage from hurricane winds and storm-related flooding. Publication No. 55019. Available at: https://www.cbo.gov/system/files/2019-04/55019-ExpectedCostsFromWindStorm.pdf. (Accessed June 17, 2020).
Deierlein, G. G., Mckenna, F., Zsarnóczay, A., Kijewski-Correa, T. L., Kareem, A., Elhaddad, W., et al. (2020). A cloud-enabled application framework for simulating regional-scale impacts of natural hazards on the built environment. Frontiers in Built Environment. 6, 196. doi:10.3389/fbuil.2020.558706
Dvorak, V. F. (1975). Tropical cyclone intensity analysis and forecasting from satellite imagery. Mon. Weather. Rev. 103 (5), 420–430. doi:10.1175/1520-0493(1975)103<0420:TCIAAF2.0.CO;2
Egbert, G. D., and Erofeeva, S. Y. (2002). Efficient inverse Modeling of Barotropic Ocean Tides. J. Atmos. Oceanic Technol. 19, 183–204. doi:10.1175/1520-0426(2002)019<0183:EIMOBO2.0.CO;2
Ellingwood, B. R., Cutler, H., Gardoni, P., Peacock, W. G., van de Lindt, J. W., and Wang, N. (2016). The Centerville Virtual Community: a fully integrated decision model of interacting physical and social infrastructure systems. Sustainable and Resilient Infrastructure. 1, 95–107. doi:10.1080/23789689.2016.1255000
Ellingwood, B. R. (1990). Validation studies of seismic PRAs. Nucl. Eng. Des. 123 (2), 189–196. doi:10.1016/0029-5493(90)90237-R
Fema, . (2009b). Homeowner's Guide to retrofitting. Second edition. Washington, DC: US Department of Homeland Security: Federal insurance and mitigation administration (FEMA). Avaialble at: http://www.fema.gov/library/viewRecord.do?id=1420 (Accessed May 20, 2020).
Fema, . (2006). High water mark collection for hurricane Katrina in Alabama. FEMA-1605-DR-AL, task orders 414 and 421. Available at: https://www.fema.gov/pdf/hazard/flood/recoverydata/katrina/katrina_al_hwm_public.pdf (Accessed April 17, 2020).
GEBCO. (2010). Gridded bathymetry data. Available at:https://www.gebco.net/ (Accessed April 10, 2020).
Guo, Y., and van de Lindt, J. W. (2019). Simulation of hurricane wind fields for community resilience applications: a data-driven approach using integrated asymmetric Holland models for inner and outer core regions. J. Struct. Eng. 145 (9), 04019089. doi:10.1061/(ASCE)ST.1943-541X.0002366
Hatzikyriakou, A., and Lin, N. (2016). Impact of performance interdependencies on structural vulnerability: a systems perspective of storm surge risk to coastal residential communities. Reliab. Eng. Syst. Saf. 158, 106–116. doi:10.1016/j.ress.2016.10.011
Hauer, M. E., Evans, J. M., and Mishra, D. R. (2016). Millions projected to be at risk from sea-level rise in the continental United States. Nat. Clim. Chang. 6, 691–695. doi:10.1038/nclimate2961
HAZUS. (2020). Multi-hazard loss estimation methodology, flood model, hazus –MH 2.1Technical Manual. Dept. of Homeland Security, FEMA Mitigation Divison., Washington, D.C. Available at: https://www.fema.gov/media-library-data/20130726-1820-25045-8814/hzmh2_1_fl_um.pdf (Accessed May 10, 2020)
Heming, J. T., Chan, J. C. L., and Radford, A. M. (1995). A new scheme for the initialisation of tropical cyclones in the UK Meteorological Office global model. Meteorol. Appl. 2 (2), 171–184. doi:10.1002/met.5060020211
Holland, G. J., Belanger, J. I., and Fritz, A. (2010). A revised model for radial profiles of hurricane winds. Mon. Weather. Rev. 138, 4393–4401. doi:10.1175/2010MWR3317.1
Holland, G. J. (1980). An analytic model of the wind and pressure profiles in hurricanes. Mon. Weather. Rev. 108, 1212–1128. doi:10.1175/1520-0493(1980)108<1212:AAMOTW2.0.CO;2
IPCC. (2014). Climate change 2014: synthesis report. Contribution of working groups I, II and III to the Fifth assessment report of the intergovernmental panel on climate change. in IPCC AR5 synthesis Report website, (IPCC, Geneva, Switzerland), 151. Available at: https://www.ipcc.ch/report/ar5/syr/. (Accessed April 10, 2020).
Kennedy, R. P., and Ravindra, M. K. (1984). Seismic fragilities for nuclear power plant risk studies. Nucl. Eng. Des. 79 (1), 47–68. doi:10.1016/0029-5493(84)90188-2
Kijewski-Correa, T., Gong, J., Kennedy, A., Womble, J. A., Cai, C. S., Cleary, J., and Sun, C. (2018). “Performance of low-rise construction under wind and coastal hazards during the landfall of hurricane Harvey.” in Forensic engineering 2018: forging forensic Frontiers. Reston, VA: American Society of Civil Engineers. 1017–1027
Knabb, R. D., Rhome, J. R., and Brown, D. P. (2006). Tropical cyclone Report: hurricane Katrina. Natl. Hurric. Cent. doi:10.1017/CBO9781107415324.004
Knaff, J. A., and Zehr, R. M. (2007). Reexamination of tropical cyclone wind–pressure relationships. Weather Forecast. 22 (1), 71–88. doi:10.1175/WAF965.1
Knutson, T., Camargo, S. J., Chan, J. C., Emanuel, K., Ho, C. H., Kossin, J., et al. (2019). Tropical cyclones and climate change assessment: Part II. Projected response to anthropogenic warming. Bull. Am. Meteorol. Soc. 101 (3), E303–E322. doi:10.1175/BAMS-D-18-0194.1
Knutson, T. R., McBride, J. L., Chan, J., Emanuel, K., Holland, G., Landsea, C., et al. (2010). Tropical cyclones and climate change. Nature Geosci. 3, 157–163. doi:10.1038/ngeo779
Knutson, T. R., Sirutis, J. J., Zhao, M., Tuleya, R. E., Bender, M., Vecchi, G. A., et al. (2015). Global projections of intense tropical cyclone activity for the late twenty-first century from dynamical downscaling of CMIP5/RCP4.5 scenarios. J. Clim. 28 (18), 7203–7224. doi:10.1175/JCLI-D-15-0129.1
Kossin, J. P. (2015). Hurricane wind pressure relationship and eyewall replacement cycles. Weather Forecast. 30, 177–181. doi:10.1175/WAF-D-14-00121.1
Li, Y., and Ellingwood, B. (2009). Framework for multi-hazard risk assessment and mitigation for wood-frame residential construction. J. Struct. Engrg, ASCE 135 (2), 159–168. doi:10.1061/(ASCE)ST.0733-9445(2009)135(2):159
Lin, N., Emanuel, K., Oppenheimer, M., and Vanmarcke, E. (2012). Physically based assessment of hurricane surge threat under climate change. Nat. Clim. Chang, 2(6), 462–467. doi:10.1038/nclimate1389
Luettich, R. A., Westerink, J. J., and Scheffner, N. W. (1992). ADCIRC: an advanced three-dimensional circulation model for shelves coasts and estuaries, report 1: theory and methodology of ADCIRC-2DDI and ADCIRC-3DL, Dredging Research Program Technical Report DRP-92-6. Vicksburg, MS: U.S. Army Engineers Waterways Experiment Station, 137p.
Masoomi, H., van de Lindt, J. W., Ameri, M. R., Do, T., and Webb, B. M. (2018). Combined wind-wave-surge hurricane-induced damage prediction for buildings. J. Struct. Eng. 145 (1), 04018227. doi:10.1061/(ASCE)ST.1943-541X.0002241
Mattocks, C., and Forbes, C. (2008). A real-time, event-triggered storm surge forecasting system for the state of North Carolina. Ocean Model. 25 (3–4), 95–119. doi:10.1016/j.ocemod.2008.06.008
McInnes, K. L., Hubbert, G. D., Abbs, D. J., and Oliver, S. E. (2002). A numerical modelling study of coastal flooding. Meteorol. Atmos. Phys. 80, 217–233. doi:10.1007/s007030200027
McKeever, D. B., and Elling, J. (2015). Wood products and other building materials used in new residential construction in the United States, with comparison to previous studies 2012. Tacoma, WA: APA - The Engineered Wood Association.
Melillo, J. M., Richmond, T. C., and Yohe, G. W. (2014). Climate change impacts in the United States: the third national climate assessment. U.S. Global change research program. doi:10.7930/J0Z31WJ2
Mobile Area Chamber of Commerce, (2016). Mobile’s on the grow. Available at: https://mobilechamber.com/wp-content/uploads/2019/06/MOTG_06042019-3-low.pdf. (Accessed June 24, 2020).
Mobile County Commission. (2010). Mobile county flood damage prevention ordinance. Available at: https://www.smarthomeamerica.org/assets/catalog/Flood-Damage-Prevention.pdf. (Accessed May 20, 2020).
Moss, R. H., Edmonds, J. A., Hibbard, K. A., Manning, M. R., Rose, S. K., Van Vuuren, D. P., et al. (2010). The next generation of scenarios for climate change research and assessment. Nature. 463, 747–756. doi:10.1038/nature08823
Neumann, B., Vafeidis, A. T., Zimmermann, J., and Nicholls, R. J. (2015). Future coastal population growth and exposure to sea-level rise and coastal flooding - a global assessment. PLoS One. 10, e0118571. doi:10.1371/journal.pone.0118571
NHC. (2020). Storm surge overview. Available at: https://www.nhc.noaa.gov/surge/ (Accessed April 10, 2020).
NIST (2016). Community resilience planning Guide for buildings and infrastructure systems, Vols. 1 and 2. Gaithersburg, MD: Special Publication 1190, National Institute of Standards and Technology.
NOAA. (2020). Historical hurricane tracks tool. Available at: https://coast.noaa.gov/hurricanes/#map/ (Accessed April 5, 2020).
NOAA. (2019a). Historical hurricane tracks. Natl. Ocean. Atmos. Adm. U.S. Dep. Commer. Available at: https://coast.noaa.gov/hurricanes/#map=4/32/-80 (Accessed April 10, 2020).
NOAA. (2013). National coastal population report: population trends from 1970 to 2020. NOAA state Coast Rep. Ser. Available at:https://coast.noaa.gov/digitalcoast/training/population-report.html (Accessed April 10, 2020).
NOAA. (2014). National hurricane center’s (NHC). Available at:http://www.aoml.noaa.gov/hrd/hurdat/Data_Storm.html (Accessed April 10, 2020).
NOAA. (2017). Socioeconomic data summary: quick reference. Available at:https://coast.noaagov/data/digitalcoast/pdf/socioeconomic-data-summary.pdf. (Accessed May 12, 2020].
NOAA (2019b). Tides and currents. Available at:http://tidesandcurrents.noaa.gov (Accessed April 17, 2020).
NOAA. National Geophysical Data Center. (2001). U.S. Coastal Relief model Vol.4 - central Gulf of Mexico. NOAA National Centers for Environmental Information. doi:10.7289/V54Q7RW0
Phadke, A. C., Martino, C. D., Cheung, K. F., and Houston, S. H. (2003). Modeling of tropical cyclone winds and waves for emergency management. Ocean Eng. 30(4), 553–578. doi:10.1016/S0029-8018(02)00033-1
Pinelli, J. P., Da Cruz, J., Gurley, K., Paleo-Torres, A. S., Baradaranshoraka, M., Cocke, S., et al. (2020). Uncertainty reduction through data management in the development, validation, calibration, and operation of a hurricane vulnerability model. Int. J. Disaster Risk Sci. 11, 790–806. doi:10.1007/s13753-020-00316-4
Pinelli, J. P., Simiu, E., Gurley, K., Subramanian, C., Zhang, L., Cope, A., et al. (2004). Hurricane damage prediction model for residential structures. J. Struct. Engrg. ASCE 130 (11) doi:10.1061/(ASCE)0733-9445(2004)130:11(1695)
Porter, K. (2015). “Beginner’s Guide to fragility, vulnerability, and risk,” in The encyclopedia of earthquake engineering, Editors M. Beer, I. A. Kougioumtzoglou, E. Patelli, and S. K. Au (Springer, Berlin, Heidelberg). 235–260. doi:10.1007/978-3-642-35344-4_256
Rajabalinejad, M., and Demirbilek, Z. (2013). A Bayesian probabilistic approach for impacts of sea level rise on coastal engineering design practice. Ocean Eng. 71, 66–73. doi:10.1016/j.oceaneng.2013.05.001
Shinozuka, M., Feng, M., Lee, J., and Naganuma, T. (2000). Statistical analysis of fragility curves. J. Eng. Mech. 126 (12), 1224–1231. doi:10.1061/(ASCE)07339399(2000)126:12(1224)
Singhal, A, and Kiremidjian, A. S. (1996). Method for probabilistic evaluation of seismic structural damage. J. Struct. Eng. 122 (12), 1459–1467. doi:10.1061/(ASCE)0733-9445(1996)122:12(1459)
Smith, J. M. K., Cialone, M. A., Wamsley, T. V., and McAlpin, T. O. (2010). Potential impact of sea level rise on coastal surges in southeast Louisiana. Ocean Eng. 37, 37–47. doi:10.1016/j.oceaneng.2009.07.008
Standohar-Alfano, C. D., van de Lindt, J., and Ellingwood, B. R. (2017). Vertical load path failure risk analysis of residential wood-frame construction in tornadoes. J. Struct. Eng. 143, 04017045. doi:10.1061/(ASCE)ST.1943-541X.0001775
Stelling, G. S. (1996). A non-hydrostatic flow model in cartesian coordinates. WL | Delft Hydraulics report, Technical note. Z0901-10, The Netherlands.
Sweet, W. V., Kopp, R. E., Weaver, C. P., Obeysekera, J., Horton, R., Thieler, E. R., et al. (2017). Global and regional sea level rise scenarios for the United States. Report No. NOS CO-OPS 083. Available at: https://tidesandcurrents.noaa.gov/publications/techrpt83_Global_and_ Regional_SLR_Scenarios_for_the_US_final.pdf (Accessed April 10, 2020).
Tomiczek, T., Kennedy, A., Zhang, Y., Owensby, M., Hope, M. E., Lin, N., and Flory, A. (2017). Hurricane damage classification methodology and fragility functions derived from Hurricane Sandy’s effects in coastal New Jersey. Waterway, J., Port, Coastal, Ocean Eng. 143 (5), 4017027. doi:10.1061/(ASCE)WW.1943-5460.0000409
Tomiczek, T., Kennedy, A., and Rogers, S. (2014). Collapse limit state fragilities of wood-framed residences from storm surge and waves during hurricane Ike. J. Waterw. Port, Coast. Ocean Eng., 140, 43–55. doi:10.1061/(ASCE)WW.1943-5460.0000212
USACE (2013). Incorporating sea level changes in civil works programs. ER 1100-2-8162. Available at:https://www.publications.usace.army.mil/Portals/76/Users/182/86/2486/ER_1100-2-8162.pdf?ver=2019-07-02-124841-933
USACE (2020). Sea Level change curve calculator (version 2019.21). Available at: http://corpsmapu.usace.army.mil (Accessed April 10, 2020).
Van Vuuren, D. P., Edmonds, J., Kainuma, M., Riahi, K., Thomson, A., Hibbard, K., et al. (2001). The representative concentration pathways: an overview. Climatic Change. 109, 5–31. doi:10.1007/s10584-011-0148-z
Veeramony, J., Condon, A., and van Ormondt, M. (2017). Forecasting storm surge and inundation: model validation. Weather Forecast. 32, 2045–2063. doi:10.1175/WAF-D-17-0015.1
Vickery, P. J., and Wadhera, D. (2008). Statistical models of Holland pressure profile parameter and radius to maximum winds of hurricanes from flight-level pressure and H* Wind data. J. Appl. Meteorol. Climatol. 47 (10), 2497–2517. doi:10.1175/2008JAMC1837.1
Webb, B. M. (2017). Report No. FHWA-HIF-18-002. A primer on modeling in the coastal environment. U.S. Department of Transportation. Federal Highway Administration. Available at: https://www.fhwa.dot.gov/engineering/hydraulics/pubs/hif18002.pdf (Accessed April 10, 2020).
Wooten, R. D. (2011). Statistical analysis of the relationship between wind speed, pressure and temperature. J. Appl. Sci. 11 (15), 2712–2722. doi:10.3923/jas.2011.2712.2722
Xian, S., Lin, N., and Kunreuther, H. (2017). Optimal house elevation for reducing flood-related losses. J. Hydrol. 548, 63–74. doi:10.1016/j.jhydrol.2017.02.057
Yang, Z., Wang, T., Voisin, N., and Copping, A. (2015). Estuarine response to river flow and sea-level rise under future climate change and human development. Estuar. Coast. Shelf Sci. 156, 19–30. doi:10.1016/j.ecss.2014.08.015
Keywords: expected loss, fragility, residential buildings, resilience, storm surge, tropical cyclones
Citation: Adhikari P, Abdelhafez MA, Dong Y, Guo Y, Mahmoud HN and Ellingwood BR (2021) Achieving Residential Coastal Communities Resilient to Tropical Cyclones and Climate Change. Front. Built Environ. 6:576403. doi: 10.3389/fbuil.2020.576403
Received: 26 June 2020; Accepted: 21 December 2020;
Published: 22 February 2021.
Edited by:
Ning Lin, Princeton University, United StatesReviewed by:
David Brett Roueche, Auburn University, United StatesJean-Paul Pinelli, Florida Institute of Technology, United States
Copyright © 2021 Adhikari, Abdelhafez, Dong, Guo, Mahmoud and Ellingwood. This is an open-access article distributed under the terms of the Creative Commons Attribution License (CC BY). The use, distribution or reproduction in other forums is permitted, provided the original author(s) and the copyright owner(s) are credited and that the original publication in this journal is cited, in accordance with accepted academic practice. No use, distribution or reproduction is permitted which does not comply with these terms.
*Correspondence: Bruce R. Ellingwood, YnJ1Y2UuZWxsaW5nd29vZEBjb2xvc3RhdGUuZWR1