 Chayanon Hansapinyo
 Panon Latcharote
 Suchart Limkatanyu
- 1Excellence Center in Infrastructure Technology and Transportation Engineering, Department of Civil Engineering, Chiang Mai University, Chiang Mai, Thailand
- 2Department of Civil and Environmental Engineering, Faculty of Engineering, Mahidol University, Nakhon Pathom, Thailand
- 3Department of Civil Engineering, Faculty of Engineering, Prince of Songkla University, Songkhla, Thailand
The estimation of seismic damage to buildings is complicated due to the many sources of uncertainties. This study aims to develop a new approach using an artificial intelligence system called adaptive neuro-fuzzy inference system (ANFIS) model to predict the damage of buildings at urban scale considering input uncertainties. First, the study performed seismic damage evaluation of buildings utilizing the capacity spectrum method (CSM) to obtain a set of 57,648 training data from a combination of three main parameters, i.e., 6 earthquake magnitudes, 8 structural types, and 1,201 distances. Next, the data was used to develop a practical ANFIS model for the seismic damage prediction. The variables of the fuzzy system are earthquake magnitudes, structural types, and distance between epicenter and building. To validate the applicability of the proposed model, analyses of spatial seismic building damage under five possible earthquakes in Chiang Mai Municipality were performed by using the proposed methodology. From the comparison of the damaged urban area, small discrepancies between the CSM and the ANFIS results could be observed. It should be noted that the proposed ANFIS model can predict the seismic building damage reasonably well compared with the CSM. Using the method proposed herein, it is possible to create damage scenarios for earthquake-prone areas where only a few seismic data are available, such as developing countries.
Introduction
Earthquakes are natural disasters that can damage buildings and injure human life. The severity of earthquake-induced building damage depends on many factors such as magnitude, distance from epicenter, and geological conditions as well as seismic building performance. The past earthquake data from the earthquake observation division (Thai Meteorological Department, 2019) show that small earthquakes have frequently occurred in Northern Thailand. Although the magnitude was small, it is a warning sign that a more massive damaging earthquake could happen anytime. On May 5, 2014, there was a magnitude 6.3 earthquake in Chiang Rai Province. The strike is the biggest recorded earthquake in Thailand, causing damage to buildings in a large area (Saicheur and Hansapinyo, 2016).
The time of occurrence of a potential earthquake is unpredictable. Therefore, seismic risk assessment is necessary for preparedness toward appropriate earthquake mitigation activities. To provide a seismic decision-making strategic plan, a performance-based earthquake engineering assessment methodology has been developed. A detailed nonlinear displacement-based method is a sophisticated calculation providing how to enhance the seismic performance of a building. However, such sophisticated methods are computationally demanding for the assessment of large geographical areas. An earlier method for the assessment for a city has been developed by Applied Technology Council (1996) and FEMA (1997) for buildings in the United States. Using the seismic risk evaluation scheme, the most vulnerable building typologies and urban districts in the event of an earthquake scenario were detected. Following the work of Applied Technology Council (1996) and FEMA (1997), other methods have been further developed based on different approaches and specific objectives. Risk-UE methodology was developed in the year of 2003 for the seismic risk of the European built environment (Mouroux and Brun, 2006). Two methods, the empirical method LM1 and the mechanical method LM2, were proposed. These methods have been widely implemented for the seismic risk assessment in many EU cities. Erdik (2017) proposed an earthquake risk assessment methodology considering and combining three main factors, such as earthquake hazard, fragility/vulnerability, and inventory of assets exposed to hazard. Boutaraa et al. (2018) proposed “RISK-UE” method for the seismic vulnerability assessment at Chlef City (Algeria). Lestuzzi et al. (2017) improved the RISK-UE LM2 method for more accurate seismic damage of URM buildings with stiff floors and RC shear wall buildings. Latcharote et al. (2018) proposed “SLA-IES” tool for seismic loss assessment of approximately 20,000 wooden buildings in Sendai City, Japan using a physics-based model to evaluate building damage and economic loss. Smerzini and Pitilakis (2018) presented a prototype of seismic risk assessment at the city of Thessaloniki, Northern Greece synthesizing earthquake ground motion by 3D physics-based numerical simulations. Saicheur and Hansapinyo (2017) evaluated seismic damage of buildings in Chiang Rai Municipality from hypothetical earthquake scenarios based on HAZUS methodology (FEMA, 2003). The fragility curves of the buildings were developed to evaluate building damage using the capacity spectrum method (CSM) (FEMA, 2015). Recently, the Global Earthquake Model Foundation (GEM) has developed the OpenQuake engine, state-of-the-art open-source software, additionally for global seismic risk modeling (Silva et al., 2020). The seismic damage prediction at a regional scale was proposed for seismic risk assessment in Basel and Naples with a building exposure modeling technique (Diana et al., 2019; Polese et al., 2020).
Since building damage prediction deals with various uncertain factors, a fuzzy logic theory was introduced for seismic damage evaluation. Sen (2010) proposed a fuzzy logic model to evaluate earthquake hazard in Istanbul City Municipality and categorize the seismic risk of 1,249 reinforced concrete buildings from possible earthquakes with Mw 7.0 or over. Deb and Kumar (2014) presented the seismic damage assessment in reinforced concrete buildings using fuzzy logic. The de-fuzzification method was applied to estimate the damage index corresponding to the damage state of the buildings. The damage index was defined from 0 to 1, indicating damage level from nonstructural damage to building collapse. Uncertainties in the risk assessment and decision making on building retrofit in Chiang Rai Municipality were studied by Ketsap et al. (2019) using a fuzzy-based model. They considered seismic hazard, building vulnerability, and building importance as the fuzzy variables.
The membership function is a major component for solving a fuzzy-based problem. It is mostly created based on expert judgment basis, and it is not able to be adapted to new input data resulting in solution accuracy. Also, estimation of the building damage using the CSM and others for many buildings is a time-consuming procedure and contains input uncertainties. Therefore, a combination of fuzzy logic and artificial neural network was proposed to solve a problem, which is called the adaptive neuro-fuzzy inference system (ANFIS). Various researchers have developed prediction models for a possible future earthquake. Kamath and Kamat (2017) presented the ANFIS modeling to predict earthquake magnitude for the Andaman-Nicobar Islands considering four significant features, such as latitude, longitude, depth, and magnitude. The performance of each ANFIS model was measured based on root mean squared error (RMSE). Mirrashid et al. (2016) applied ANFIS to predict seismic moment magnitude for the next earthquake using two seismic indicators, which were the mean annual rate of exceedance from each record and time interval between each record. The correlation factor of 98% showed the accuracy of ANFIS for earthquake magnitude prediction. Ameur et al. (2018) proposed an ANFIS-based ground motion model to predict PGA, PGV, and PSA. A dataset of Next-Generation Attenuation relationships for the Western United States (NGA-West2), including 2,335 records from 580 sites and 137 earthquakes, was used to train the model considering three input parameters, which were Mw, RJB, and Vs30. The mentioned research work indicates the applicability of ANFIS on various prediction models in the earthquake engineering field.
Chiang Mai Municipality is the most densely populated city in Northern Thailand, located near the active Mae Tha fault zone. Hence, surveying and collecting data on different types of buildings in Chiang Mai Municipality in the geographic information system (GIS) has been made for many years. This study aims to extend this survey data to predict building damage using the ANFIS model with various membership types and functions. First, the study performed seismic damage evaluation of buildings using the CSM under various possible earthquake damage cases. Then, the datasets of the building damages were used for training and developing a practical ANFIS model for seismic damage prediction. Using the proposed ANFIS method for the seismic damage, a city with low to moderate earthquake risk, lacking the past damage earthquake records, can initially establish a building damage model with small effort. This is ideal for cities in developing countries where incomplete seismic information is available.
Methodology
Method to Develop an ANFIS Model
There are three main steps in this study, as shown in Figure 1. The first step consists in creating a training dataset of seismic damaged buildings in Chiang Mai Municipality. By using the CSM, the training data comprised of the building damage estimation under different combinations of three input data as (1) 6 earthquake magnitudes, (2) 8 structural types of buildings, and (3) 1,201 distances between a building and the epicenter. The six earthquake magnitudes ranging from Mw 4.0 to Mw 6.5 were considered based on past earthquakes and present fault data in Northern Thailand. The minimum magnitude value of 4.0 is considered as it is the minimum value for which it will be possible to observe structural damage. Using HAZUS methodology (FEMA, 2003), buildings in the studied area were classified into eight structural types as; wooden light-frame building (W1), wooden commercial and industrial building (W2), steel moment-frame building (S1), steel braced-frame building (S2), steel light-frame building (S3), concrete moment-frame building (C1), concrete shear-wall building (C2) and concrete frame building with unreinforced masonry infill walls (C3). With a scope of near-fault earthquake loss estimation, the distance from the earthquake was between 0 and 12 km. The loss at every 0.01 km distance was determined. Hence, the total training data is 57,648 seismic building damage cases.
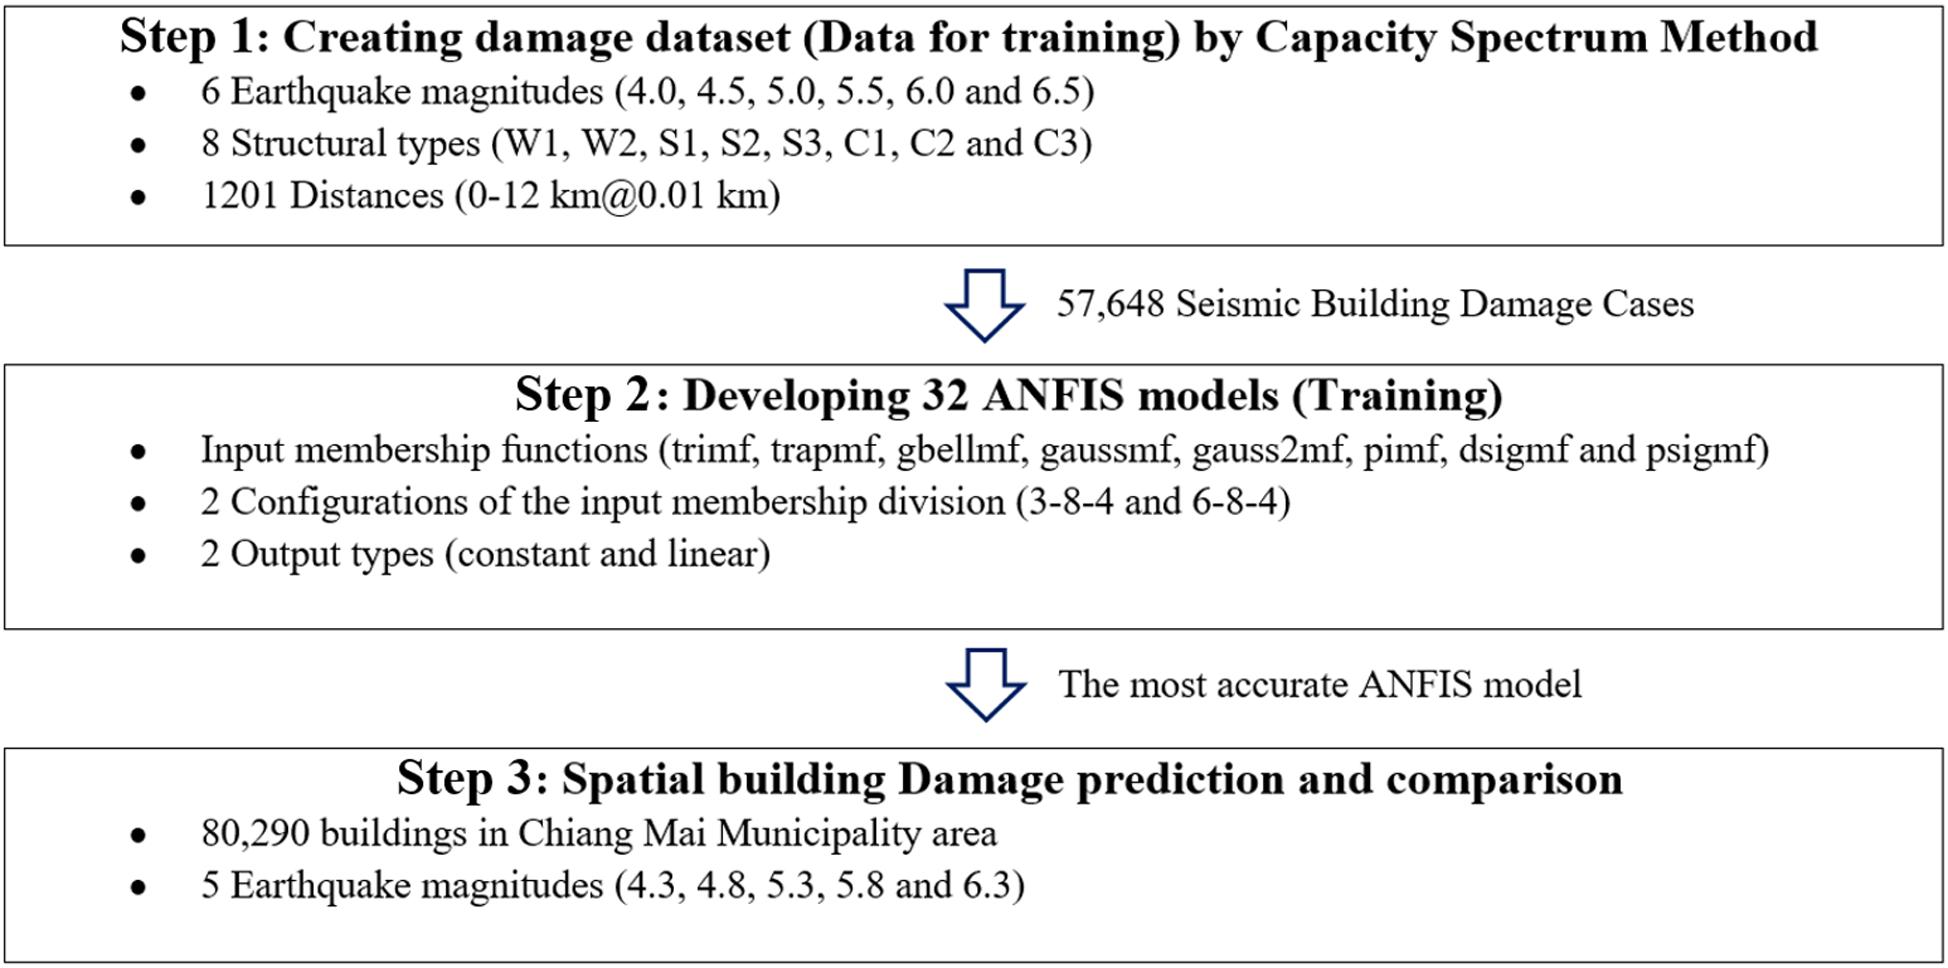
Figure 1. Overview of the study.
The second step of the methodology consists of developing an ANFIS model for seismic damage prediction of buildings using the training data developed in step 1. Based on the fuzzy logic theory, as the variation of input data, the input data is subdivided into several subsets. The so-called “membership function” defines the variation of the data for each subset. In this study, the three input data variations were treated with eight possible geometric membership functions and two-member division configurations. Either constant or nonlinear Sugeno Fuzzy Inference System Model Output membership function (Sugeno, 1985) was applied. Finally, 32 ANFIS models were generated and the ANFIS model with the lowest RMSE was proposed for predicting building damage scenarios. Finally, in step 3, the results of the building damage estimated by the proposed ANFIS model were compared with those computed by the CSM under five different assumed earthquakes.
Case Study
Based on the historical seismicity of the area, Northern Thailand is a seismic-prone region. Chiang Mai Province is located in this region at 310 m height above mean sea level with a latitude of 16 degrees North and a longitude of 99 degrees East. The total area of Chiang Mai Province is approximately 20,107 km2, which is mostly mountains and foothills. In this study, a high seismic risk area, Chiang Mai Municipality, was selected because of a high-density building area with a total area of approximately 40 km2. There is a historic old town in the central area containing many historic buildings. From building data collected in 2018, there were 80,290 buildings in Chiang Mai Municipality, mostly constructed based on pre-code seismic design without seismic consideration. In Table 1, these 80,290 typical buildings are classified into eight structural types by rapid visual screening (RVS) survey based on HAZUS (FEMA, 2003). Some untypical buildings, e.g., Pagoda were excluded in the damage analysis, as it requires special capacity and fragility functions.
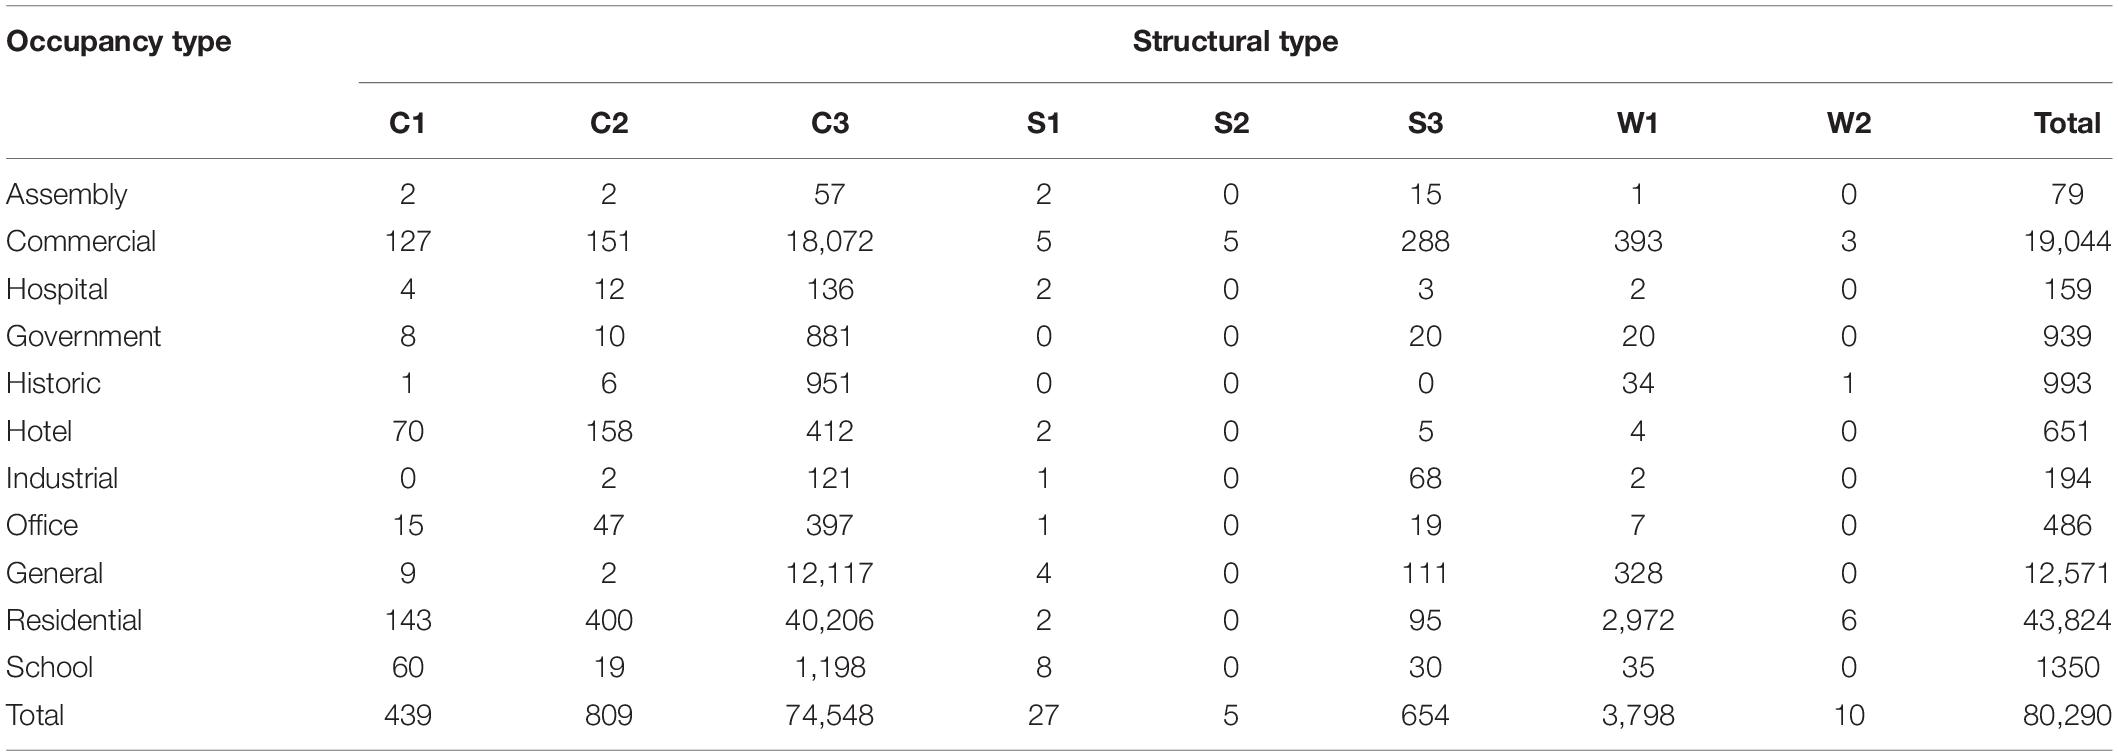
Table 1. Building information in Chiang Mai Municipality.
The most common structural type in the study area is the concrete frame building with unreinforced masonry infill walls (C3), at 74,548 buildings. Second, the number of wooden light-frame buildings (W1) is 3,798. 54.58% of the entire portfolio is residential (43,824 buildings). Next, the number of commercial buildings are19,044. All of these are mostly low-rise buildings (95.62%) with 4.22% of mid-rise buildings and 0.16% of high-rise buildings.
The strike-slip Mae Tha active fault zone was considered for seismic hazard, which is located near to Chiang Mai Municipality, as shown in Figure 2A. This fault zone can cause an earthquake with a magnitude up to Mw 7.0 based on the fault data. The recent significant earthquake along the Mae Tha fault is the 2006 Mae Rim earthquake with a magnitude of Mw 4.6. The considered fault in this study is a secondary fault of the Mae Tha fault, which is closest to Chiang Mai Municipality, as shown in Figure 2B. The location along this fault, which is closest to Chiang Mai Municipality, was selected for the epicenter in this study. With the surface rupture length of 9.69 km, a possible earthquake magnitude would be Mw 6.3 using Eq. 1 for a strike-slip fault proposed by Wells and Coppersmith (1994). Hence, the earthquake scenario with a magnitude of Mw 6.3 was considered for the building damage prediction in step 3 since this secondary fault is closest to this urban area which is in shallow (less than 10 km) as the same characteristics as the 2014 Mw 6.3 Mae Lao earthquake.
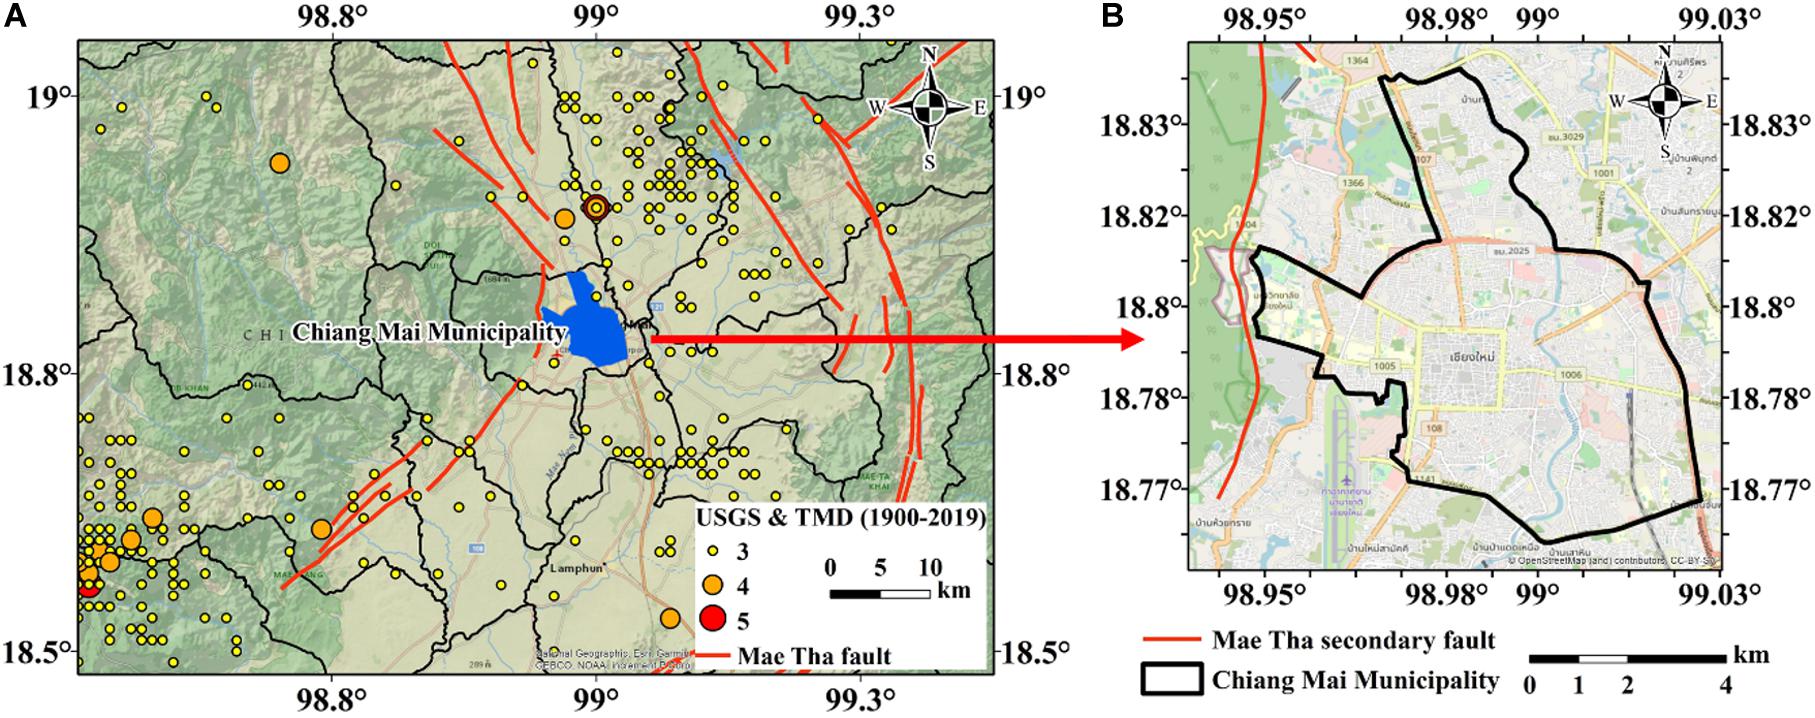
Figure 2. The study area of Chiang Mai Municipality with past earthquake records. (A) Location of the study area and Mae Tha fault zone; (B) enlarged study area.
where Mw, moment magnitude, the strike-slip parameters of a = 5.16 and b = 1.12, and SRL, surface rupture length.
Seismic Building Damage Calculation Using Capacity Spectrum Method
The capacity spectrum method or CSM is a method to calculate the peak response of a building by finding the intersection of the building capacity and the demand spectrum curves. The calculation requires in-depth knowledge in earthquake engineering (Applied Technology Council, 1996). As shown in Figure 3A, the building capacity curve is a plot of lateral load resistance and lateral displacement (V, Δ). The simplified capacity curve is defined by the yield capacity and ultimate capacity points (FEMA, 2003). Up to the yield point (Vy, Δy), the building is considered as elastic behavior and the building behavior is changed to plastic from the yield point to the ultimate point (Vu, Δu). With a provided earthquake magnitude and ground motion prediction equation (GMPE), peak ground acceleration (PGA) at a distance from the epicenter is determined for developing the demand spectrum curve. To obtain the demand spectrum curve, the 5% damped elastic acceleration response spectra Sa-T from the probabilistic seismic hazard analysis (PSHA) in the study area (DPT, 2009) is utilized, as shown in Figure 3B. To compare the response spectra with the capacity curve, the two relationships are transformed into the acceleration displacement response spectra (ADRS) format [i.e., a plot between spectral acceleration (Sa) and spectral displacement of earthquake ground motions (Sd)], as shown in Figure 3C. Finally, the damage that occurred under the earthquake is considered, reducing the elastic demand spectrum to the inelastic demand spectrum. The intersection between the inelastic demand spectrum and the capacity spectrum is known as a performance point that shows the seismic behavior of different buildings (Figure 3C). With the determined spectral displacement from the performance point, the probability of damage can be obtained using the fragility curve shown in Figure 4A. The fragility curve (Figure 4A) shows the cumulative probability of damage in lognormal distribution on the vertical and the spectral displacement on the horizontal axis. Then the discrete probabilities (Figure 4B) in each of the five different damage states are obtained as a, complete; b, extensive; c, moderate; d, slight’ and e, none. Finally, the building damage area is estimated using the complete damage probability (a) with the total building area. The CSM results are used for training and comparisons with the proposed ANFIS model explained in step 1 and step 3 of the study shown in Figure 1.
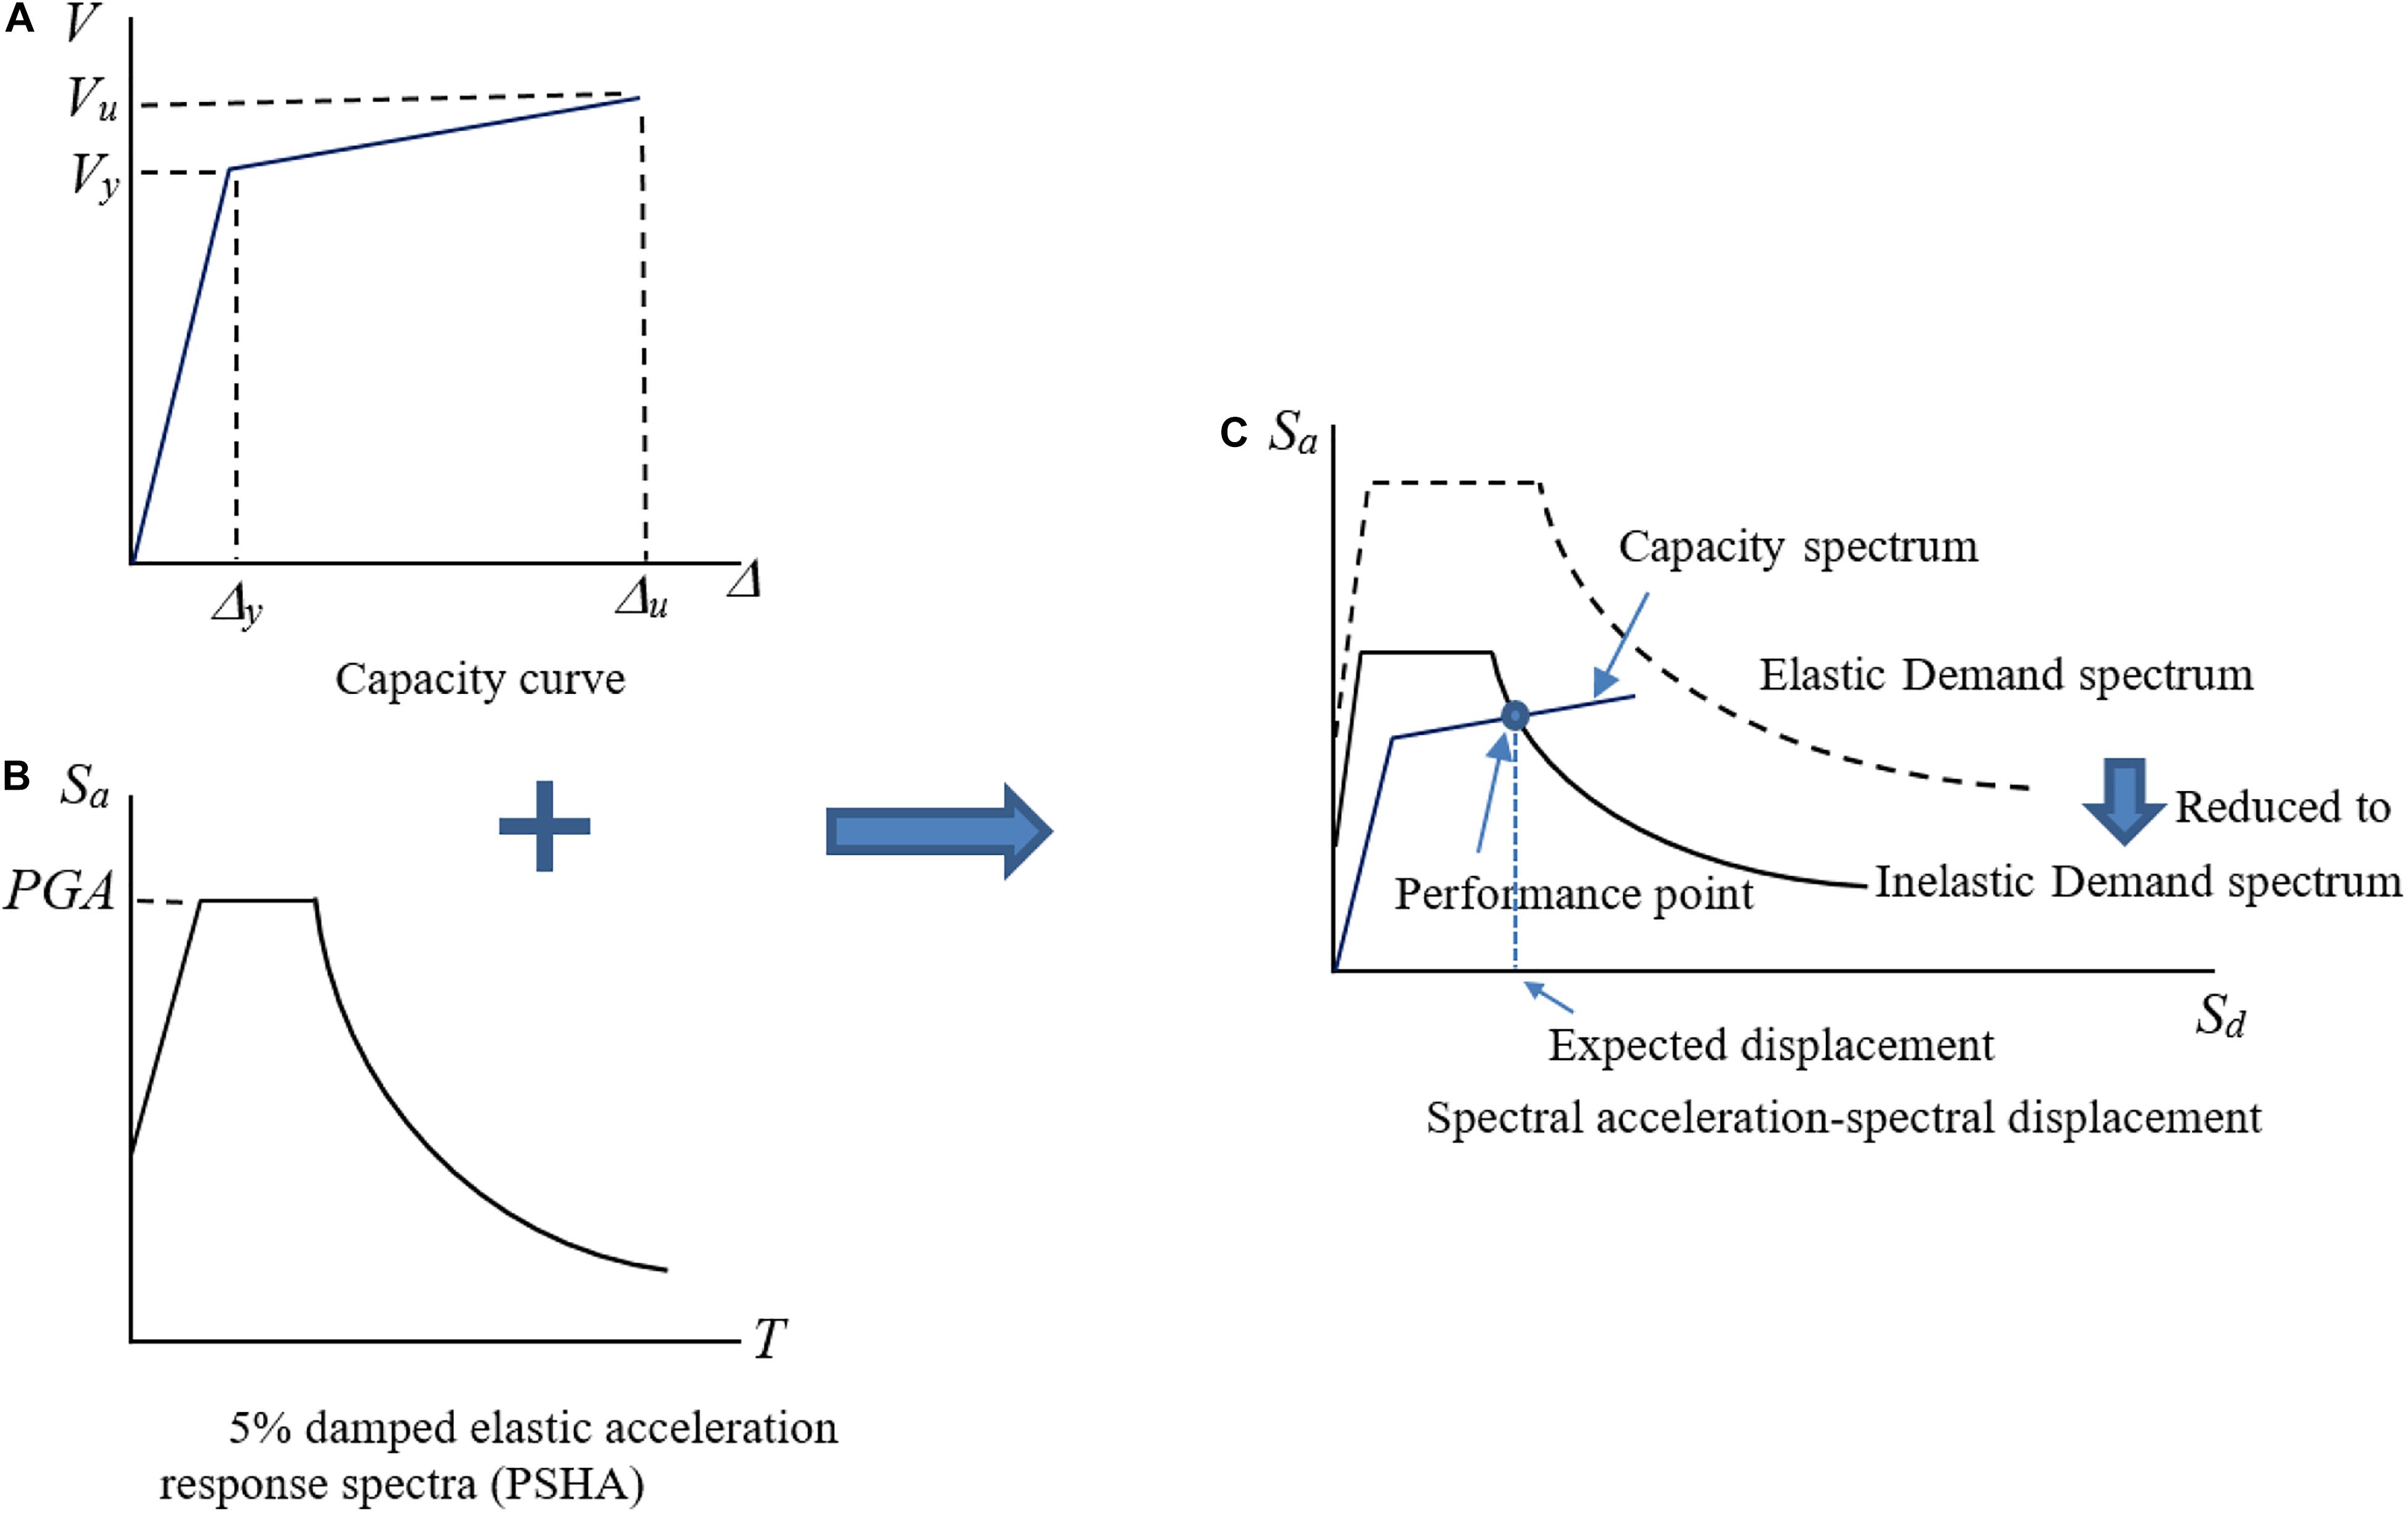
Figure 3. Performance point determination (FEMA, 2003). (A) Capacity curve; (B) 5% damped elastic acceleration response spectra (PSHA); (C) spectral acceleration-spectral displacement.
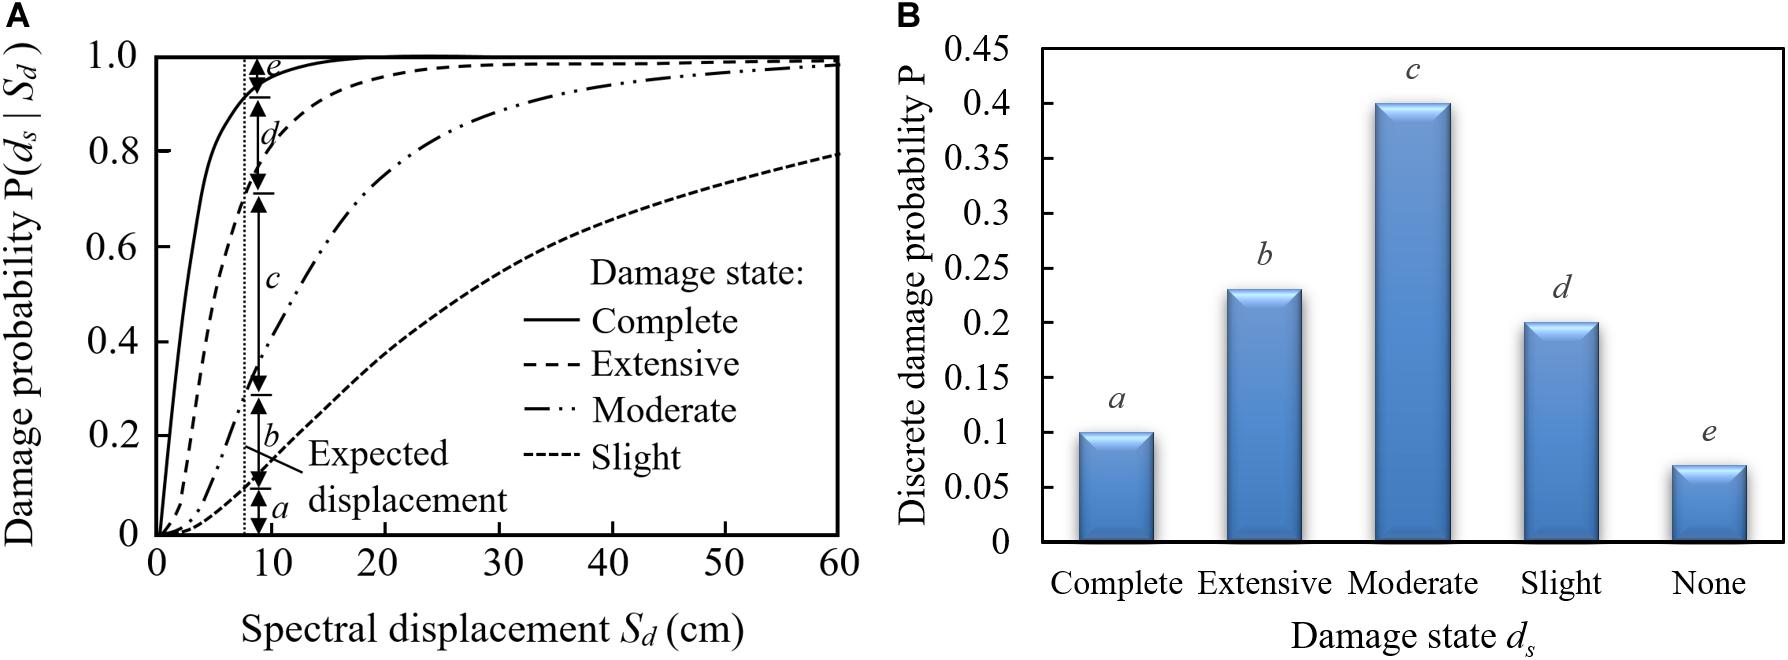
Figure 4. Fragility curves of five damage states (FEMA, 2003). (A) Fragility curve of a building; (B) discrete damage probabilities.
In this study, the constant depth of the earthquake epicenter was assumed to be 10 km for all earthquake magnitudes which is a limitation in this study that can be completely removed using extensively proper scaling laws. Since the active fault near the urban area was considered in this study, the near-fault ground motion effect must be considered (Alavi and Krawinkler, 2000; Zeng et al., 2016). The PGA was then estimated using the BSSA14 GMPE proposed by Boore et al. (2014). The BSSA14 model is a part of the NGA-West2 program. The NGA-West2 program was developed using a database that included many near-fault ground motion recordings (FEMA, 2018). For the assumed earthquake events, the BSSA14 model with the median value shows the PGA in the range of 0.1–0.4 g considering the site amplification effects with average shear wave velocity from surface to 30-m depth (Vs30) of 330 m/s. If the larger area than Chiang Mai Municipality is a case study, the variation of the site amplification effects should be considered (Bonilla et al., 1997; De Risi et al., 2019).
Development of Adaptive Network-Based Fuzzy Inference System
Adaptive network-based fuzzy inference system is a tool combining the benefit and computation of fuzzy logic and neural network into a single technique. The fuzzy logic can make logical decisions in If-Then rules that are consistent with the human mind. In addition, it can judge an unclear problem containing a certain degree of right/wrong. However, the disadvantage of fuzzy logic is that the structure must be defined by an expert and it is not able to learn on its own. For the artificial neural network, the computational model is dynamic and can learn to improve its own structure, but its results are only answers without a logical reason. Therefore, the integrated ANFIS can improve its structure based on interconnected elements as an artificial neural network and make decisions based on logical reasoning as the fuzzy logic in order to transform given inputs into the desired output using neural network processing and information. The ANFIS was originally presented by Jang (1993), as shown as five layers in Figure 5 (for two input variables x1 and x2). The ANFIS architecture presents a circle as a fixed node and a square as an adaptive node.
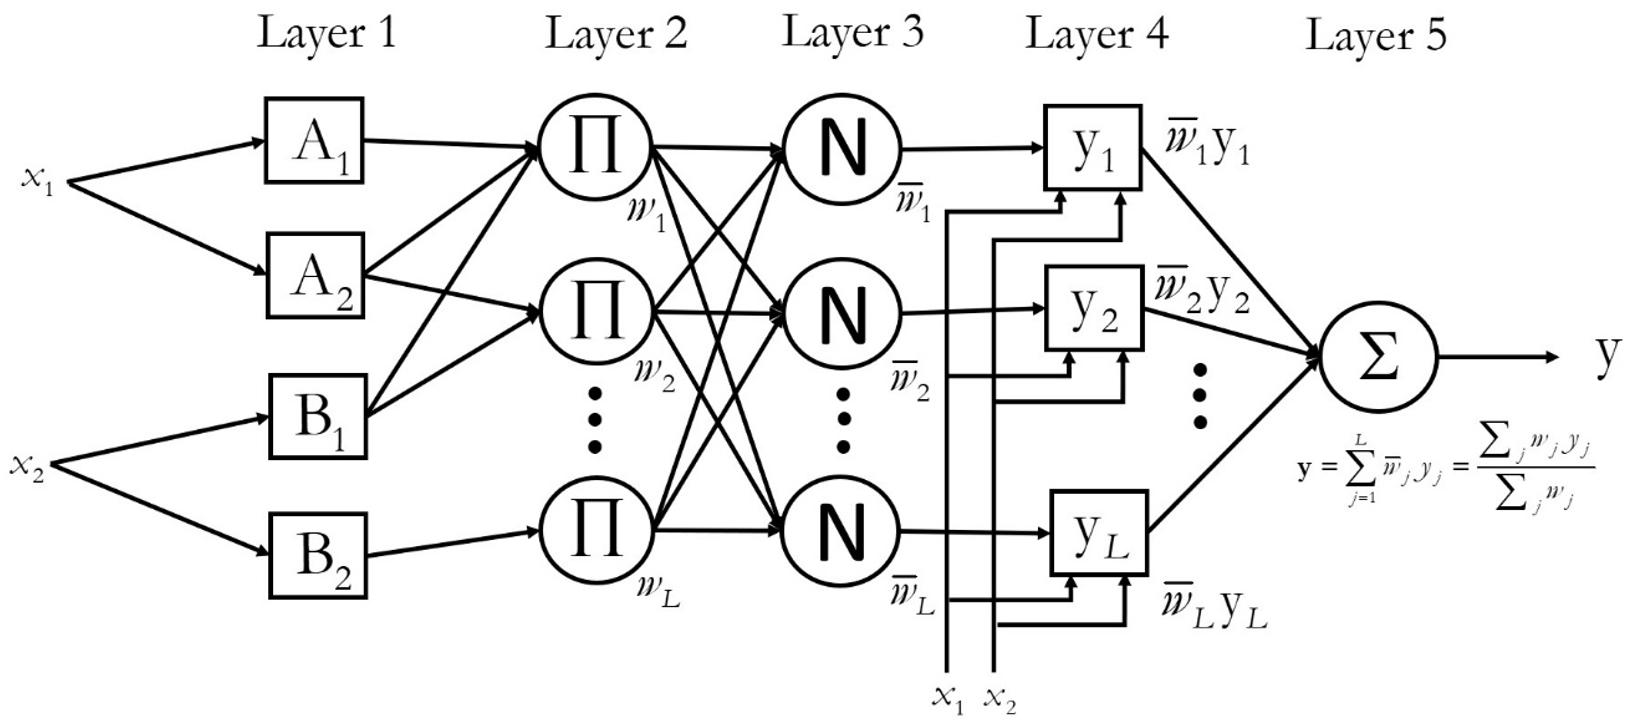
Figure 5. ANFIS architecture.
Training the ANFIS Model
Creating the training dataset of the seismic damage of buildings is the first step of this study, as shown in Figure 1. The seismic damage of buildings was calculated using the CSM (see section “Seismic Building Damage Calculation Using Capacity Spectrum Method”). Different possible earthquake scenarios containing three input parameters (earthquake magnitude, structural type, and site distance) were analyzed for the building damage. The input variables are explained below.
• Six earthquake magnitudes: the parameter represents the severity of the earthquake varied from low to strong excitations (Mw 4.0, Mw 4.5, Mw 5.0, Mw 5.5, Mw 6.0, and Mw 6.5).
• Eight structural types: W1, W2, S1, S2, S3, C1, C2, and C3 are classified by HAZUS (FEMA, 2003).
• One thousand two hundred and one distances: the distance is a length between the earthquake epicenter and a building. The distance was ranged between 0 to 12 km. The maximum distance of 12 km. represents a length covering all buildings in Chiang Mai Municipality. The distances at every 10 m were analyzed. Hence, there are 1,201 cases in total.
Considering the combination of the three variables, the CSM seismic building damage analyses are comprised of 6 × 8 × 1,201 = 57,648 damage data. The dataset of complete damage buildings output is used for training the ANFIS model.
ANFIS Model for Seismic Building Damage Prediction
Judgments on the damage level of a building struck by an earthquake could be uncertain. This unclear measurement is because the damage level depends on various factors but can be grouped into two basic parameters as (1) vibration level at the building foundation and (2) building resistance. In addition, the complex nature of dynamic response increases this vagueness. Two near-identical buildings under the same earthquake were observed with different damage (Saicheur and Hansapinyo, 2016). Hence, with an uncertain input, it is not easy to precisely quantify the damage. In this study, the vibration level is represented by the magnitude (x1) and distance (x2). For the seismic resistance, structural types (x3) are defined. The three inputs (x1, x2, x3) are cross operated to obtain various output scenarios, as shown in Figure 5. To consider the uncertainty of each input, based on the fuzzy logic theory, a geometric membership function is introduced (Zadeh, 1965). With some knowledges of the seismic uncertainties, this study introduced eight possible geometric input membership functions, e.g., Trimf, Trapmf, Gbellmf, Gaussmf, Gauss2mf, Pimf, Dsigmf, and Psigmf. For each geometric input membership function, two different configuration models were applied, as shown in Figure 6 for the triangular membership function or Trimf. One was 3-8-4 Trimf ANFIS model (Figure 6). The first number is the earthquake magnitude which represents three levels of the magnitude: Light, Moderate, and Strong ranged between Mw 4.0 and Mw 6.5. For the second number, it is the eight structural types: W1, W2, S1, S2, S3, C1, C2, and C3. The last number is 4, describing four levels of distance between the epicenter and building: Near, Quite Close, Quite Far, and Far with the distance from 0 to 12 km. The other model with the higher refined division of the magnitude, was 6-8-4 Trimf ANFIS model (Figure 6). The first number of 6 represents the magnitudes of Minor, Light, Moderate, Strong, Major, and Great. The initially assigned membership function and range between divisions are defined as the square node Layer 1 in the ANFIS architecture shown in Figure 5.
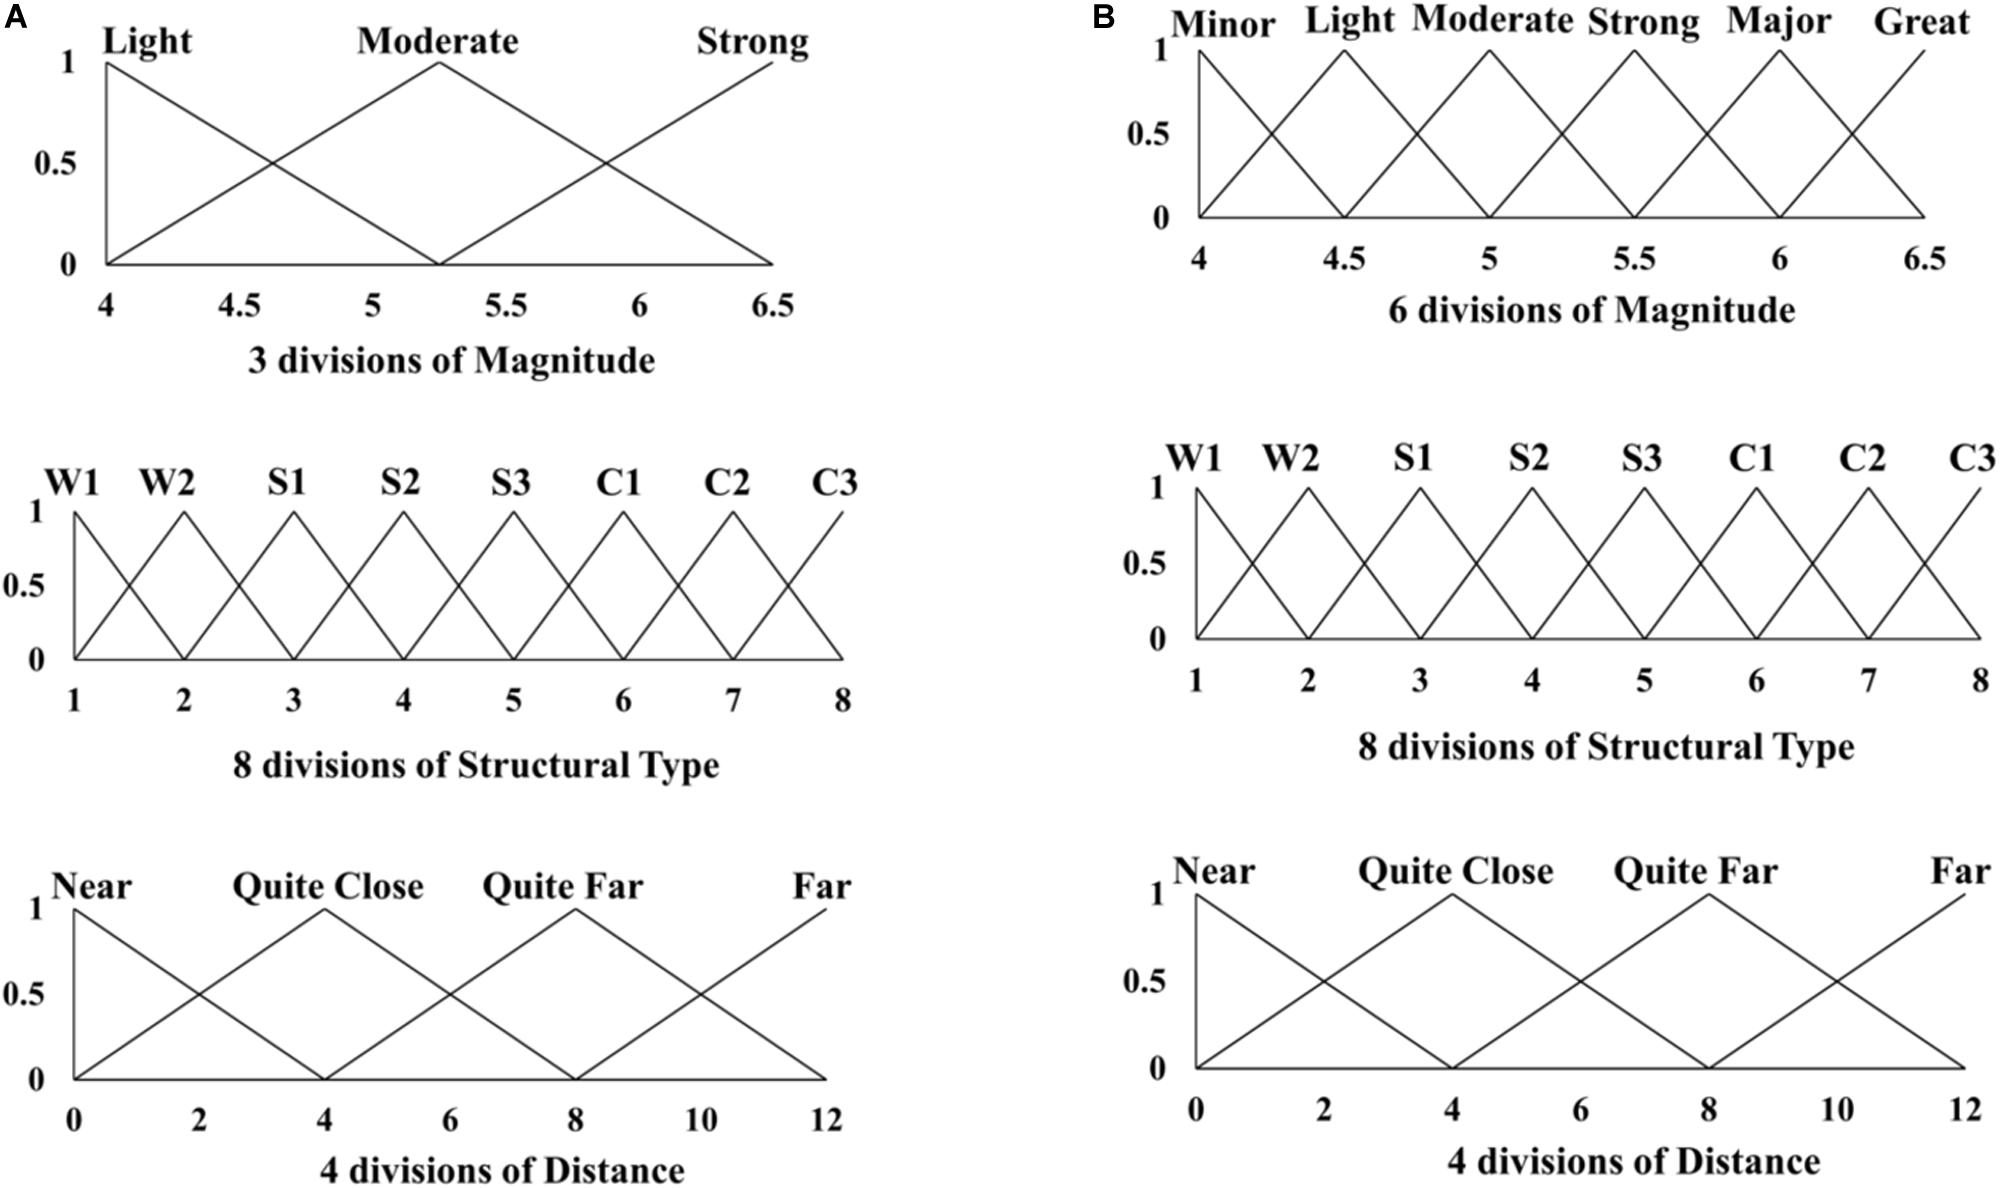
Figure 6. Triangular membership function (Trimf model) with two configurations of division. (A) 3-8-4 model (Trimf membership function); (B) 6-8-4 model (Trimf membership function).
To obtain the output, the fuzzy inference system was applied. A neuro-fuzzy designer in MATLAB was used as a development tool in this study which provides a built environment for constructing various ANFIS models. The tool can tune the initially assigned membership function parameters based on Sugeno-type fuzzy inference systems (Sugeno, 1985), Layer 2 and 3 in Figure 5. Two output membership functions; constant and linear were implemented (Layer 4 in Figure 5). Using the training system of the neural network, the structure of the inference systems in the fuzzy machine could be automatically optimized.
From the eight membership functions, two configurations of the membership division and two output types, 32 ANFIS models were obtained, as shown in Figure 1. All the ANFIS models were re-examined with the entire 80,290 building dataset in Chiang Mai Municipality and the best ANFIS model was defined with the lowest RMSE calculated by Eq. 2.
Where XANFIS and XCSM are the damaged areas determined by the ANFIS model and the CSM, respectively. n is number of data (n = 80,290).
Figure 7 displays the RMSE value (in logarithmic scale) of each model. It indicates that all the models have a small error. The linear output models have the lower RMSE than that of the constant output models. In addition, the more refined 6-8-4 ANFIS models have the lower RMSE than that of the 3-8-4 ANFIS models. The most accurate ANFIS model is linear Gaussmf 6-8-4 with the RMSE of 0.000573. Then, this model was used to predict the spatial seismic building damage in Chiang Mai Municipality.

Figure 7. RMSE of ANFIS model.
CSM and ANFIS Comparison of Seismic Building Damage
To confirm the validity of the proposed ANFIS model, five possible earthquakes in Chiang Mai Municipality area as described in section “Case Study” was assumed, and the spatial seismic building damages were determined by the CSM and the proposed ANFIS model. As shown in Table 2, the damage building area estimated by the two approaches is very similar. The damage estimated by the CSM tends to give a little higher value. Under the assumed Mw 6.3 earthquake (maximum credible earthquake), as an example, Figure 8 shows the spatial distribution of the complete damage ratio of buildings in Chiang Mai Municipality map determined by CSM and the proposed ANFIS model. The damage ratio is defined as the damaged building area divided by total building area. The complete building damage distribution of the two results are similar. For more detailed illustration, Figure 9 shows the comparison of building damage in Chiang Mai old town. The difference of building damage was observed at a latitude of 18.794 and a longitude of 98.988. In addition, the tabulated comparison regarding both figures is illustrated in Table 3 to show the individual damage area classified by the structural type.
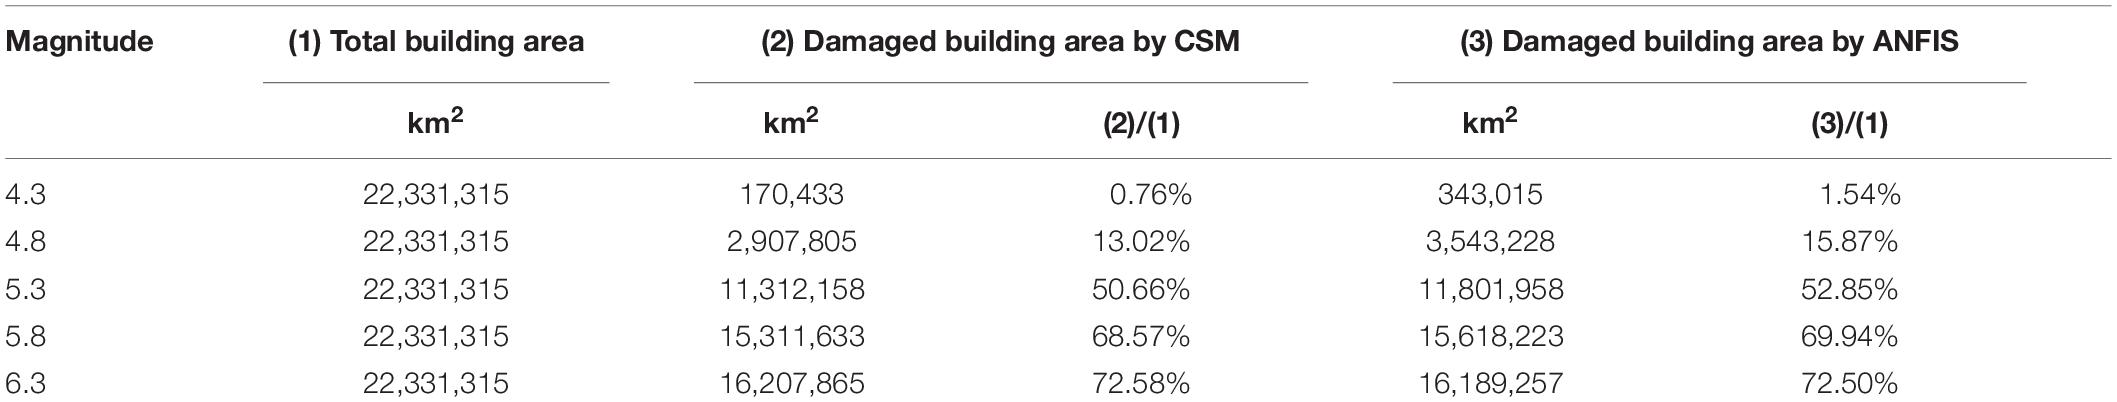
Table 2. Estimation of damaged building area under five possible earthquakes by CSM and ANFIS.
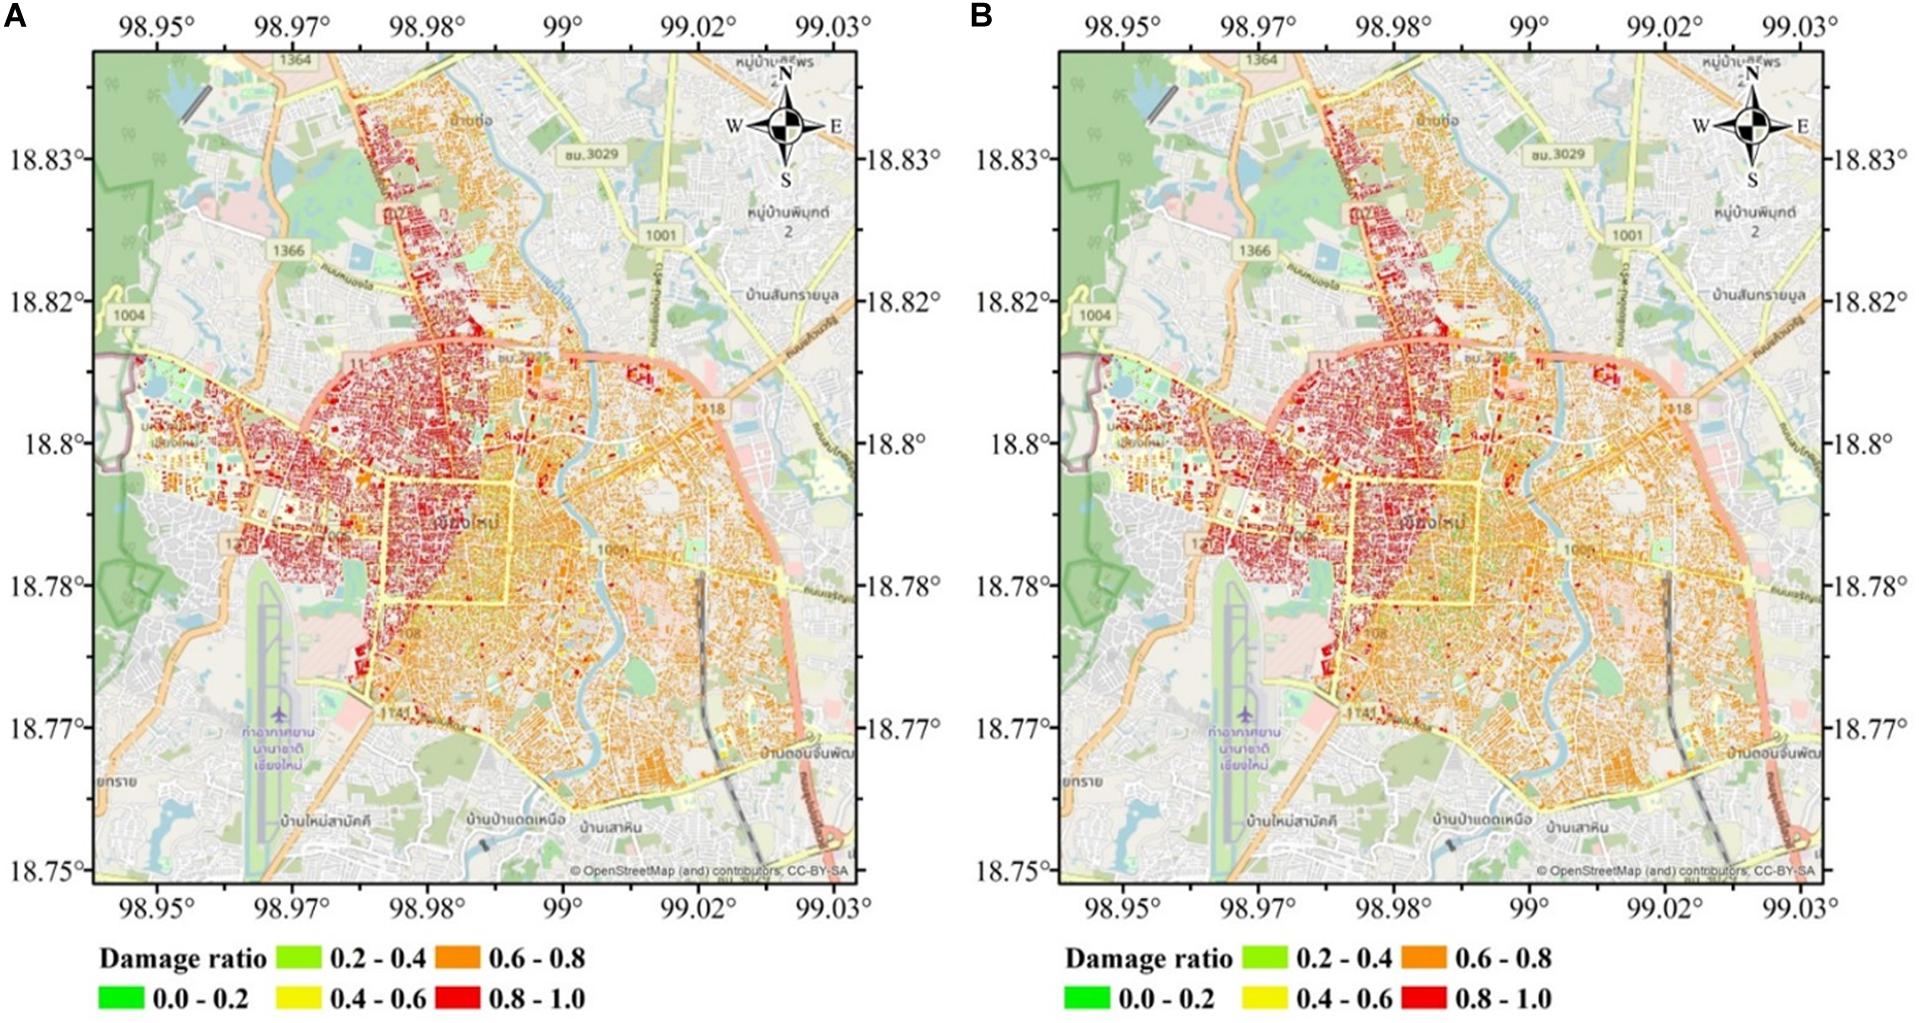
Figure 8. Damage ratio of complete damage of buildings under the assumed Mw 6.3 earthquake. (A) by CSM; (B) by the proposed ANFIS model.
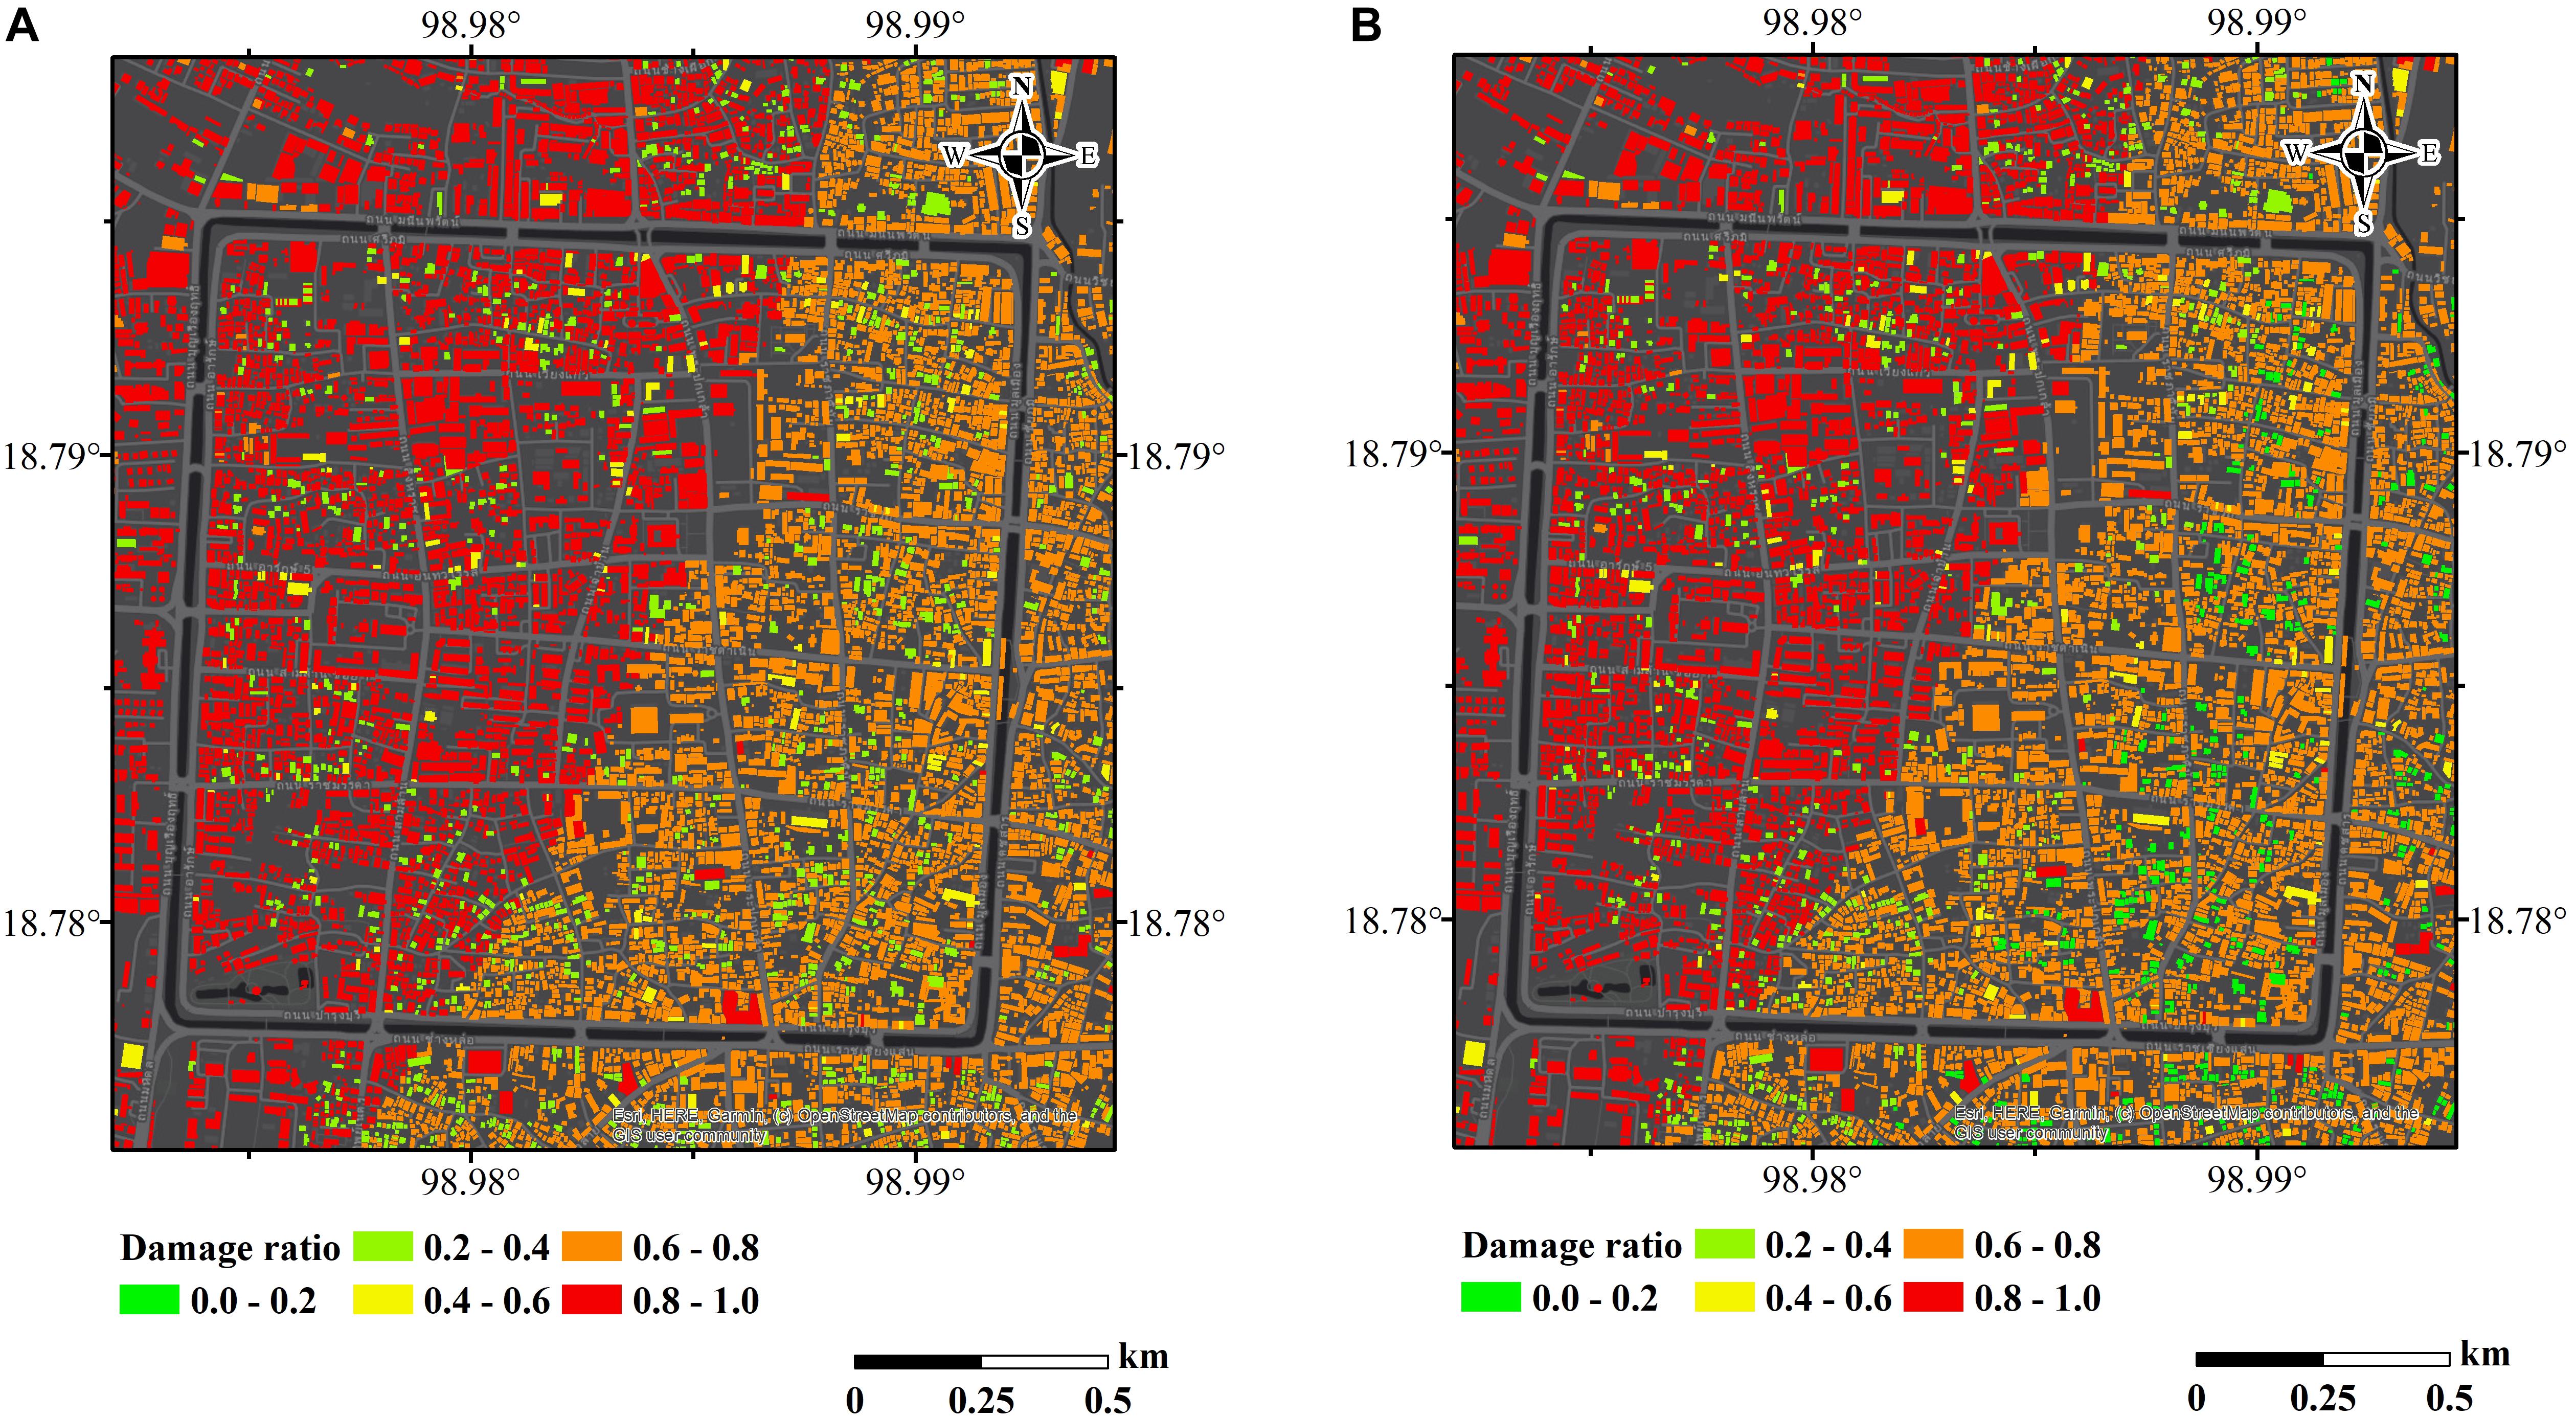
Figure 9. Comparison of building damages between CSM and ANFIS in Chiang Mai old town. (A) by CSM (B) by the proposed ANFIS model.
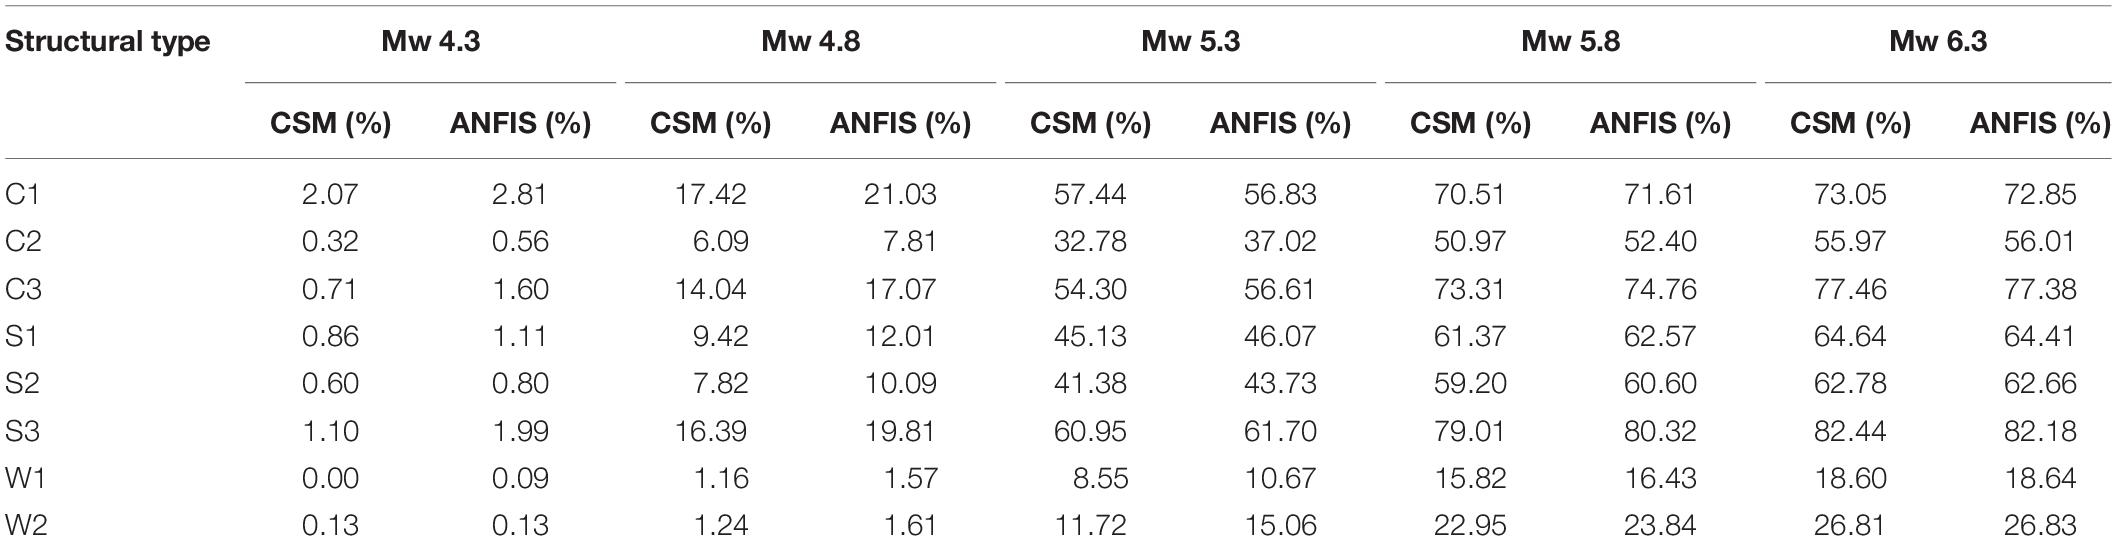
Table 3. Comparison of damaged building area classified by structural type between CSM and ANFIS.
Conclusion
Capacity spectrum method, although a powerful tool to calculate the seismic building damage, is complicated and time-consuming for a large-scale building damage assessment. In addition, the inputs for the assessment involve many factors and contain uncertainties. As an alternative approach, this research proposed an ANFIS model for the damage prediction. Hence, some uncertainties, e.g., dynamic properties, near or distance-earthquake effect, characteristics of the earthquake wave, soil condition, etc., are inherently treated in the fuzzy model. First, the study performed seismic damage evaluation of buildings using the CSM to create the datasets of building damage under various possible earthquake scenarios considering three input data as earthquake magnitudes, structural building types, and distances. Then, the datasets were used for training and developing a practical ANFIS model for seismic damage prediction.
After training a total of thirty-two ANFIS models, the most accurate one is Linear Gaussmf 6-8-4 and proposed for predicting the building damage. To confirm the validity of the proposed ANFIS model, five possible earthquakes with magnitude from the lowest, but damageable earthquake of Mw 4.3 to the maximum credible earthquake of Mw 6.3 earthquake in Chiang Mai Municipality was assumed and the spatial seismic damage of 80,290 buildings was determined by the CSM and the proposed ANFIS model. Then, the damage assessments from the two approaches were compared. The amount of damaged buildings from the five earthquakes obtained from the two approaches is similar.
The article is mainly aimed to implement the ANFIS for the seismic building damage prediction with a single depth, a single location, and various magnitudes. Hence, further study to consider more possible locations including near and distance earthquakes are required. The proposed ANFIS model provides two main benefits; (1) input uncertainties can be treated in the fuzzy logic functions and the function can be further adapted with a further new correct training dataset, e.g., real earthquake damage, and (2) an alternative approach with machine learning through the neuro-network system. Using the proposed ANFIS method for the seismic damage, a city with low to moderate earthquake risk, lacking the past damage evidence from a real earthquake, can initially establish a building damage model with small effort (as explained in section “ANFIS Model for Seismic Building Damage Prediction”), with the use of fuzzy logic and neuro-network. Especially in developing countries, it is generally noticed the lack of a complete set of earthquake data, e.g., earthquake records, fault location, building data, soil condition, etc. However, the more acquired earthquake data, if any provided in the future, can be used for the training to obtain more realistic results.
Data Availability Statement
All datasets presented in this study are included in the article.
Author Contributions
CH: conceptualization and writing for the original draft. PL: methodology, validation, and review. SL: review and editing. All authors contributed to the article and approved the submitted version.
Funding
The authors would like to acknowledge the financial supports granted by Chiang Mai University, TRF Research Scholar (RSA6280039), TRF Senior Research Scholar (RTA6280012), and Research Grant for New Scholar (MRG6280228).
Conflict of Interest
The authors declare that the research was conducted in the absence of any commercial or financial relationships that could be construed as a potential conflict of interest.
Acknowledgments
The authors would like to acknowledge the GIS graphical support provided by Mr. Akachai Ketsap.
References
Alavi, B., and Krawinkler, H. (2000). “Consideration of near-fault ground motion effects in seismic design,” in Proceedings of the 12th World Conference on Earthquake Engineering, (Auckland).
Ameur, M., Derras, B., and Zendagui, D. (2018). Ground motion prediction model using adaptive neuro-fuzzy inference systems: an example based on the NGA-West2 data. Pure Appl. Geophys. 175, 1019–1034. doi: 10.1007/s00024-017-1743-3
Applied Technology Council. (1996). Seismic Evaluation and Retrofit of Concrete Buildings. ATC40 Report. Redwood City, CA: Applied Technology Council.
Bonilla, L. F., Steidl, J. H., Lindley, G. T., Tumarkin, A. G., and Archuleta, R. J. (1997). Site amplification in the San Fernando Valley, California: variability of site-effect estimation using the S-wave, coda, and H/V methods. Bull. Seismological Soc. Am. 87, 710–730.
Boore, D. M., Stewart, J. P., Seyhan, E., and Atkinson, G. M. (2014). NGA-West2 equations for predicting PGA, PGV, and 5% damped PSA for shallow crustal earthquakes. Earthquake Spectra 30, 1057–1085. doi: 10.1193/070113EQS184M
Boutaraa, Z., Negulescu, C., Arab, A., and Sedan, O. (2018). Buildings vulnerability assessment and damage seismic scenarios at urban scale: application to chlef city (Algeria). KSCE J. Civil Eng. 22, 3948–3960. doi: 10.1007/s12205-018-0961-2
Diana, L., Thiriot, J., Reuland, Y., and Lestuzzi, P. (2019). Application of association rules to determine building typological classes for seismic damage predictions at regional scale: the case study of basel. Front. Built Environ. 5, doi: 10.3389/fbuil.2019.00051
Deb, S. K., and Kumar, G. T. (2014). “Seismic damage assessment of reinforced concrete buildings using fuzzy logic,” in Proceedings of the 13th World Conference on Earthquake Engineering, (Vancouver).
De Risi, R., Penna, A., and Simonelli, A. L. (2019). Seismic risk at urban scale: the role of site response analysis. Soil Dynamic Earthquake Eng. 123, 320–336. doi: 10.1016/j.soildyn.2019.04.011
Dpt. (2009). Standard for Building Design to Resist Vibration of Earthquake (DPT.1302-52). Bangkok: Department of Public Works and Town & Country Planning.
Erdik, M. (2017). Earthquake risk assessment. Bull. Earthquake Eng. 15, 5055–5092. doi: 10.1007/s10518-017-0235-2
Fema. (1997). NEHRP Guidelines For Seismic Rehabilitation Of Buildings, Report No. FEMA-273. Washington, DC: Federal Emergency Management Agency.
Fema. (2003). Multi-Hazard Loss Estimation Methodology: Earthquake Model, HAZUS-MH Technical Manual. Washington, DC: Federal Emergency Management Agency.
Fema. (2015). Rapid Visual Screening of Buildings for Potential Seismic Hazards: Supporting Documentation. Washington, DC: Federal Emergency Management Agency.
Fema. (2018). Seismic Performance Assessment of Buildings: Volume 1-Methodology. Washington, DC: Federal Emergency Management Agency.
Jang, J. S. (1993). ANFIS: adaptive-network-based fuzzy inference system. IEEE Trans. Syst. Man Cybern. 23, 665–685. doi: 10.1109/21.256541
Kamath, R. S., and Kamat, R. K. (2017). Earthquake magnitude prediction for Andaman-Nicobar Islands: Adaptive neuro fuzzy modeling with fuzzy subtractive clustering approach. J. Chem. Pharm. Sci. JCHPS. 10, 1228–1233.
Ketsap, A., Hansapinyo, C., Kronprasert, N., and Limkatanyu, S. (2019). Uncertainty and fuzzy decisions in earthquake risk evaluation of buildings. Eng. J. 23, 89–105. doi: 10.4186/ej.2019.23.5.89
Latcharote, P., Terada, K., Hori, M., and Imamura, F. (2018). A prototype seismic loss assessment tool using integrated earthquake simulation. Int. J. Disaster Risk Reduct. 31, 1354–1365. doi: 10.1016/j.ijdrr.2018.03.026
Lestuzzi, P., Podestà, S., and Luchini, C. (2017). Validation and improvement of Risk-UE LM2 capacity curves for URM buildings with stiff floors and RC shear walls buildings. Bull. Earthquake Eng. 15, 1111–1134. doi: 10.1007/s10518-016-9981-9
Mirrashid, M., Givehchi, M., Miri, M., and Madandoust, R. (2016). Performance investigation of neuro-fuzzy system for earthquake prediction. Asian J. Civil Eng. BHRC. 17, 213–223.
Mouroux, P., and Brun, B. L. (2006). Presentation of RISK-UE project. Bull. Earthquake Eng. 4, 323–339. doi: 10.1007/s10518-006-9020-3
Polese, M., Ludovico, M. D., d’Aragona, M. G., Prota, A., and Manfredi, G. (2020). Regional vulnerability and risk assessment accounting for local building typologies. Int. J. Disaster Risk Reduct. 43:101400. doi: 10.1016/j.ijdrr.2019.101400
Saicheur, K., and Hansapinyo, C. (2016). Structural repair prioritization of buildings damaged after earthquake using fuzzy logic model. J. Disaster Res. 11, 559–565. doi: 10.20965/jdr.2016.p0559
Saicheur, K., and Hansapinyo, C. (2017). Seismic loss estimation and reduction after structural rehabilitation in Chiang Rai City. Walailak J. Sci. Technol. 14, 485–499.
Sen, Z. (2010). Rapid visual earthquake hazard evaluation of existing buildings by fuzzy logic modelling. Expert Syst. Appl. 37, 5653–5660. doi: 10.1016/j.eswa.2010.02.046
Silva, V., Amo-Oduro, D., Calderon, A., Costa, C., Dabbeek, J., Despotaki, V., et al. (2020). Development of a global seismic risk model. Earthquake Spectra doi: 10.1177/8755293019899953
Smerzini, C., and Pitilakis, K. (2018). Seismic risk assessment at urban scale from 3D physics-based numerical modeling: the case of Thessaloniki. Bull. Earthquake Eng. 16, 2609–2631. doi: 10.1007/s10518-017-0287-3
Thai Meteorological Department. (2019). Available online at: https://earthquake.tmd.go.th/home.html (accessed May 29, 2019).
Wells, D. L., and Coppersmith, K. J. (1994). New empirical relationships among magnitude, rupture length, rupture width, rupture area, and surface displacement. Bull. Seismological Soc. Am. 84, 974–1002.
Keywords: earthquake, building damage, neural network, fuzzy, ANFIS, uncertainty
Citation: Hansapinyo C, Latcharote P and Limkatanyu S (2020) Seismic Building Damage Prediction From GIS-Based Building Data Using Artificial Intelligence System. Front. Built Environ. 6:576919. doi: 10.3389/fbuil.2020.576919
Received: 27 June 2020; Accepted: 22 September 2020;
Published: 15 October 2020.
Edited by:
Raffaele De Risi, University of Bristol, United KingdomCopyright © 2020 Hansapinyo, Latcharote and Limkatanyu. This is an open-access article distributed under the terms of the Creative Commons Attribution License (CC BY). The use, distribution or reproduction in other forums is permitted, provided the original author(s) and the copyright owner(s) are credited and that the original publication in this journal is cited, in accordance with accepted academic practice. No use, distribution or reproduction is permitted which does not comply with these terms.
*Correspondence: Panon Latcharote, cGFub24ubGF0QG1haGlkb2wuYWMudGg=; cGFub24udHVAZ21haWwuY29t