 Aiko Furukawa
 Keiya Masuda
 Junji Kiyono
- Department of Urban Management, Graduate School of Engineering, Kyoto University, Kyoto, Japan
The collapse of masonry buildings has caused numerous fatalities during past earthquakes. To reduce casualties due to earthquakes, the reinforcement of masonry buildings is necessary. Since masonry buildings are still used due to the low cost of the building materials, cheap reinforcement measures are desirable. Therefore, this study investigates the use and shape of the interlocking blocks instead of the regular rectangular blocks to increase the strength of masonry buildings without using expensive reinforcing materials. First, diagonal compression tests of masonry walls made of interlocking blocks with various shapes under different support conditions were conducted. Regarding the block shapes, two types of I-shaped blocks and two types of hourglass-shaped blocks were compared. For the support conditions, glued and contact conditions were compared. Next, finite element analysis was conducted to understand the mechanism. From the experiment and the finite element analysis, a similar tendency was observed. The walls made of I-shaped blocks with a right angle have less strength than the I-shaped block walls with an obtuse angle and the two hourglass-shaped block walls. It was also found that the support condition has a slight effect on the results of the I-shaped block wall with a right angle but large effect on the results of the other three block walls where the wall under the contact condition has larger strength than the wall under the glued condition. The strain was locally concentrated where the adjacent blocks interlock with each other or the block interlocks with the jig, and failure occurred at the area where the strain was concentrated. Strength can be increased by changing the block shape with less interlocking effect such as the I-shaped block walls with an obtuse angle or hourglass-shaped block walls. However, the displacement increases due to the dislocation and rotation of blocks as the interlocking effect decreases.
Introduction
The collapse of masonry buildings has caused numerous fatalities during earthquake events (Coburn and Spence, 2002). Approximately 60% of deaths due to natural disasters in the world have been caused by earthquakes (Giardini et al., 2003), and the majority of the deaths due to earthquakes have occurred by the collapse of low-strength masonry structures often built in developing areas (Office for the Coordination of Humanitarian Affairs [OCHA], 2015).
Masonry structures are very vulnerable to earthquake activity. However, since the masonry structures are inexpensive and easy to construct and have excellent heat insulation and moisture retention, they are still being built around the world, especially in developing regions. In order to reduce casualties, it is important to improve the seismic resistance of masonry structures, and there is a need for an inexpensive seismic reinforcement method that is easy to implement.
Many studies have investigated methods for reinforcing masonry structures. A reinforcement method using vertical steel ties (Darbhanzi et al., 2014), a method using fiber-reinforced plastics (Marcari et al., 2007), one using scrapped tires as tension materials (Turer and Golalm, 2011), and a retrofitting method using PP bands (polypropylene bands), which are commonly used for packing (Navaratnarajah et al., 2009), have been proposed. These reinforcement methods require reinforcing materials but are readily available and easy to implement.
A study on a reinforcement method that does not use any reinforcing materials is also being conducted. The method using interlocking bricks expects to achieve better seismic performance than conventional rectangular bricks simply by stacking interlocking bricks without using reinforcing materials. If the seismic performance of the building can be improved simply by using the interlocking bricks without any reinforcing materials, it is possible to improve the earthquake resistance of the building at a low cost since the producing cost of interlocking bricks can be reduced by mass production. Therefore, there is a possibility that the interlocking bricks can contribute to reduce the casualty due to the collapse of masonry buildings during earthquakes.
Sanada et al. (2006) performed in-plane loading tests of a masonry wall with rectangular parallelepiped bricks and a masonry wall with I-shaped bricks and examined the effect of interlocking to improve seismic resistance. The result confirmed that the masonry wall with I-shaped bricks had a lateral strength more than 1.5 times that of the masonry wall with rectangular bricks. However, in the masonry wall with I-shaped bricks, local stress concentration occurred at the interlocking part, and it was reported that the yield strength greatly reduces once the deformation angle exceeds about 1/200. Although the effect of interlocking was limited, successful improvement of the lateral strength was reported. Sanada et al. (2008) then proposed new masonry infill walls using ductile interlocking blocks which resist out-of-plane load by the interlocking mechanism between blocks. Quasi-static loading test of the specimens in the in-plane and out-of-plane directions were carried out. It was found that the installation of infills significantly improved the seismic performance of the existing frames in the both in-plane and out-of-plane directions. Next, Sanada et al. (2010) proposed a wooden interlocking block infill to prevent the collapse of vulnerable RC buildings. A series of structural tests were performed and it was confirmed that the infill significantly improved the seismic performance of the entire frame. Since the disadvantage of the interlocking block is the stress concentration, the ductile interlocking blocks and wooden interlocking blocks with high tensile strength may be one solution to overcome the failure caused by the stress concentration. The effect of block shape on the seismic performance has not been considered in their researches.
Researches have been conducted on new interlocking blocks and bricks made of new material. Ali et al. (2012) developed a new interlocking block made of the coconut fiber reinforced concrete because the coconut fiber has the highest toughness amongst natural fibers. Ali and Chouw (2013) then proposed the use of coconut fiber ropes as a vertical reinforcement for mortar-free interlocking structure made of the coconut fiber reinforced concrete. Carrasco et al. (2013) evaluated the performance of walls constructed with interlocking bricks made of iron ore under simple compressive loading. They were interested in the new interlocking blocks and bricks made of new materials and the effect of block shape on the seismic performance has not been considered in their researches.
A research on interlocking blocks based on the numerical analysis has also been conducted. Thanoon et al. (2008) developed a finite element code for analyzing masonry systems to failure. They analyzed the interlocking mortarless hollow concrete block system subjected to axial compression loads. They modeled I-shaped blocks and do not taken into account the effect of block shape on the numerical results.
The interlocking block wall can be used alone as the main structure of a building or as an infill in a framed masonry building. However, since the most vulnerable masonry buildings do not have a RC or steel frames, authors considered to use the interlocking block wall as the main structure rather than as the infill.
Furukawa et al. (2018a) first conducted a diagonal compression test of masonry walls with rectangular bricks and masonry walls with interlocking bricks with a right angle and investigated whether the strength could be improved by using interlocking bricks instead of the rectangular bricks. As a result, it was confirmed that the bricks were fractured at the interlocking part and the masonry walls with the interlocking bricks had lower strength. A static finite element analysis revealed that the wall with the interlocking bricks had lower strength due to the stress concentration occurring at the interlocking part.
Therefore, it was hypothesized that it may be possible to increase the strength of the interlocking wall by designing a block shape that is less likely to cause stress concentration. Specifically, it was thought that by using an obtuse angle instead of a right angle, or a smoother shape such as an hourglass-shape instead of an I-shape, the stress concentration could be reduced, and the strength could be improved. To verify this, four types of interlocking block walls, two I-shaped blocks walls (right angle type, obtuse angle type) and two hourglass-shaped block walls (linear type and wavy type) were considered.
As a first approach, Furukawa et al. (2018b) conducted diagonal compression tests of the four interlocking block walls with different block shapes. A wall of 18 cm in width and 18 cm in height was glued to the jigs with plaster. The experiment revealed that masonry walls made of interlocking blocks with a smoother shape had larger strength. The strain gauges were put onto the blocks where we expected the strain to be concentrated and the failure to occur. However, the failure occurred at a different part and the strain which would help us to understand the failure mechanism could not be measured. Moreover, since the wall size was small, we considered that the effect of the support condition was negligible.
In consideration of the above problems, this study conducted additional diagonal compression tests of the four interlocking block walls with different block shapes under the contact support conditions and image measurement of the strain distribution was conducted by the digital correlation system. By this, the shape effect of the interlocking blocks under the two extreme support conditions of glued and contact conditions could investigated. The contact support condition means that the wall is not glued to the jig with plaster but just in contact with the jig. It was examined how the load-displacement relationship and the failure process changes depending on the block shape and support conditions. It was also examined how the strain is distributed and how the strain distribution changes depending on the block shape. Furthermore, finite-element analysis was conducted to clarify the underlying mechanism. This study investigated the effect of the interlocking block shape and the support condition through both experiment and numerical analysis.
Diagonal Compression Test
Materials and Methods
Test Specimens
In this study, it was considered that the strength of the masonry wall could be increased by using interlocking blocks with a shape that is unlikely to cause stress concentration. To confirm this, the four types of walls shown in Figure 1 were prepared. These are the I-shaped block wall (right angle type), I-shaped block wall (obtuse angle type), hourglass-shaped block wall (linear type) and hourglass-shaped block wall (wavy type). The dimensions of the wall are 18 cm in height, 18 cm in width and 10 cm in depth. The walls are composed of four blocks: upper, middle left, middle right, and lower blocks. Considering that the failure phenomenon will become complicated if the wall consists of many blocks, the wall was constructed with only four blocks to simplify the failure phenomenon.
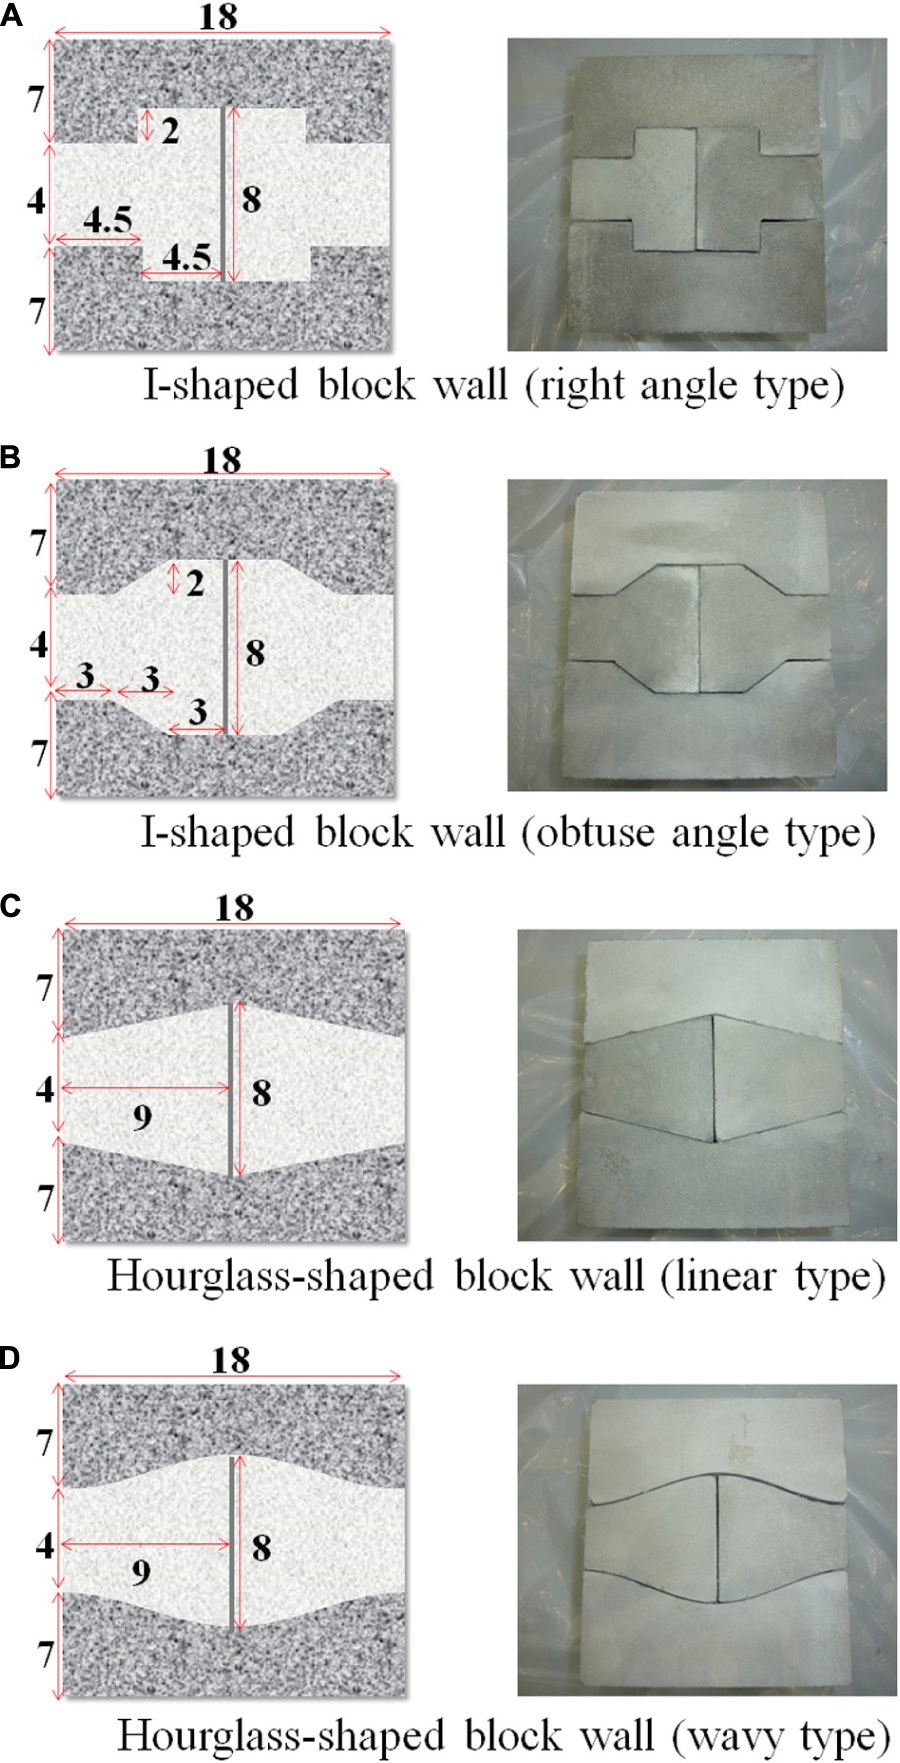
Figure 1. Test specimen (unit: cm, depth: 10 cm). (A) I-shaped block wall (right angle type). (B) I-shaped block wall (obtuse angle type). (C) Hourglass-shaped block wall (linear type). (D) Hourglass-shaped block wall (wavy type).
In a past study Furukawa et al. (2018a), masonry walls were made from burned bricks, and plaster was placed between the adjacent bricks considering the masonry structures in developing counties. However, it was observed that the variations in the material properties and strengths of individual blocks and the variations in mortar bond strength also affected the experimental results.
In order to investigate the pure influence of the block shape, it is necessary to minimize the influence of factors other than the block shape, such as variations in the material properties and strengths of individual blocks. We prepared a formwork for each block, cast at the same time and treated under the same conditions in order to minimize the difference other than the shape. Seventy percent of the material was sand and 30% was Portland cement.
In addition, the plaster was not used between blocks to minimize the influence other than the block shape since it is difficult to realize the constant bond strength throughout the wall. The adjacent blocks are just in contact with each other.
The burned bricks and plaster used in the developing countries were not used to avoid the effect other than the block shape.
Two support conditions were considered, the glued and contact conditions. The glued condition means that the wall was glued to the loading and fixing jigs with plaster. The contact condition means that the wall was just in contact with the loading and fixing jigs. Since the size of the wall is small, it was considered that the effect of the support conditions is significant. So, it was decided to treat both support conditions.
The I-shaped block wall (right angle type) actually has no I-shaped blocks as shown in Figure 1. The top and bottom blocks have the half shape of the I-shaped blocks. If the I-shaped block is cut in half vertically in the middle, then the shape of the top and bottom blocks are obtained. The middle left and the middle right blocks also have the half shape of the I-shaped blocks. If the I-shaped block is cut in half horizontally in the middle, then the shape of the middle left and right blocks are got. The I-shaped block wall (obtuse angle type) has an obtuse angle instead of a right angle. The curve of the hourglass-shaped block (wavy type) is designed using the cosine function.
Material Properties and Strength
Table 1 shows the material properties and the strength of the mortar block estimated by the element test using a cylinder test piece made simultaneously with the interlocking blocks. Figure 2 illustrates the experimental setup for element tests. Each element test was conducted three times, and the average values were taken. The compression test shown in Figure 2A was performed to obtain Young’s modulus, Poisson’s ratio and compressive strength. The Young’s modulus was obtained from the vertical stress-strain relationship, in which the stress was obtained by dividing the force by the area. The Poisson’s ratio was obtained by taking the ratio of the horizontal strain to the vertical strain. The maximum stress of the stress-strain relationship was defined as the compressive strength. The tensile strength was obtained by the 4-point bending test shown in Figure 2B. The friction coefficient between the blocks was obtained by the double-sided shear test shown in Figure 2C. The shear stress when the sliding occurs was obtained for three normal stress of 0.1, 0.2, and 0.3 MPa. Friction coefficient was then obtained from the relationship between the shear stress and normal stress.
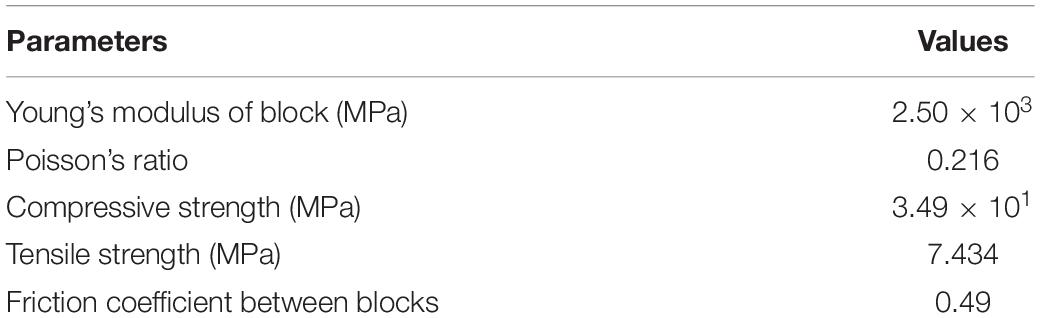
Table 1. Material properties and strength of block.
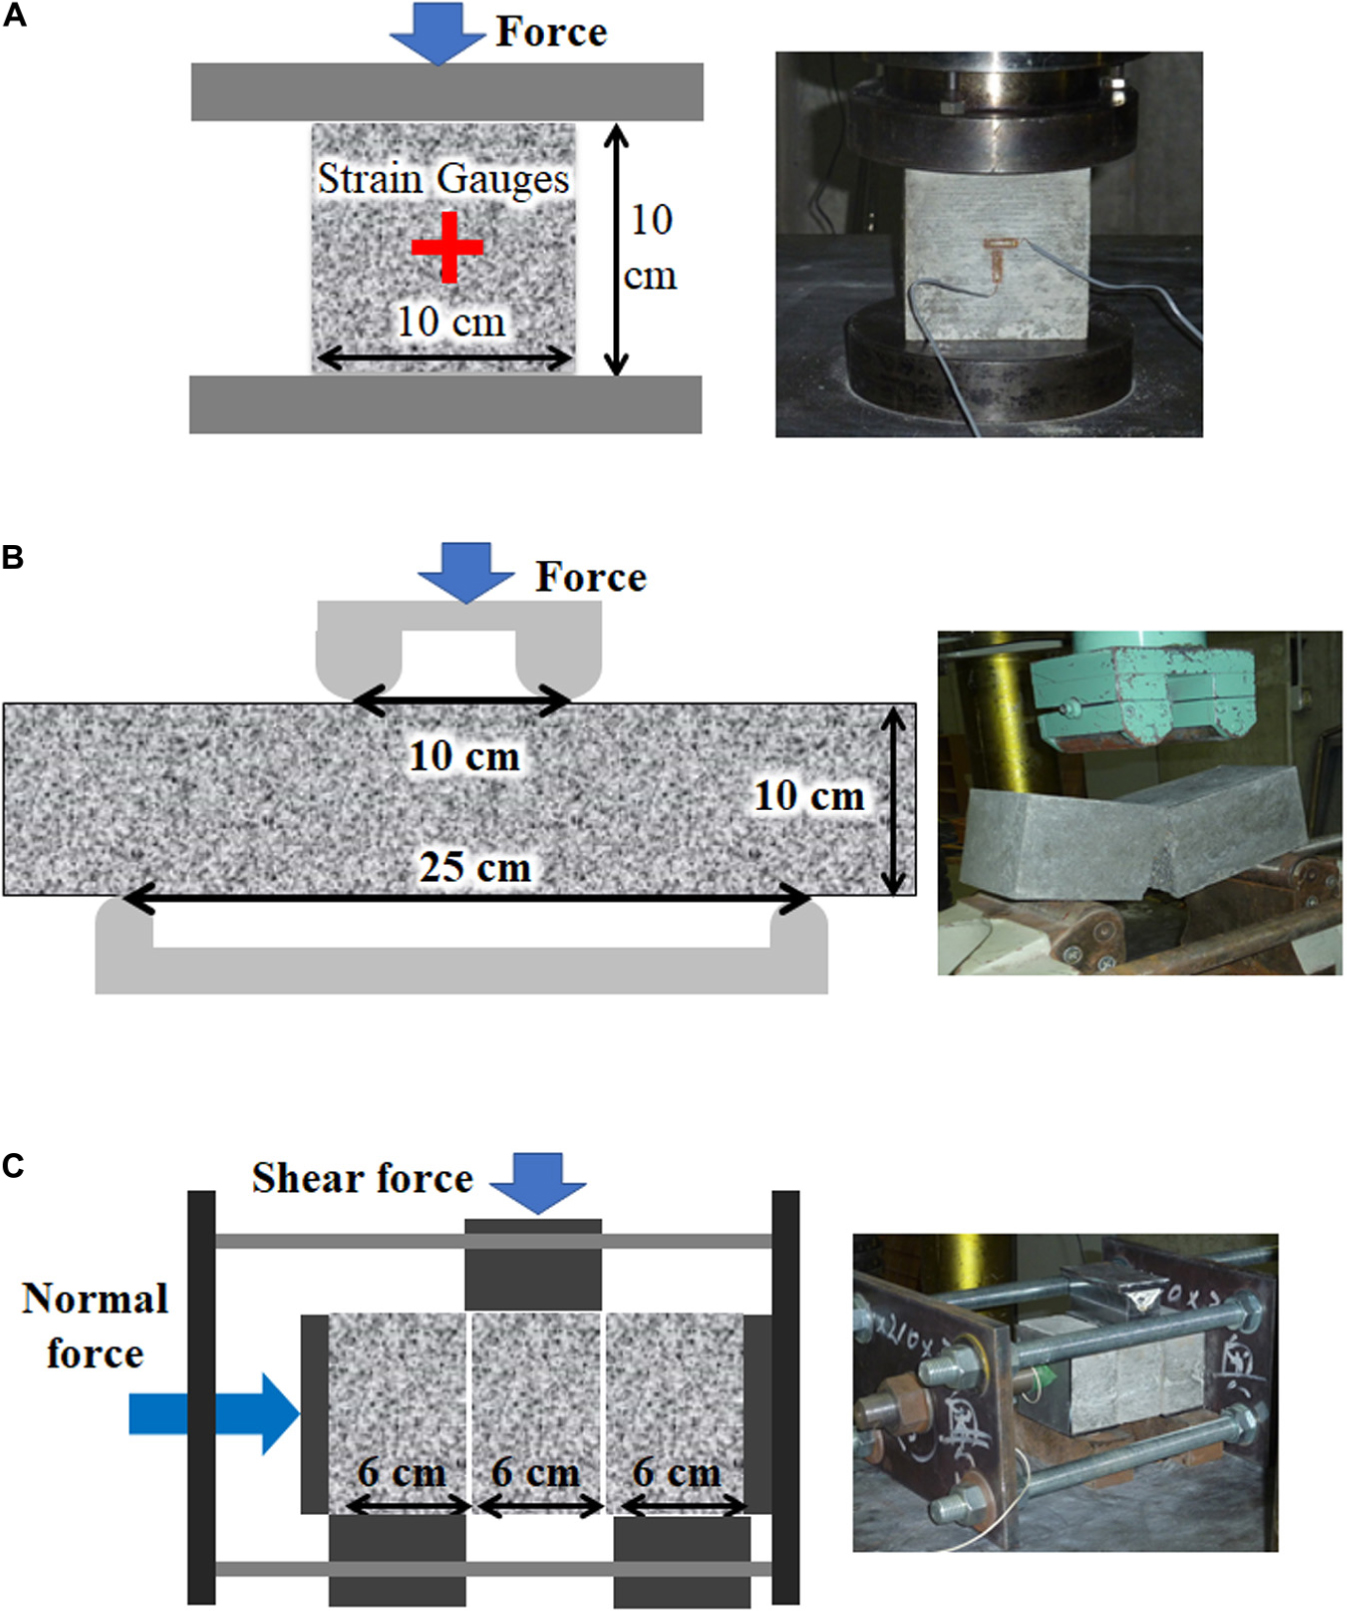
Figure 2. Element test. (A) Test for Young’s modulus, Poisson’s ratio and compressive strength of blocks. (B) Test for tensile strength of blocks. (C) Test for friction coefficient between blocks.
Experimental Setting
Diagonal compression tests were performed on four types of masonry walls, and the load-displacement relationship and the failure behavior were examined. As shown in Figure 3A, V-shaped jigs were mounted on the upper and lower loading plates of the universal testing machine, and a masonry wall was installed between the jigs.
Figure 3. Experimental method. (A) Experimental setup. (B) Black ink spray.
There were two types of support conditions between the V-shaped jig and the masonry wall, i.e., glued condition and contact condition. In the glued condition, quick-drying cement was placed between the brick and the jig. The number of test specimens for each support condition is shown in Table 2.
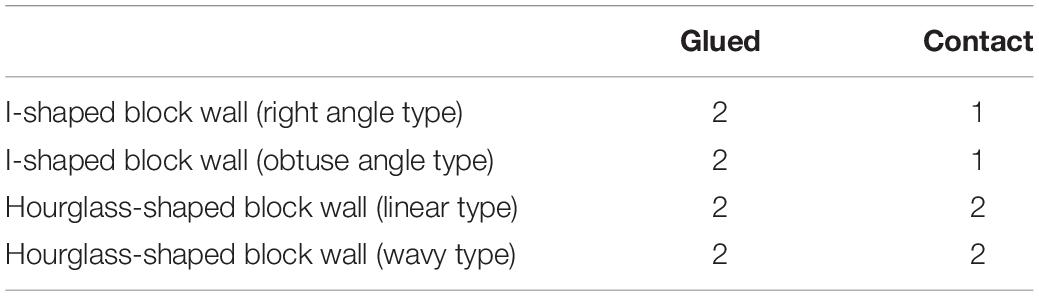
Table 2. Number of test specimens.
The upper jig was fixed and the lower jig was moved up at a rate of 2.5 × 10⁻³ mm/s. The load in the loading (vertical) direction was measured. The experiment of the glued condition was conducted first, and the failure behavior during loading was recorded using a digital camera. In the experiment of the contact condition that was conducted afterward, the failure behavior during loading was measured using two high-resolution digital cameras for image measurement with a digital correlation system (Correlated Solutions, 2020). The digital correlation system uses two high-resolution digital cameras to record the deformation of the surface of an object and tracks the movement of a point of interest in the object. This method enables measurement of strain distribution. A mottled pattern was applied to the masonry wall with a commercially available spray (Figure 3B). The point of the spray was tracked by the digital correlation system. The digital correlation system itself has very high-performance, but the pictures were taken every 5 s due to the limitation of the capacity of the laptop, so the pictures of the very moment when the failure occurred could not be obtained.
Results
I-Shaped Block Wall (Right Angle Type)
The left top figure of Figure 4 shows the load-displacement relationships of I-shaped block walls (right angle type) for glued and contact conditions. Three test specimens showed a similar load-displacement relationship with two peaks and the effect of the support conditions was negligible. The two peaks correspond to the failure of two parts.
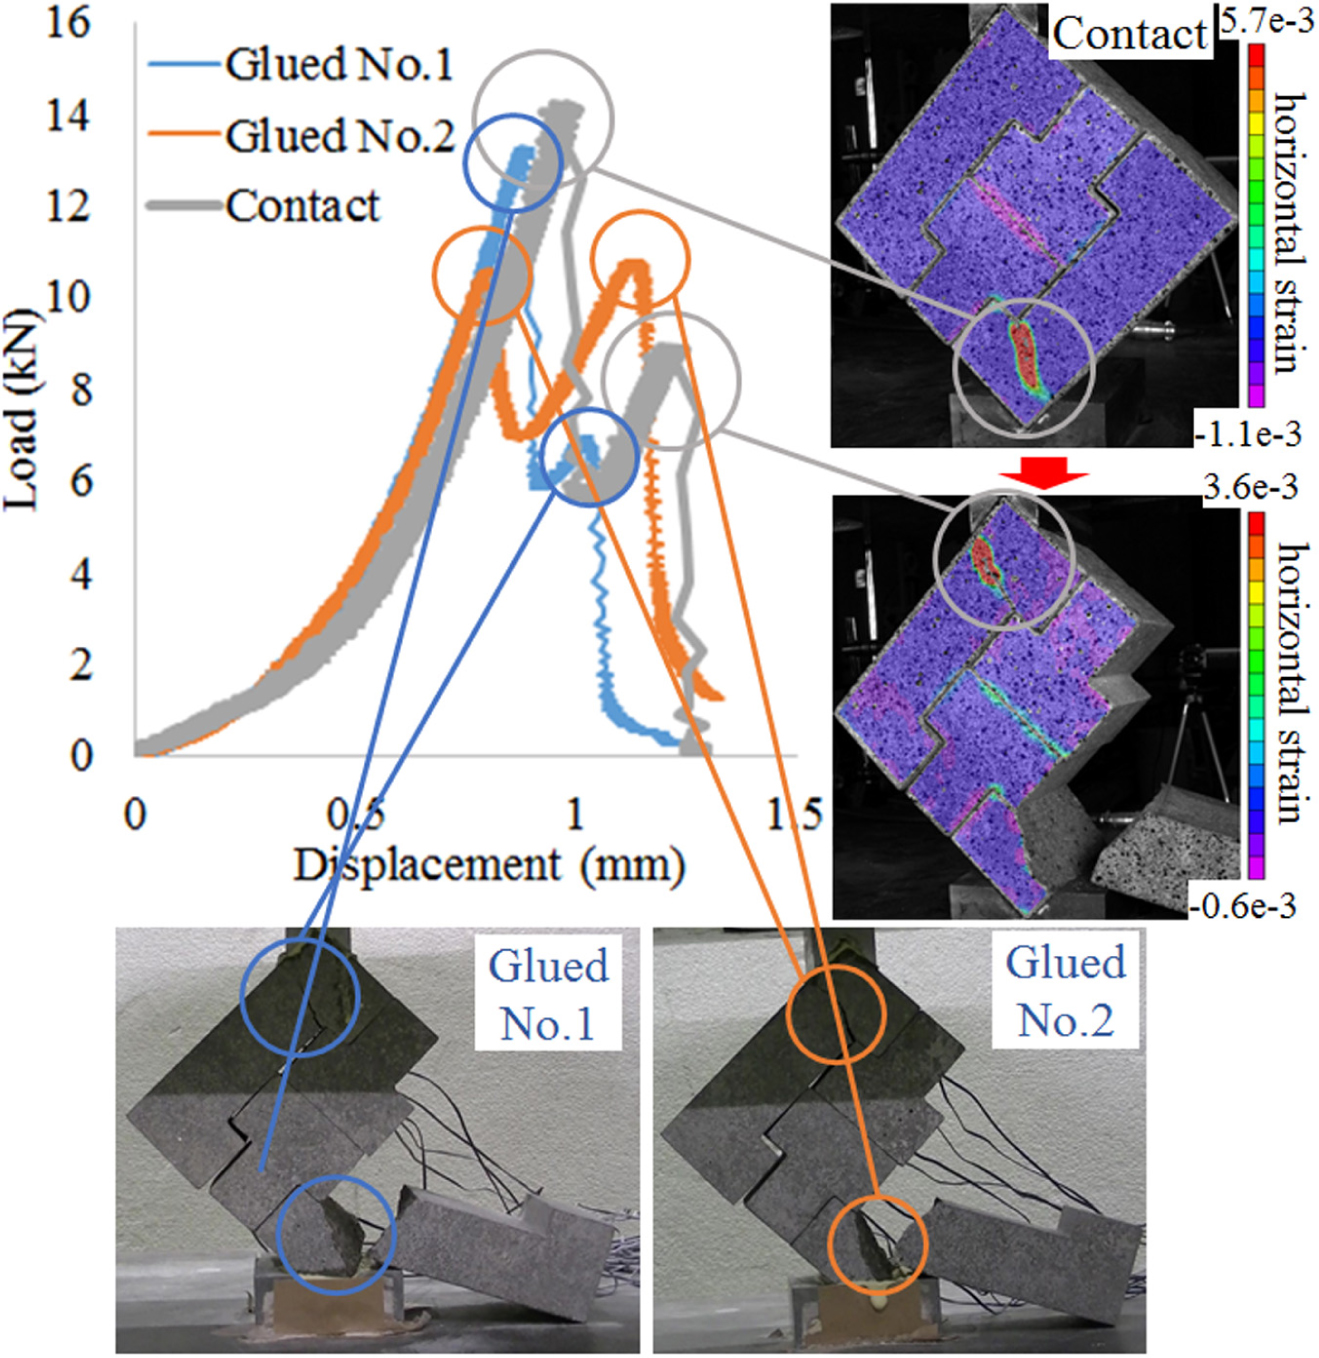
Figure 4. Experiment results of I-shaped block walls (right angle type).
The top two figures on the right side of Figure 4 show the normal strain distributions in the horizontal direction and how the test specimen with the contact condition became fractured. The positive strain means the tensile strain. The red color indicates the maximum value and the purple color indicates the smallest value. At the first peak of the load-displacement relationship, the tensile strain concentration occurred in the bottom block as indicated by a gray circle in the top figure on the right side. Then this part fractured. The wall then stabilized and the load increased again. At the second peak of the load-displacement relationship, the tensile strain concentration occurred in the top block as indicated by the gray circle in the second top figure on the right side. Then this part fractured and the total collapse occurred. It was found that the first and the second peaks in the load-displacement relationship correspond to the failure of the bottom and top blocks, respectively. The failure occurred where the tensile strain was concentrated. The tensile strain concentration started from the corner at 270 degrees of the top or bottom block. The failure was caused by the tensile strain concentration at the interlocking part. On the other hand, in the middle blocks, no failure occurred at the corresponding 90-degree corner. This is because strain concentration is more likely to occur at corners larger than 180 degrees than at corners smaller than 180 degrees.
The bottom two figures of Figure 4 indicate how the failure occurred in the glued condition. The digital correlation system was not available when the experiment of the glued condition was conducted. It was found that the influence of the support condition on the failure process of the I-shaped block walls (right angle type) is small and all three test specimens showed almost the same results.
The failure process of the I-shaped block wall (right angle type) is summarized as follows. The load increases as the displacement increases until the first failure occurs. The first failure occurs in either the upper or lower block where the strain concentrates, and the load decreases rapidly. After that, the wall stabilizes again, the load increases again as the displacement increases, and then the other block fractures. After the second failure, the stability is lost, the load decreases to almost 0 and total structural collapse occurs.
I-Shaped Block Wall (Obtuse Angle Type)
The left figure of Figure 5 shows the load-displacement relationship of I-shaped block walls (obtuse angle type) for glued and contact conditions.
Figure 5. Experiment results of I-shaped block walls (obtuse angle type).
Two test specimens with the glued condition showed two peaks even though the second peak is very small. The right bottom figure shows the snapshot of the test specimen just after the second peak. The first peak in the load-displacement relationship occurred just before the failure of the top block and the small second peak occurred just before the failure of the bottom block. Since the wall lost stability after the second failure, the total collapse occurred, and the load reached almost 0.
On the other hand, the test specimen with the contact condition showed only one peak. The right top figure shows the strain distribution of the test specimen in the contact condition. The tensile stress concentration can be seen in the top block. After the fracture of the top block, the total collapse occurred. Since the top and bottom blocks are not glued to the jigs, the model is more unstable. So the total failure occurred just with the fracture of the top block. The wall with the glued condition did not collapse after the fracture of the top block since the top and the bottom blocks are glued to the V-shaped jigs and the model is more stable. The I-shaped block wall (right angle type) with the contact condition did not collapse after the fracture of the bottom block because the stability of the wall was obtained owing to the stronger interlocking between blocks due to the right angle.
Thus, the effect of the support conditions was larger in the I-shaped block wall (obtuse angle type) compared to the I-shaped block walls (right angle type). The effect of the support condition becomes larger as the interlocking effect becomes smaller.
Hourglass-Shaped Block Wall (Linear Type)
The left top figure of Figure 6 shows the load-displacement relationship of hourglass-shaped block walls (linear type) for glued and contact conditions. In the two types of I-shaped block walls, the initial stiffness (initial slope) was almost the same and the difference in the load-displacement relationships was negligible irrespective of the test specimens. However, in the hourglass-shaped block wall (linear type), the variations in the load-displacement relationships are large even for the test specimens with the same support condition. The load-displacement relationship has several peaks, the largest load (strength) and the final displacement are larger compared to the I-shaped block walls.
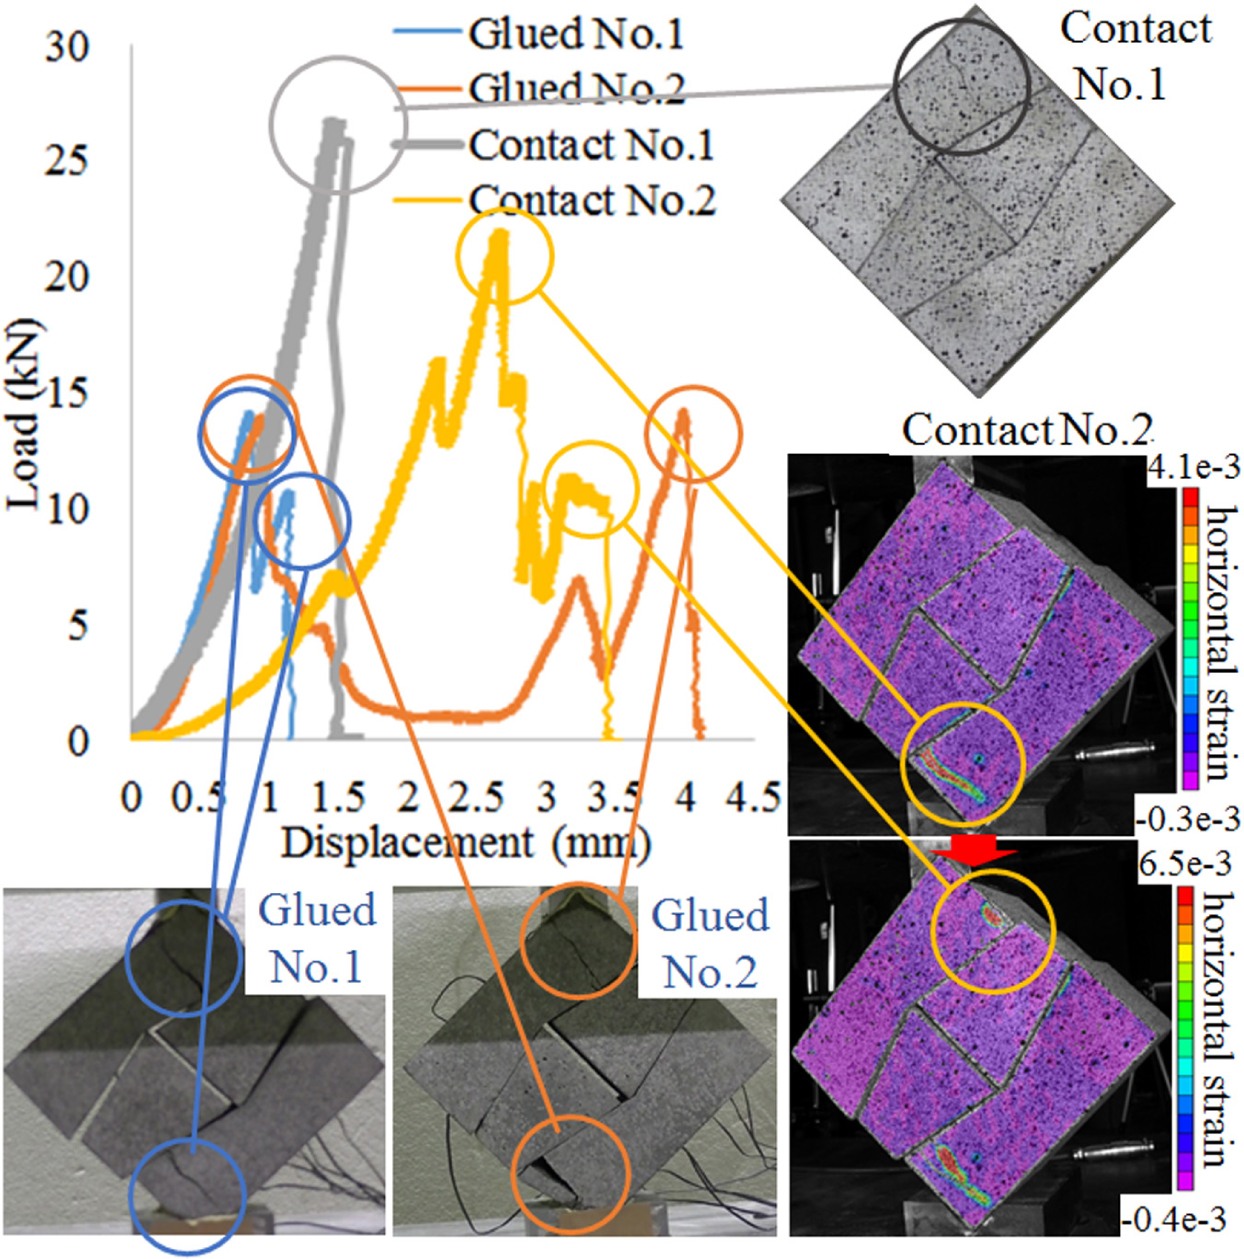
Figure 6. Experiment results of Hourglass-shaped block walls (linear type).
The bottom left figure is the snapshot just after the second peak for test specimen No.1 of the glued condition. The first and the second peaks of the load-displacement relationship correspond to the failure of the top and the bottom blocks and the total failure occurred after the second peak.
The bottom middle figure is the snapshot just after the last peak for test specimen No.2 of the glued condition. The first peak of the load-displacement relationship corresponds to the failure of the bottom block and the second and the last peaks correspond to the failure of the top block. The final displacement is quite large.
The top right figure is the snapshot at the largest peak for test specimen No.1 of the contact condition. The load-displacement relationship has only one peak and one top block fractured.
The middle and bottom figures in the right are the strain distributions and the failure process of test specimen No.2 with the contact condition. First, the tensile strain concentration occurred in the bottom brick. The failure occurred where the strain was concentrated, but the tip of the failure was inside the jig, so the total failure did not occur. Then the failure occurred in the top block as shown in the right bottom figure, followed by the total failure.
Compared to the two types of I-shaped block walls, in the hourglass-shaped block walls (linear type) it was easier for dislocation between blocks and rotation around jigs to occur, especially in the contact condition. Therefore, the final displacement was larger. Moreover, the strain concentration in the blocks is less likely to occur due to the smoother interface of blocks, so the maximum load (strength) increased.
Hourglass-Shaped Block Wall (Wavy Type)
The left top figure of Figure 7 shows the load-displacement relationship of hourglass-shaped block walls (wavy type) for glued and contact conditions. Test specimen No.1 for the glued condition had two peaks, corresponding to the failure of the top and bottom blocks as indicated with circles in the left bottom figure. Test specimen No.2 for the glued condition had one peak which corresponds to the failure of the bottom block as indicated with a circle in the middle bottom figure. Test specimens No.1 and No.2 for the contact condition also had one peak which corresponds to the failure of the bottom block. The right middle figure indicates the strain distribution. The strain concentration in the bottom block can be observed.
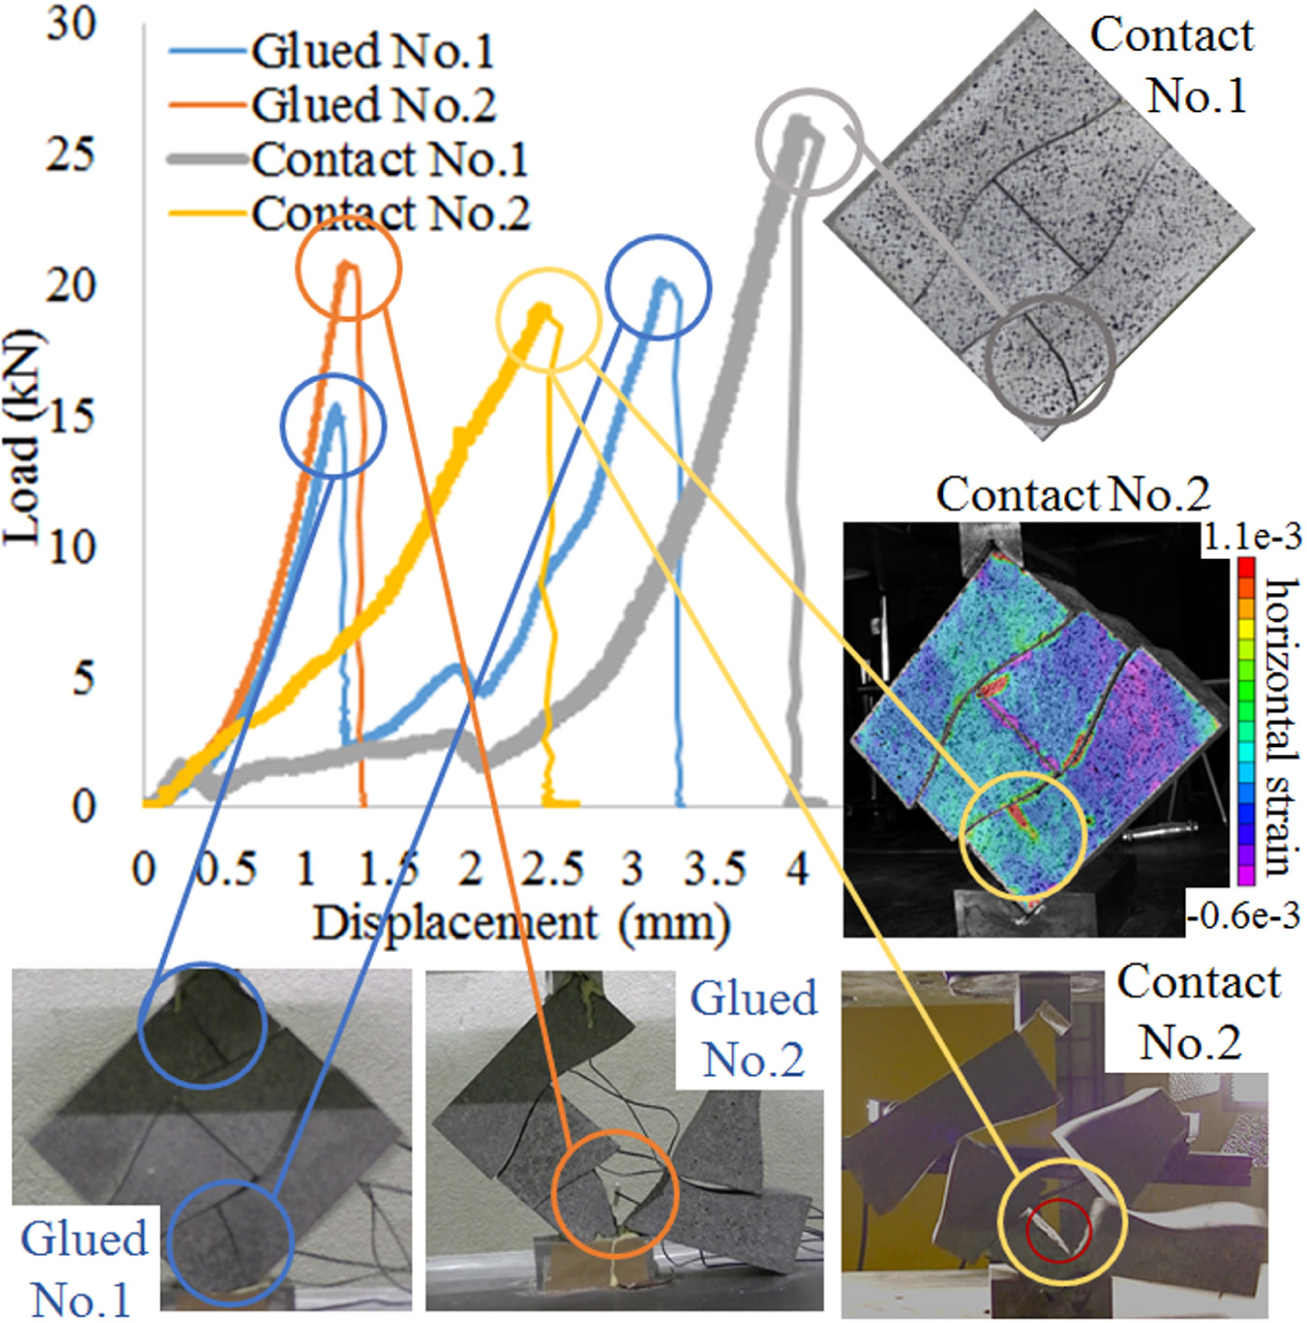
Figure 7. Experiment results of Hourglass-shaped block walls (wavy type).
In this hourglass-shaped block wall (wavy type), the initial stiffness (slope) of the two test specimens for the glued contact is similar but different from that of the two test specimens for the contact condition. This indicates that the influence of the support condition is large if the interlocking block has a smooth shape with less interlocking effect. In the contact condition, the blocks are easier to dislocate and rotate and the final displacement becomes larger.
Discussion
The load-displacement relationship of the I-shaped block wall (right angle type), which has the largest interlocking effect, tended to be similar irrespective of the support conditions (glued or contact condition) and has two peaks. Each peak corresponds to the failure of the upper and bottom blocks. After both the top and bottom blocks fractured, the stability was lost and total collapse occurred.
The load-displacement relationship of the I-shaped block wall (obtuse angle type), which has a weaker interlocking effect than the I-shaped block wall (right angle type), also had two peaks corresponding to the failure of the top and bottom blocks in the case of the bonding condition, but the second peak was much smaller than the first peak. In the contact condition, there was only one peak corresponding to the failure of the top block. The stability was lost after the failure of the top block and the total collapse occurred. The number of peaks differs depending on the support condition, but the load-displacement relationship was similar irrespective of the support condition since the second peak was very small.
On the contrary, the load-displacement relationship of the two hourglass-shaped block walls (linear type and wavy type), which have a weak interlocking effect, showed different curves for each support condition and also for the two test specimens with the same support condition.
The reason for this is because the block is easier to slide along the interface between blocks due to the weak interlocking effect and the difference in behavior is generated due to the small difference of the block dimension for each test specimen.
Table 3 shows a comparison of the maximum load (strength) of each specimen. Taking the average of the two strength values if there are two test specimens and arranging the four walls in ascending order of the strength, the order for the glued condition becomes: I-shaped block wall (right angle type) < I-shaped block wall (obtuse angle type) < Hourglass-shaped block wall (linear type) < Hourglass-shaped block wall (wavy type), and the order of the contact condition becomes: I-shaped block wall (right angle type) < I-shaped block wall (obtuse angle type) < Hourglass-shaped block wall (wavy type) < Hourglass-shaped block wall (linear type).
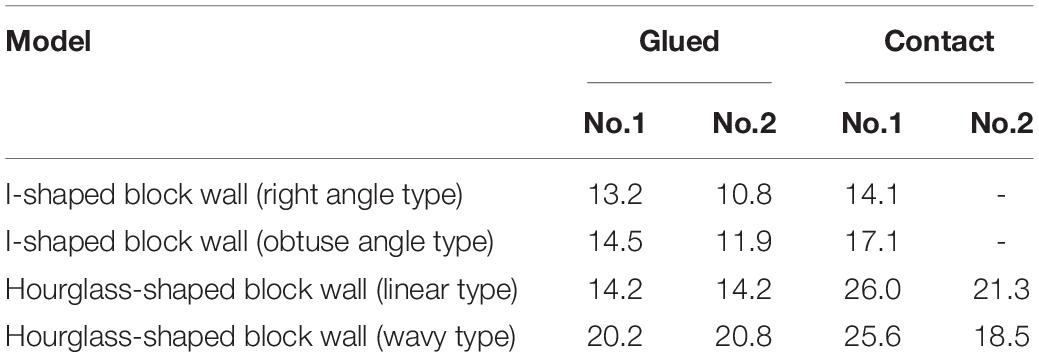
Table 3. Comparison of the maximum load (kN) between glued and contact conditions.
The I-shaped block wall (right angle type), whose block has the sharpest shape and the strongest interlocking effect, has the least strength irrespective of the support conditions. By changing the right angle into the obtuse angle, the strength can be increased. The hourglass-shaped block walls (linear type and wavy type) have the largest or the second largest strength depending on the support conditions. The effect of the block shape on the strength is clear, and it is possible to increase the strength by smoothing the block shape.
Regarding the support condition, the effect of the support condition on the strength was very small for the I-shaped block wall (right angle type). It was confirmed that the effect of the support condition becomes larger as the block shape becomes smoother, and the strength under the contact condition is larger than the strength under the glued condition.
From the comparison of the load-displacement relationship among the four models (Figures 4–7), the hourglass-shaped block wall was found to have larger displacement at the peak load and larger final load. The reason for this is because the hourglass-shaped blocks are easier to dislocate and rotate due to the smooth interface with less interlocking.
Finite Element Analysis
Materials and Methods
Analytical Model
In this chapter, the 2-dimensional finite element analysis of the diagonal compression test was conducted to understand the failure mechanism. The analysis was performed using the non-linear finite element software, Marc (MSC Software Corporation, 2020).
Figure 8 shows the analytical model of the I-shaped block wall (right angle type). Four mortar blocks and jigs were modeled by two-dimensional plane stress elements. The depth of the element was 10 cm.
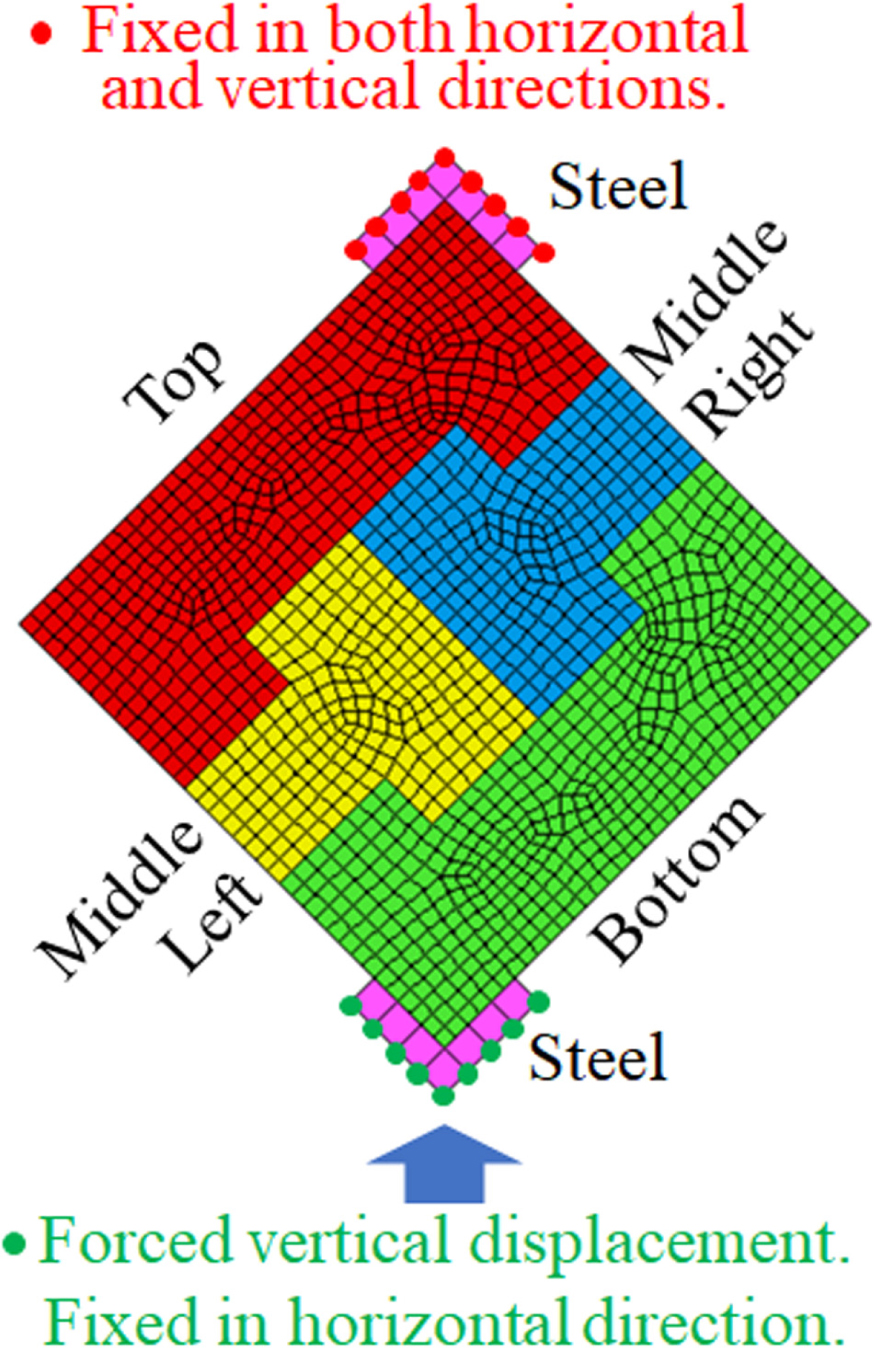
Figure 8. Numerical model of the I-shaped block wall (right angle type).
The element size of the block was basically about 0.5 cm × 0.5 cm. Although the block elements themselves were elastic, they did not share nodes with other elements and failure can occur between elements.
The upper and lower steel jigs were modeled with seven 1 cm × 1 cm elastic elements and no failure occurs between steel elements.
For the boundary conditions, nine nodes belonging to the upper jig were fixed in both horizontal and vertical directions, and nine nodes belonging to the lower jig were fixed in the horizontal direction but forced displacement of 0.005 mm per step was applied in the vertical direction as shown in Figure 8.
Analytical Parameters
The material properties of the block are shown in Table 4. They are obtained by the elements test. The Young’s modulus and Poisson’s ratio are given to the block elements. No compression failure was considered since no compression failure was observed during the experiment.
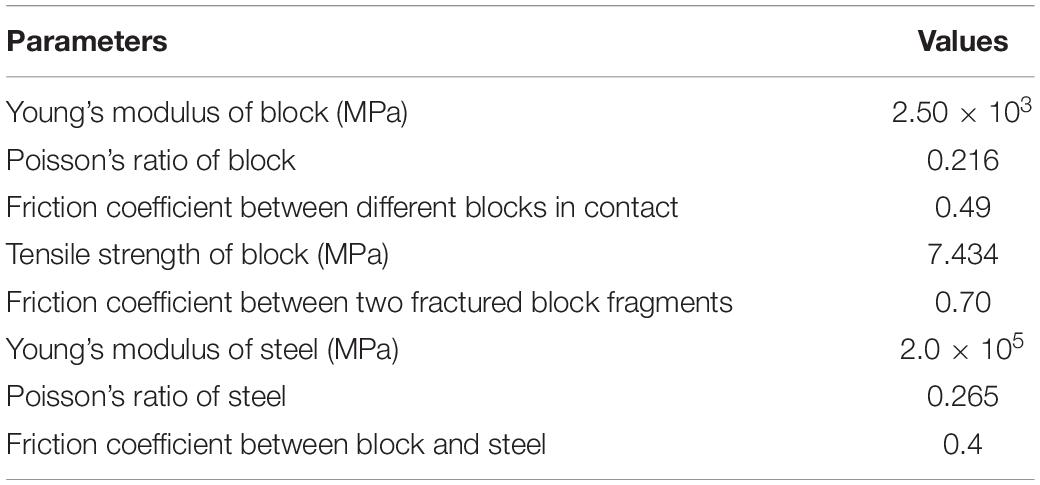
Table 4. Analytical parameters.
There are two types of interface between two adjacent blocks.
One is the interface between two elements belonging to the different blocks. They are just in touch. In this type of interface, the two adjacent elements do not resist against tensile force and only resist against compressive and friction force when they are in contact, and the friction coefficient in Table 4 was used.
The other interface is the one between two elements belonging to the same blocks. They are continuous elements. Two continuous elements resist against tensile and compressive force until the tensile stress exceeds the tensile strength shown in Table 4. Once the tensile stress exceeds the tensile strength, the failure occurs between the elements. After that, these two elements no longer resist against tensile force and only resist against compressive and friction force. The friction coefficient of 0.7 was used. The friction coefficient between the blocks after fracture is set to 0.7 taking into account the reproducibility of the experimental results.
As for the material properties of the steel jig, Young’s modulus of 2.0 × 10⁵ MPa and a Poisson’s ratio of 0.265 were used.
Contact Condition Between Block and Jig
For the interface between the block and the jig, the contact condition was firstly considered. The interface between the adjacent block and jig elements cannot resist against the tensile force but can resist against compressive and friction force. The friction coefficient of 0.4 was adopted.
Results of Comparison Between Experiment and Numerical Analysis for Contact Condition
The comparison of the experiment and numerical analysis for the contact condition is shown in Figure 9.
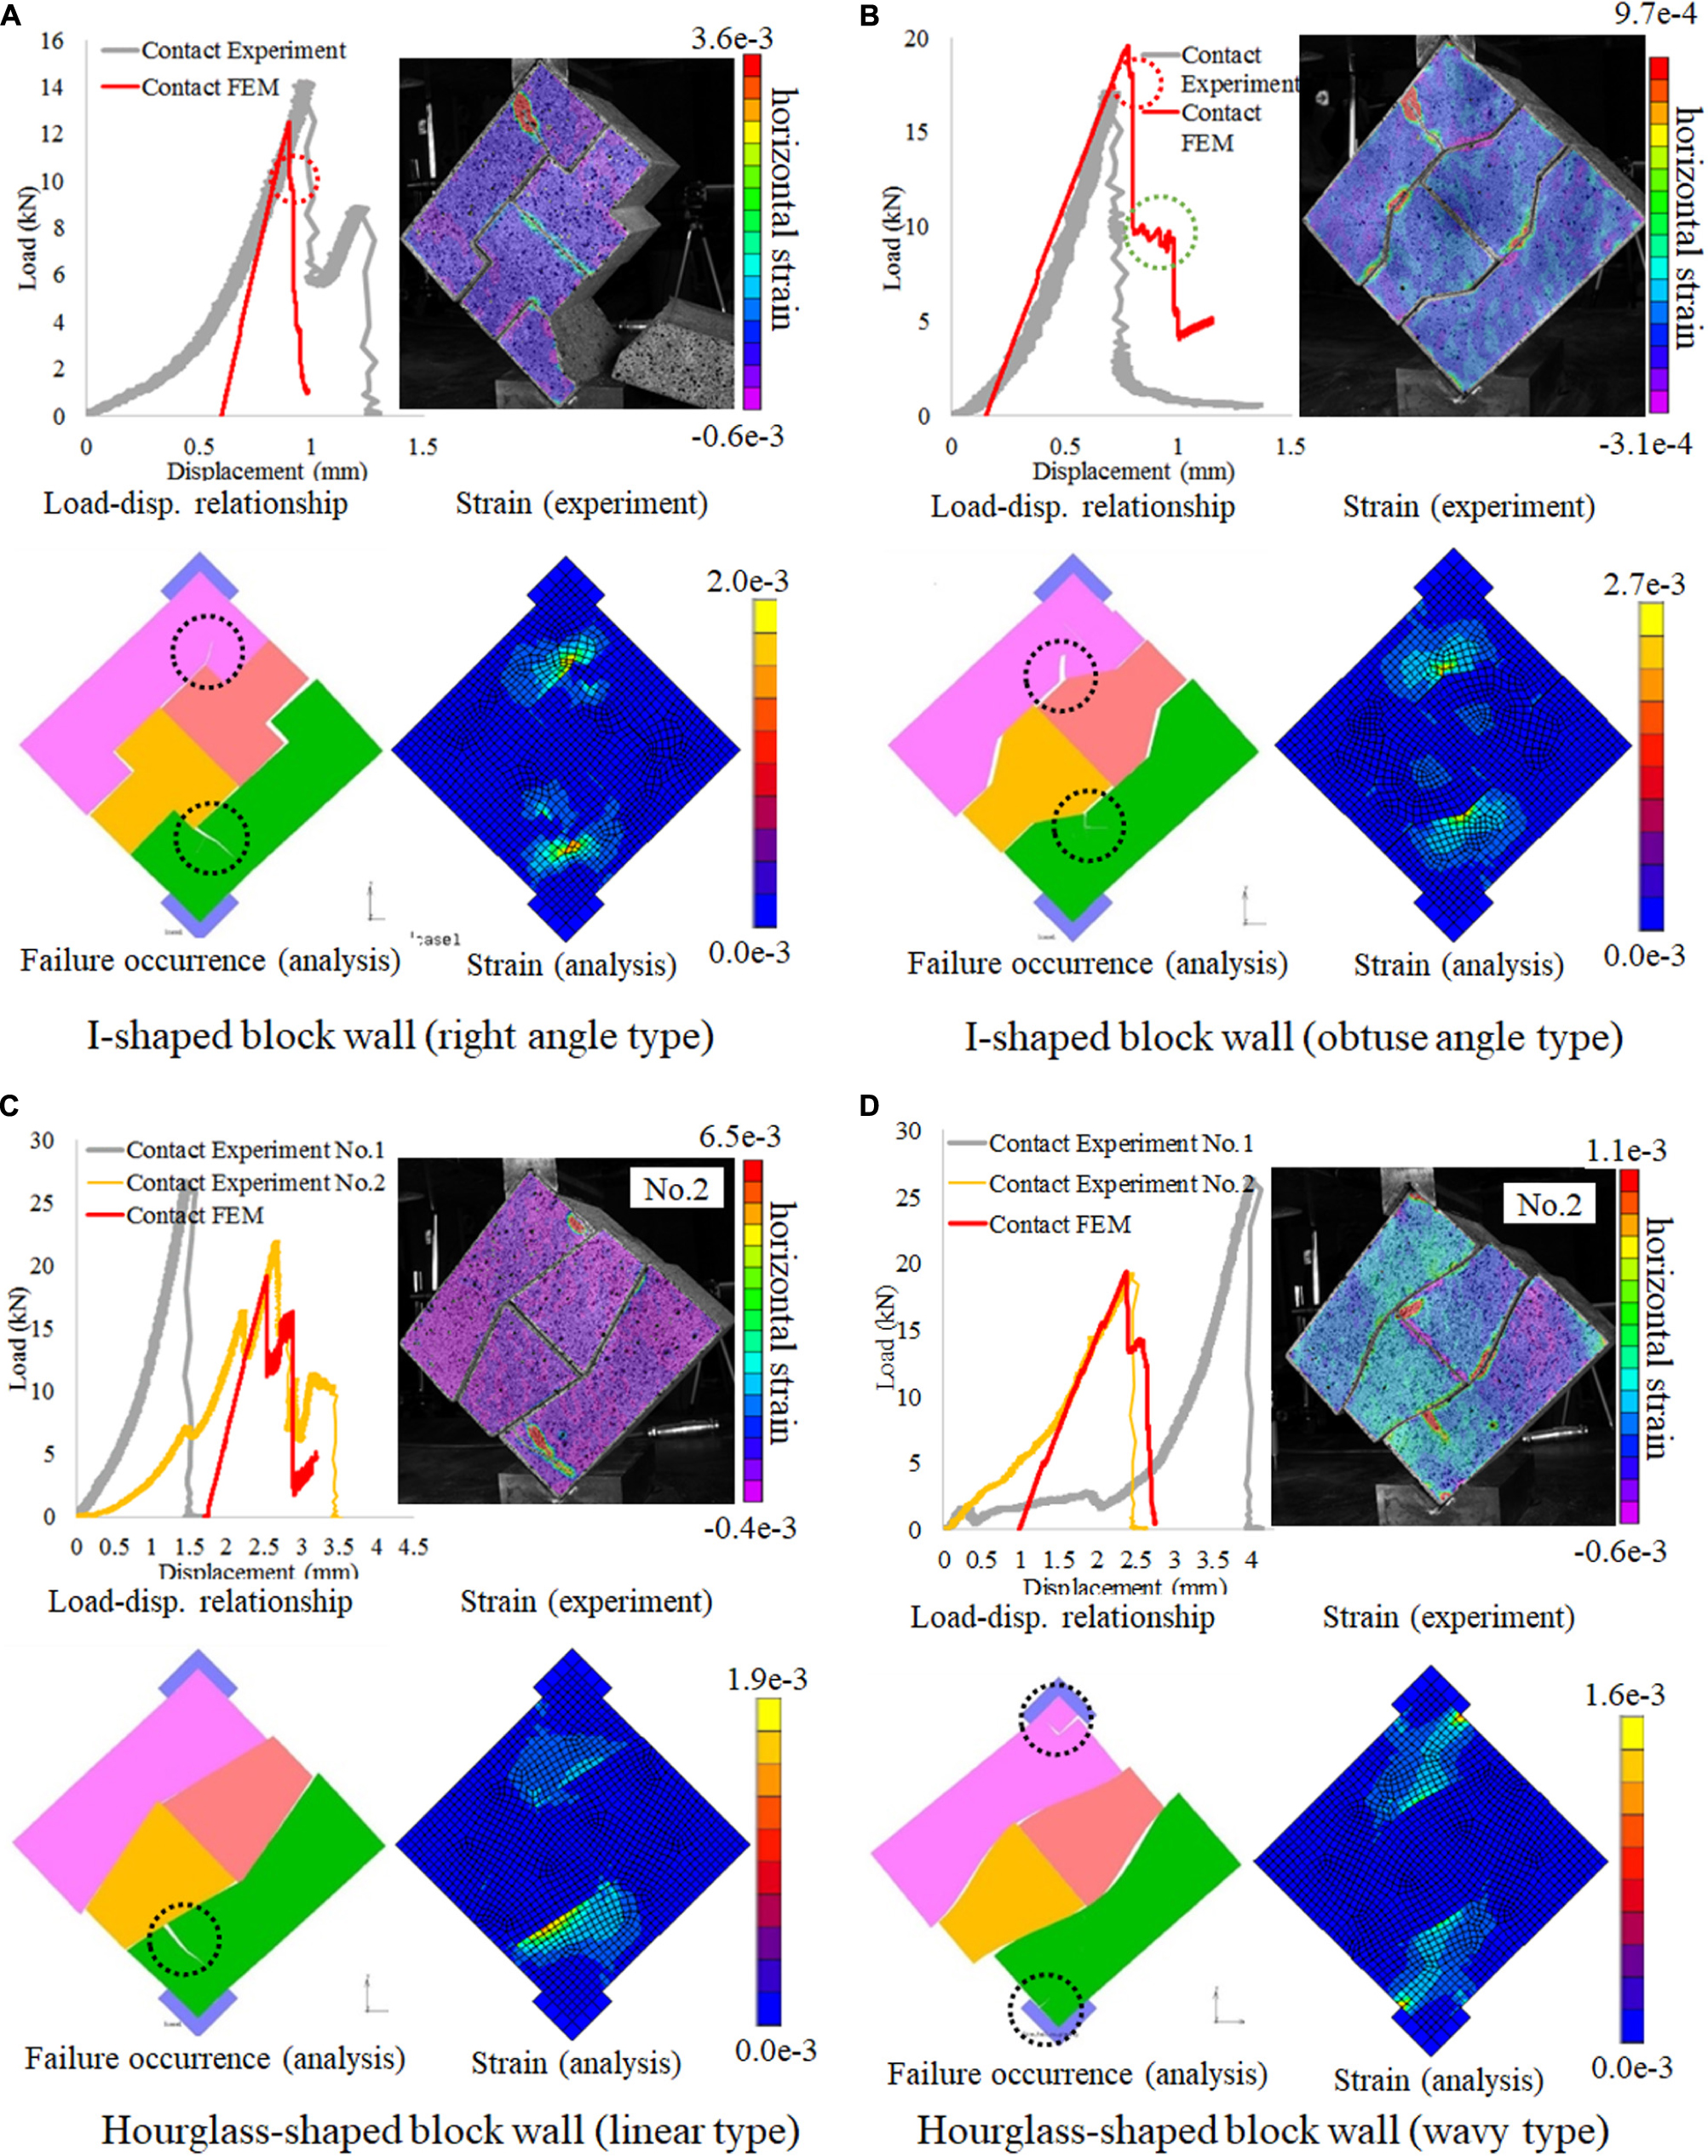
Figure 9. Comparison of the results between experiments and analysis. (A) I-shaped block wall (right angle type). (B) I-shaped block wall (obtuse angle type). (C) Hourglass-shaped block wall (linear type). (D) Hourglass-shaped block wall (wavy type).
I-Shaped Block Wall (Right Angle Type)
The top left figure of Figure 9A shows the comparison of the load-displacement relationship between the experiment and the analysis (FEM) for the contact condition. Before the failure, the stiffness (slope) gradually increased in the experiment, but the stiffness is almost constant in the analysis. The stiffness gradually increased in the experiment because the gap between blocks and the gap between the block and the jig were gradually closed and the stiffness gradually increased. After all the gaps closed, the stiffness became almost constant. On the contrary, in the analysis, the analytical model is ideally created with no gaps, so the stiffness is constant from the beginning. To compare the final elastic stiffness just before the failure, the displacement of the analysis was shifted to the right. The stiffness and the load before the failure were almost similar. However, there are two peaks in the experiment while there is only one peak in the analysis.
The left bottom figure is the snapshot of the last step of the analysis when the numerical analysis stopped due to the loss of stability. This figure shows where the failure occurred. In the analysis, both the top and bottom bricks fractured which is the same as the experiment. However, the load-displacement relationship had only one peak since the failure of the top block occurred immediately after the failure of the bottom blocks. In the load-displacement relationship for the analysis, the first peak corresponds to the failure of the bottom block and the area encircled by the red dotted lines corresponds to the failure of the bottom block. The failure of the top blocks occurred immediately after the failure of the bottom block, so the second peak is almost negligible. In the experiment, the strength of each block is not perfectly the same, so the timing when the top and bottom blocks fracture is different.
The right top figure is the normal strain distribution in the horizontal direction of the experiment around the second peak load. The right bottom figure is the maximum principal strain distribution of the analysis before the peak load. Since the timing of the two figures is different, comparison of the strain value is difficult. However, it can be seen that the strain is not evenly distributed but concentrated around the corner with a 270-degree angle of the top and the bottom blocks, and failure occurred at the locations where the strain is concentrated. This tendency can be seen both in the experiment and the analysis. It can be concluded that the block fractured due to the strain concentration at the interlocking parts. In the analysis, the strain distribution is point-symmetric around the center of the wall since the material properties and strength are ideally uniform. In the experiment, the bottom block fractured earlier because the material properties and strength of the block are not uniformly equal.
In both the experiment and analysis, failure occurred at 270-degree corners of the top and bottom blocks. No failure occurred at the corresponding 90-degree corners of the middle blocks. This may be because the strain concentration tends to occur at corners larger than 180 degrees. In the right bottom figure, the strain concentration can also be seen at 270-degree corners of the middle blocks. No failure occurred at the 270-degree corner in the middle blocks because the strain concentration was greater at the 270-degree corners of the top and bottom blocks, and the failure had occurred beforehand.
I-Shaped Block Wall (Obtuse Angle Type)
The top left figure of Figure 9B shows a comparison of the load-displacement relationship between the experiment and the analysis (FEM) for the contact condition. The stiffness and the maximum load are very similar between the experiment and the analysis.
The left bottom figure is the snapshot of the last step of the analysis when the numerical analysis stopped due to the loss of stability. This figure shows where the failure occurred. In the analysis, the bottom block fractured first which corresponds to the first peak of the load-displacement relationship, then the top block fractured which corresponds to the area encircled by red dotted lines. The failure of the top blocks occurred immediately after the failure of the bottom block, so the second peak is almost negligible. After the failure of the top and bottom blocks, the load dropped sharply, then the wall stabilized temporarily as shown by the green dotted lines, and then dropped again. The temporary stability is due to a change in the direction of fracture propagation that depends on the discretization of the elements. On the contrary, in the experiment, only the top block fractured since the stability was lost after the failure of the top block and total collapse occurred.
The right top figure is the normal strain distribution in the horizontal direction of the experiment around the peak. The right bottom figure is the maximum principal strain distribution of the analysis before the peak load. It can be seen that the strain is not evenly distributed but concentrated around the corner at a 225-degree angle of the top and the bottom blocks, and failure occurred where the strain is concentrated. The reason why only the top block fractured in the experiment is considered as follows. The angle of the top block in contact with the bottom jig was not perfectly 90 degrees since there was an error during production. Therefore, the wall was unstable in the experiment after the failure of the top block.
It can be seen that the maximum principal strain of the right angle type is more locally concentrated than the obtuse angle type from the comparison between Figures 9A,B. The local stress concentration can be relaxed by changing the right angle into the obtuse angle.
Hourglass-Shaped Block Wall (Linear Type)
The top left figure of Figure 9C shows a comparison of the load-displacement relationship between the experiment and the analysis (FEM) for the contact condition. The displacement of the FEM was shifted to the right so that the peak point of Experiment No.2 and FEM becomes similar.
The left bottom figure is the snapshot of the last step of the analysis when the numerical analysis stopped due to the loss of stability. This figure shows where the failure occurred. Also, the dislocation between blocks and rotation of the wall can be observed.
The right top figure is the normal strain distribution in the horizontal direction of the experiment around the peak. The right bottom figure is the maximum principal strain distribution of the analysis before the peak load. It was found that in the both experiment and analysis, the strain was mainly concentrated in the bottom block, and failure occurred in the bottom block.
Hourglass-Shaped Block Wall (Wavy Type)
The top left figure of Figure 9D shows a comparison of the load-displacement relationship between the experiment and the analysis (FEM) for the contact condition. The displacement of the FEM was shifted to the right so that the peak point of Experiment No.2 and FEM becomes similar.
The left bottom figure is the snapshot of the last step of the analysis when the numerical analysis stopped due to the loss of stability. This figure shows where the failure occurred. In this hourglass-shaped block wall (wavy type), the failure did not occur at the interface between blocks but in the area near the jigs. Moreover, the dislocation between blocks and the rotation of blocks around the jigs are observed. Due to this dislocation and rotation, the gap between blocks is generated.
The right top figure is the normal strain distribution in the horizontal direction of the experiment around the peak. The right bottom figure is the maximum principal strain distribution of the analysis before the peak load. In the experiment, slight strain concentration was observed inside the bottom block near the interface with the middle left block. In the analysis, the strain was concentrated in the top and bottom blocks around the jigs rather than around the interfaces between blocks. It was considered that the strain was more strongly concentrated around the jig since the interfaces between blocks are smooth.
Results of Comparison Between Glued and Contact Condition of Numerical Analysis
Figure 10 shows a comparison of the load-displacement relationship between the glued and contact conditions obtained by the finite element analysis. Regarding the glued condition, the tensile strength of plaster between the block and jigs during the experiment was not measured. Therefore, in the analysis, the tensile strength between the block and jig was assumed to be the same as the tensile strength of the blocks shown in Table 4. Since this is the assumed value, the comparison with the experiment was not conducted for the glued condition.
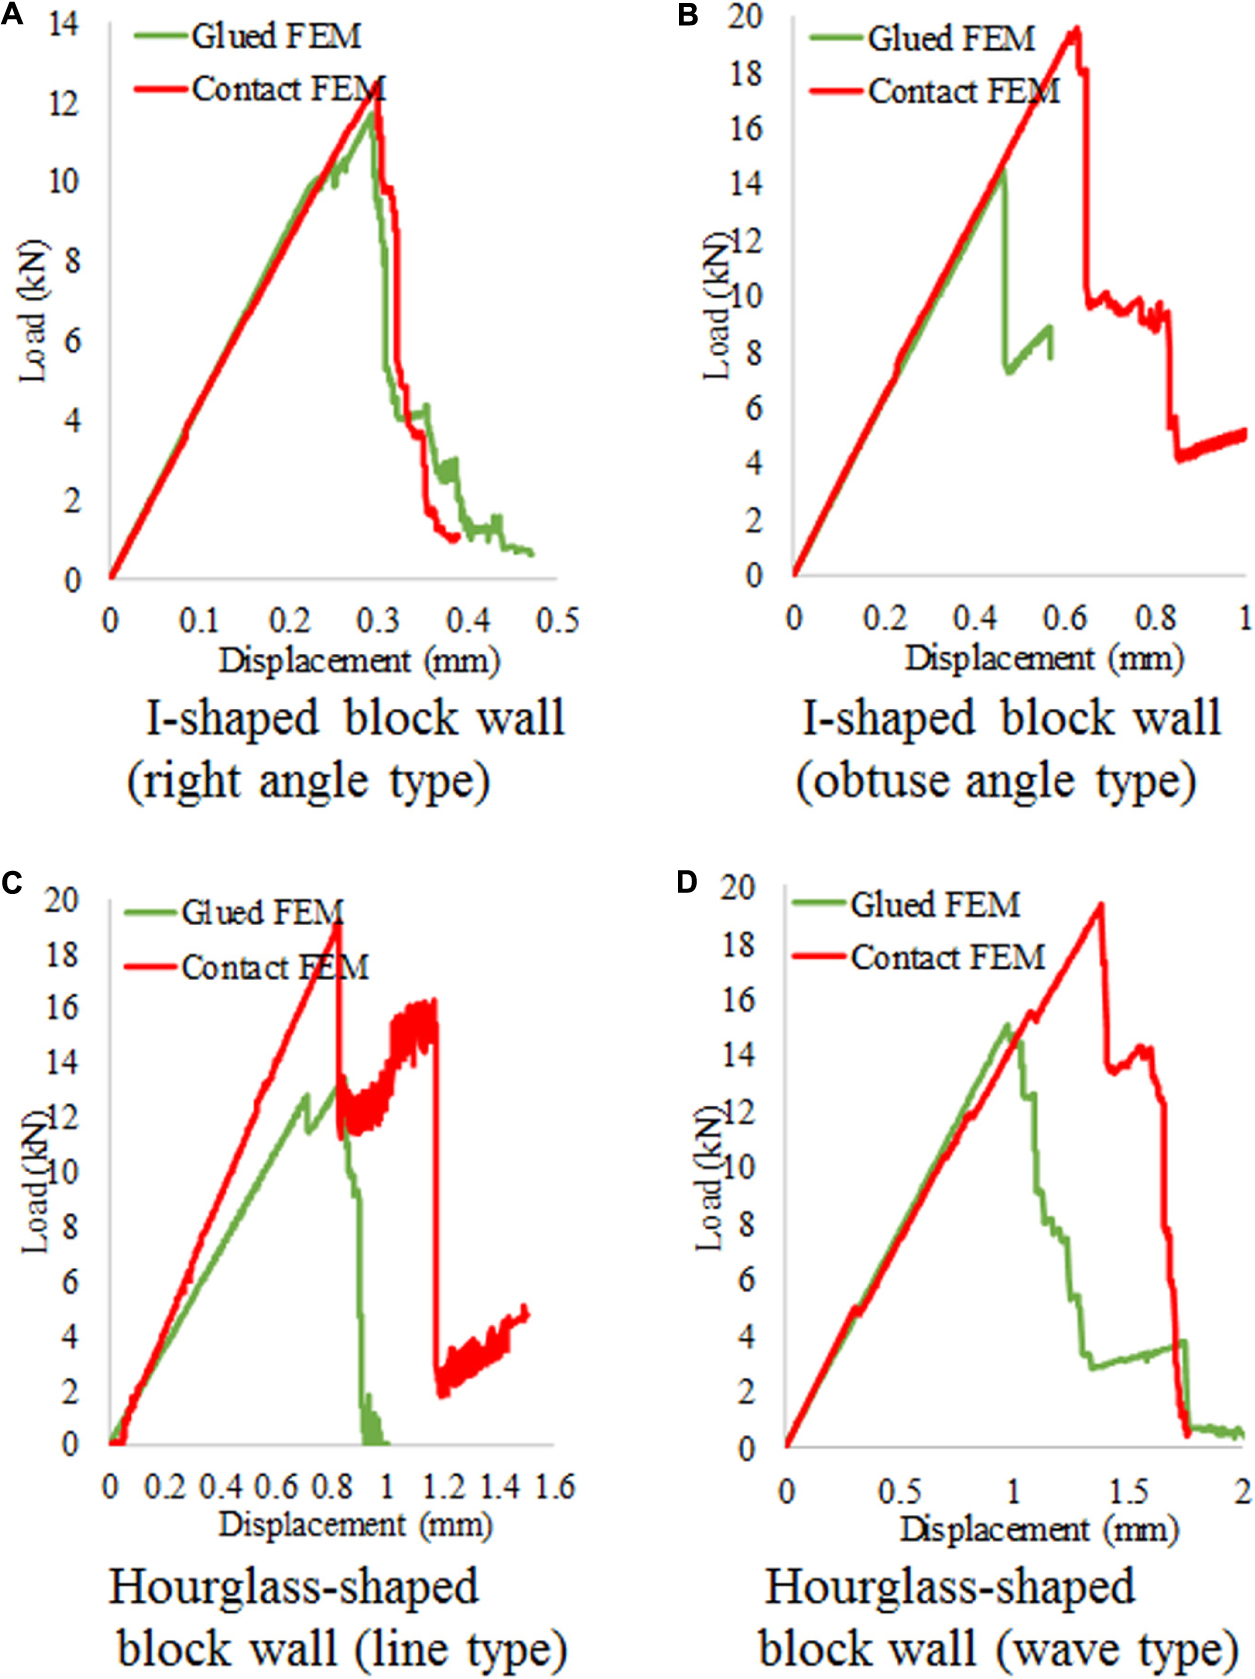
Figure 10. Load-displacement relationship of the analysis. (A) I-shaped block wall (right angle type). (B) I-shaped block wall (obtuse angle type). (C) Hourglass-shaped block wall (linear type). (D) Hourglass-shaped block wall (wavy type).
The curves are almost the same for the I-shaped block wall (right angle type) even though the maximum load with the contact condition is slightly larger than that with the glued condition. For the other three walls, the maximum load with the contact condition is larger than that with the glued condition. If the maximum load among the four block walls is compared, the I-shaped block wall (right angle type) with the strongest interlocking effect has the least maximum load. The maximum strength can be increased by changing the interlocking block with the right angle into the interlocking block with the smoother shape. There is no clear difference in the maximum load among the I-shaped block wall with the obtuse angle and the two hourglass-shaped block walls. However, there is a clear difference in the displacement. The displacement at the maximum load and the final displacement of the two hourglass-shaped block walls are larger than that of the I-shaped block wall with the obtuse angle. These trends are consistent with the experimental results.
Discussion
Table 5 summarizes the maximum load (strength) of the experiment and analysis under the two support conditions. In the experimental case where there are two test pieces, the average of two values was taken.
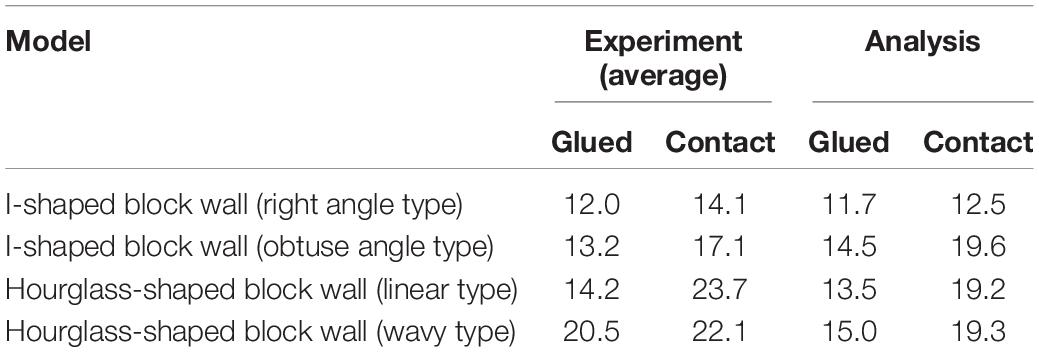
Table 5. Comparison of the maximum load (kN) between the experiment and the analysis.
The strength of the I-shaped block wall with the obtuse angle and two hourglass-shaped block walls had larger strength than that of the I-shaped block wall with the right angle both in the experiment and the analysis irrespective of the support conditions. This confirmed that the strength of the wall can be increased by utilizing the interlocking block with smoother shape.
The strength under the contact condition is larger than that under the glued condition irrespective of the block shape. Since the wall consists of four blocks only, it seems that the effect of the support condition was significant. It is speculated that the glued condition increased the wall integration, the strain was more locally increased due to the increase of the interlocking effect, and the strength was decreased.
Finally, the performance of four block walls was compared. The strength tends to increase as the interlocking effect becomes smaller. In terms of strength, the I-shaped block wall (right block wall) has the worst performance with the smallest strength and the hourglass-shaped block wall (wavy type) has the best performance with the largest strength.
However, the block wall with less interlocking effect tended to have larger displacement since the blocks are easier to dislocate and rotate. Therefore, the hourglass-shaped block wall (wavy type) has the largest strength and the largest displacement at the same time. How this large displacement affects the seismic performance of the wall with the diagonal compression test remains a topic for future discussion. Further study considering the masonry structure instead of the masonry wall with more realistic earthquake input is necessary.
Conclusion
In this study, diagonal compression tests were performed to investigate the effects of the interlocking block shape and the support conditions on the load-displacement relationship and failure behavior of the masonry wall. Four types of interlocking blocks were prepared: I-shaped block (right angle type), I-shaped block (obtuse angle type), hourglass-shaped block (linear type), and hourglass-shape block (wavy type). A 2-dimensional finite element analysis of the diagonal compression test was also conducted. The following findings were obtained.
The I-shaped block wall (right angle type) had the smallest maximum load (strength). By changing the right angle into an obtuse angle, or by changing the I-shaped block into an hourglass-shaped block, the strength can be increased even though the total wall size is the same. These tendencies were confirmed both in the experiment and analysis.
Compared to the I-shaped block walls, the hourglass-shaped block walls have larger displacement at the maximum load and larger final displacement, and the dislocation and rotation of the blocks are observed. These tendencies were confirmed both in the experiment and analysis. It was considered that the large displacement was caused by the dislocation and rotation of the blocks, and it is easier for the dislocation and rotation of blocks to occur due to the small interlocking effect.
From the strain distribution measured by the digital correlation system, strain concentration occurred at the interlocking part, and failure occurred at the area where the strain concentrated. The same tendency was also found in the analysis. The maximum principal strain was not uniformly distributed but locally concentrated in the top and bottom blocks where these blocks interlock with the middle blocks or jigs.
From both the experiment and analysis, it was concluded that the failure of the interlocking block wall occurs at the interlocking parts due to the local strain concentration. It was also concluded that the strength of the interlocking block wall can be increased by changing the block shape with less interlocking effect. However, the hourglass-shaped block wall has larger displacement at the same time since it is easier for the dislocation between blocks and rotation of blocks to occur compared to the I-shaped block walls. The influence of larger displacement on the stability of the structure is unclear. Therefore, it cannot be said that the interlocking blocks are advantageous compared to the traditional rectangular blocks.
The authors think that the influence of the larger displacement of the hourglass-shaped block should be investigated using a three-dimensional masonry structure model instead of the masonry wall model. In a future plan, further study will be conducted on the performance of interlocking blocks and the effect of block shape considering the three-dimensional masonry structure instead of the masonry wall with more realistic earthquake input. Moreover, the discussion of the construction cost is also necessary. Since the interlocking blocks need special molds, the producing cost of the interlocking blocks is more expensive than that of the traditional rectangular blocks. However, the producing cost can be reduced by mass production. Since the process of stacking the interlocking blocks is almost the same as that of the traditional rectangular blocks, the construction cost is not expected to be significantly different. The final goal is to clarify whether the interlocking blocks have an advantage over traditional rectangular blocks by comparing the seismic performance and the construction cost.
Data Availability Statement
All datasets presented in this study are included in the article/supplementary material.
Author Contributions
AF determined the research plan. AF and KM carried out the experiment and the numerical analysis. JK gave valuable comments and guidance. All authors contributed to the article and approved the submitted version.
Conflict of Interest
The authors declare that the research was conducted in the absence of any commercial or financial relationships that could be construed as a potential conflict of interest.
Acknowledgments
We would like to thank Profs. Shiotani, Nishida, Asaue, and Hashimoto from Kyoto University for allowing us to use the digital correlation systems and for providing valuable assistance during the experiment.
References
Ali, M., and Chouw, N. (2013). Experimental investigations on coconut-fibre rope tensile strength and pullout from coconut fibre reinforced concrete. Construct. Build. Mater. 41, 681–690. doi: 10.1016/j.conbuildmat.2012.12.052
Ali, M., Gultom, R. J., and Chouw, N. (2012). Capacity of innovative interlocking blocks under monotonic loading. Construct. Build. Mater. 37, 812–821. doi: 10.1016/j.conbuildmat.2012.08.002
Carrasco, E. V. M., Mantilla, J. N. R., Espósito, T., and Moreira, L. E. (2013). Compression performance of walls of interlocking bricks made of iron ore byproducts and cement. Intern. J. Civil Environ. Eng. 13, 56–62.
Correlated Solutions (2020). The VIC3D System. Available online at: http://correlatedsolutions.com/vic-3d/ (accessed April 17, 2020).
Darbhanzi, A., Marefat, M. S., and Khanmohammadi, M. (2014). Investigation of in-plane seismic retrofit of unreinforced masonry walls by means of vertical steel ties. Construct. Build. Mater. 52, 122–129. doi: 10.1016/j.conbuildmat.2013.11.020
Furukawa, A., Kimura, S., and Kiyono, J. (2018a). Study on failure mechanism and strength increment effect of masonry walls made of interlocking bricks. J. Jpn. Soc. Civil Eng. Ser. A1 74, I_699–I_711. doi: 10.2208/jscejseee.74.I_699
Furukawa, A., Masuda, K., Daru, G. T. S., and Kiyono, J. (2018b). Shape effect of interlocking blocks on force-displacement relationship and failure behavior of masonry wall. J. Struct. Eng. 64A, 241–249.
Giardini, D., Gruenthai, G., Shedlock, K., and Zhang, P. (2003). “The GSHAP global seismic hazard map,” in International Handbook of Earthquake and Engineering Seismology, 1B, eds W. H. K. Lee, H. Kanamori, P. C. Jennings, and C. Kisslinger (London: Academic Press), 1233–1239. doi: 10.1016/s0074-6142(03)80188-2
Marcari, G., Manfredi, G., Prota, A., and Pecce, M. (2007). In-plane shear performance of masonry panels strengthened with FRP. Composit. Part B 38, 887–901. doi: 10.1016/j.compositesb.2006.11.004
MSC Software Corporation (2020). Marc. Available online at: https://www.mscsoftware.com/ja/product/marc (accessed April 17, 2020).
Navaratnarajah, S., Kotaro, S., and Kimiro, M. (2009). Experimental study of PP-band retrofitted masonry structure made of shapeless stone. Seisan Kenkyu 61, 1051–1054.
Office for the Coordination of Humanitarian Affairs [OCHA] (2015). Available online at: http://www.unocha.org (accessed April 17, 2020).
Sanada, Y., Diawati, M., and Kojima, K. (2010). Preventing collapse of vulnerable R/C buildings using wood interlocking blocks. J. Adv. Conc. Technol. 8, 213–221. doi: 10.3151/jact.8.213
Sanada, Y., Nakamura, Y., Yamauchi, N., and Akano, Y. (2006). “Seismic performance of masonry walls using interlocking units,” in Proceedings of the First European Conference on Earthquake Engineering and Seismology, Paper No. 508 Geneva.
Sanada, Y., Yamauchi, N., Takahashi, E., Nakano, Y., and Nakamura, Y. (2008). “Interlocking block infill capable of resisting out-of-plane loads,” in Proceeding of the 14th World Conference on Earthquake Engineering, Beijing.
Thanoon, W. A. M., Alwathaf, A. H., Noorzaei, J., Jaafar, M. S., and Abdulkadir, M. R. (2008). Finite element analysis of interlocking mortarless hollow block masonry prism. Comput. Struct. 86, 520–528. doi: 10.1016/j.compstruc.2007.05.022
Keywords: masonry wall, interlocking block, block shape, support condition, force-displacement relationship, strength, failure behavior
Citation: Furukawa A, Masuda K and Kiyono J (2020) Diagonal Compression Test of Mortar Interlocking Masonry Walls With Various Block Shapes and Different Support Conditions. Front. Built Environ. 6:579366. doi: 10.3389/fbuil.2020.579366
Received: 02 July 2020; Accepted: 26 August 2020;
Published: 15 September 2020.
Edited by:
Yoshikazu Araki, Nagoya University, JapanReviewed by:
Prachand Man Pradhan, Kathmandu University, NepalRita Bento, University of Lisbon, Portugal
Copyright © 2020 Furukawa, Masuda and Kiyono. This is an open-access article distributed under the terms of the Creative Commons Attribution License (CC BY). The use, distribution or reproduction in other forums is permitted, provided the original author(s) and the copyright owner(s) are credited and that the original publication in this journal is cited, in accordance with accepted academic practice. No use, distribution or reproduction is permitted which does not comply with these terms.
*Correspondence: Aiko Furukawa, ZnVydWthd2EuYWlrby4zd0BreW90by11LmFjLmpw