Abstract
The properties of hurricanes directly influence storm surges; however, the implications of projected changes to the climate are unclear. Here, we simulate the storm surges of historical storms under present day and end of century climate scenarios to assess the impact of climate change on storm surge inundation. We simulate 21 storms that impacted the Gulf of Mexico and Atlantic Coasts of the continental U.S. from 2000 to 2013. We find that the volume of inundation increases for 14 storms and the average change for all storms is +36%. The extent of inundation increases for 13 storms, and the average change for all storms is +25%. Notable increases in inundation occur near Texas, Louisiana, Mississippi, the west coast of Florida, the Carolinas, and New Jersey. Our calculations of inundation volume and extent suggest that at the end of the century, we can expect hurricanes to produce larger storm surge magnitudes in concentrated areas, as opposed to surges with lower magnitudes that are widespread. We examine changes in maximum wind speed, minimum central pressure, translation speed, and radius of the 33 ms−1 wind to assess the impacts of individual storm characteristics on storm surge. We find that there is no single storm characteristic that directly relates to storm surge inundation or its climate induced changes. Even when all the characteristics are considered together, the resulting influences are difficult to anticipate. This is likely due to the complexity of the hydrodynamics and interactions with local geography. This illustrates that even as climate change research advances and more is known about projected impacts to hurricanes, implications for storm surge will be difficult to predict without explicit numerical simulation.
1. Introduction
Climate change will have significant implications for built environments, particularly those that lie within coastal regions. Coastal regions are routinely threatened by hazards including beach erosion and flooding from tropical cyclones. Climate change is intensifying these hazards due to several factors, e.g., increases in local sea levels, wave energy, and hurricane intensity (Hemer et al., 2013; Kopp et al., 2014; Walsh et al., 2016). As the number of coastal residents continues to increase (Neumann et al., 2015), it is increasingly important that the impacts of climate change on tropical cyclones and their ensuing hazards are explored.
Storm surges are of particular concern, as they pose a great threat to life and property. Storm surges occur when the high wind speeds and low pressure areas of tropical cyclones force ocean water toward and into coastal regions. Historically, it has been assumed that storm surge is directly and solely related to hurricane intensity, i.e., maximum sustained wind speed and minimum central pressure. However, over time, historical evidence and research have shown that other meteorological properties of hurricanes including size, translation speed, and angle of approach, as well as geophysical characteristics of impacted areas (e.g., coastal geography, topography, and bottom friction) have significant impacts on the generation and propagation of storm surges (Irish et al., 2008; Rego and Li, 2009, 2010; Resio et al., 2009; Irish and Resio, 2010; Weaver and Slinn, 2010; Mayo et al., 2014; Needham and Keim, 2014; Akbar et al., 2017; Fossell et al., 2017; Thomas et al., 2019; Ramos-Valle et al., 2020).
A rich body of work investigating the impacts of climate change on the meteorological properties of tropical cyclones has been developed in recent decades. Among studies that have explored impacts on hurricane intensity, most agree maximum wind speeds and minimum pressures are likely to intensify by the end of the 21st century. Both theoretical and numerical models have consistently shown that the globally averaged intensity (i.e., maximum wind speeds) of tropical cyclones will shift toward stronger storms, with intensity increases of 2–11% by 2100 (Knutson et al., 2010; Walsh et al., 2016). Emanuel (2005) developed a destruction index and used it to demonstrate that climate change may increase the intensity-based destruction of tropical cyclones in the future. This is supported by their earlier finding that peak wind speeds of tropical cyclones should increase by 5% for every 1°C increase in tropical ocean temperature (Emanuel, 1987). Holland and Bruyère (2014) developed a climate change index and showed that, globally, the number of intense hurricanes (Category 4 and Category 5) was increasing, although they also proposed the existence of a saturation level that prevented unbounded increases in the future.
Lynn et al. (2009) were among the first to project increases in hurricane intensity using numerical global climate modeling, and used simulations of Hurricane Katrina under climate change scenarios to show that wind speeds >60 m/s at landfall could be sustained for increasing duration at the end of the 21st century. Hill and Lackmann (2011) found an average increase in intensity of 14% for 75 of 78 high resolution simulations of hurricanes, and Patricola and Wehner (2018) also found significant increases in intensity for 11 of 15 storms simulated. Knutson et al. (2013) compared multimodel ensemble projections of downscaled climate models using data from the Intergovernmental Panel on Climate Change (IPCC) Third and Fifth Coupled Model Intercomparison Projects (i.e., CMIP3 and CMIP5) under the Representative Concentration Pathway (RCP) 4.5 (moderate) emissions scenario and found that the maximum hurricane intensity increased by 4–6%. Knutson et al. (2015) used a similar methodology using only CMIP5 data, and found a significant increase in average tropical cyclone intensity by the late 21st century (+4.1% globally and +4.5% in the North Atlantic basin). Kim et al. (2014) used numerical climate simulations to show that the intensity of tropical cyclones will increase by 2.7% in a climate with double the atmospheric concentration of CO2. Mudd et al. (2014) simulated 10K years of synthetic hurricane events for the Atlantic basin and found a significant increase in hurricane intensity when considering the effects of changes to SST (Sea Surface Temperature) only, hurricane genesis frequency only, and both climate change impacts simultaneously. Yates et al. (2014) simulated Hurricane Sandy under climate scenarios representative of 2020, 2050, and 2090, and found that intensity was generally within 5% of the control simulation, however in Lackmann (2015)'s exploration of Hurricane Sandy, they found that numerical models depicted a “significantly more intense system” in future climate scenarios.
Fewer studies have explored climate change impacts on hurricane size, another meteorological property that greatly influences storm surge inundation (Irish et al., 2008). There is not a strong consensus on the expected direction of the impact. Knutson et al. (2015) used numerical simulation to show changes to storm size at the end of the 21st century under the IPCC CMIP5 RCP 4.5 emissions scenario. They found a substantial increase (+11%) in the median size of storms in the North Atlantic basin, although, globally, the median storm size stayed nearly constant. Mudd et al. (2014) focused on the Northeast coastline of the U.S., and also found that for the year 2100, hurricane size would increase under current projections of changes to hurricane genesis. Kim et al. (2014) showed that tropical cyclone size would moderately increase, by about 3%, both globally and in the North Atlantic in response to doubling of the atmospheric concentration of CO2. Lin et al. (2015) used observational data to examine rainfall area, which directly reflects storm size. While they found storm size was related to relative sea surface temperature (i.e., spatially), they did not find it was related to absolute SST, and thus concluded changes in storm size were not expected in a warmer climate, provided changes to SST are relatively uniform in space. Lynn et al. (2009) used numerical simulations to demonstrate that the radius of strong winds in a storm like Hurricane Katrina would decrease in the latter part of the 21st century.
Even fewer studies have explored climate change impacts to the translation speed of tropical cyclones, which also plays an important role in storm surge inundation (Rego and Li, 2009; Thomas et al., 2019). Both the global and regional climate models of Knutson et al. (2013) demonstrated slight decreases (−3 and −1.9%, respectively) in the translation speed of hurricanes by the late 21st century, however neither result was statistically significant. Kim et al. (2014) found small increases (+0.6% globally and +2.7% in the North Atlantic basin), however their results also lacked statistical significance and they concluded that the translation speed of tropical cyclones would not significantly change over the 21st century with projected increases in atmospheric CO2 levels. More recently, Kossin (2018) discussed that anthropogenic warming is expected to decrease translation speeds of tropical cyclones in the future. They examined observational data and found that over the 68-years period 1949–2016, translation speeds of tropical cyclones had decreased by 10 and 16% globally and within the North Atlantic, respectively. However, Lanzante (2019) argued that although subtle effects due to anthropogenic climate change cannot be ruled out entirely, Kossin's findings were most likely not indicative of changes in the climate system, and were instead strongly influenced by natural climate variability and changes in measurement practices. Based on these findings, the impacts of climate change on the translation speed of tropical cyclones remain uncertain.
Although these storm characteristics are known to individually influence the extent and severity of storm surge flooding, questions surrounding their collective impact on storm surge remain. In general, coastal storm surges must be explicitly modeled using numerical simulation (Jelesnianski et al., 1992; Luettich et al., 1992; Mandli and Dawson, 2014). While an increasing number of studies have taken various approaches to exploring how climate change will impact coastal flood risk in the future (Lin et al., 2012; Needham et al., 2012; Murdukhayeva et al., 2013; Yates et al., 2014; Takayabu et al., 2015; Lin and Emanuel, 2016; Garner et al., 2017; Rahmstorf, 2017; Marsooli et al., 2019; Chen et al., 2020; Yin et al., 2020), it is unclear how these impacts specifically relate to individual tropical cyclone characteristics. Few studies have considered climate change impacts to tropical cyclone characteristics at all, and fewer studies have focused exclusively on the effects on storm surges, i.e., without introducing uncertainties related to sea level rise.
In Gutmann et al. (2018), projected climate change data were used with a convection-permitting regional climate model to reproduce U.S. landfalling hurricanes that occurred from 2000 to 2013 under an end of century climate scenario. The same hurricanes were hindcasted using present day atmospheric conditions, and changes to hurricane intensity, size, and translation speed were investigated (precipitation was also investigated; however, this meteorological property generally has implications for inland and compound flood risk, hazards which are beyond the scope of this paper). In an effort to understand the influence of climate change on storm surge risk, we use the projected and hindcasted hurricanes as the atmospheric forcing inputs to a high fidelity storm surge model, and investigate the changes to simulated inundation.
The paper is organized as follows. In section 2, we discuss the atmospheric and hydrodynamics models used for this work. We also describe the metrics used to quantify storm characteristics and storm surges. In section 3, we discuss the results of our storm surge simulations, and in section 4, we discuss the implications of our findings. We conclude by summarizing our results and identifying illustrated research needs in section 5.
2. Materials and Methods
2.1. Overview
Storm surge is modeled using the Advanced Circulation (ADCIRC) Model, which numerically simulates coastal hydrodynamics (Luettich et al., 1992). ADCIRC can be forced with meteorological input, and here we force it with data produced by the Weather Research and Forecasting (WRF) Model (Skamarock et al., 2005). The WRF simulations are produced using initial and boundary conditions representative of present day and end of century climate scenarios to depict hurricanes characteristic of both time periods. We use the existing WRF simulations of Liu et al. (2017), and specifically the hurricanes presented in Gutmann et al. (2018).
2.2. Atmospheric Modeling
2.2.1. WRF Model
The WRF Model is a three-dimensional, convection-permitting, regional climate model. It is a system that numerically solves the compressible, non-hydrostatic Euler equations, and can be used for a range of applications through a number of physics packages and data assimilation methods (e.g., weather forecasting and research Schwartz et al., 2015, climate simulations Rasmussen et al., 2011, and atmosphere-ocean coupling Nicholls and Decker, 2015). It can simulate both observed and hypothetical atmospheric conditions, and has been used for atmospheric research and operational forecasting since it was developed. Here, we use the output from simulations of the atmosphere created using WRF version 3.4.1 with a 5,440 km (east–west) by 4,064 km (north–south) domain spanning the contiguous U.S. and portions of Canada and Mexico (Figure 1). In the horizontal direction, a 4 km grid spacing is used on a lambert conformal-conic grid. In the vertical direction, 51 layers are used with the top level set to 50 hPa. Seven observational datasets were used to demonstrate that this model “faithfully captures the spatial and temporal pattern of sub-seasonal/seasonal/annual precipitation and temperature in most of” the Continental U.S (Liu et al., 2017). Additional details on the WRF configuration, physics parameterization, and uncertainty of the data used in this study can be found in Liu et al. (2017) and Gutmann et al. (2018).
Figure 1
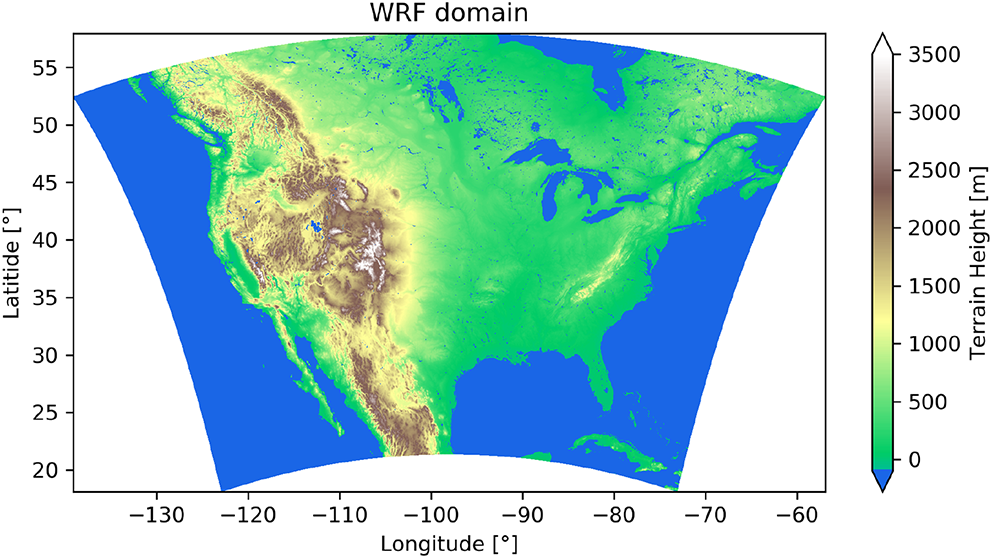
Domain of the Weather Research and Forecasting (WRF) model.
The WRF Model is implemented to produce high resolution simulations of hurricanes that impacted the U.S. between October 2000 and September 2013. The domain is not large enough to study changes in hurricane genesis, however removing this chaotic process facilitates comparison of otherwise identical storms from different climates. To simulate hurricanes under present day climate conditions (CTRL), WRF is forced with initial and boundary conditions derived from the ERA-Interim dataset (Dee et al., 2011). This data set specifies atmospheric characteristics, e.g., wind, temperature, humidity, and pressure, with temporal and spatial resolution of 6 h and 0.7°, respectively. Sea surface temperatures (SST) are also used to define the lower boundary condition throughout the simulation.
To simulate hurricanes under an end of century climate scenario, the pseudo-global warming (PGW) method is used (Schär et al., 1996; Rasmussen et al., 2011). A climate change signal is calculated using the RCP 8.5 (high) scenario as simulated by 19 different models in the IPCC CMIP5. The perturbation is calculated by averaging across the two periods 2071–2100 and 1976–2005, and then computing the difference. Thus, even though we only use 13 years of simulated weather for our study, the climate change signal itself is based on traditional 30 years averages imposed on the same weather. This approach avoids problems caused by internal variability (Deser et al., 2012), and is comparable to approaches used to study hurricanes in similar studies (Lackmann, 2015; Carroll-Smith, 2018; Jung and Lackmann, 2019; Chen et al., 2020). Inputs to the radiative transfer scheme are also modified to account for projected changes in greenhouse gases. The climate change signal is then applied to the WRF boundary conditions describing the zonal and meridional wind speeds, sea level pressure, geopotential height, air temperature, relative humidity, sea surface temperature, and initial soil temperature. The PGW changes in 700 hPa air temperature and relative humidity range by +3 to +4K and +2 to −2% over the Gulf of Mexico and North Atlantic during hurricane season. SSTs over the region increase by 3.2K. Changes to the other boundary conditions are modest.
2.2.2. Hurricane Simulations
Over the time period of interest (2000–2013), 32 named storms in the National Hurricane Center (NHC) best track hurricane (HURDAT) database (Landsea and Franklin, 2013) have track centers that come within 400 km of the WRF model domain. Of these, the WRF model is able to reasonably simulate the tracks, intensities, sizes, and translation speeds of 26 of them, although the more extreme intensities are slightly underestimated (i.e., the tails of the maximum wind speed and minimum central pressure distributions are under- and overestimated, respectively; see Figure 4 in Gutmann et al., 2018 for details). When the PGW method is implemented, WRF is able to successfully simulate all but one of these 26 storms, however three have relatively large changes between the simulated tracks of the present day and end of century climate scenarios. This makes it difficult to attribute changes in storm surge inundation to changing meteorological characteristics rather than changing storm tracks (i.e., landfall location). The latter is not examined in this study, thus we exclude these three storms from our analysis. More detail can be found in Gutmann et al. (2018). Finally, of the 22 remaining storms, one (Hurricane Gustav, 2002) causes numerical instabilities within the ADCIRC model, likely due to the position of this storm at the edge of the ADCIRC domain. The 21 storms that remain for analysis are listed chronologically in Table 3.
Of note, Hurricane Katrina is not included in this study. It is one of the six storms that was not well-simulated by the WRF model, and specifically its track did not accurately reflect HURDAT data. This is likely due to the placement of the southern boundary of the WRF domain, which is too close to the storm center for much of the track. Climate change impacts to the meteorological properties of Hurricane Katrina were investigated in Lynn et al. (2009) using a coarser 9 km WRF model with boundary conditions derived from the comparable A2 emissions scenario of the IPCC Fourth Assessment Report, and it was suggested that the storm would likely intensify in a warmer climate. We expect that storm surge would intensify as well, though as discussed in section 4.2, this is difficult to predict without explicit modeling.
2.2.3. Hurricane Intensity Metrics
Gutmann et al. (2018) computed the average maximum wind speed, minimum central pressure, radius of hurricane force winds, and translation speed of each simulated hurricane, taken across the duration of each storm. For each point along the simulated track, these statistics were computed using data from a 400 × 400 km region centered at a point of minimum pressure. Thus, the point of minimum pressure is computed as the point at the center of this region by definition. The maximum wind speed is simply the maximum (instantaneous) value in the region. The radius of the 33 ms−1 winds is computed as the average distance from the track center to the easternmost and westernmost points that exceed 33 ms−1. The translation or forward speed is computed by dividing the distance between the track center and the track center calculated 3,600 s prior by 3,600 s. Further details can be found in Gutmann et al. (2018). These values were used to determine statistically significant increases to the maximum wind speed, damage potential, and maximum rainfall rate, and statistically significant decreases to the translation speed and minimum central pressure of hurricanes over the 21st century. In this work, we use these metrics to assess how climate change impacts to tropical cyclone characteristics can be expected to influence storm surge inundation in the future.
2.3. Storm Surge Modeling
2.3.1. ADCIRC Model
The Advanced Circulation (ADCIRC) model is a numerical hydrodynamics model (Luettich et al., 1992). It solves a modified form of the shallow water equations through the discretization of spatial derivatives using a finite element method. The use of a finite element method allows the equations to be modeled using unstructured meshes, which offers the advantage of discretization with high resolution in regions of interest without the computational expense of increasing resolution uniformly throughout the entire spatial domain. This is especially advantageous for coastal hydrodynamics applications, where more spatial resolution is often desired near the coastline than in the deep ocean. Time derivatives are discretized using centered and forward finite differencing.
The ADCIRC model has been continually developed since its inception in the early 1990s, becoming increasingly robust for a number of applications. Notably, wetting and drying algorithms have been implemented to allow modeling of overland flooding (Luettich and Westerink, 1995; Dietrich et al., 2004). Especially important to modeling overland surge and flooding in regions of shallow water, bottom friction can be specified through spatially variable parameters (Passeri et al., 2013; Mayo et al., 2014). The ADCIRC model can also utilize various forms of meteorological input, including parametric wind profiles and gridded wind field data (Houston et al., 1999; Cyriac et al., 2018; Mayo and Lin, 2019). It has been extensively validated and verified for tropical cyclones around the world, and has been used for a range of modeling, planning, and emergency operations applications (Fleming et al., 2008; Dietrich et al., 2010; Butler et al., 2012; Lin et al., 2012). In this work we use the parallel implementation of version 53.04.
We convert WRF data to an ADCIRC readable format through several preprocessing steps. First, we project the simulated wind and pressure fields onto the Cartesian coordinates of the ADCIRC mesh. Then, pressure and directional wind data are used to create the meteorological forcing input files used in ADCIRC. Both of these steps are accomplished using Matlab and Python scripting. The data are also manually trimmed to exclusively span the spatial extent and duration of simulated hurricanes to improve computational efficiency.
2.3.2. HSOFS Mesh
We use the Hurricane Surge On-demand Forecast System (HSOFS) mesh, which was developed jointly by the National Ocean Service, Riverside Technology, and AECOM (Riverside Technology and AECOM, 2015). It spans the Gulf of Mexico and the U.S. Atlantic Coast, extending into the Atlantic Ocean to the approximate longitude of 65W (Figure 2). Nearshore, the mesh generally extends on to land up to a topographic height of 10 m. Because it was developed with the intent of operational use, it does not have the local resolution of more geographically-focused ADCIRC meshes, however it is one of the only meshes with national inundation coverage, i.e., it allows overland flooding to be modeled across the entire coastline of the eastern and southern U.S. It has a total of 1,813,443 vertices and 3,564,104 triangular elements, with an overland grid resolution that ranges from 150 to 500 m.
Figure 2
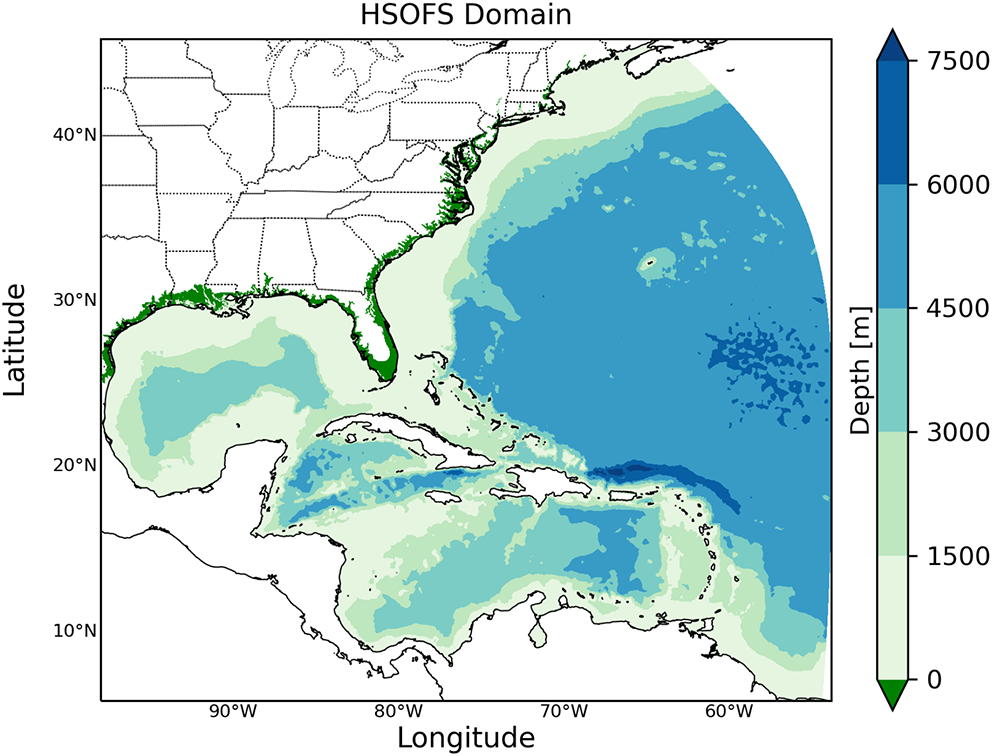
Computational domain (colored regions) and bathymetry of the Advanced Circulation (ADCIRC) model, the Hurricane Surge On-demand Forecast System (HSOFS) mesh. Bathymetry is shown in meters below mean sea level. Dark green regions are used to depict areas that are above sea level, i.e., overland.
Version 50.99 of ADCIRC was previously used to verify this mesh for astronomical tides and 10 major tropical and extratropical storms (i.e., Hurricanes Ike, Katrina, Dennis, Charley, Hugo, Floyd, Isabel, Sandy, and the Great New England Hurricane and Perfect Storm of 1938 and 1991, respectively). Storm surges were modeled primarily using high fidelity wind data developed by Ocean Weather, Inc. (OWI) (Hurricane Sandy and Hurricane Floyd were modeled using HWRF and Hwind data, respectively). The National Oceanic and Atmospheric Administration (NOAA) Coast Survey Development Laboratory Skill Assessment Software (Zhang et al., 2006, 2010) and high water marks were used to determine that maximum storm surge heights were modeled with an RMSE of 0.26 m, demonstrating the suitability of the HSOFS mesh for research applications.
ADCIRC is run with the HSOFS mesh for each WRF simulation to model the storm surge of hurricanes given present day and end of century climate scenarios. The simulations are executed using the high performance computing facilities at the Texas Advanced Computing Center and National Center for Atmospheric Research-Wyoming Supercomputing Center. On average, simulations ~2-weeks in length are completed in 1,440 core hours.
2.3.3. Surge Inundation Metrics
To quantify the storm surge risk modeled by ADCIRC, we use two metrics to describe storm surge inundation volume and extent. Because our interest is storm surge impacts to the built environment, we focus on inland geographical regions, i.e., those elements of the HSOFS mesh that are initially entirely above the reference sea level (geoid) defined in ADCIRC. Each ADCIRC simulation produces a global maximum water surface elevation file, which describes the peak storm surge height at each node of the mesh over the duration of the storm. For each inland (i.e., initially dry) element, we calculate its inundation volume using its (triangular) area and the peak storm surge height computed for each of its three nodes (i.e., vertices of each triangular element):
where Ve is the element volume, Ae is the element area, and Di is the water depth at node i. (When computing Ae, we use the World Geodetic System to account for the projection of the area onto the spherical earth.) We sum each of these element inundation volumes to compute a measure of total inundation volume for each simulation. A similar approach was used in Fossell et al. (2017).
If all three nodes of an inland element have a peak water elevation above zero (i.e., if the element inundation volume is >0), we consider its area to have been “wetted” by the simulated storm:
Here Aw is the wetted area. We sum each of these wetted element areas to compute a measure of total inundation extent for each simulation.
Both of these metrics allow storm surge to be quantified and compared across simulations, while accounting for the variable spatial resolution of the unstructured mesh. In contrast to more routinely used metrics, such as root mean square difference, regions with high spatial resolution are not weighted more heavily than those that are coarser. Additionally, uncertainties introduced by the description of the atmospheric characteristics, the numerical approximation of the WRF model, the deviations of the simulated hurricanes from observed data, the prescribed boundary conditions and wind field representation within ADCIRC, and the numerical approximation of the ADCIRC model all compound and propagate in complex ways that are difficult to quantify without formal analysis. The use of these inundation metrics serves to reduce the sensitivity of our results to these uncertainties by effectively smoothing error with integration (Oden, 2011; Smith, 2013).
3. Results
3.1. Simulated Storm Surge
3.1.1. Maximum Storm Surge Levels
The combined maximum storm surges of all 21 storms simulated for the present day climate scenario (CTRL) is shown in Figure 3A. The largest storm surges occur along the Gulf Coast, specifically near Texas, Mississippi, and the Florida panhandle. The highest surges were caused by Hurricane Ike that produced up to 9.8 m near the Galveston area. Maximum storm surges are less severe along the Atlantic coastline, with the largest levels attained near the Outer Banks of North Carolina and Chesapeake Bay in Virginia.
Figure 3
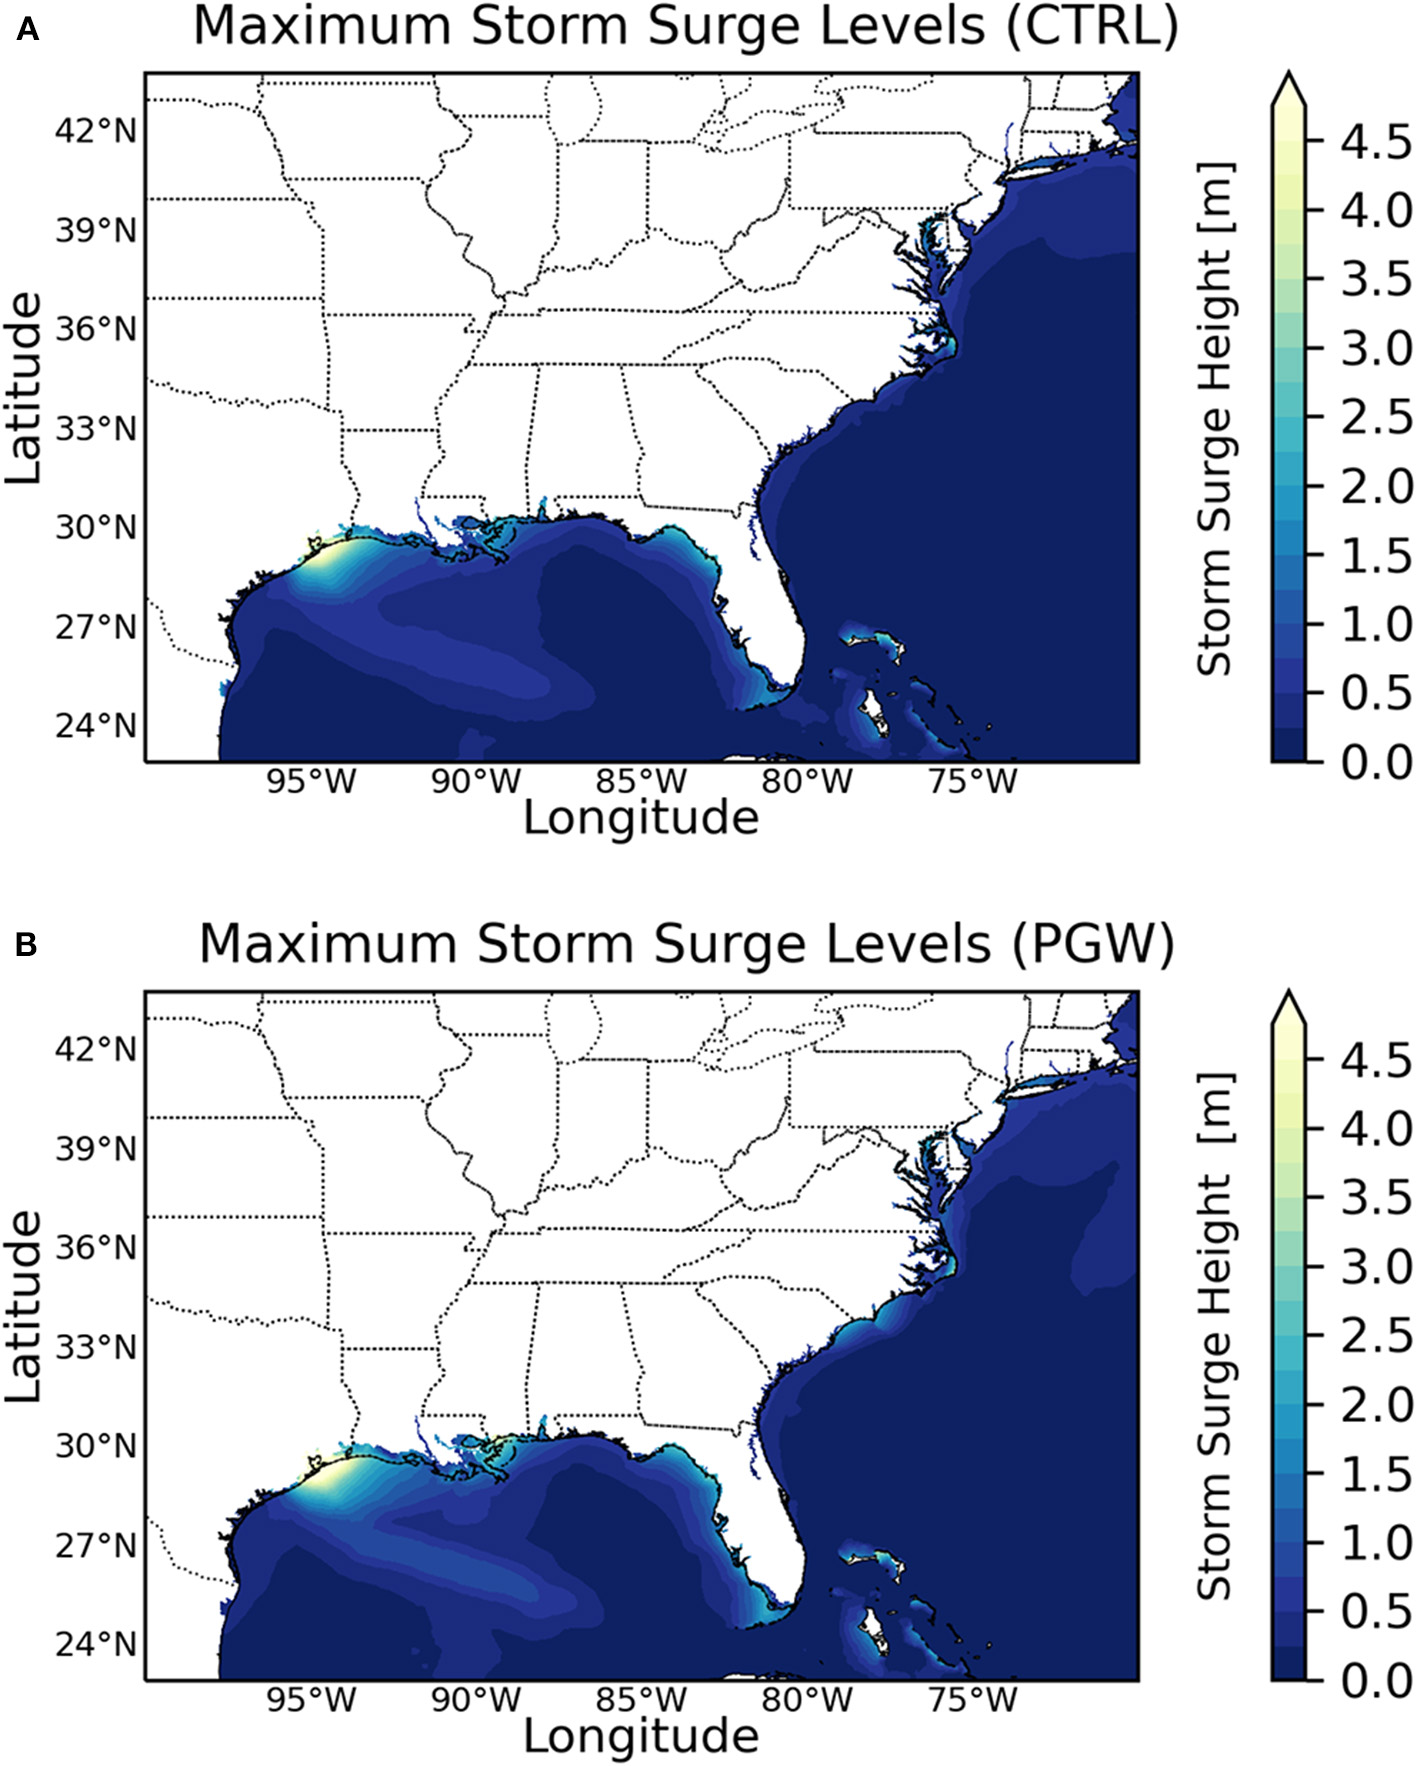
(A) A composite of the maximum storm surge levels of all 21 present day (CTRL) simulations. (B) A composite of the maximum storm surge levels of all 21 end of century (PGW) simulations.
The combined maximum storm surges of all 21 storms simulated for the end of century climate scenario (PGW) is shown in Figure 3B. Hereafter, hurricanes from these simulations are referred to as Hurricane(P). The largest storm surges occur in the same areas along the Gulf coast seen in the CTRL scenario, although the levels are greater. Water levels >5.0 m are seen in Texas and Mississippi. These large surges are caused by Hurricane Ike(P) and Hurricane Isidore(P), respectively. The surge caused by Hurricane Isidore(P) in Mississippi increases by 2.30 m from the CTRL scenario, while the surge caused by Hurricane Ike(P) in Texas increases surge by just 0.01 m. A greater extent of the Gulf side of Florida is affected by higher storm surges, including Tampa Bay, which is not inundated in the CTRL simulation. Along the Atlantic coast, North Carolina and Virginia remain affected, and substantial increases in storm surges are also seen near South Carolina and New York.
Overall, there is an increase in maximum storm surge levels from the CTRL to the PGW simulations. Figure 4 shows a more pronounced increase along the Gulf coast of more than 1.0 m. Notable increases are seen near Mississippi, the Gulf Coast of Florida, the Carolinas, and New York. However, there are parts of Albermarle Sound and Pamlico Sound in North Carolina and the eastern side of Chesapeake Bay that show lower surges (i.e., decreases ranging from about 0.5 to 1.0 m) in the PGW simulations. Few studies have implemented this methodology to deterministically assess climate change impacts to storm surges, however our results are consistent with Yates et al. (2014), who used the PGW method to assess climate change impacts to Hurricane Sandy over the 21st century and found significant increases to flood heights and inundation extent along the New Jersey and Long Island coasts. Additionally, Little et al. (2015) developed a novel flood index and demonstrated substantial and positively skewed changes to coastal flood risk along the east coast by the end of century, and Yin et al. (2020) used a fully coupled global weather and climate modeling system to simulate storm surge risk along the U.S. Atlantic Coast under elevated CO2 levels and also found increased storm surge risk.
Figure 4
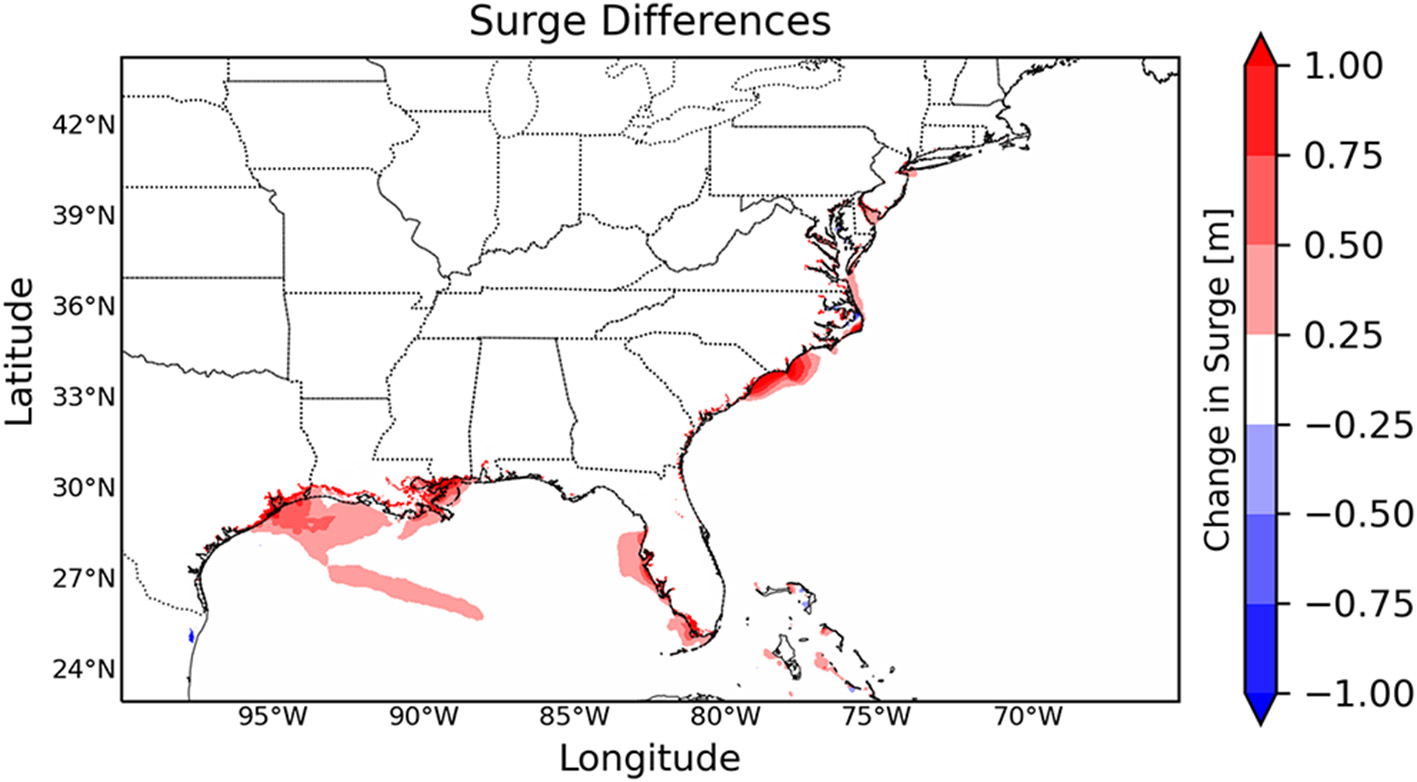
Difference (PGW-CTRL) between maximum storm surge levels over the 21st century.
3.1.2. Inundation Volume
The total volume inundated in each simulation, along with the relative change from the CTRL to the PGW simulations, is summarized in Table 1. Volumes are arranged in descending order based on the CTRL simulations, i.e., in order of decreasing severity for the present day scenario. Values for the CTRL simulations range from 0.01 to 22.81 km3, and have a mean value of 2.55 km3. Six storms (i.e., Hurricane Gustav, Hurricane Isaac, Hurricane Irene, Hurricane Rita, Hurricane Isidore, and Hurricane Ike) have inundation volumes above this mean. Notably, the inundation volume computed for Hurricane Ike is 22.81 km3, which is substantially (more than five times) larger than the next largest volume of 4.13 km3 (Hurricane Isidore). Figure 5A reflects the widespread flooding caused by Hurricane Ike near coastal Texas, and specifically near Galveston Bay and the Houston Ship Channel. Storm surge levels in this region exceed 5.0 m. Most (all but six) of the 21 CTRL simulations cause inundation volumes >1 km3.
Table 1
| Volume (km3) | ||||
|---|---|---|---|---|
| Year | Storm name | CTRL | PGW | Change (%) |
| 2008 | Ike | 22.81 | 30.13 | +32 |
| 2002 | Isidore | 4.13 | 6.62 | +60 |
| 2005 | Rita | 3.53 | 4.50 | +27 |
| 2011 | Irene | 3.47 | 3.67 | +6 |
| 2012 | Isaac | 3.45 | 7.87 | +128 |
| 2008 | Gustav | 2.74 | 2.44 | −11 |
| 2005 | Dennis | 1.88 | 4.35 | +132 |
| 2012 | Sandy | 1.87 | 3.05 | +63 |
| 2003 | Isabel | 1.47 | 1.18 | −20 |
| 2004 | Jeanne | 1.45 | 1.66 | +14 |
| 2004 | Ivan | 1.34 | 1.00 | −25 |
| 2004 | Frances | 1.32 | 3.45 | +161 |
| 2005 | Wilma | 1.04 | 1.54 | +48 |
| 2002 | Lili | 1.04 | 1.00 | −4 |
| 2008 | Hanna | 1.02 | 1.00 | −3 |
| 2010 | Earl | 0.31 | 0.52 | +68 |
| 2005 | Ophelia | 0.21 | 0.17 | −21 |
| 2006 | Ernesto | 0.19 | 0.20 | +3 |
| 2008 | Dolly | 0.12 | 0.18 | +55 |
| 2005 | Emily | 0.11 | 0.16 | +52 |
| 2010 | Alex | 0.01 | 0.01 | 0 |
| Average | 2.55 | 3.56 | +36 | |
Total inundation volumes computed for each hurricane and corresponding changes over the 21st century.
Figure 5
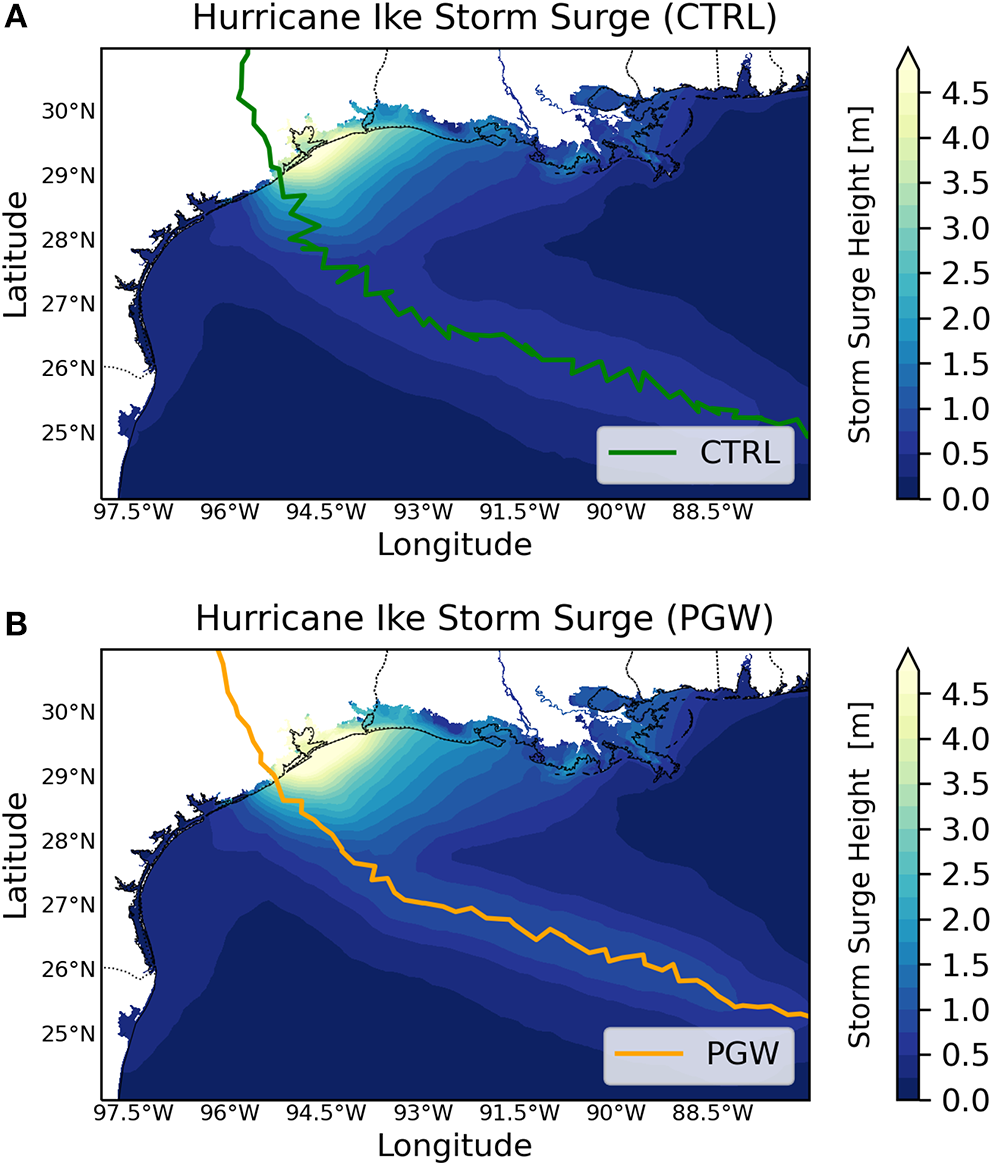
(A) Maximum storm surge levels of the Hurricane Ike CTRL simulation. (B) Maximum storm surge levels of the Hurricane Ike PGW simulation.
For the PGW simulations, the inundation volumes range from 0.01 to 30.13 km3, and the mean value increases to 3.56 km3. Six storms again have inundation volumes above this mean [Hurricane Dennis(P), Hurricane Isaac(P), Hurricane Irene(P), Hurricane Rita(P), Hurricane Isidore(P), and Hurricane Ike(P)]. The inundation volume computed for Hurricane Ike(P) remains the largest, and increases to 30.13 km3. Figure 5B illustrates more intense flooding than that seen in the CTRL simulation (Figure 5A), with high storm surge levels extending further inland and inundating Galveston Island. The inundation volume for Hurricane Ike(P) (30.13 km3) is again substantially larger than the next largest volume [7.87 km3 for Hurricane Isaac(P)]. However, Figure 6 shows that the changes are mostly limited to the states of Texas, Louisiana and some parts of Mississippi, where Ike (P) generally causes increases in water levels >1 m.
Figure 6
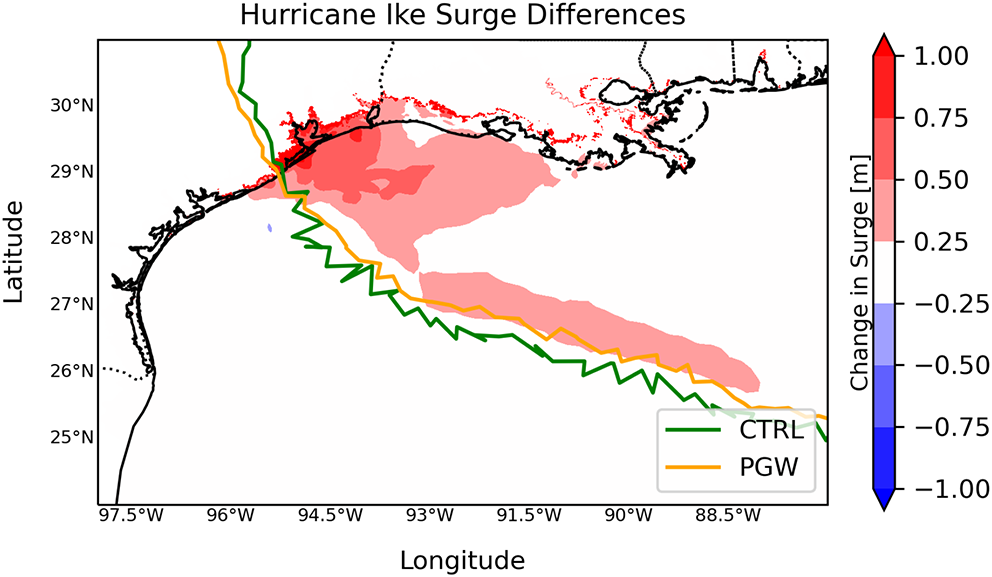
Difference (PGW-CTRL) between maximum storm surge levels over the 21st century for Hurricane Ike. The storm tracks for the CTRL (green) and PGW (orange) simulations are also included.
The inundation volumes of 14 storms increase across the climate scenarios (CTRL to PGW), with relative increases ranging from +3 to +161%. The largest relative increase occurs for Hurricane Frances(P). The inundation volume of Hurricane Alex does not change, while the inundation volume decreases for 6 storms, with Hurricane Ivan(P) decreasing the most, relatively (−25%). Across all simulations, the average change to inundation volume is an increase of 36%.
3.1.3. Wetted Area
The total area wetted in each simulation is summarized in Table 2. Areas are arranged in descending order based on the CTRL simulations, i.e., in order of decreasing severity for the present day scenario. Values for the CTRL simulations range from 69 to 16,224 km2, and have a mean value of 3,457 km2. Hurricane Ike is again worthy of note, and has the largest wetted area (16,224 km2; Figure 5A). The next largest wetted area is less than half of this (6,174 km2 for Hurricane Rita). Hurricane Isidore, Hurricane Irene, and Hurricane Sandy complete the set of the five storms with the largest wetted areas. All but three of the CTRL simulations cause wetted areas >1,000 km2.
Table 2
| Area (km2) | ||||
|---|---|---|---|---|
| Year | Storm name | CTRL | PGW | Change (%) |
| 2008 | Ike | 16,224 | 17,546 | +8 |
| 2005 | Rita | 6,174 | 5,414 | −12 |
| 2002 | Isidore | 5,377 | 6,232 | +16 |
| 2011 | Irene | 5,009 | 5,475 | +9 |
| 2012 | Sandy | 4,960 | 6,453 | +30 |
| 2008 | Gustav | 4,331 | 4,128 | −5 |
| 2004 | Jeanne | 3,600 | 2,593 | −28 |
| 2005 | Wilma | 3,289 | 3,815 | +16 |
| 2003 | Isabel | 3,240 | 2,639 | −19 |
| 2004 | Ivan | 3,177 | 2,702 | −15 |
| 2012 | Isaac | 3,037 | 10,457 | +244 |
| 2005 | Dennis | 2,924 | 4,613 | +58 |
| 2008 | Hanna | 2,669 | 2,625 | −2 |
| 2004 | Frances | 2,198 | 3,037 | +38 |
| 2002 | Lili | 2,130 | 2,147 | +1 |
| 2010 | Earl | 1,621 | 2,061 | +27 |
| 2005 | Ophelia | 1,104 | 1,082 | −2 |
| 2006 | Ernesto | 1,028 | 1,045 | +2 |
| 2008 | Dolly | 278 | 471 | +69 |
| 2005 | Emily | 170 | 313 | +84 |
| 2010 | Alex | 69 | 69 | 0 |
| Average | 3,457 | 4,044 | +25 | |
Total inundation extent (wetted area) computed for each hurricane and corresponding changes over the 21st century.
For the PGW simulations, wetted areas range from 69 to 17,546 km2, and the mean value increases to 4,044 km2. Hurricane Ike(P) again produces the largest wetted area, however there is not as great a difference between the two largest wetted areas. Hurricane Isaac(P) produces the second largest wetted area, 10,457 km2 (Figures 7A,B). The redistribution of water is illustrated in Figure 8. Hurricane Sandy(P), Hurricane Isidore(P), and Hurricane Irene(P) complete the set of the five storms with the largest wetted areas for the PGW simulations.
Figure 7
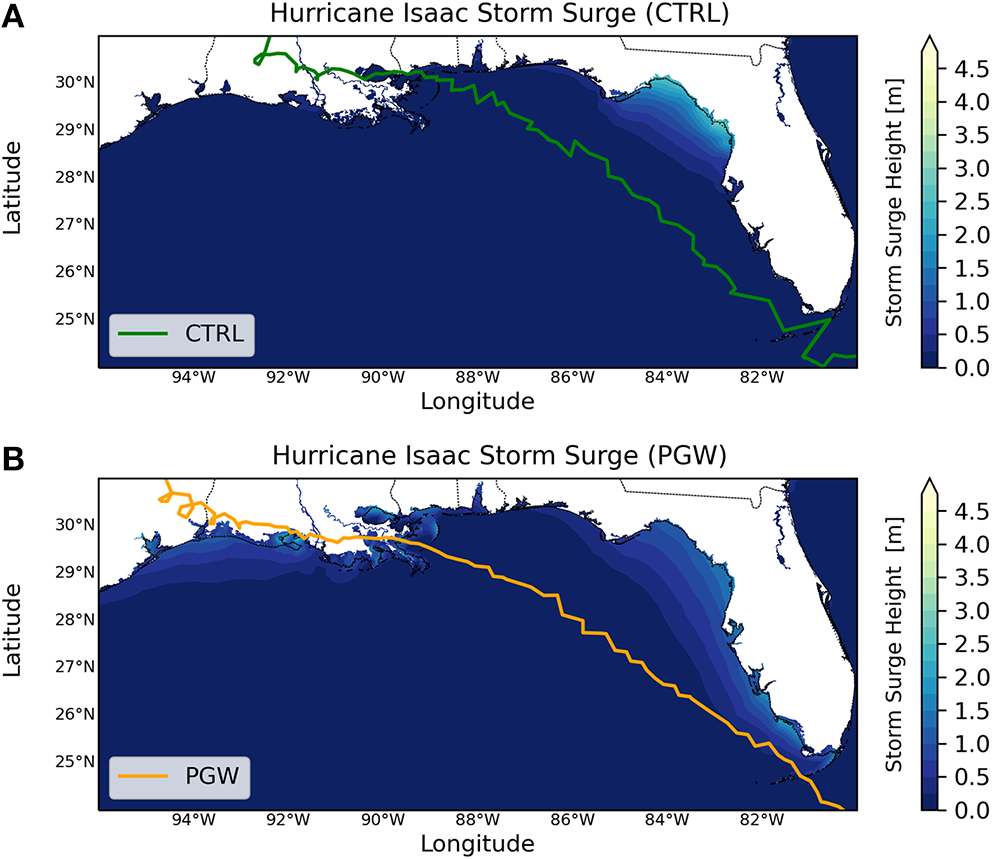
(A) Maximum storm surge levels of the Hurricane Isacc PGW simulation. Storm surges are lower, but affect portions of Louisiana and southwest Florida. (B) Maximum storm surge levels of the Hurricane Isaac CTRL simulation. Portions of northwest Florida are inundated with storm surges over 2 m.
Figure 8
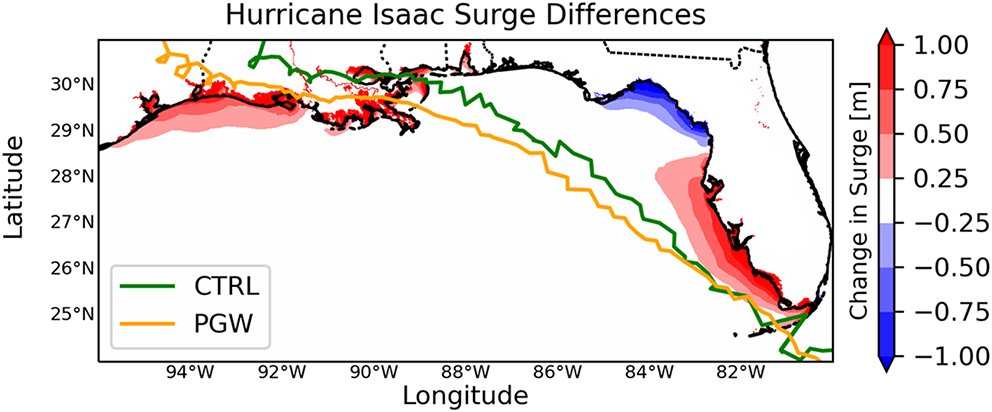
Difference (PGW-CTRL) between maximum storm surge levels over the 21st century for Hurricane Isaac. The storm tracks for the CTRL (green) and PGW (orange) simulations are also included.
The wetted areas of 13 storms increase across the climate scenarios (CTRL to PGW), with relative increases ranging from +1 to +244%. The largest relative increase occurs for Hurricane Isaac(P). The wetted area of Hurricane Alex does not change, and has the smallest wetted area under both climate scenarios. The wetted area decreases for seven storms, with relative decreases ranging from −2 to −28%. Hurricane Jeanne(P) has the largest relative decrease. Across all simulations, the average change in wetted area is +25%.
3.2. Storm Characteristics
The storm characteristics of each simulation are summarized in Table 3. This is a subset of the complete set of storm characteristics (i.e., including damage potential and rainfall rates) analyzed in Gutmann et al. (2018). On average, from the CTRL to the PGW simulations, the wind speeds and radii of the 33 ms−1 winds increase by +5.33 and +1.46%, respectively, and the translation speeds and central pressures decrease by −4.53 and −0.42%. Of note, the wind speeds are averaged over the entire duration of the hurricane and the averages thus include wind speed values that occur overland (averaging wind speeds over the 24-h period prior to landfall was explored but did not impact the results of this study). Additionally, the values are instantaneous wind speeds, differing from the oft reported 1-min averages. The values of the storm characteristics for each simulation are illustrated in Figure 9 (CTRL) and Figure 10 (PGW), arranged from top to bottom in order of increasing inundation volume. The changes in the storm characteristics are illustrated in Figure 11, arranged from top to bottom in order of increasing change to inundation volume.
Table 3
| Wind speed | Radius of | Translation | Central | ||||||||||
|---|---|---|---|---|---|---|---|---|---|---|---|---|---|
| (ms−1) | 33 ms−1wind (km) | speed (ms−1) | pressure (hPa) | ||||||||||
| Year | Storm | CTRL | PGW | Δ | CTRL | PGW | Δ | CTRL | PGW | Δ | CTRL | PGW | Δ |
| name | (PGW-CTRL) | ||||||||||||
| 2002 | Isidore | 23 | 25 | +2 | 84 | 94 | +10 | 5.2 | 6.4 | +1.2 | 979 | 975 | −4 |
| 2002 | Lili | 25 | 25 | 0 | 46 | 48 | +2 | 8.1 | 9.0 | +0.9 | 977 | 975 | −2 |
| 2003 | Isabel | 32 | 34 | +2 | 114 | 124 | +10 | 7.5 | 6.8 | −0.7 | 963 | 958 | −5 |
| 2004 | Frances | 34 | 33 | −1 | 82 | 81 | −1 | 5.9 | 5.7 | −0.2 | 966 | 965 | −1 |
| 2004 | Ivan | 35 | 36 | +1 | 106 | 100 | −6 | 6.8 | 6.4 | −0.4 | 963 | 962 | −1 |
| 2004 | Jeanne | 29 | 30 | +1 | 67 | 71 | +4 | 8.8 | 7.1 | −1.7 | 971 | 967 | −4 |
| 2005 | Dennis | 32 | 32 | 0 | 56 | 53 | −3 | 7.1 | 7.7 | +0.6 | 966 | 971 | +5 |
| 2005 | Emily | 34 | 36 | +2 | 62 | 45 | −17 | 6.1 | 6.0 | −0.1 | 969 | 967 | −2 |
| 2005 | Ophelia | 38 | 42 | +4 | 58 | 57 | −1 | 5.9 | 3.3 | −2.6 | 968 | 956 | −12 |
| 2005 | Rita | 36 | 35 | −1 | 61 | 60 | −1 | 5.6 | 5.7 | +0.1 | 964 | 967 | +3 |
| 2005 | Wilma | 26 | 30 | +4 | 121 | 116 | −5 | 7.2 | 6.3 | −0.9 | 976 | 967 | −9 |
| 2006 | Ernesto | 27 | 25 | −2 | 52 | 75 | +23 | 6.9 | 6.2 | −0.7 | 980 | 983 | +3 |
| 2008 | Dolly | 31 | 35 | +4 | 35 | 44 | +9 | 4.7 | 4.5 | −0.2 | 964 | 955 | −9 |
| 2008 | Gustav | 30 | 28 | −2 | 84 | 77 | −7 | 6.9 | 6.3 | −0.6 | 960 | 962 | +2 |
| 2008 | Hanna | 26 | 27 | +1 | 72 | 49 | −23 | 8.4 | 8.4 | 0 | 974 | 973 | −1 |
| 2008 | Ike | 37 | 42 | +5 | 111 | 112 | +1 | 8.1 | 6.7 | −1.4 | 953 | 941 | −12 |
| 2010 | Alex | 27 | 27 | 0 | 117 | 102 | −15 | 7.4 | 7.2 | −0.2 | 977 | 976 | −1 |
| 2010 | Earl | 34 | 42 | +8 | 93 | 108 | +15 | 10.1 | 10.6 | +0.5 | 963 | 953 | −10 |
| 2011 | Irene | 40 | 43 | +3 | 106 | 117 | +11 | 7.9 | 7.4 | −0.5 | 948 | 937 | −11 |
| 2012 | Isaac | 28 | 32 | +4 | 51 | 52 | +1 | 5.5 | 5.7 | +0.2 | 974 | 965 | −9 |
| 2012 | Sandy | 32 | 33 | +1 | 146 | 147 | +1 | 7.8 | 7.6 | −0.2 | 956 | 952 | −4 |
Summary of average hurricane characteristics of each simulated storm.
Figure 9
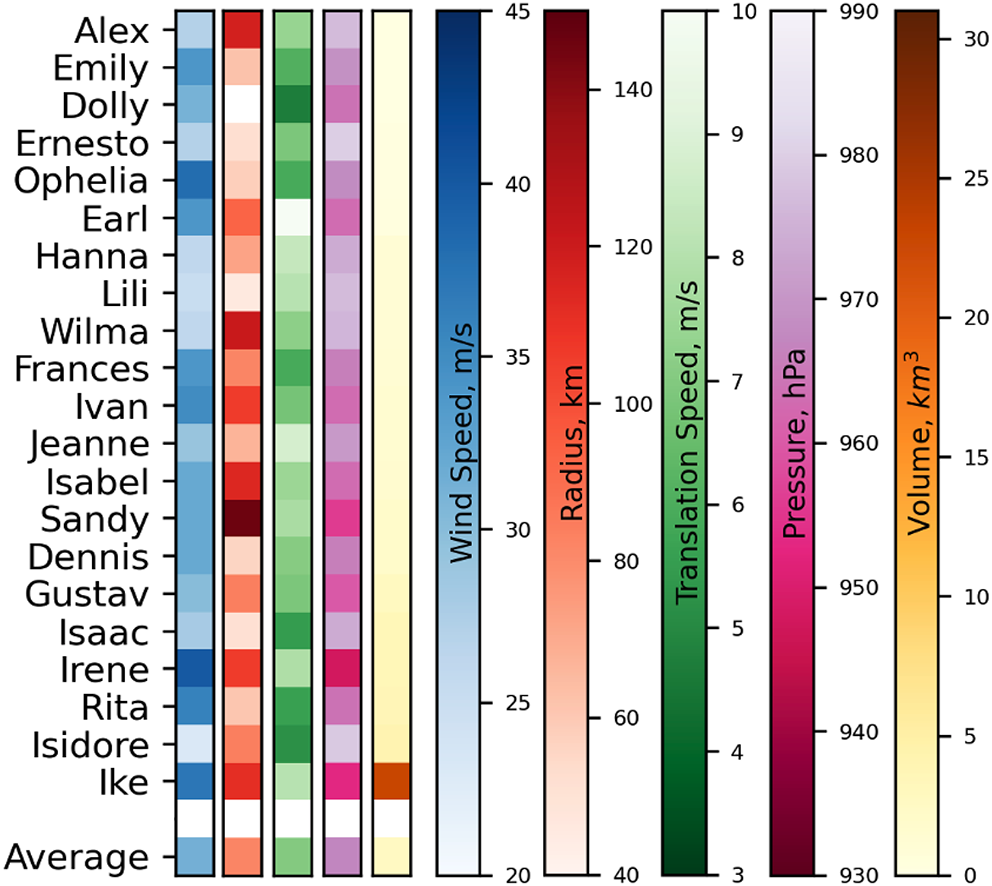
Average hurricane characteristics of each simulated storm arranged from top to bottom by increasing inundation volume of the CTRL simulations. Magnitudes of hurricane characteristics that theoretically contribute positively to larger surges (e.g., higher wind speeds, larger radii, and slower translation speeds) are depicted by darker hues.
Figure 10
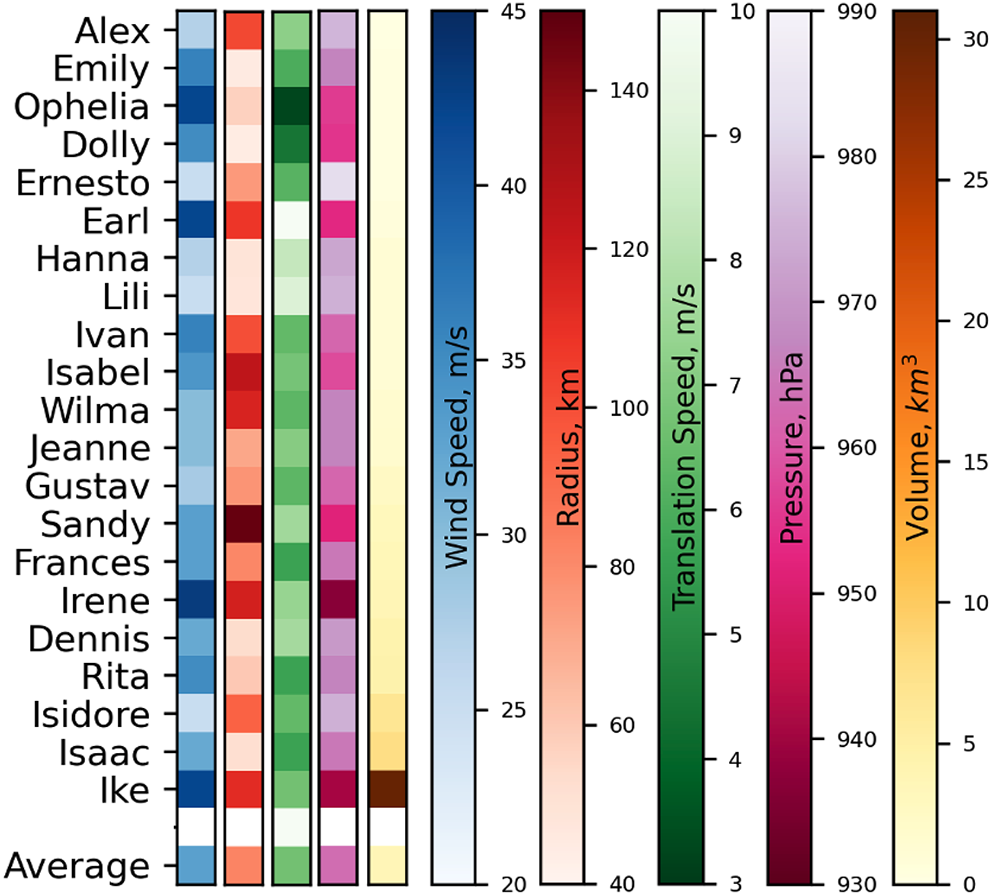
Average hurricane characteristics of each simulated storm arranged from top to bottom by increasing inundation volume of the PGW simulations. Magnitudes of hurricane characteristics that theoretically contribute positively to larger surges (e.g., higher wind speeds, larger radii, and slower translation speeds) are depicted by darker hues.
Figure 11

Differences (PGW-CTRL) in average hurricane characteristics arranged from top to bottom by increasing inundation volume. Decreases in translation speed and pressure contribute positively to larger surges so signs are reversed in this figure accordingly (e.g., decreases in translation speed are defined as positive changes).
4. Discussion
4.1. Impact on Inundation Volume and Extent
Our results indicate that we can generally expect remarkably greater severity of storm surges at the end of the century, as the volume and extent of inundation increase for most hurricanes examined here. The inundation volumes increase for 14 of 21 hurricanes, and the inundation volumes of three hurricanes (Hurricane Isaac, Hurricane Dennis, and Hurricane Frances) more than double over the century. Hurricane Ike produces the most severe storm surges for both climate scenarios, however the other storms do not change in severity uniformly. For example, the wetted area of Hurricane Isaac, which is near the mean for the present day climate scenario, substantially increases and its surge becomes the second most severe by this metric.
Hurricane Alex produces the smallest inundation volume and wetted area, and neither metric changes over the century. The hurricane tracks of both the CTRL and PGW simulations of this storm make landfall close to the Texas and Mexico border (see Figure 5 of Gutmann et al., 2018), close to the boundaries of the ADCIRC model domain. The simulations are likely impacted by limitations in the hydrodynamics modeling in this region.
The calculations of inundation volume and wetted area broadly indicate that in the future we can expect hurricanes to produce relatively more high storm surge levels in concentrated areas rather than smaller storm surges that are more wide spread, as inundation volumes generally increase more substantially than wetted areas. For example, Hurricane Jeanne and Hurricane Rita both produce decreases in wetted areas, but increases in inundation volume. On the other hand, we also find that storms that produce increases in wetted areas do not necessarily cause increases to inundation volumes. Hurricane Lili(P) shows a small increase in area (+1%) but decreases in inundation volume (−4%). In these cases, the heights of storm surges may decrease, while a larger area is impacted. The relationship between inundation volume and wetted area must be closely examined for specific impacted regions, as both are greatly impacted by local topography, but in general we expect that coastal inundation will increase in the future.
The potential societal impacts of these findings are vast. Increased inundation increases the number of people and property threatened by storm surge, particularly as coastal populations and the associated urban development grow (Neumann et al., 2015). Beyond increased fatalities, this can have long lasting consequences for the under- and uninsured, and agencies, such as the Federal Emergency Management Agency (FEMA), which provide disaster assistance and already substantially contribute to the national deficit. Increased inundation also poses a greater threat to infrastructure. Transportation networks may face greater obstructions during and after a storm, impeding evacuation efforts and access to medical care and other resources. Widespread flooding can also flood power equipment and limit the mobility of power restoration crews, which can cause and extend the power outages that often accompany hurricanes, resulting in large economic and social losses. Increased inundation can also have a number of environmental impacts, for example by exacerbating other hazards, such as inland flooding caused by obstructions to drainage systems, and saltwater intrusion which can have catastrophic consequences for agriculture and the biogeochemical cycles of coastal ecosystems.
4.2. Influence of Storm Characteristics
We examine the relationships between storm surge inundation and storm characteristics to gain more insight into the impacts of climate change. The coastal research community generally agrees on the influences of individual storm characteristics to storm surges. Higher intensity hurricanes, i.e., those with larger maximum wind speeds and lower minimum pressures, produce larger storm surges, all other things being equal. Slower-moving hurricanes produce more storm surges inland, while faster-moving storms cause higher water levels along the coast (Rego and Li, 2009). Larger storms, particularly those that translate over mildly sloping beaches, e.g., Hurricane Katrina, are expected to produce higher surges than smaller storms that translate over steeper continental shelves (Irish et al., 2008). Given this, six hurricanes in our study have storm characteristics that change over the century in precisely the directions that would theoretically result in increased storm surges. They are Hurricane Isabel, Hurricane Jeanne, Hurricane Ike, Hurricane Dolly, Hurricane Sandy, and Hurricane Irene (Figure 11). Simulations of five of the six named storms do produce increases in inundation (Hurricane Isabel is the exception). However, the magnitudes of the increases greatly vary by storm, ranging from +6 to +63%, and a number of hurricanes without this “perfect storm” of changes produce more substantial increases in surge. Hurricane Sandy is notable on this list, because it was historically one of the costliest storms, and much of the cost was associated with the flooding caused by the storm surge. This storm has substantial intensification of the simulated pressure, however the changes in the other storm characteristics are mild in comparison to those of other storms.
Figure 11 further illustrates the variation in the influences of individual storm characteristics on storm surge inundation. As the storms are ordered by increasing changes to volume inundation, we expect to see systematic changes to the storm characteristics. However, we do not see such changes. In particular, wind speed does not strongly nor directly relate to the severity of surges. Furthermore, the five hurricanes that produce inundation volumes with the largest increases do not share similarities in the directions of change to their storm characteristics. In fact, Hurricane Frances, which produces the largest increase in inundation volume, decreases in both wind intensity and radius. It does decrease in translation speed (and central pressure), but only by 3%, which is lower than the average decreases of translation speeds for the full set of storms studied here. This could suggest that changes in translation speed play a more significant role in storm surge generation than previously indicated. However, in contrast, Hurricane Ophelia has the largest decrease in translation speed (44%), yet produces a significant decrease of inundation volume. It is evident that more research is needed to better understand the role of translation speed on storm surge generation in combination with other storm characteristics in both present day and future climate scenarios.
Upon closer examination of the two other storms whose inundation volumes double over the century, i.e., Hurricane Dennis and Hurricane Isaac, there is generally no discernible pattern emerging in the hurricanes that produce substantial increases in inundation volume.
Six storms produce decreases in inundation volumes. For example, the inundation volume of Hurricane Gustav, which was one of the more severe hurricanes of the CTRL simulations (2.74 km3), decreases by 11%. The wind speed, translation speed, and radius decrease, while the central pressure increases, i.e., each characteristic decreases in severity with the exception of translation speed. This is similar to the behavior observed in the storm characteristics of Hurricane Frances, however the impacts on storm surge are much different.
These results demonstrate that there is no single storm characteristic for which changes induced by climate can predict impacts to storm surge severity. Even when considered in conjunction, the resulting influences are difficult to anticipate. Our results may be influenced by moderate differences in tracks of the CTRL and PGW simulations, which can have important implications for landfall location and angle of approach. Perpendicularly landfalling storms tend to produce more wide spread surges than those that make landfall diagonally, however this is rare (Hall and Sobel, 2013; Ramos-Valle et al., 2020). Also, in some areas, track fluctuations lead to landfalls of areas with different physical characteristics of the coastline and shelf that can either amplify or diminish surge magnitude (Azam et al., 2004; Mori et al., 2014). It is unlikely that the moderate differences in tracks observed in this study would significantly impact computed inundation volumes (Resio et al., 2009); however, the impact of local topography and bathymetry, including how these may also be impacted by climate change, should be investigated further.
4.3. Study Limitations
The methodology presented here offers a framework with which climate change impacts to storm surge inundation can be systematically assessed; however, there are several limitations. Here, we focus exclusively on storm surge, i.e., we do not simulate astronomical tides, waves, or sea level rise. While this reduces the introduction of uncertainties related to the timing of hurricane landfall, resolution of short period waves, and projections of local sea level rise, these phenomena can have important impacts on total water levels (Rego and Li, 2010; Dietrich et al., 2011; Atkinson et al., 2013; Bilskie et al., 2014). As a result, in the future, coastal inundation may become more extreme than the results of this study suggest.
Additionally, we do not account for coastal morphodynamics and land use change. Coastal morphodynamics and hydrodynamics are coupled processes, with each directly impacting the other (Roelvink et al., 2009). As such, climate change impacts including sea level rise and increases to tropical cyclone intensity and frequency will likely cause morphological changes to the U.S. coastline, with important implications for coastal flood risk (Passeri et al., 2015; Ozkan et al., 2020; Roelvink et al., 2020). Furthermore, land use is also changing with population growth and urban development (Lawler et al., 2014). This can significantly impact the climate and coastal flood risk, as was recently observed during Hurricne Harvey (Kalnay and Cai, 2003; Zhang et al., 2018).
The tracks, landfall locations, and intensities of several simulated hurricanes differ slightly from those reported in the HURDAT database (Gutmann et al., 2018), which are also subject to error (Landsea and Franklin, 2013). These differences impact the locations and magnitudes of flooding simulated (Weisberg and Zheng, 2006; Sebastian et al., 2014). These differences also make it difficult to systematically verify our simulations with observational data, e.g., from high water marks and tide gauges (exemplary hydrographs of Hurricane Ike, the simulations of which had good agreement with HURDAT data, are shown in Figure 12). As the main objective of this study is to investigate climate induced changes to storm surges, we have not included extensive verification exercises here, though preliminary analyses show reasonable reproduction of observed peak storm surge levels and timing. The use of the inundation metrics described in section 2.3.3 reduces the sensitivity of our assessment to the slight storm variations.
Figure 12
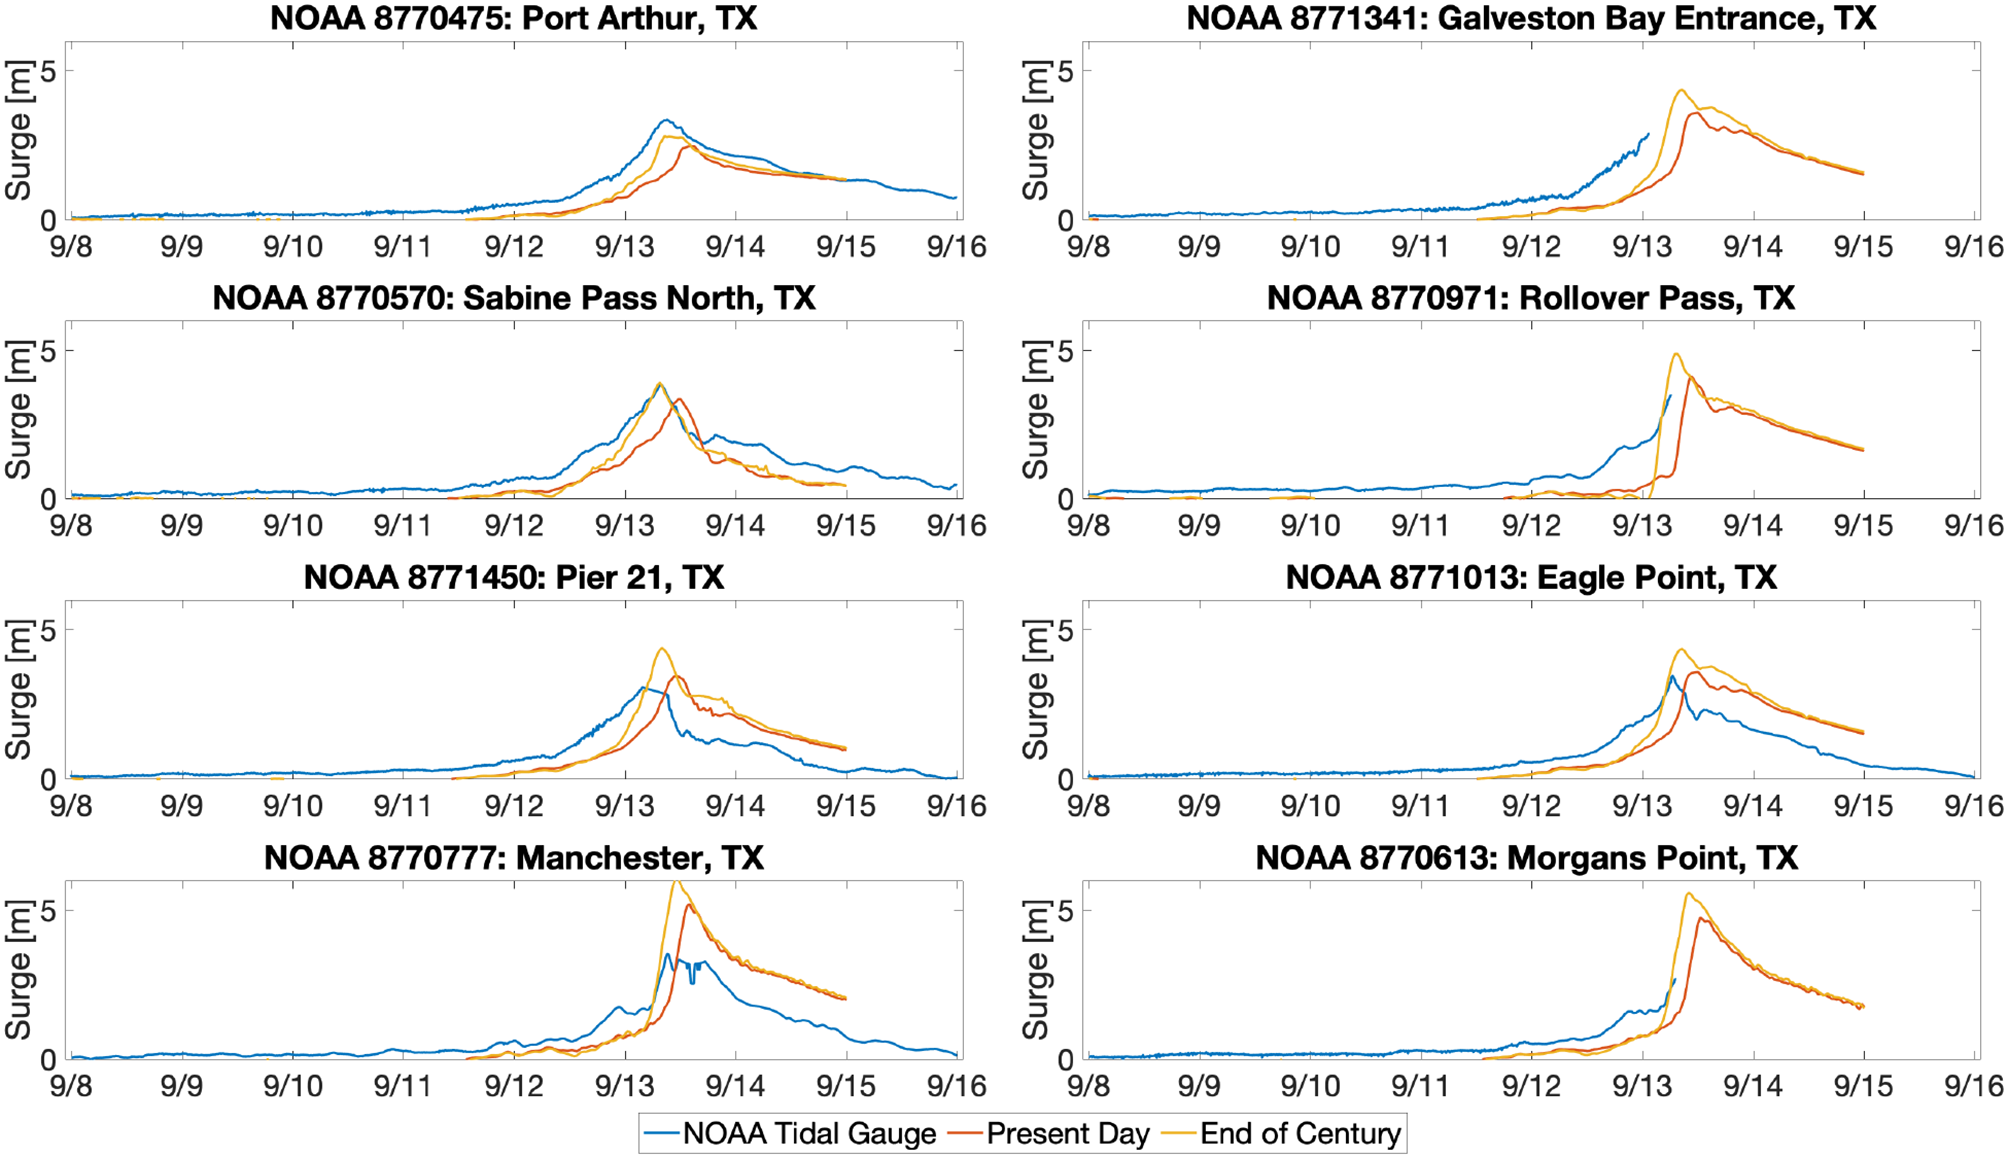
Time series of water levels recorded at NOAA tide gauges that lie within 100 km of Hurricane Ike at landfall (blue) and data from the present day (red) and end of century (yellow) WRF-ADCIRC simulations. Note that several gauges failed prior during peak storm conditions.
Finally, although the HSOFS mesh extends inland with resolution ranging from 150 to 500 m, it is not able to resolve fine details, such as roads and infrastructure close to the coastline. While we believe that the mesh is suitable for describing general locations and patterns of storm surge along the coastline, it cannot be used to explicitly simulate, e.g., neighborhood-level impacts or coastal protection measures.
5. Conclusions
In this study, we simulate the storm surges of 21 hurricanes to understand the potential impacts of climate change to coastal inundation. While this small sample of storms is not large enough for statistical analysis of changing coastal flood risk, it makes feasible the use of high fidelity, high resolution atmospheric and hydrodynamics models to investigate the potential impacts for a broad range of events. We assess the changes to storm surges produced by hurricanes under present day and end of century climate conditions, and find that storm surges will likely become more severe by 2100. On average, storm surge inundation volume and extent both increase over the century, with notable increases along the Gulf Coast (Texas, Louisiana, Mississippi, and the West Coast of Florida), the Carolinas, and New Jersey (i.e., within Delaware Bay and the New York-New Jersey Bight). The inundation volume increases for 14 of the 21 modeled storms, and the average change across all 21 storms is +36%. The inundation extent increases for 13 storms, and the average change across all storms is +25%. Storms that increase in inundation volume generally increase in inundation extent; however, there are three exceptions to this. Hurricane Jeanne and Hurricane Rita both increase in volume, but decrease in area. Hurricane Lili increases in area, but decreases in volume. Our assessment of inundation broadly demonstrates that in the future, hurricanes may produce larger storm surge levels in more concentrated areas as opposed to surges with lower magnitudes that are more widespread.
We find that neither the changes to nor magnitudes of storm surge inundation are predictable by any single hurricane characteristic. Even when storm characteristics are considered together, the resulting influences to storm surge is difficult to assess. The hurricanes with the largest increases to inundation volume are not those whose storm characteristics change in expected ways; their intensities and sizes do not always increase, and their forward speeds do not always decrease. We find that hurricanes with characteristics that do change in ways expected to produce larger storm surges do in fact increase inundation volume and extent. However, the increase in inundation is generally not as large as might be expected. This indicates that even as climate change research advances and more is learned about potential impacts to hurricanes, implications for storm surge will be difficult to predict without probabilistic assessments or numerical experiments, such as those conducted here. Ultimately, the changes to storm surge inundation are caused by the complex interplay between the spatiotemporal distribution of storm characteristics and the geographical properties of the nearshore.
This work provides a fundamental first step in coastal hazard assessment under climate change by improving our understanding of the storm surge component. The atmospheric model used here can also simulate rainfall, so there is potential to explore inland and compound flood risk as the state of numerical modeling of these coupled hazards advances. Additionally, as more is learned and uncertainties are reduced in our understanding of climate change impacts to waves and sea level rise, we are better equipped to assess climate change impacts on total flood risk. Particularly as computational advances are made toward resolving the spatial scales necessary to model fluid/structure interactions, this will have significant implications for our understanding of climate change impacts to the built environment.
Statements
Data availability statement
The WRF data used in this study are available through the NCAR Research Data Archive: (Rasmussen and Liu, 2017). High Resolution WRF Simulations of the Current and Future Climate of North America. Research Data Archive at the National Center for Atmospheric Research, Computational and Information Systems Laboratory. https://doi.org/10.5065/D6V40SXP
The ADCIRC data files supporting the conclusions of this article will be made available by the authors without undue reservation, upon request.
Author contributions
JC: performed ADCIRC simulations, data analysis and interpretation of all elements, design and creation of figures, and lead contributor to the writing. TM: concept development, provided guidance for analysis of all elements, and major contributor to the writing. EG: aided in project concept development, performed WRF analysis, contributed to interpretation, and aided in writing. All authors contributed to the article and approved the submitted version.
Funding
This material was based upon work supported by the National Center for Atmospheric Research, which is a major facility sponsored by the National Science Foundation under Cooperative Agreement No. 1852977. Research reported in this publication was partially supported by an Early-Career Research Fellowship from the Gulf Research Program of the National Academies of Sciences, Engineering, and Medicine. The content was solely the responsibility of the authors and does not necessarily represent the official views of the Gulf Research Program of the National Academies of Sciences, Engineering, and Medicine. This work was supported by the Texas Advanced Computing Center at The University of Texas at Austin as part of the Frontera Fellowships Program, funded by National Science Foundation Award #1818253.
Acknowledgments
We would like to acknowledge support from the DesignSafe project and the National Science Foundation. See Rathje et al. (2017). We would like to acknowledge high-performance computing support from Cheyenne (Computational and Information Systems Laboratory, 2017) provided by NCAR's Computational and Information Systems Laboratory, sponsored by the National Science Foundation. We would like to acknowledge Alexandra Ramos-Valle, David Ahijevych, and Kate Fossell for their assistance in converting WRF outputs into ADCIRC and other technical assistance.
Conflict of interest
The authors declare that the research was conducted in the absence of any commercial or financial relationships that could be construed as a potential conflict of interest.
- ADCIRC
Advanced Circulation model
- Ae
area of triangular finite element
- Aw
wetted area of triangular finite element
- CMIP3
Third Coupled Model Intercomparison Project
- CMIP5
Fifth Coupled Model Intercomparison Project
- CO2
carbon dioxide
- CTRL
present day climate scenario
- Di
water depth at ith node (vertex) of triangular finite element
- ECMWF
European Center for Medium-Range Weather Forecasts
- ERA-Interim
ECMWF Re-Analysis Dataset
- FEMA
Federal Emergency Management Agency
- HSOFS
Hurricane Surge On-demand Forecast System mesh
- HURDAT
NHC Best Track Hurricane Database
- Hurricane(P)
hurricane simulated for end of century climate scenario
- IPCC
Intergovernmental Panel on Climate Change
- NHC
National Hurricane Center
- NOAA
National Oceanic and Atmospheric Administration
- OWI
Ocean Weather, Inc.
- PGW
end of the century climate scenario
- RCP
Representative Concentration Pathway
- SST
sea surface temperature
- Ve
volume of water in triangular finite element
- WRF
Weather Research and Forecasting model.
Abbreviations
References
1
AkbarM. K.KanjandaS.MusinguziA. (2017). Effect of bottom friction, wind drag coefficient, and meteorological forcing in hindcast of hurricane Rita storm surge using SWAN+ ADCIRC model. J. Mar. Sci. Eng. 5:38. 10.3390/jmse5030038
2
AtkinsonJ.McKee SmithJ.BenderC. (2013). Sea-level rise effects on storm surge and nearshore waves on the texas coast: influence of landscape and storm characteristics. J. Waterw. Port Coast. Ocean Eng. 139, 98–117. 10.1061/(ASCE)WW.1943-5460.0000187
3
AzamM. H.SamadM. A.Mahboob-Ul-Kabir (2004). Effect of cyclone track and landfall angle on the magnitude of storm surges along the coast of bangladesh in the northern bay of bengal. Coast. Eng. J. 46, 269–290. 10.1142/S0578563404001051
4
BilskieM.HagenS.MedeirosS.PasseriD. (2014). Dynamics of sea level rise and coastal flooding on a changing landscape. Geophys. Res. Lett. 41, 927–934. 10.1002/2013GL058759
5
ButlerT.AltafM.DawsonC.HoteitI.LuoX.MayoT. (2012). Data assimilation within the advanced circulation (ADCIRC) modeling framework for hurricane storm surge forecasting. Monthly Weather Rev. 140, 2215–2231. 10.1175/MWR-D-11-00118.1
6
Carroll-SmithD. L. (2018). “If it happened in…” a pseudo-global warming assessment of tropical cyclone tornadoes (Ph.D. thesis), University of Illinois at Urbana-Champaign, Champaign, IL, United States.
7
ChenJ.WangZ.TamC.-Y.LauN.-C.LauD.-S. D.MokH.-Y. (2020). Impacts of climate change on tropical cyclones and induced storm surges in the pearl river delta region using pseudo-global-warming method. Sci. Rep. 10, 1–10. 10.1038/s41598-020-58824-8
8
Computational Information Systems Laboratory (2017). Cheyenne: SGI ICE XA Cluster. UCAR/NCAR. Available online at: https://doi.org/10.5065/D6RX99HX
9
CyriacR.DietrichJ.FlemingJ.BlantonB.KaiserC.DawsonC.et al. (2018). Variability in coastal flooding predictions due to forecast errors during hurricane arthur. Coast. Eng. 137, 59–78. 10.1016/j.coastaleng.2018.02.008
10
DeeD. P.UppalaS. M.SimmonsA. J.BerrisfordP.PoliP.KobayashiS.et al. (2011). The ERA-interim reanalysis: configuration and performance of the data assimilation system. Q. J. R. Meteorol. Soc. 137, 553–597. 10.1002/qj.828
11
DeserC.KnuttiR.SolomonS.PhillipsA. S. (2012). Communication of the role of natural variability in future North American climate. Nat. Clim. Change2, 775–779. 10.1038/nclimate1562
12
DietrichJ.BunyaS.WesterinkJ.EbersoleB.SmithJ.AtkinsonJ.et al. (2010). A high-resolution coupled riverine flow, tide, wind, wind wave, and storm surge model for southern Louisiana and Mississippi. Part II: synoptic description and analysis of hurricanes Katrina and Rita. Monthly Weather Rev. 138, 378–404. 10.1175/2009MWR2907.1
13
DietrichJ.KolarR.LuettichR. A. (2004). Assessment of ADCIRC's wetting and drying algorithm. Dev. Water Sci. 55, 1767–1778. 10.1016/S0167-5648(04)80183-7
14
DietrichJ.ZijlemaM.WesterinkJ.HolthuijsenL.DawsonC.LuettichR.Jret al. (2011). Modeling hurricane waves and storm surge using integrally-coupled, scalable computations. Coast. Eng. 58, 45–65. 10.1016/j.coastaleng.2010.08.001
15
EmanuelK. (2005). Increasing destructiveness of tropical cyclones over the past 30 years. Nature436, 686–688. 10.1038/nature03906
16
EmanuelK. A. (1987). The dependence of hurricane intensity on climate. Nature326, 483–485. 10.1038/326483a0
17
FlemingJ. G.FulcherC. W.LuettichR. A.EstradeB. D.AllenG. D.WinerH. S. (2008). A real time storm surge forecasting system using ADCIRC. Estuar. Coast. Model. 2007, 893–912. 10.1061/40990(324)48
18
FossellK. R.AhijevychD.MorssR. E.SnyderC.DavisC. (2017). The practical predictability of storm tide from tropical cyclones in the Gulf of Mexico. Monthly Weather Rev. 145, 5103–5121. 10.1175/MWR-D-17-0051.1
19
GarnerA. J.MannM. E.EmanuelK. A.KoppR. E.LinN.AlleyR. B.et al. (2017). Impact of climate change on New York City's coastal flood hazard: Increasing flood heights from the preindustrial to 2300 CE. Proc. Natl. Acad. Sci. U.S.A. 114, 11861–11866. 10.1073/pnas.1703568114
20
GutmannE. D.RasmussenR. M.LiuC.IkedaK.BruyereC. L.DoneJ. M.et al. (2018). Changes in hurricanes from a 13-yr convection-permitting pseudo-global warming simulation. J. Clim. 31, 3643–3657. 10.1175/JCLI-D-17-0391.1
21
HallT. M.SobelA. H. (2013). On the impact angle of hurricane Sandy's New Jersey landfall. Geophys. Res. Lett. 40, 2312–2315. 10.1002/grl.50395
22
HemerM. A.FanY.MoriN.SemedoA.WangX. L. (2013). Projected changes in wave climate from a multi-model ensemble. Nat. Clim. Change3, 471–476. 10.1038/nclimate1791
23
HillK. A.LackmannG. M. (2011). The impact of future climate change on tc intensity and structure: a downscaling approach. J. Clim. 24, 4644–4661. 10.1175/2011JCLI3761.1
24
HollandG.BruyèreC. L. (2014). Recent intense hurricane response to global climate change. Clim. Dyn. 42, 617–627. 10.1007/s00382-013-1713-0
25
HoustonS. H.ShafferW. A.PowellM. D.ChenJ. (1999). Comparisons of hrd and slosh surface wind fields in hurricanes: implications for storm surge modeling. Weather Forecast. 14, 671–686. 10.1175/1520-0434(1999)014<0671:COHASS>2.0.CO;2
26
IrishJ. L.ResioD. T. (2010). A hydrodynamics-based surge scale for hurricanes. Ocean Eng. 37, 69–81. 10.1016/j.oceaneng.2009.07.012
27
IrishJ. L.ResioD. T.RatcliffJ. J. (2008). The influence of storm size on hurricane surge. J. Phys. Oceanogr. 38, 2003–2013. 10.1175/2008JPO3727.1
28
JelesnianskiC. P.ChenJ.ShafferW. A. (1992). SLOSH: Sea, Lake, and Overland Surges From Hurricanes. Silver Spring, MD: US Department of Commerce, National Oceanic and Atmospheric Administration, National Weather Service.
29
JungC.LackmannG. M. (2019). Extratropical transition of hurricane Irene (2011) in a changing climate. J. Clim. 32, 4847–4871. 10.1175/JCLI-D-18-0558.1
30
KalnayE.CaiM. (2003). Impact of urbanization and land-use change on climate. Nature423, 528–531. 10.1038/nature01675
31
KimH.-S.VecchiG. A.KnutsonT. R.AndersonW. G.DelworthT. L.RosatiA.et al. (2014). Tropical cyclone simulation and response to CO2 doubling in the GFDL CM2.5 high-resolution coupled climate model. J. Clim. 27, 8034–8054. 10.1175/JCLI-D-13-00475.1
32
KnutsonT. R.McBrideJ. L.ChanJ.EmanuelK.HollandG.LandseaC.et al. (2010). Tropical cyclones and climate change. Nat. Geosci. 3, 157–163. 10.1038/ngeo779
33
KnutsonT. R.SirutisJ. J.VecchiG. A.GarnerS.ZhaoM.KimH.-S.et al. (2013). Dynamical downscaling projections of twenty-first-century atlantic hurricane activity: CMIP3 and CMIP5 model-based scenarios. J. Clim. 26, 6591–6617. 10.1175/JCLI-D-12-00539.1
34
KnutsonT. R.SirutisJ. J.ZhaoM.TuleyaR. E.BenderM.VecchiG. A.et al. (2015). Global projections of intense tropical cyclone activity for the late twenty-first century from dynamical downscaling of CMIP5/RCP4.5 scenarios. J. Clim. 28, 7203–7224. 10.1175/JCLI-D-15-0129.1
35
KoppR. E.HortonR. M.LittleC. M.MitrovicaJ. X.OppenheimerM.RasmussenD.et al. (2014). Probabilistic 21st and 22nd century sea-level projections at a global network of tide-gauge sites. Earths Future2, 383–406. 10.1002/2014EF000239
36
KossinJ. P. (2018). A global slowdown of tropical-cyclone translation speed. Nature558, 104–107. 10.1038/s41586-018-0158-3
37
LackmannG. M. (2015). Hurricane sandy before 1900 and after 2100. Bull. Am. Meteorol. Soc. 96, 547–560. 10.1175/BAMS-D-14-00123.1
38
LandseaC. W.FranklinJ. L. (2013). Atlantic hurricane database uncertainty and presentation of a new database format. Monthly Weather Rev. 141, 3576–3592. 10.1175/MWR-D-12-00254.1
39
LanzanteJ. R. (2019). Uncertainties in tropical-cyclone translation speed. Nature570, E6–E15. 10.1038/s41586-019-1223-2
40
LawlerJ. J.LewisD. J.NelsonE.PlantingaA. J.PolaskyS.WitheyJ. C.et al. (2014). Projected land-use change impacts on ecosystem services in the united states. Proc. Natl. Acad. Sci. U.S.A. 111, 7492–7497. 10.1073/pnas.1405557111
41
LinN.EmanuelK. (2016). Grey swan tropical cyclones. Nat. Clim. Change6, 106–111. 10.1038/nclimate2777
42
LinN.EmanuelK.OppenheimerM.VanmarckeE. (2012). Physically based assessment of hurricane surge threat under climate change. Nat. Clim. Change2, 462–467. 10.1038/nclimate1389
43
LinY.ZhaoM.ZhangM. (2015). Tropical cyclone rainfall area controlled by relative sea surface temperature. Nat. Commun. 6, 1–7. 10.1038/ncomms7591
44
LittleC. M.HortonR. M.KoppR. E.OppenheimerM.VecchiG. A.VillariniG. (2015). Joint projections of us east coast sea level and storm surge. Nat. Clim. Change5, 1114–1120. 10.1038/nclimate2801
45
LiuC.IkedaK.RasmussenR.BarlageM.NewmanA. J.PreinA. F.et al. (2017). Continental-scale convection-permitting modeling of the current and future climate of north america. Clim. Dyn. 49, 71–95. 10.1007/s00382-016-3327-9
46
LuettichR.WesterinkJ. (1995). An Assessment of Flooding and Drying Techniques for Use in the ADCIRC Hydrodynamic Model: Implementation and Performance in One-Dimensional Flows. Contract Report, Prepared for Headquarters, US Army Corps of Engineers, Vicksburg, MS, United States.
47
LuettichR. A.WesterinkJ. J.ScheffnerN. W. (1992). ADCIRC: An Advanced Three-Dimensional Circulation Model for Shelves, Coasts, and Estuaries. Report 1, Theory and Methodology of ADCIRC-2DD1 and ADCIRC-3DL.
48
LynnB. H.HealyR.DruyanL. M. (2009). Investigation of hurricane Katrina characteristics for future, warmer climates. Clim. Res. 39, 75–86. 10.3354/cr00801
49
MandliK. T.DawsonC. N. (2014). Adaptive mesh refinement for storm surge. Ocean Model. 75, 36–50. 10.1016/j.ocemod.2014.01.002
50
MarsooliR.LinN.EmanuelK.FengK. (2019). Climate change exacerbates hurricane flood hazards along us atlantic and gulf coasts in spatially varying patterns. Nat. Commun. 10, 1–9. 10.1038/s41467-019-11755-z
51
MayoT.ButlerT.DawsonC.HoteitI. (2014). Data assimilation within the advanced circulation (ADCIRC) modeling framework for the estimation of manning's friction coefficient. Ocean Model. 76, 43–58. 10.1016/j.ocemod.2014.01.001
52
MayoT.LinN. (2019). The effect of the surface wind field representation in the operational storm surge model of the National Hurricane Center. Atmosphere10:193. 10.3390/atmos10040193
53
MoriN.KatoM.KimS.MaseH.ShibutaniY.TakemiT.et al. (2014). Local amplification of storm surge by super typhoon Haiyan in Leyte Gulf. Geophys. Res. Lett. 41, 5106–5113. 10.1002/2014GL060689
54
MuddL.WangY.LetchfordC.RosowskyD. (2014). Assessing climate change impact on the us east coast hurricane hazard: temperature, frequency, and track. Nat. Hazards Rev. 15:04014001. 10.1061/(ASCE)NH.1527-6996.0000128
55
MurdukhayevaA.AugustP.BradleyM.LaBashC.ShawN. (2013). Assessment of inundation risk from sea level rise and storm surge in northeastern coastal national parks. J. Coast. Res. 29, 1–16. 10.2112/JCOASTRES-D-12-00196.1
56
National Oceanic Atmospheric Administration. (2020). National Oceanic and Atmospheric Administration. Tides and Currents. Available online at: https://tidesandcurrents.noaa.gov/
57
NeedhamH. F.KeimB. D. (2014). An empirical analysis on the relationship between tropical cyclone size and storm surge heights along the US Gulf Coast. Earth Interact. 18, 1–15. 10.1175/2013EI000558.1
58
NeedhamH. F.KeimB. D.SathiarajD.ShaferM. (2012). “Storm surge return periods for the United States Gulf Coast,” in World Environmental and Water Resources Congress 2012: Crossing Boundaries ed LoucksE. D. (Reston, VA: Environmental and Water Resources Institute), 2422–2463. 10.1061/9780784412312.245
59
NeumannB.VafeidisA. T.ZimmermannJ.NichollsR. J. (2015). Future coastal population growth and exposure to sea-level rise and coastal flooding-a global assessment. PLoS ONE10:e0118571. 10.1371/journal.pone.0118571
60
NichollsS. D.DeckerS. G. (2015). Impact of coupling an ocean model to WRF Nor'easter simulations. Monthly Weather Rev. 143, 4997–5016. 10.1175/MWR-D-15-0017.1
61
OdenJ. T. (2011). An Introduction to Mathematical Modeling: A Course in Mechanics. Hoboken, NJ: John Wiley & Sons.
62
OzkanC.MayoT.PasseriD. (2020). “The potential of wave energy conversion to mitigate erosion in coastal regions of the United States,” in Ocean Sciences Meeting 2020 (San Diego, CA: AGU).
63
PasseriD.HagenS. C.SmarD.AlimohammadiN.RisnerA.WhiteR. (2013). Sensitivity of an ADCIRC tide and storm surge model to manning's n. Estuarine and Coastal Modeling2011, 457–475. 10.1061/9780784412411.00027
64
PasseriD. L.HagenS. C.MedeirosS. C.BilskieM. V.AlizadK.WangD. (2015). The dynamic effects of sea level rise on low-gradient coastal landscapes: a review. Earths Future3, 159–181. 10.1002/2015EF000298
65
PatricolaC. M.WehnerM. F. (2018). Anthropogenic influences on major tropical cyclone events. Nature563, 339–346. 10.1038/s41586-018-0673-2
66
RahmstorfS. (2017). Rising hazard of storm-surge flooding. Proc. Natl. Acad. Sci. U.S.A. 114, 11806–11808. 10.1073/pnas.1715895114
67
Ramos-ValleA. N.CurchitserE. N.BruyèreC. L. (2020). Impact of tropical cyclone landfall angle on storm surge along the mid-Atlantic bight. J. Geophys. Res. Atmos. 125:e2019JD031796. 10.1029/2019JD031796
68
RasmussenR.LiuC. (2017). High Resolution WRF Simulations of the Current and Future Climate of North America. Research Data Archive at the National Center for Atmospheric Research, Computational and Information Systems Laboratory. Available online at: https://doi.org/10.5065/D6V40SXP
69
RasmussenR.LiuC.IkedaK.GochisD.YatesD.ChenF.et al. (2011). High-resolution coupled climate runoff simulations of seasonal snowfall over Colorado: a process study of current and warmer climate. J. Clim. 24, 3015–3048. 10.1175/2010JCLI3985.1
70
RathjeE. M.DawsonC.PadgettJ. E.PinelliJ. P.StanzioneD.AdairA.et al. (2017). DesignSafe: new cyberinfrastructure for natural hazards engineering. Nat. Hazards Rev.18:06017001. 10.1061/(ASCE)NH.1527-6996.0000246
71
RegoJ. L.LiC. (2009). On the importance of the forward speed of hurricanes in storm surge forecasting: a numerical study. Geophys. Res. Lett. 36:L07609. 10.1029/2008GL036953
72
RegoJ. L.LiC. (2010). Nonlinear terms in storm surge predictions: effect of tide and shelf geometry with case study from hurricane Rita. J. Geophys. Res. Oceans115:C06020. 10.1029/2009JC005285
73
ResioD. T.IrishJ.CialoneM. (2009). A surge response function approach to coastal hazard assessment-part 1: basic concepts. Nat. Hazards51, 163–182. 10.1007/s11069-009-9379-y
74
Riverside Technology and AECOM. (2015). Mesh Development, Tidal Validation, and Hindcast Skill Assessment of an ADCIRC Model for the Hurricane Storm Surge Operational Forecast System on the US Gulf-Atlantic Coast. Technical report, Riverside Technology and AECOM.
75
RoelvinkD.HuismanB.ElghandourA.GhonimM.ReynsJ. (2020). Efficient modeling of complex sandy coastal evolution at monthly to century time scales. Front. Mar. Sci. 7:535. 10.3389/fmars.2020.00535
76
RoelvinkD.ReniersA.Van DongerenA.De VriesJ. V. T.McCallR.LescinskiJ. (2009). Modelling storm impacts on beaches, dunes and barrier islands. Coast. Eng. 56, 1133–1152. 10.1016/j.coastaleng.2009.08.006
77
SchärC.FreiC.LüthiD.DaviesH. C. (1996). Surrogate climate-change scenarios for regional climate models. Geophys. Res. Lett. 23, 669–672. 10.1029/96GL00265
78
SchwartzC. S.RomineG. S.SobashR. A.FossellK. R.WeismanM. L. (2015). NCAR's experimental real-time convection-allowing ensemble prediction system. Weather Forecast. 30, 1645–1654. 10.1175/WAF-D-15-0103.1
79
SebastianA.ProftJ.DietrichJ. C.DuW.BedientP. B.DawsonC. N. (2014). Characterizing hurricane storm surge behavior in Galveston Bay using the SWAN+ ADCIRC model. Coast. Eng. 88, 171–181. 10.1016/j.coastaleng.2014.03.002
80
SkamarockW. C.KlempJ. B.DudhiaJ.GillD. O.BarkerD. M.WangW.et al. (2005). A Description of the Advanced Research WRF Version 2. Technical report, National Center For Atmospheric Research Boulder Co Mesoscale and Microscale ….
81
SmithR. C. (2013). Uncertainty Quantification: Theory, Implementation, and Applications, Vol. 12. Philadelphia, PA: Siam.
82
TakayabuI.HibinoK.SasakiH.ShiogamaH.MoriN.ShibutaniY.et al. (2015). Climate change effects on the worst-case storm surge: a case study of typhoon Haiyan. Environ. Res. Lett. 10:064011. 10.1088/1748-9326/10/6/064011
83
ThomasA.DietrichJ.AsherT.BellM.BlantonB.CopelandJ.et al. (2019). Influence of storm timing and forward speed on tides and storm surge during hurricane matthew. Ocean Model. 137, 1–19. 10.1016/j.ocemod.2019.03.004
84
WalshK. J.McBrideJ. L.KlotzbachP. J.BalachandranS.CamargoS. J.HollandG.et al. (2016). Tropical cyclones and climate change. Wiley Interdiscipl. Rev. Clim. Change7, 65–89. 10.1002/wcc.371
85
WeaverR.SlinnD. (2010). Influence of bathymetric fluctuations on coastal storm surge. Coast. Eng. 57, 62–70. 10.1016/j.coastaleng.2009.09.012
86
WeisbergR. H.ZhengL. (2006). Hurricane storm surge simulations for Tampa Bay. Estuar. Coasts29, 899–913. 10.1007/BF02798649
87
YatesD.LunaB. Q.RasmussenR.BratcherD.GarreL.ChenF.et al. (2014). Stormy weather: assessing climate change hazards to electric power infrastructure: a sandy case study. IEEE Power Energy Mag. 12, 66–75. 10.1109/MPE.2014.2331901
88
YinJ.GriffiesS. M.WintonM.ZhaoM.ZannaL. (2020). Response of storm-related extreme sea level along the us atlantic coast to combined weather and climate forcing. J. Clim. 33, 3745–3769. 10.1175/JCLI-D-19-0551.1
89
ZhangA.HessK.AikmanI. I. I. F. (2010). User-based skill assessment techniques for operational hydrodynamic forecast systems. J. Oper. Oceanogr. 3, 11–24. 10.1080/1755876X.2010.11020114
90
ZhangA.HessK. W.WeiE.MyersE. (2006). Implementation of Model Skill Assessment Software for Water Level and Current in Tidal Regions. NOAA Technical Report NOS CS 24, Silver Spring, MD. Available online at: https://repository.library.noaa.gov/view/noaa/2204
91
ZhangW.VillariniG.VecchiG. A.SmithJ. A. (2018). Urbanization exacerbated the rainfall and flooding caused by hurricane Harvey in Houston. Nature563, 384–388. 10.1038/s41586-018-0676-z
Summary
Keywords
coastal flood risk, global warming, ADCIRC, WRF, tropical cyclones
Citation
Camelo J, Mayo TL and Gutmann ED (2020) Projected Climate Change Impacts on Hurricane Storm Surge Inundation in the Coastal United States. Front. Built Environ. 6:588049. doi: 10.3389/fbuil.2020.588049
Received
28 July 2020
Accepted
12 November 2020
Published
03 December 2020
Volume
6 - 2020
Edited by
Teng Wu, University at Buffalo, United States
Reviewed by
Ahmed Kenawy, Mansoura University, Egypt; Morten Andreas Dahl Larsen, Technical University of Denmark, Denmark
Updates
Copyright
© 2020 Camelo, Mayo and Gutmann.
This is an open-access article distributed under the terms of the Creative Commons Attribution License (CC BY). The use, distribution or reproduction in other forums is permitted, provided the original author(s) and the copyright owner(s) are credited and that the original publication in this journal is cited, in accordance with accepted academic practice. No use, distribution or reproduction is permitted which does not comply with these terms.
*Correspondence: Jeane Camelo jbcamelo@knights.ucf.edu
This article was submitted to Wind Engineering and Science, a section of the journal Frontiers in Built Environment
Disclaimer
All claims expressed in this article are solely those of the authors and do not necessarily represent those of their affiliated organizations, or those of the publisher, the editors and the reviewers. Any product that may be evaluated in this article or claim that may be made by its manufacturer is not guaranteed or endorsed by the publisher.