 Camila Pereira Silva
 Marcus S. Dersch
 J. Riley Edwards
- Newmark Civil Engineering Laboratory, Department of Civil and Environmental Engineering – CEE, Rail Transportation and Engineering Center – RailTEC, Grainger College of Engineering – GcoE, University of Illinois at Urbana-Champaign – UIUC, Urbana, IL, United States
Monitoring ballast support condition and improving current sub-structure and ballast maintenance strategies is critical to ensuring safe and efficient railroad operations. Researchers at the University of Illinois at Urbana-Champaign (Illinois) have developed a ballast support condition back-calculator, a non-destructive instrumentation method and corresponding analysis tool that quantifies ballast pressure distributions under concrete sleepers without interrupting revenue service train operations. This laboratory-validated non-intrusive method uses concrete sleeper bending moment profile and rail seat loads as inputs to back-calculate the reaction distribution using a Simulated Annealing optimization algorithm that incorporates Pareto Distribution as the random variable generator. In order to further understand in-service ballast support conditions, concrete surface strain gauges were installed on concrete sleepers at a revenue service field site to measure strains that could subsequently be converted into bending moments. This site is on a shared use rail corridor with traffic ranging from high speed passenger to heavy axle load (HAL) freight trains. Rail-mounted strain gauges were used to measure strains that were used to calculate the vertical wheel-rail loads to approximate rail seat loads. This paper quantifies the ballast pressure distributions beneath concrete sleepers under different types of rolling stock and evaluates how ballast support condition changes as a function of accumulated tonnage. A wide range of loads were observed at the field site, ranging from 4 to 35 kips (18–156 kN). Corresponding ballast pressures ranged from 14 to 175 psi (97–1,207 kPa), with sleeper-ballast contact area corresponding to 60% of the bottom of the sleeper area. The accumulation of 12.24 million gross tons (MGT) (12.44 million tons) did not generate a quantifiable change in ballast pressure values nor did it generate a change in the ballast support condition. The research results presented in this paper demonstrate the potential of the back-calculator to provide a stand-alone non-invasive method to quantify ballast support conditions, sleeper health, and sleeper bearing stress. Back calculator data will aid the rail industry in optimizing tamping cycles, enhancing safety, and developing more representative concrete sleeper flexural designs based on actual support conditions.
Introduction
The fourth industrial revolution, defined as the current trend of automation and data exchange in manufacturing technologies (Qian et al., 2019), has brought significant change to many sectors of today’s economy. As such, the railroad industry has recently experienced many changes and improvements, especially through the adoption of technology to increase track capacity, improve safety, and optimize maintenance processes. Change is achieved through improved designs, condition inspection, and monitoring and/or maintenance optimization.
Distributed motive power, Positive Train Control (PTC) (Resor et al., 2005), Automatic Train Control (ATC) (Kim et al., 2015), and self-driving cars (Bruner, 2018) are examples of implementing technology to improve safety and efficiency of transportation operations. And while wheel impact load detectors (WILDs) (Van Dyk, 2014) and hot bearing detectors (Tarawneh et al., 2020) have been around for decades, there is increased interest in analyzing data from these systems to develop predictive maintenance strategies for the rolling stock. Autonomous track geometry measurement systems (ATGMS) (Van Dyk, 2014; Saadat et al., 2018), unmanned aerial vehicles (UAVs) (Baniæ et al., 2019), and machine vision and laser-based inspection systems (Ye et al., 2019; Fox-Ivey et al., 2020) are being developed and deployed to provide actionable information about the overall state of the track’s health (Stuart et al., 2012; Saadat et al., 2014). Despite these encouraging advancements, more research is needed to develop and implement condition-based track maintenance strategies for individual components that make up the track structure. Improving both component-level and overall track health can improve vehicle ride quality, reduce track damage through the reduction of dynamic loads, extend maintenance intervals, and make rail transport more economical and competitive (Selig, 1994).
When considering the inspection and monitoring systems, it should be observed that many of these are not continuously acquiring data as a function of time. Further, though there are technologies that have been deployed to quantify track support [e.g., ground penetrating radar (GPR) (Artagan et al., 2020) and matrix based tactile surface sensors (MBTSS) (McHenry et al., 2015), and pressure cells (Xiao et al., 2020)], these technologies typically disturb either train traffic or the in situ track conditions during installation. For example, GPR inspections are performed at fixed intervals and MBTSS require jacking the rail and sleepers during installation of the sensors (McHenry et al., 2015), generating changes that can alter the final results by way of the observer effect (Tanathong et al., 2017; Rose et al., 2018). Without an automated and systematic monitoring system, railroad track infrastructure owners lack wholistic and cost-efficient options for optimization of maintenance operations (Qian et al., 2019). Therefore, there remains an opportunity to continually monitor the track condition without needing to disrupt the track.
Given ballasted track is the most prevalent type of railroad track throughout the world (Hay, 1982; Köllõ et al., 2015), the research discussed in this paper is focused on development and deployment of a method to continuously assess its condition. Ballast is a critical track component that is located between, below, and around the sleeper (Hay, 1982; Kerr, 2003). Ballast support conditions are known to substantially influence concrete crosstie flexural response (Kaewunruen and Remennikov, 2009; Kaewunruen et al., 2016; Bastos et al., 2017; Canga Ruiz, 2018). Along with bearing and distributing the load from the sleepers to the substructure, ballast also facilitates the drainage of water, keeps vegetation from interfering with the track structure, and provides lateral stability to hold the track in place during the passage of trains and mitigating movement during a reasonable range of longitudinal rail stress changes (Solomon, 2001).
Researchers at the University of Illinois at Urbana-Champaign (Illinois) developed a novel, non-intrusive technique to accurately and continuously measure the ballast support condition immediately below the sleepers. The ballast support condition back-calculator (hereafter referred to as the “back-calculator”) analyzes concrete sleeper flexural data recorded under revenue service traffic to indirectly quantify both the ballast support condition beneath concrete sleepers and the pressure at the ballast-sleeper interface (Qian et al., 2019). This paper leverages initial progress on the development of a back calculator to expand its functionality as a “smart sleeper” that can quantify sleeper flexural demands, ballast pressures, and support. The data, when properly transformed into actionable information, will lead to improved railroad maintenance planning and railroad track design. The specific focus of this paper will be the quantification of ballast pressures of concrete sleepers installed on a shared corridor with mixed intercity passenger trains and heavy axle load (HAL) freight traffic.
Background
The back-calculator is an indirect technique to estimate a sleeper’s ballast support condition using rail seat loads and bending moments captured at discrete locations along the sleeper. Based on force equilibrium and the basic principles of statics, for a two-dimensional subject, only one combination of reaction forces (i.e., one support condition) can generate a given moment profile under a set of applied loads. Considering this principle, the concrete sleeper is simplified as a two-dimensional beam, and its ballast support condition can be back-calculated from the bending moments along the concrete sleeper and the corresponding rail seat loads, both of which can be quantified during experimentation (Qian et al., 2019).
Concrete surface strain gauges applied using a method described by Edwards et al. (2017) have successfully quantified the bending strains experienced by concrete sleepers in both laboratory and revenue service field experiments (Quirós-Orozco et al., 2018; Edwards et al., 2019; Canga Ruiz et al., 2020). Bending strains can then be converted into bending moments when laboratory-derived calibration factors are applied using the method described by Edwards et al. (2017). Rail seat loads are computed directly via locally installed strain gauges or indirectly from nearby Wheel Impact Load Detector (WILD) sites using a modified version of the recommended equation given in the American Railway Engineering and Maintenance-of-Way Association [AREMA] (2017) Manual for Railway Engineering (MRE).
The simplified two-dimensional sleeper model used in this research is shown in Figure 1. The model describes a typical North American 102 in (260 cm) long concrete sleepers and is divided into six discrete bins that are 17 in. (43 cm) in length. Each bin contains a percentage of the total ballast reaction force, and the reaction force within each bin was assumed to be uniformly distributed within the bin. The ballast reaction forces are converted into ballast pressures by dividing the forces by the area of the bin [i.e., bin length multiplied by sleeper width of 10.3 in. (26 cm)]. A total of five concrete surface strain gauges were installed longitudinally along the top chamfer of the sleepers. No formal optimization of gauge locations was undertaken. The two rail seat and one center gauge locations were selected to answer broader questions about the magnitude of sleeper rail seat and center bending moments. The intermediate gauges were centered between these to capture additional bending moment profile data. Since the sleeper is not restrained at the two ends under any feasible ballast support condition, the bending moments at the two ends are zero. Consequently, when combining these end values with five measured moments obtained from strain gauges, the instrumented sleeper can output a total of seven known bending moments. The rail seat loads were assumed to be uniformly distributed over the width of each of the 6 in. (15 cm) rail seats (Qian et al., 2019).
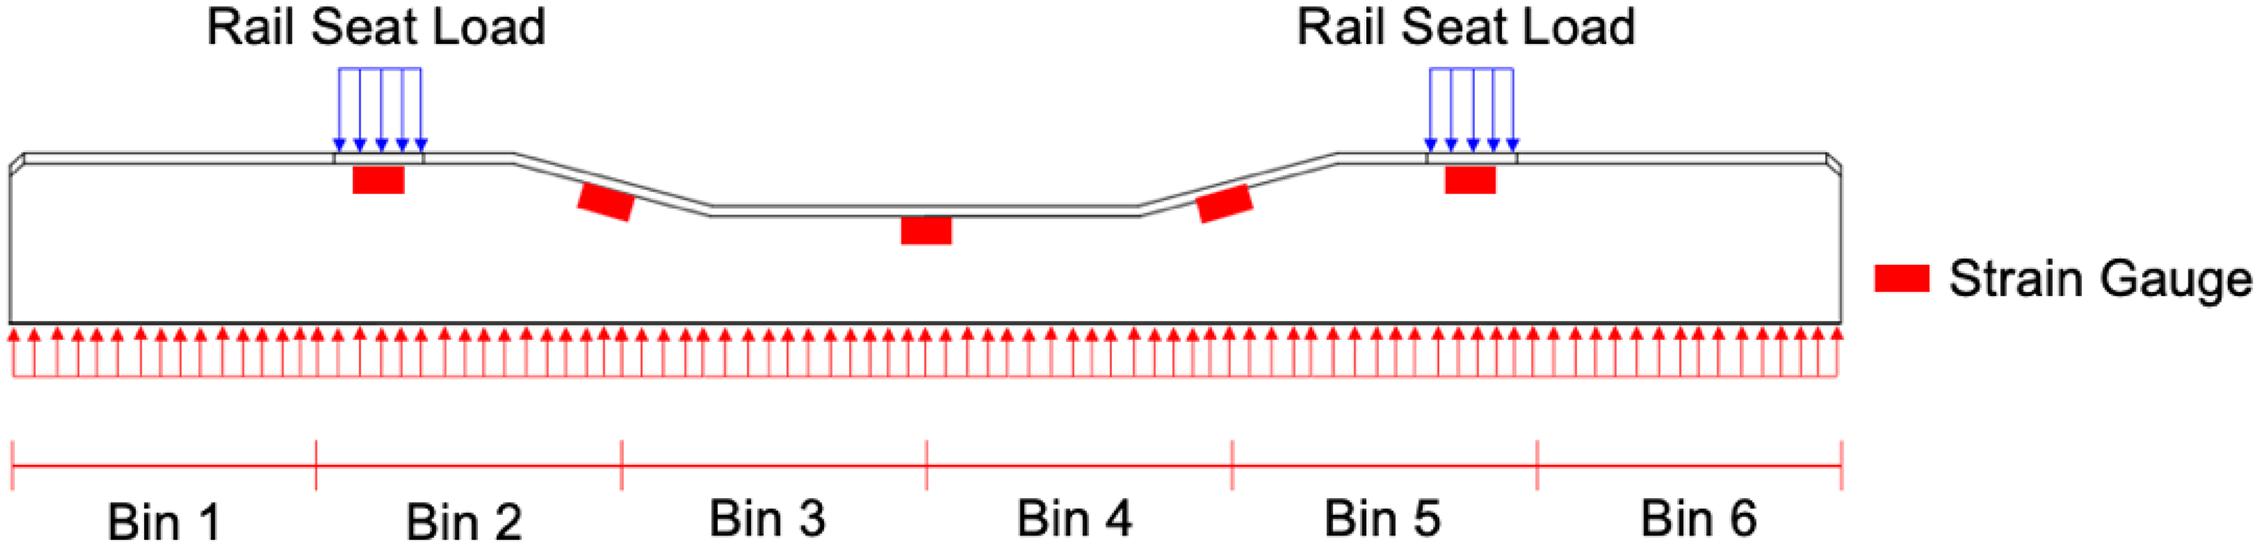
Figure 1. Simplified two-dimensional sleeper model (Qian et al., 2019).
A total of nine back-calculator inputs, comprised of seven known bending moments and two approximated rail seat loads are used in the model. Two boundary conditions are also included. First, based on force equilibrium, the total ballast reaction force should equal the total rail seat loads. This dictates that the forces in all six bins should sum to approximately 100%. Second, the value of each bin should not be less than zero, as it is unrealistic to have a negative reaction force for ballast (e.g., ballast provides no tensile capacity).
Once rail seat load magnitudes are input into the back-calculator, an optimization process generates combinations of reaction forces that satisfy the two boundary conditions. For each reaction force combination, the back-calculator generates the bending moment profile of the sleeper based on the rail seat loads and compares it to the actual input bending moment profile. The optimization process terminates when the difference between the calculated and actual bending moment profiles reached its minimum, and the reaction force combination that generated the calculated bending moment profile became the resultant support condition. The optimization process is summarized in Figure 2.
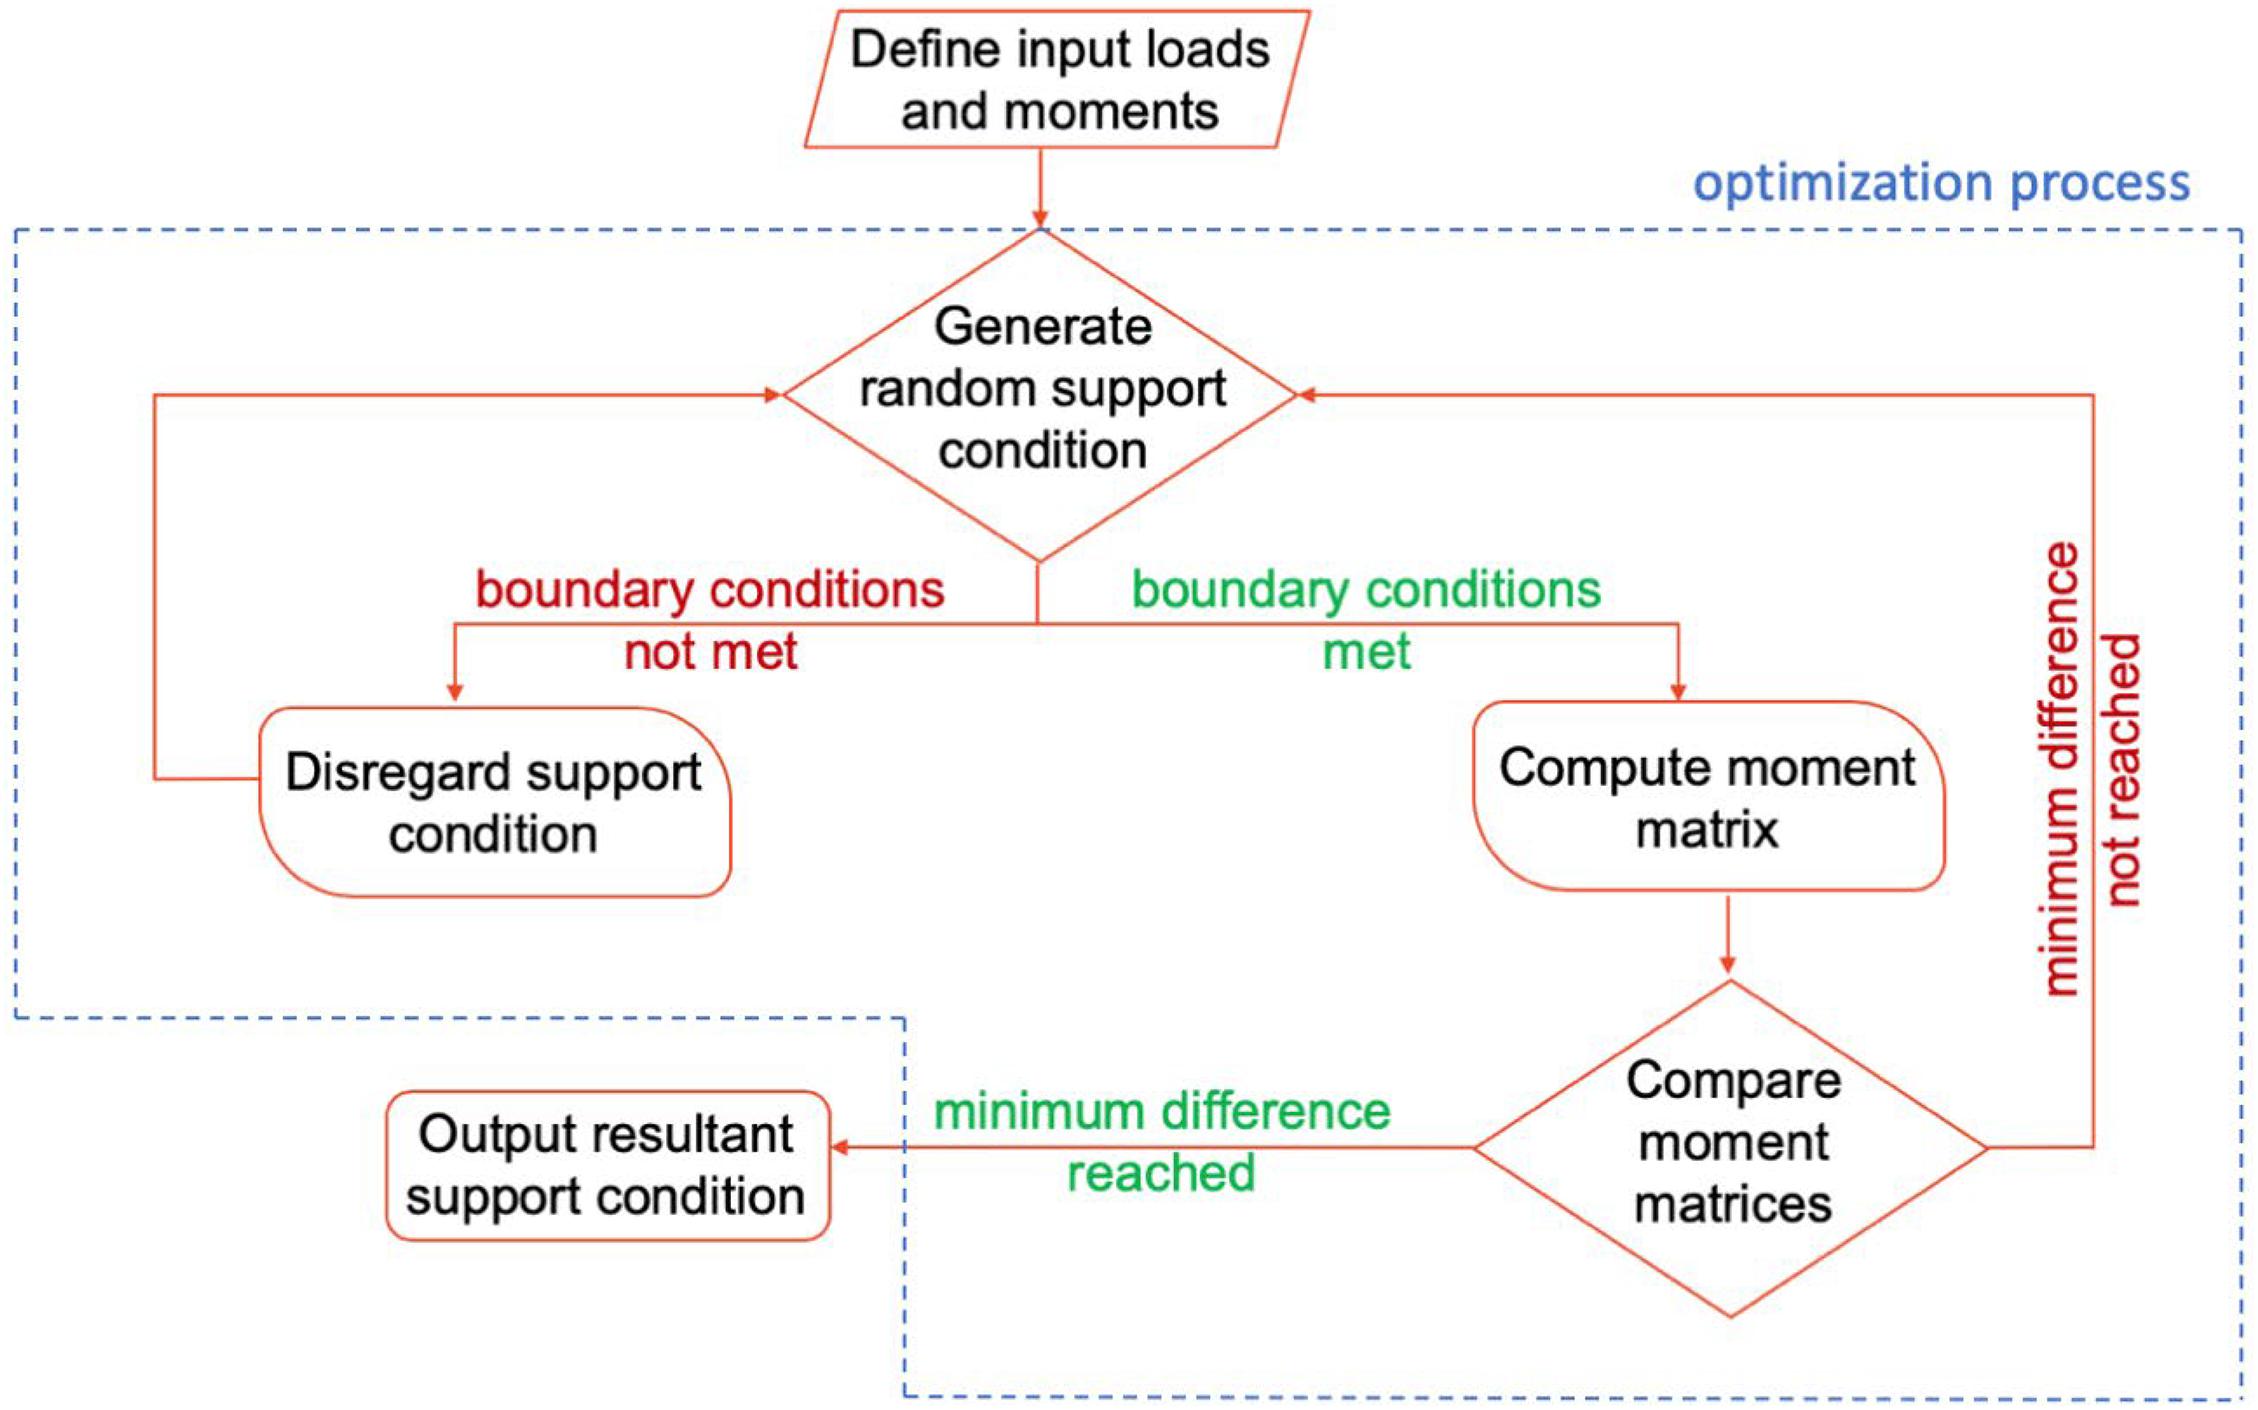
Figure 2. Flowchart for ballast support condition assessment system (Qian et al., 2019).
In the optimization process, Simulated Annealing and Bi-polar Pareto Distribution were used as the optimization algorithm and the random variable generator. By simultaneously implementing the two methods, an improved solution could be generated in less time (Englander and Englander, 2014), and convergence on local optima was avoided (Kirkpatrick et al., 1983). For a given set of inputs, the maximum computational time was approximately 1 min, which was deemed reasonable for the application.
Field Experimentation
To quantify field ballast support conditions under revenue service traffic using the back-calculator, field experimentation was conducted on a double track portion of Amtrak’s Northeast Corridor (NEC) in Edgewood, Maryland, United States. The field site was located on tangent track constructed of concrete sleepers spaced 24 in. (61 cm) on center, at a location that sees the passage of approximately 55 regional, intercity, and high-speed passenger trains, commuter rail trains, and a variety of HAL freight trains each weekday (on the track instrumented). In total, the route accumulated 42.6 million gross tons (MGT) in the year of 2017 (with 18.5 MGT on the track instrumented). The location and diversity of traffic provided the opportunity to quantify the effect of both tonnage and traffic type on sleeper support conditions and ballast pressure magnitude beneath concrete sleepers. The mixed traffic at this location was primarily comprised of four types of trains: ACELA passenger trains, Intercity Amtrak trains operating with Amfleet passenger coaches, Maryland Area Regional Commuter (MARC) commuter trains pulled by diesel-electric locomotives, and Class I HAL Freight Trains with cars having a variety of maximum Gross Rail Loads (GRLs).
In addition to the strain gauge instrumentation, three thermocouples were installed to capture ambient temperature as well as the temperature at the top and bottom of the sleeper. Rail mounted strain gauges were used to quantify the wheel loads, and these data were obtained from a nearby WILD site. The nominal wheel load for each axle (obtained from WILD data) was used to approximate the rail seat load by using a modified version of the recommended equation given in the American Railway Engineering and Maintenance-of-Way Association [AREMA] (2017). A value of zero (0) for the Impact Factor (IF) was selected given the input wheel loads used were actual loads that incorporated any dynamic influence. The Distribution Factor (DF) of 0.505 was obtained from AREMA MRE Figure 30-4-1 based on a concrete sleeper spacing of 24 in (61 cm) on center. These approximated rail seat loads were used as the input for the support condition back-calculator.
Data were collected from more than 2,550 train passes between January and August 2017. While more than 23,000 axles were analyzed by the back-calculator, or approximately 5,750 axles per train type, the results were filtered based on two parameters (1) the maximum Mean Squared Error (MSE) resulting from the optimization process and (2) temperature differential between the top and the bottom of the sleeper. Filtering resulted in a final count of 400 trains that met the aforementioned specifications that were established to isolate the specific variables of interest. The trains varied in length between 28 and 500 axles. The number of axle passes after filtering provides a 95% confidence level that the results are an accurate representation of the broader set of data.
The maximum MSE value used for final analysis was 10 kip-in (1.13 kN-m). This represents an allowance of 5 kip-in (0.56 kN-m), positive or negative, for every strain gauge measurement. This corresponded to approximately 10% of the average strain gauge reading. Further, given temperature induced strain has been shown to exert significant influence on concrete sleepers bending results (Wolf et al., 2016) it was also selected as a control parameter. More specifically, prior research found that a linear relation between temperature gradient and flexural behavior of concrete sleepers, where each variation of 1-degree Fahrenheit (0.56-degree Celsius) between sleeper top and bottom can lead to a bending moment variation of approximately 1 kip-in (0.11 kN-m) (Canga Ruiz et al., 2019). Therefore, data selected for final inclusion in the analysis had temperature gradients less than ±1-degree Fahrenheit (0.56-degree Celsius). Filtering was undertaken given the focus of this research was evaluation of the support conditions and pressures under the operation of different types of rolling stock, and the effects of thermal gradient and subsequent sleeper bending were thus isolated. It should be noted that the range of actual pressures and support condition configurations would be expected to exceed that of what is demonstrated in this paper, due to the effect of thermal gradient (Canga Ruiz et al., 2019).
Existing Ballast Pressure Limit States
The AREMA MRE recommends a maximum allowable ballast pressure of 85 psi (586 kPa) under concrete sleepers for track constructed with high quality, abrasion resistant ballast (American Railway Engineering and Maintenance-of-Way Association [AREMA], 2017). This value is inclusive of a safety factor to prevent bearing capacity failure or undue creep under the loaded area (American Railway Engineering and Maintenance-of-Way Association [AREMA], 2017). Therefore, this value is used for a pressure limit state to correlate the back-calculator results and aid the evaluation of the pressures obtained through the field experimentation.
Results
The following sections provide the results from field experimentation conducted on Amtrak. The rail seat loads, ballast pressures, and support conditions are quantified and compared both quantitatively and qualitatively. After filtering, the data were separated into 2 temporal categories—Quarter 1 (Qtr. 1) and Quarter 3 (Qtr. 3)—to analyze how the increase in MGT with the passing of time affected the ballast pressures. Qtr. 1 data was acquired in January and February 2017, while Qtr. 3 data were obtained in August 2017 after 12.2 MGT (12.44 million tons) of accumulated tonnage.
Rail Seat Loads
To characterize the demands on the sleeper, rail seat loads from each train type were calculated. Table 1 summarizes the median and 95th percentile rail seat loads for each train type. Table 1 is divided between the four types of trains and each of these categories is subdivided into locomotives and rail cars. Further, freight trains are sub-divided as loaded and empty to better quantify the effect of specific traffic, especially under the homogeneity of unit train operations.
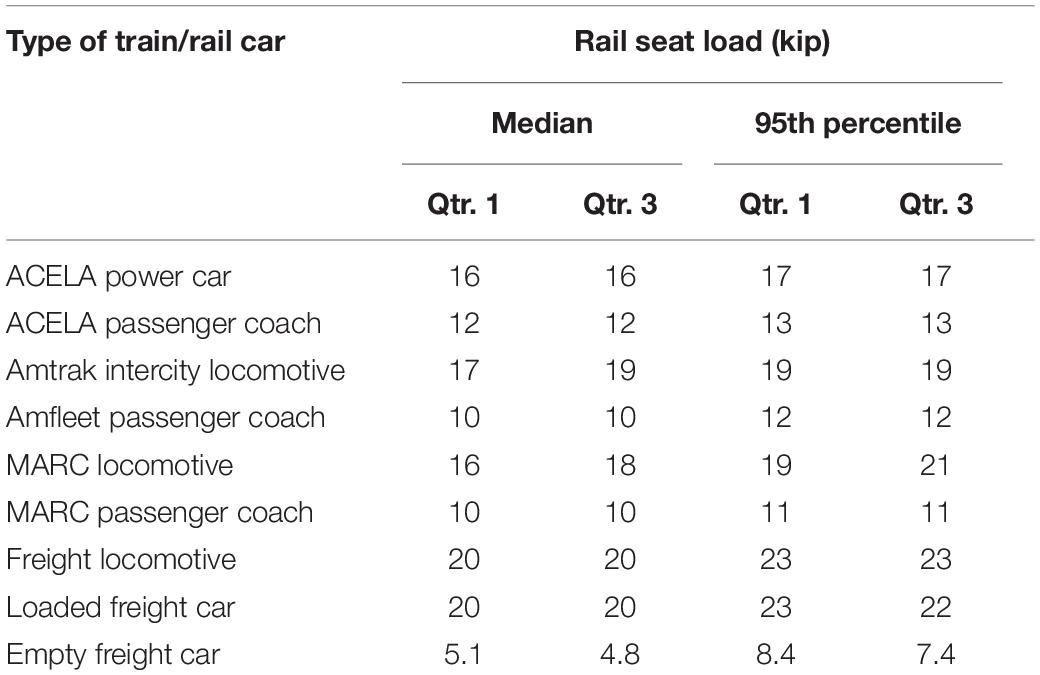
Table 1. Median and 95th percentile rail seat loads for each type of train.
Data in Table 1 demonstrate the wide range [5–23 kips (22–102 kN)] of loads observed at the field site. The lowest rail seat load values were generated by Empty Freight Cars and the highest values were generated by Freight Locomotives and Loaded Freight Cars.
Qualitative Assessment of Sleeper Support Condition
Figure 3 provides qualitative outputs from the back-calculator for an ACELA Power Car, an ACELA Passenger Coach, and an Empty Freight Car. Figure 4 shows both the magnitude and location of the rail seat loads as well as the ballast reaction forces on the sleeper.
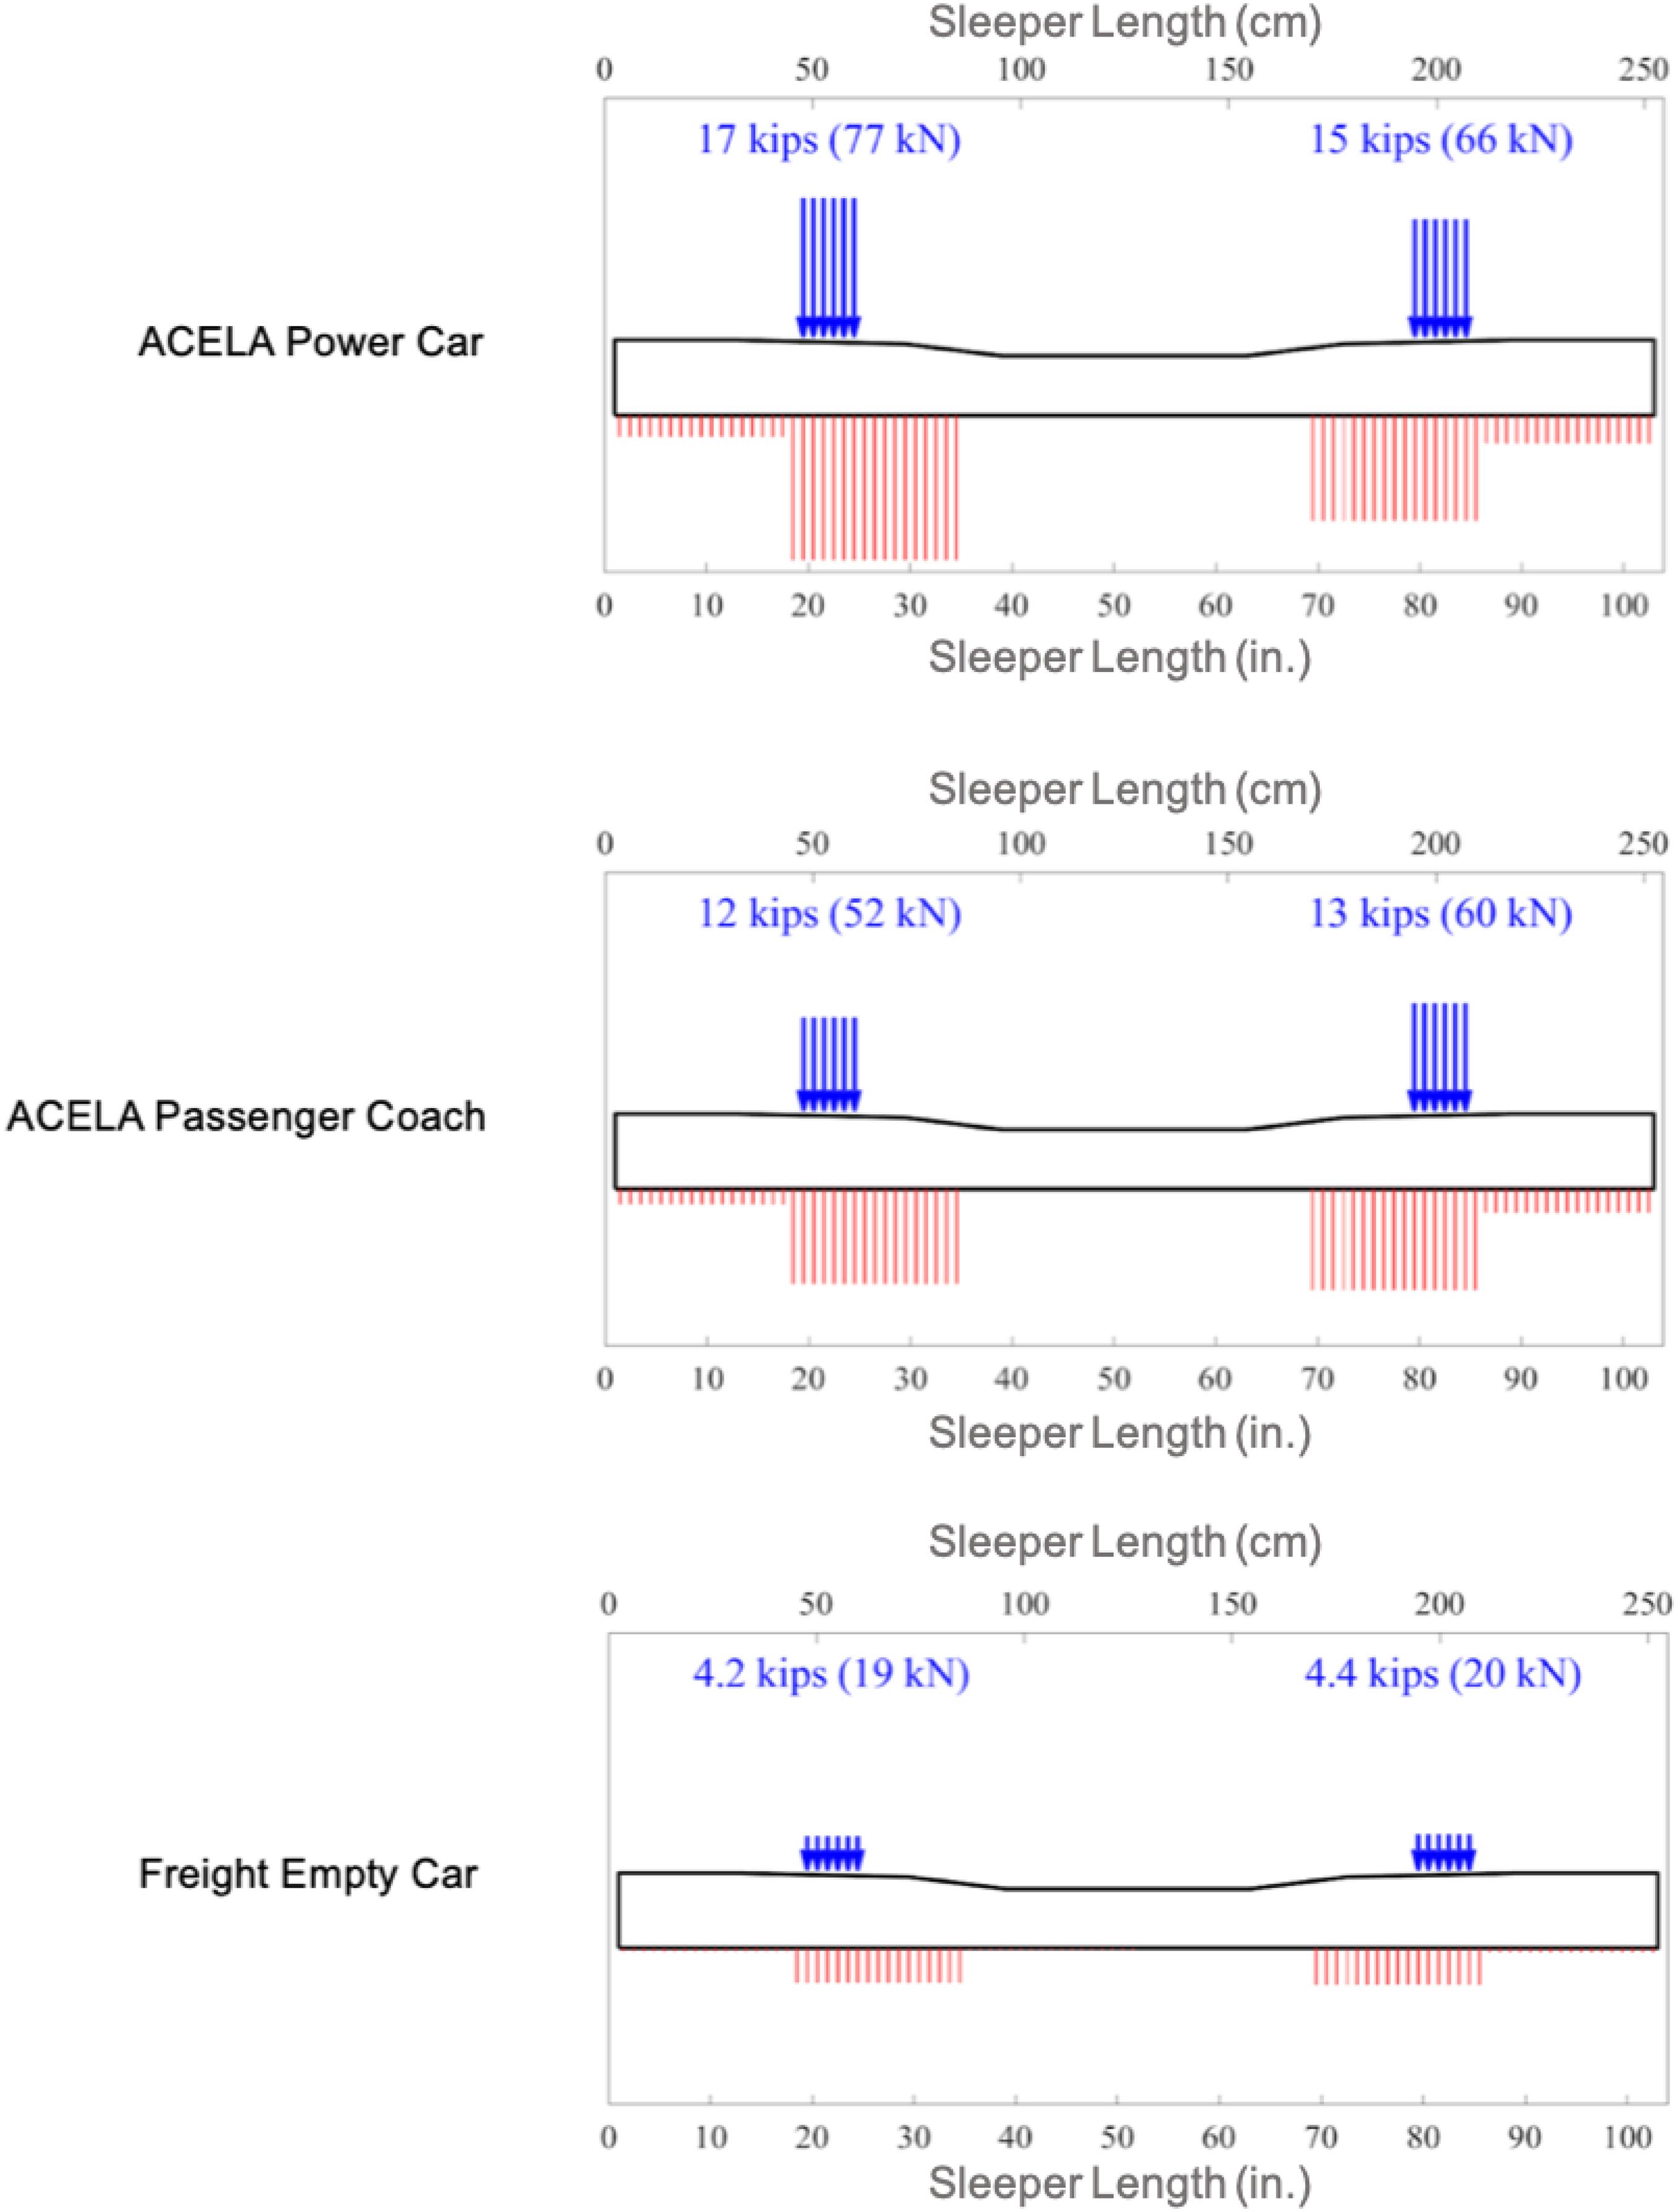
Figure 3. Ballast support condition with the passing of an ACELA Power Car, an ACELA Passenger Coach and a Freight Empty Car.

Figure 4. Relationship between rail seat load and maximum ballast pressure.
Processed results from the back calculator indicate a lack of center support (Qian et al., 2019). This type of support is often associated with newly tamped track (Bastos, 2018) and could lead to accelerated deterioration of the ballast directly below the rail seat If loads exceed the strength of the ballast (Branson et al., 2019). Good support under the rail seat is often viewed as a “starting” support condition that is likely to transition to center bound support as a function of time and tonnage. Further, this support condition leads to increased rail seat positive bending moments and the corresponding possibility of rail seat positive cracks. This support condition differs from what is assumed by American Railway Engineering and Maintenance-of-Way Association [AREMA], 2017, in that it is assumed there is uniform support from the end of the sleeper through the gauge side of the rail seat, whereas at Euro Norm (EN) (European Committee for Standardization, 2009) and the Australian Standard (AS) (Standards Australia, 2003) this support condition is considered as a newly tamped support condition, as summarized by You et al. (2017).
Quantitative Assessment of Ballast-Sleeper Interface Pressure
The relationship between rail seat load and ballast-sleeper pressure has been the subject of prior investigation. Median collected rail seat loads varied from 5.1 kips (22.7 kN) to 20.9 kips (93 kN) providing the opportunity to investigate the effect of load on pressure and compare to it to different approaches. First, we will compare it to Talbot’s approach, which indicates a direct positive linear relationship (Talbot, 1980). The second comparison is going to be related to the Eisenmann’s approach of how to calculate pressures at the tie-ballast interface (Eisenmann, 2004a, b; Giannakos, 2014). Therefore, the maximum ballast pressures directly below the sleeper were plotted against these rail seat loads and are presented in Figure 4 along with the expected sleeper-ballast pressure predicted by Talbot (1980).
The data indicates that the pressure is linear as a function of rail seat load (R2 = 0.998) which is in good agreement with both Talbot (1980) and Eisenmann (2004a, b). However, the measured magnitude is uniformly larger than Talbot. This uniform differential is due to Talbot’s assumption of 67% of the bottom of the sleeper being engaged in load transfer, whereas the sleeper that is subject of this paper engages only 60% of the bearing area. Regarding Eisenmann’s approach, when assuming that 89% of the bottom of the sleeper is being engaged in load transfer, it closely approximates to the field results obtained in this research. The 85 psi (586 kPa) AREMA recommended limit is exceeded when rail seat loads are greater than approximately 17 kips (76 kN). As a reference, when this same rail seat load is applied to a sleeper with a uniform support condition, the average ballast pressure is equal to approximately 30 psi (207 kPa), well below the value in American Railway Engineering and Maintenance-of-Way Association [AREMA] (2017). This indicates that a change in support conditions can lead to an 183% increase in the ballast pressure.
When reviewing international concrete sleeper flexural design recommendations, we find some noticeable differences. The current AREMA method for concrete sleeper flexural analysis considers a factored approach dependent on sleeper length, sleeper spacing, annual tonnage, and train speed, assuming a uniform ballast reaction along the sleeper (American Railway Engineering and Maintenance-of-Way Association [AREMA], 2017). The current AS method for sleeper flexural analysis is dependent on sleeper length, sleeper spacing, and axle load (Standards Australia, 2003). EN 13230-1 defers the analysis of design bending moments to UIC 713R (European Committee for Standardization, 2009). The UIC 713R method is dependent on sleeper length, sleeper spacing, axle load, rail pad attenuation, and train speed, providing a pair of safety factors, one to account for “variation in sleeper reaction due to support faults” and another to account for “irregularity in the support along the sleeper” (International Union of Railways, 2004). AS 1085.14 and AREMA both differ from UIC 713R by excluding reductions for rail pad attenuation or safety factors to account for support irregularities or voids (Wolf et al., 2015). Given how a change in ballast support condition can further increase concrete stresses within a sleeper, quantifying the actual support can improve the accuracy of the design recommended by both AREMA and AS.
To quantify the overall demand on the ballast and sub-structure, ballast pressure data were plotted in a cumulative distribution function (CDF) (Figure 5). The AREMA maximum allowable surface stress of 85 psi (586 kPa) is shown using a vertical dashed red line. Data from all of the bins analyzed during this study are shown, as well as the individual data from the rail seats, center, and end of the sleeper that were included to further investigate the distribution of support and its influence on ballast pressure along the sleeper bottom (Figure 5).
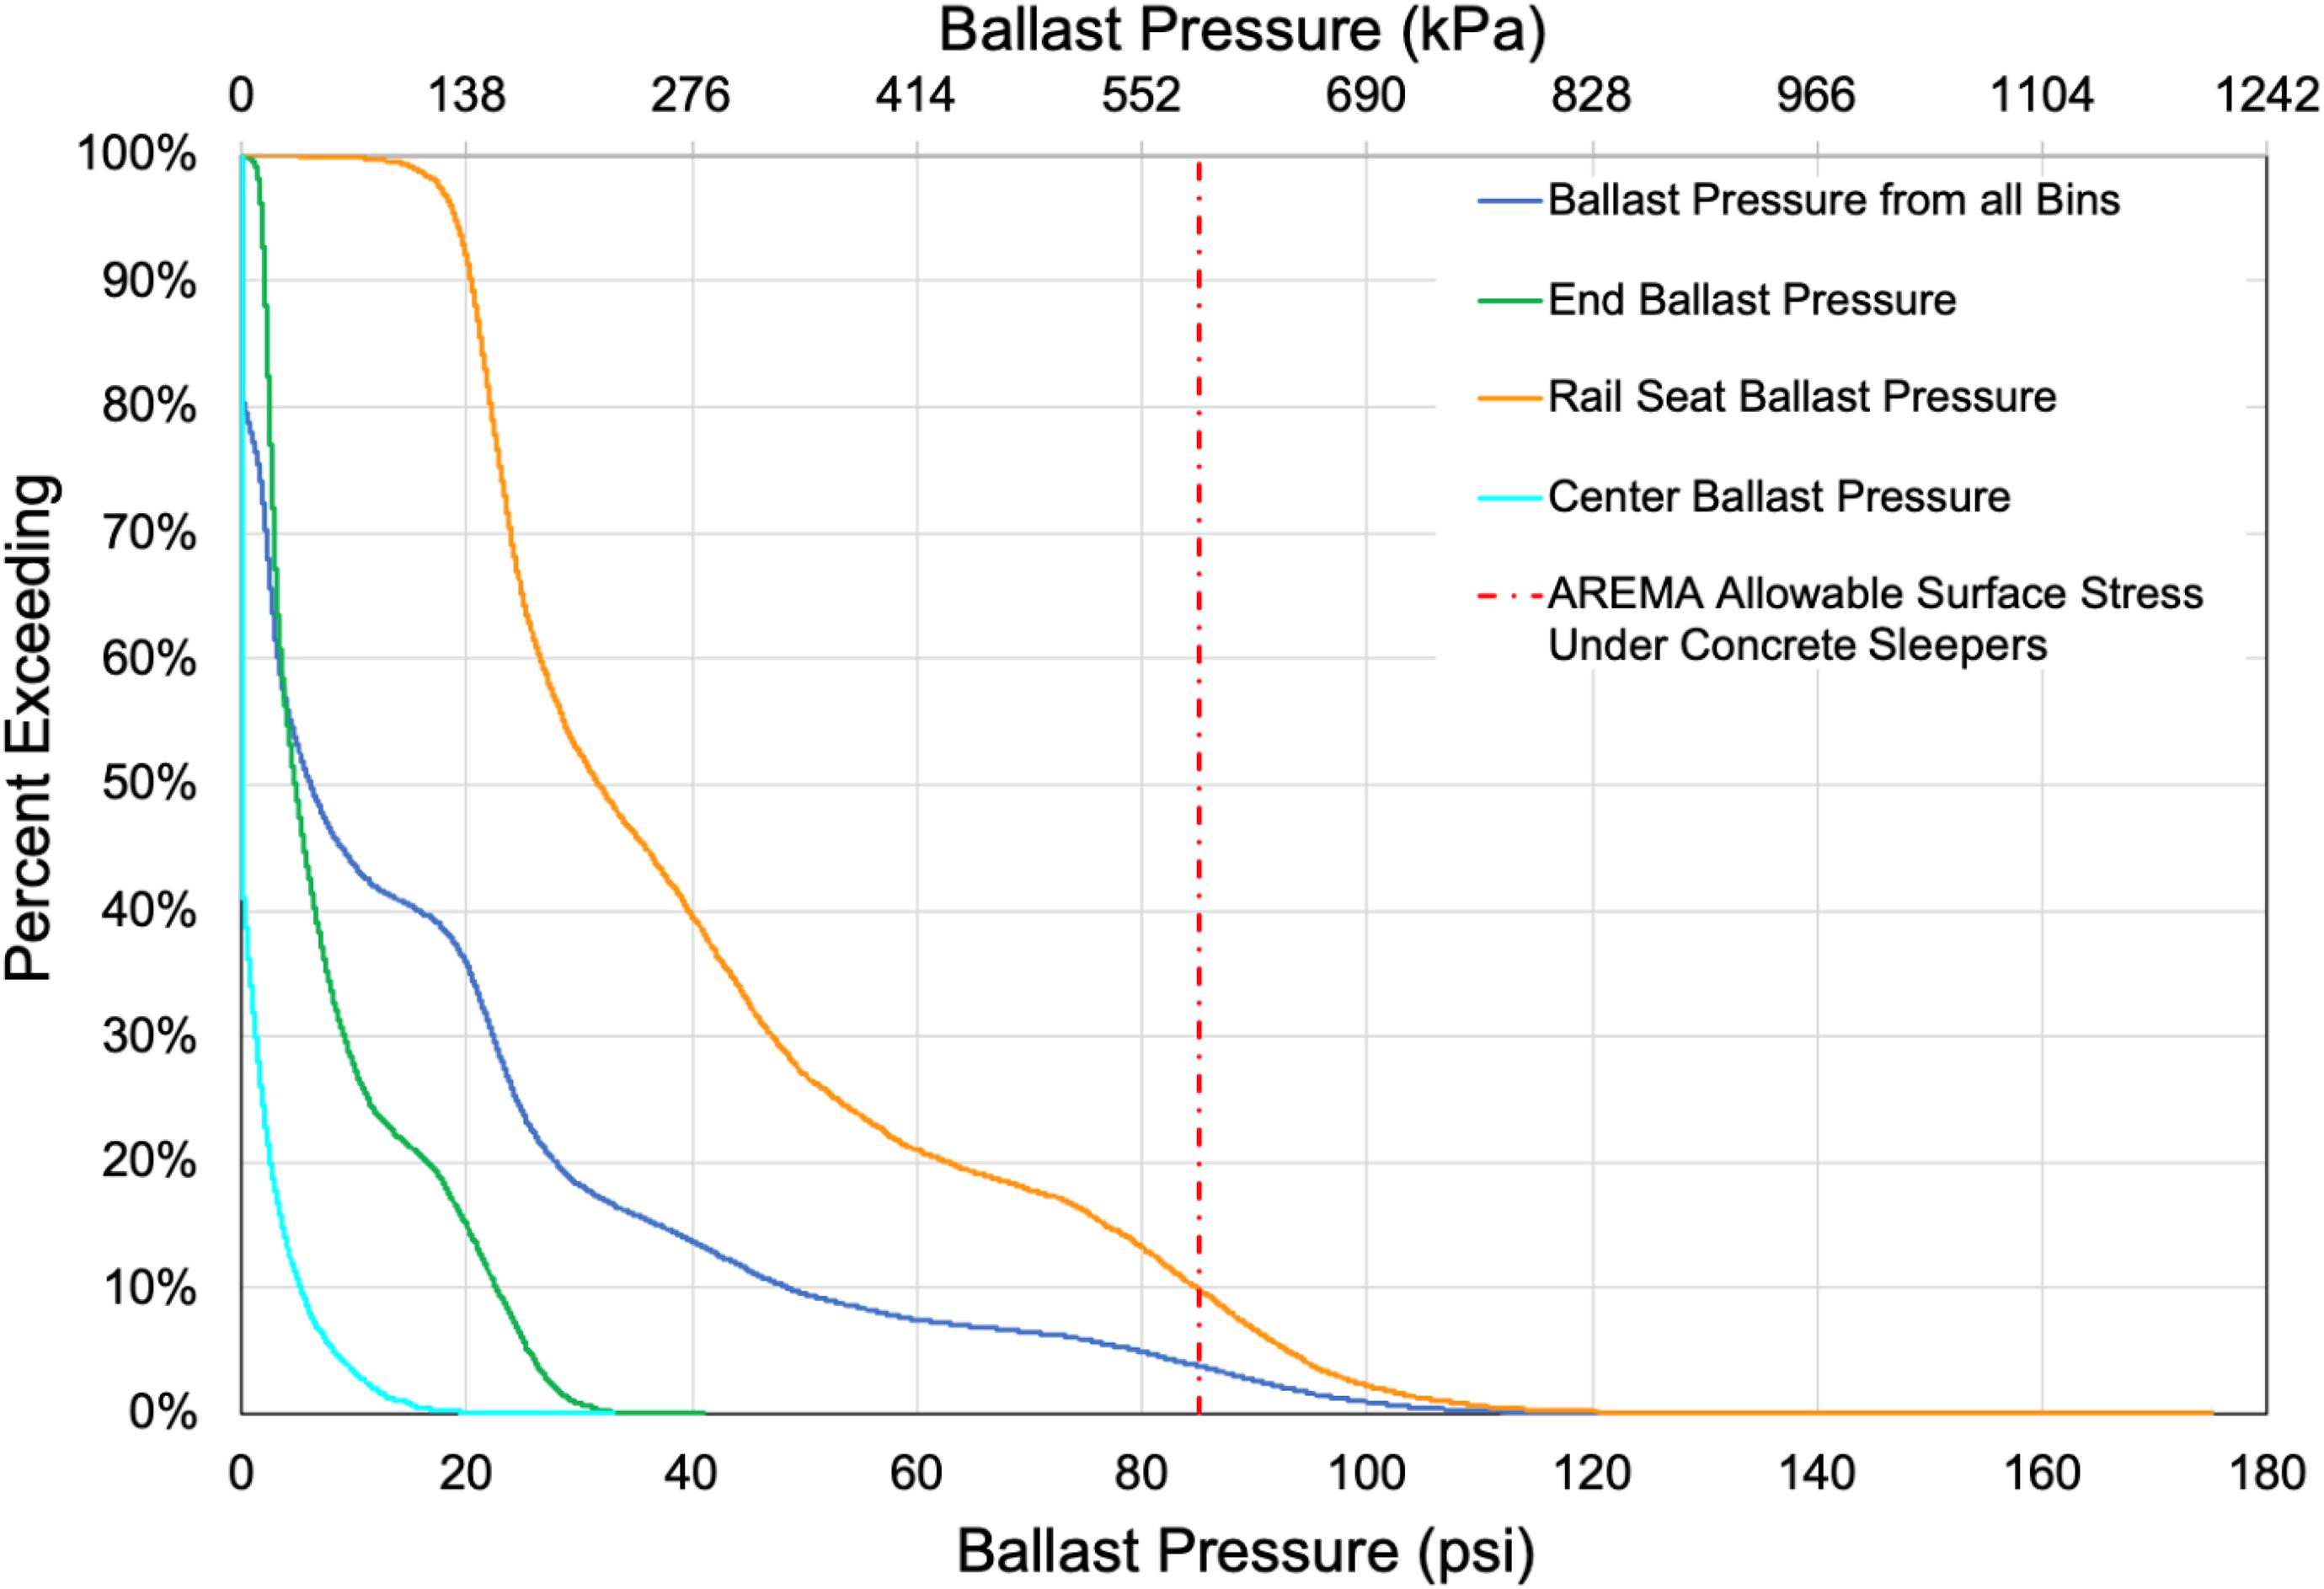
Figure 5. Cumulative distributions of ballast pressures for various bins combinations.
When considering data from all bins, approximately 4% of recorded values exceed the AREMA allowable ballast pressure. However, when analyzing only data from bins immediately beneath the rail seats, this value increases to 10%. This supports the hypothesis that this support condition would lead to increased demands at the rail seat, thus creating the potential for accelerated ballast deterioration at this location. When analyzing the pressure at both the ends and at the center of the sleeper, it is possible to determine that these bins are under comparatively little stress—well below the AREMA limit.
Effect of Traffic Type on Ballast Pressure
Given the variety of traffic operating on Amtrak’s NEC, pressures were quantified under a variety of rail seat loads (Figure 4), traceable by type of rolling stock. Figure 6 shows the median and 95th percentile ballast pressures at each bin for all rolling stock classifications, separating the data into the previously stated classification of Qtr. 1 and Qtr. 3 (shown diagonally within each bin).
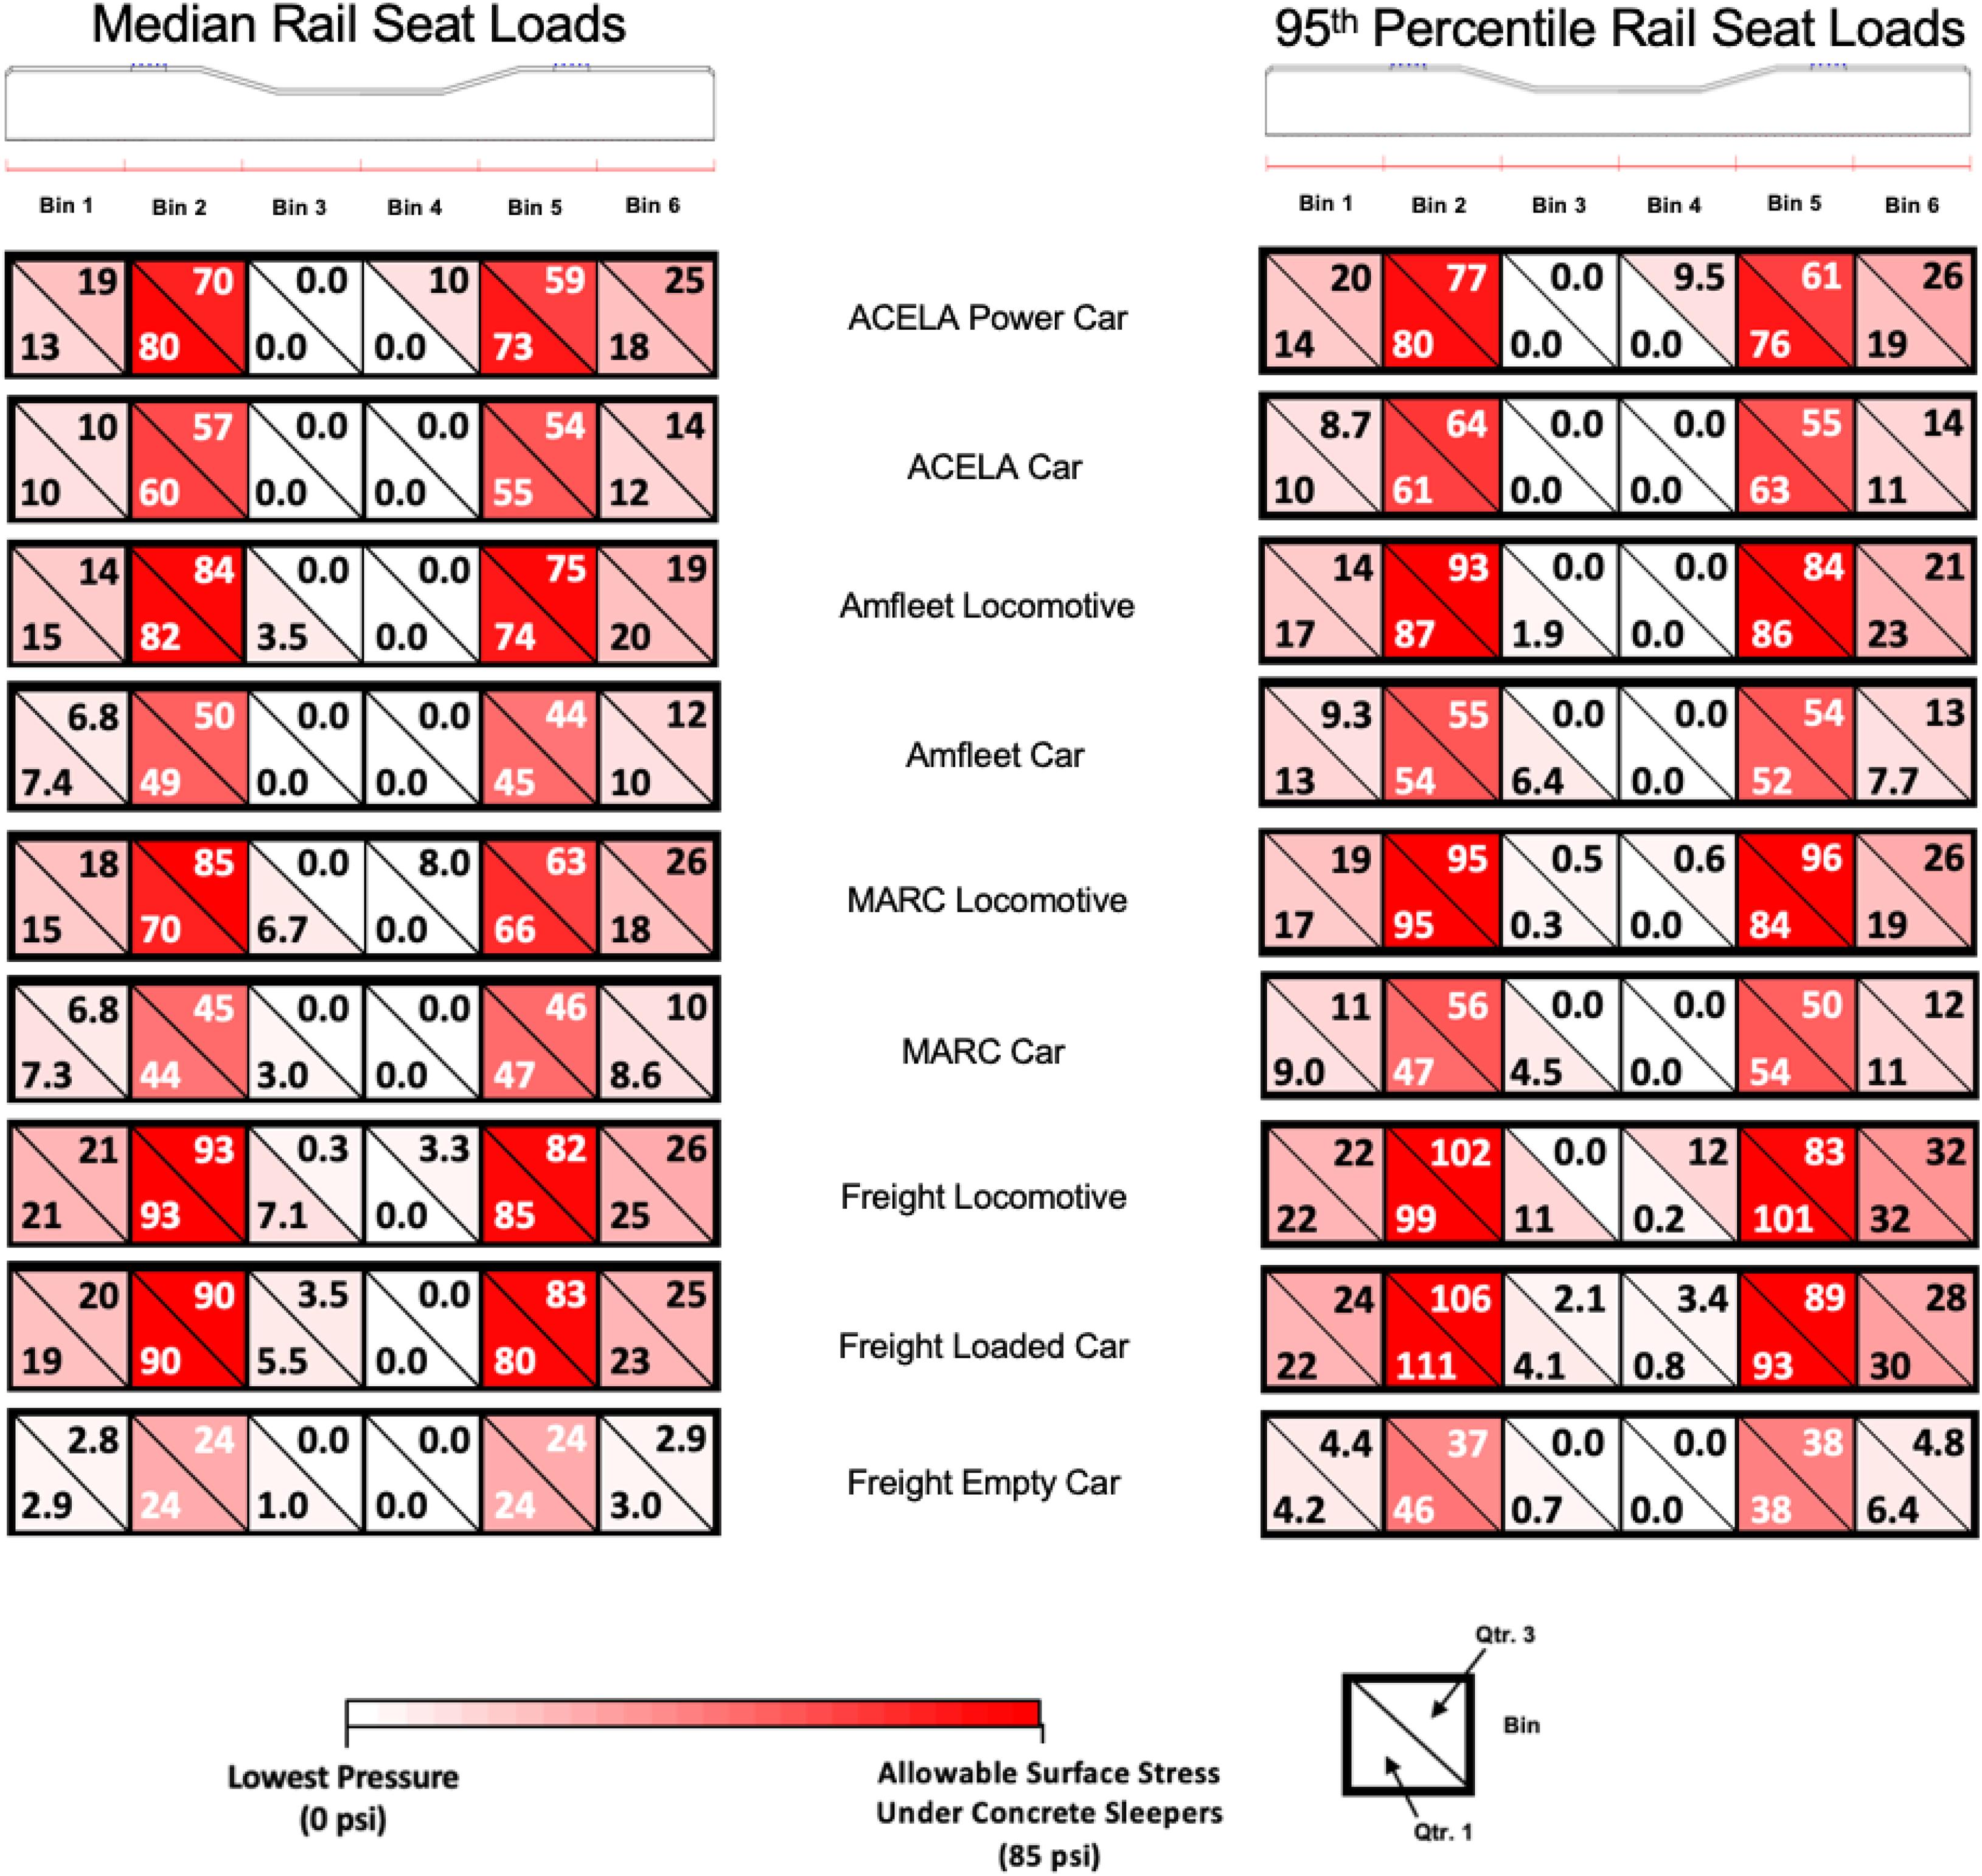
Figure 6. Ballast pressure distribution.
The data provides clear visual representation of the increased magnitude of ballast pressures directly below the rail seats for all vehicle types and the lack of support at the center and ends of the sleeper. While rail seat pressures are higher, AREMA allowable surface pressure is only exceeded under the Amtrak Intercity Locomotive, MARC Locomotive, Freight Locomotive, and Loaded Freight Car. This is reasonable given their nominal wheel load would produce rail seat loads that exceed 17.5 kips (78 kN). Therefore, if predicting ballast deterioration at this discrete location, one would expect deterioration to primarily occur under these vehicles and not the passenger coaches or empty freight cars. Given the disparity in pressure demand at the sleeper-ballast interface, it may be possible to quantify the amount of deterioration the increased pressures produce. From this, mechanistic-empirical (M-E) analysis and design could be pursued to ultimately develop a concept for rail engineering that is analogous to the equivalent single axle load (ESAL) highway loading concept developed by American Association of State Highway Official (AASHTO), therefore establishing the relationship between demand and damage (American Association of State Highway and Transportation Officials [AASHTO], 1993).
The data also indicate that pressure is non-linear as a function of increased rail seat loads, confirming earlier work by Quirós-Orozco et al. (2018). At lower rail seat loads (Empty Freight Car), Bins 1 and 5 exhibit pressures that are approximately 10% of the rail seat pressures as measured by Bins 2 and 4. However, as rail seat loads increase (Loaded Freight car), pressures in Bins 1 and 5 increases at a greater rate than the rail seats; in excess of 20%. Therefore, while Figure 6 indicates a positive linear relationship between rail seat load and maximum pressure, there is non-linearity in how the pressures are distributed along the bottom of the sleeper. It is also possible to identify differences between the values obtained within Bins 2 and 4, with both bins being located directly beneath the rail seats (Figure 6). This can be explained by the influence of uneven rail seat loads observed in the field (Edwards et al., 2018).
Additionally, Figure 6 indicates support conditions remained largely constant after the accumulation of 12.24 MGT over the course of this investigation. An analysis of variance (ANOVA) was conducted to compare the data, establishing H0: Quarter 3 ballast pressures are equal to the Quarter 1 ballast pressures and H1: At least six Quarter 3 ballast pressures are different than Quarter 1 ballast pressures (α = 0.05). The p-value obtained was 0.209, meaning that there is insufficient evidence to reject the null hypothesis that the population means are all equal. Thus, the support condition remains the same, and there isn’t a significant change in ballast pressure values with the accumulated tonnage. This highlights one of the possible uses of the back-calculator as a potential monitoring tool to predict ballast degradation and better optimize maintenance scheduling.
Ballast Pressure Variation Within a Train Pass
To further quantify the distribution of pressures along the sleeper, and throughout the passage of a train, the pressures under each axle were plotted for different train types (Figure 7). As alluded to previously, quantifying the frequency and location of pressures will lead to improved ballast deterioration models and improved track designs—feeding into burgeoning M-E analysis and design practices (Quirós-Orozco, 2018).
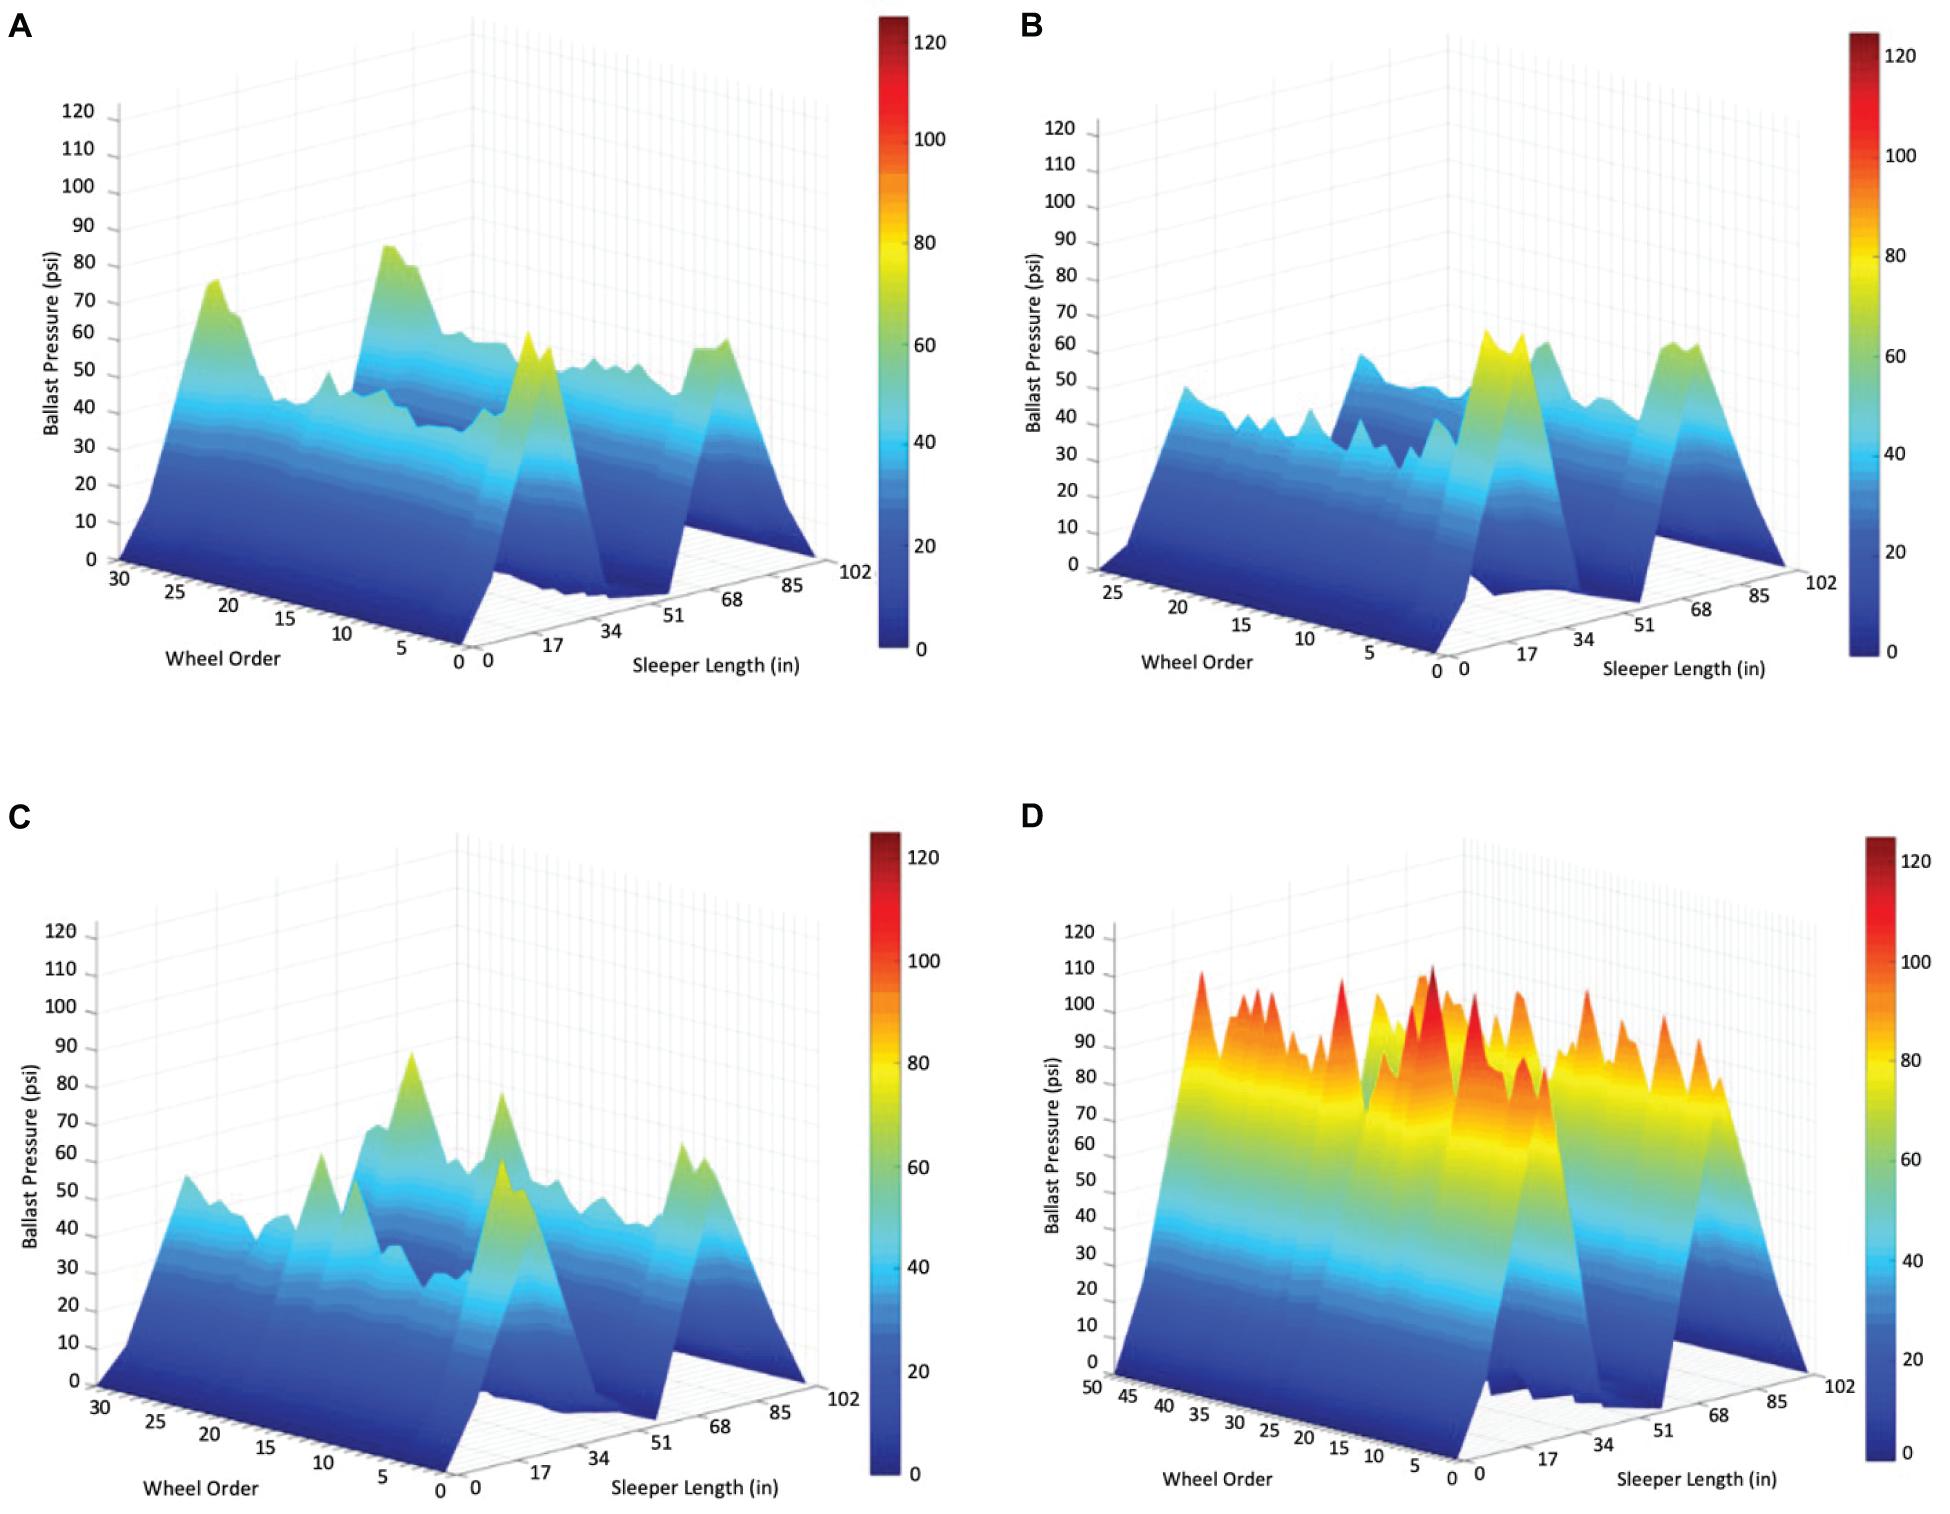
Figure 7. Ballast pressure distribution for representative train passes from various types of rolling stock: (A) ACELA, (B) Amfleet, (C) MARC, and (D) Freight Locomotives.
The locomotives and power cars are clearly visible within the axle distribution and are more defined than passenger coaches in figures (a), (b), and (c). More specifically, in Figure 7A it is possible to observe the ACELA Power Cars at both ends of the train are applying approximately 30 psi (207 kPa) greater pressures to the ballast than the passenger cars. Unlike the passenger equipment, Figure 7D indicates that the pressures generated by HAL freight trains are similar throughout the length of the train, and in this instance, are significantly greater in magnitude than any of the passenger pressures. More specifically, when comparing Figures 7B–D the maximum pressure of the passenger car of 40 psi (276 kPa) is only 35% of the maximum freight car pressure of approximately 110 psi (758 kPa).
Conclusion
The use of surface-mounted strain gauges on concrete sleepers has been shown to provide reliable and accurate results to quantify stresses, moments, and pressures, in a non-intrusive and non-destructive manner. The back-calculator was applied to shared corridor field data, and demonstrated efficacy as a reliable monitoring tool to quantify the ballast support condition at the sleeper-ballast interface at the analyzed shared corridor. Some of the specific conclusions that can be drawn from its use are:
• There is a wide range of loads experienced on Amtrak’s NEC, ranging from approximately 4 to 35 kips (18–156 kN) with corresponding ballast pressures ranging from 14 to 175 psi (97–1,207 kPa), being the lowest rail seat load values generated by Freight Empty Cars and the highest vales generated by the Freight Locomotive and the Freight Loaded Cars, with a difference of more than a factor of 8.
• Data indicate that the relationship between pressure and rail seat load is linear (R2 = 0.998), where the sleeper-ballast contact area for the subject sleeper in this paper corresponding to 60%.
• The 85 psi (586 kPa) AREMA recommended maximum ballast pressure limit is exceeded when rail seat loads are greater than approximately 17 kips (76 kN) given a lack of center support condition.
• When considering data from all bins, approximately 4% of recorded values exceed the AREMA MRE. However, when analyzing only the data from the bins immediate beneath the rail seats, this value increases to 10%. When analyzing the pressure at both the ends and at the center of the sleeper, it is possible to determine that these bins are under comparatively little stress, and well below the AREMA allowable ballast pressure limit. This supports the hypothesis that this support condition would lead to increased demands at the rail seat, thus creating the potential for accelerated ballast deterioration at this location.
The accumulation of 12.24 MGT did not lead to a significant (α = 0.05) change in ballast pressure values nor did it change the ballast support condition. This highlights one of the possible uses of the back-calculator as a potential monitoring tool to predict ballast degradation and better optimize maintenance scheduling.
This study showed the effect of different types of trains on the pressure beneath a single concrete sleeper with an initial support state that was representative of rail seat support. In the future, the authors encourage widespread use of the back-calculator on a larger sample size of sleepers (including adjacent sleepers) to obtain different initial support states in conjunction with the use of use of smart sleepers. The resulting data will helps quantify the frequency and location of excessive pressures on sleepers, facilitating mapping of said pressures to deterioration rates. This in turn will lead to improved ballast deterioration models and improved track designs—feeding into broader M-E analysis and design practices.
Data Availability Statement
The raw data supporting the conclusions of this article will be made available by the authors, without undue reservation.
Author Contributions
MD and JE: study conception and design. MD and CS: data collection. MD, CS, and JE: analysis and interpretation of results and draft manuscript preparation. All authors reviewed the results and approved the final version of the manuscript.
Funding
Funding for data collection was provided by the National Railroad Passenger Corporation, doing business as Amtrak. This work was also supported by the National University Rail Center, a U. S. Department of Transportation Office of the Assistant Secretary for Research and Technology Tier 1 University Transportation Center. The material in this manuscript represents the position of the authors and not necessarily that of sponsors. JE was supported in part by the grants to the UIUC Rail Transportation and Engineering Center (RailTEC) from CN and Hanson Professional Services.
Conflict of Interest
The authors declare that this study received funding from the National Railroad Passenger Corporation, Amtrak. The funder had the following involvement with the study: provision of access to track for data collection as well as assistance in the selection of field site.
References
American Association of State Highway and Transportation Officials [AASHTO] (1993). AASHTO Guide for Design of Pavement Structures, 1993. Washington, D.C: AASHTO.
American Railway Engineering and Maintenance-of-Way Association [AREMA] (2017). Manual for Railway Engineering. Landover, MD: The American Railway Engineering and Maintenance of Way Association.
Artagan, S. S., Bianchini Ciampoli, L., D’Amico, F., Calvi, A., and Tosti, F. (2020). Non-destructive assessment and health monitoring of railway infrastructures. Surv. Geophys. 41, 447–483. doi: 10.1007/s10712-019-09544-w
Baniæ, M., Miltenoviæ, A., Pavloviæ, M., and Æiriæ, I. (2019). Intelligent machine vision based railway infrastructure inspection and monitoring using uav. Facta Univ. Ser. Mech. Eng. 17, 357–364. doi: 10.22190/FUME190507041B
Bastos, J. C. (2018). Laboratory analysis of track gauge restraining capacity of center-cracked railway concrete sleepers with various support conditions | elsevier enhanced reader. Eng. Fail. Anal. 94, 354–363. doi: 10.1016/j.engfailanal.2018.08.018
Bastos, J. C., Dersch, M. S., Edwards, J. R., and Andrawes, B. O. (2017). Flexural behavior of concrete crossties under different support conditions. Am. Soc. Civ. Eng. J. Transp. Eng. 143:04017064. doi: 10.1061/JTEPBS.0000097
Branson, J. M., Dersch, M. S., de Lima, A. O., Edwards, J. R., and Cesar Bastos, J. (2019). Identification of the under-tie pad material characteristics for stress state reduction. Proc. Inst. Mech. Eng. Part F J. Rail Rapid Transit. 234:095440971989015. doi: 10.1177/0954409719890156
Bruner, M. (2018). Australia: attivazione del primo sistema ferroviario autonomo per il trasporto merci. Aust. Act. First Auton. Railw. Syst. Freight Transp. 73, 853–854.
Canga Ruiz, A. E., Edwards, J. R., Qian, Y., and Dersch, M. S. (2020). Probabilistic framework for the assessment of the flexural design of concrete sleepers. Proc. Inst. Mech. Eng. Part F J. Rail Rapid Transit. 234, 691–701. doi: 10.1177/0954409719854569
Canga Ruiz, A. E., Qian, Y., Edwards, J. R., and Dersch, M. S. (2019). Analysis of the temperature effect on concrete crosstie flexural behavior. Constr. Build. Mater. 196, 362–374. doi: 10.1016/j.conbuildmat.2018.11.065
Canga Ruiz, ÁE. (2018). Analysis of the Design of Railroad Track Superstructure Components for Rail Transit Applications. Master’s Thesis University of Illinois at Urbana-Champaign, Department of Civil and Environmental Engineering: Urbana, IL.
Edwards, J., Canga Ruiz, A. E., Cook, A. A., Dersch, M. S., and Qian, Y. (2018). Quantifying bending moments in rail-transit concrete sleepers. J. Transp. Eng. Part Syst. 144:04018003. doi: 10.1061/JTEPBS.0000125
Edwards, J. R., Gao, Z., Wolf, H. E., Dersch, M. S., and Qian, Y. (2017). Quantification of concrete railway sleeper bending moments using surface strain gauges. Meas. - J. Int. Meas. Confed. 111, 197–207. doi: 10.1016/j.measurement.2017.07.029
Edwards, J. R., Liang, Y., Bastos, J. C., and Dersch, M. S. (2019). “Development of a parametric model for prediction of concrete railway crosstie service bending moments,” in Proceedings of the 98th Annual Meeting of the Transportation Research Board of the National Academies, (Washington, DC).
Eisenmann, J. (2004a). Die Schiene als Tragbalken. Available online at: /paper/Die-Schiene-als-Tragbalken-Eisenmann/3de7f9f956e089cddf4aac9c51f9d4147017dea6 (accessed August 26, 2020).
Englander, J. A., and Englander, A. C. (2014). “Tuning monotonic basin hopping: improving the efficiency of stochastic search as applied to low-thrust trajectory optimization,” in Proceedings of International Symposium on Space Flight Dynamics 2014, Laurel, MD.
European Committee for Standardization (2009). EN 13230-1:2009: Railway applications - Track - Concrete sleepers and bearers - Part 1: General requirements. Brussels: European Committee for Standardization.
Fox-Ivey, R., Nguyen, T., and Laurent, J. (2020). Extended Field Trials of LRAIL for Automated Track Change Detection. Washington DC: Publ. DOTFRAORD-2014 Department of Transportation, Federal Railroad Administration.
Giannakos, K. (2014). Design loads on railway substructure: sensitivity analysis of the influence of the fastening stiffness. Int. J. Railw. 7, 46–56. doi: 10.7782/IJR.2014.7.2.46
International Union of Railways (2004). UIC 713C: Design of Monoblock Sleepers. Paris: International Union of Railways.
Kaewunruen, S., Ishida, T., and Remennikov, A. (2016). Impact analyses for negative flexural responses (hogging) in railway prestressed concrete sleepers. J. Phys. Conf. Ser. 744:012101. doi: 10.1088/1742-6596/744/1/012101
Kaewunruen, S., and Remennikov, A. (2009). Influence of ballast conditions on flexural responses of railway concrete sleepers. Concr. Aust. J. Concr. Inst. Aust. 35, 57–62.
Kim, J., Choi, S. W., Song, Y.-S., Yoon, Y.-K., and Kim, Y.-K. (2015). Automatic train control over LTE: design and performance evaluation. IEEE Commun. Mag. 53, 102–109. doi: 10.1109/MCOM.2015.7295470
Kirkpatrick, S., Gelatt, C. D., and Vecchi, M. P. (1983). Optimization by simulated annealing. Science 220:671. doi: 10.1126/science.220.4598.671
Köllõ, S. A., Puskás, A., and Köllõ, G. (2015). Ballasted track versus ballastless track. Key Eng. Mater. 660, 219–224. doi: 10.4028/www.scientific.net/KEM.660.219
McHenry, M. T., Brown, M., LoPresti, J., Rose, J., and Souleyrette, R. (2015). Use of matrix-based tactile surface sensors to assess fine-scale ballast-tie interface pressure distribution in railroad track. Trans. Res. Rec. 2476, 23–31. doi: 10.3141/2476-2474
Qian, Y., Dersch, M. S., Gao, Z., and Edwards, J. R. (2019). Railroad infrastructure 4.0: development and application of an automatic ballast support condition assessment system. Transp. Geotech. 19, 19–34. doi: 10.1016/j.trgeo.2019.01.002
Quirós-Orozco, R. J. (2018). Prestressed Concrete Railway Crosstie Support Variability and its Effect on Flexural Demand. Champaign, IL: University of Illinois at Urbana-Champaign. M.S. Thesis.
Quirós-Orozco, R. J., Edwards, J. R., Qian, Y., and Dersch, M. S. (2018). Quantification of loading environment and flexural demand of prestressed concrete crossties under shared corridor operating conditions. Transp. Res. Rec. J. Transp. Res. Board 2672, 136–145. doi: 10.1177/0361198118793500
Resor, R. R., Smith, M. E., and Patel, P. K. (2005). Positive Train Control (PTC): calculating benefits and costs of a new railroad control technology. J. Transp. Res. Forum 44, 77–98.
Rose, J. G., Watts, T. J., Clarke, D. B., and Liu, Q. (2018). Application of Granular Material Pressure Cells to Measure Railroad Track Tie/Ballast Interfacial Pressures. Thousand Oaks, CA: SAGE Publications Ltd. doi: 10.1177/0361198118775872
Saadat, S., Sherrock, E., and Zahaczewski, J. (2018). Autonomous Track Geometry Measurement Technology Design, Development, and Testing. Washington DC: Publ. DOTFRAORD-1806 Department of Transportation, Federal Railroad Administration, 139.
Saadat, S., Stuart, C., Carr, G., and Payne, J. (2014). “FRA autonomous track geometry measurement system technology development: past, present, and future,” in 2014 Joint Rail Conference, JRC 2014, (New York, NY: American Society of Mechanical Engineers ASME), doi: 10.1115/JRC2014-3860
Selig, E. T. (1994). Track Geotechnology and Substructure Management. London: Thomas Telford. doi: 10.1680/tgasm.20139
Solomon, B. (2001). Railway Maintenance: The Men and Machines that Keep the Railroads Running. Osceola, FLA: MBI PubCo.
Standards Australia. (2003). Railway Track Material, Part 14: Prestressed Concrete Sleepers. Sydney, NSW: Standards Australia Committee CE-002.
Stuart, C., Carr, G., and Sherrock, E. (2012). Autonomous measurement of track geometry. Railw. Gaz. Int. 168, 41–44.
Talbot, A. N. (1980). Stresses in Railroad Track: Bulletins of the Special Committee on Stresses in Railroad Track. Washington, DC: American Railway Engineering Association (AREA).
Tanathong, S., Smith, W. A. P., and Remde, S. (2017). “Eliminating the observer effect: shadow removal in orthomosaics of the road network,” in Proceedings of the 2017 IEEE International Conference on Computer Vision Workshops (ICCVW), (Piscataway, NJ: IEEE), 262–269. doi: 10.1109/ICCVW.2017.40
Tarawneh, C., Aranda, J., Hernandez, V., Crown, S., and Montalvo, J. (2020). An investigation into wayside hot-box detector efficacy and optimization. Int. J. Rail Transp. 8, 264–284. doi: 10.1080/23248378.2019.1636721
Van Dyk, B. J. (2014). Characterization of the Loading Environment for Shared-Use Railway Superstructure in North America. Available online at: https://www.ideals.illinois.edu/handle/2142/72855 [Accessed March 10, 2017]
Wolf, H. E., Mattson, S., Edwards, J. R., Dersch, M. S., and Barkan, C. P. L. (2015). “Flexural analysis of prestressed concrete monoblock crossties: comparison of current methodologies and sensitivity to support conditions,” in Proceedings of the 94th Annual Meeting of the Transportation Research Board of the National Academies, (Washington, DC).
Wolf, H. E., Qian, Y., Edwards, J. R., Dersch, M. S., and Lange, D. A. (2016). Temperature-induced curl behavior of prestressed concrete and its effect on railroad crossties. Constr. Build. Mater. 115, 319–326. doi: 10.1016/j.conbuildmat.2016.04.039
Xiao, J., Wang, Y., Zhang, D., Zhang, X., and Guo, J. (2020). Testing of Contact Stress at Ballast Bed-Soil Subgrade Interface under Cyclic Loading Using the Thin-Film Pressure Sensor. J. Test. Eval. 48, 2104–2117. doi: 10.1520/JTE20190171
Ye, J., Stewart, E., and Roberts, C. (2019). Use of a 3D model to improve the performance of laser-based railway track inspection. Proc. Inst. Mech. Eng. Part F J. Rail Rapid Transit 233, 337–355. doi: 10.1177/0954409718795714
Keywords: substructure, condition monitoring, non-destructive, support condition, field instrumentation, smart sleeper, ballast pressure
Citation: Pereira Silva C, Dersch MS and Edwards JR (2020) Quantification of the Effect of Train Type on Concrete Sleeper Ballast Pressure Using a Support Condition Back-Calculator. Front. Built Environ. 6:604180. doi: 10.3389/fbuil.2020.604180
Received: 08 September 2020; Accepted: 26 November 2020;
Published: 14 December 2020.
Edited by:
Serdar Dindar, Izmir Kâtip Çelebi University, TurkeyReviewed by:
Heung Fai Lam, City University of Hong Kong, Hong KongChayut Ngamkhanong, University of Birmingham, United Kingdom
Ruilin You, China Academy of Railway Sciences, China
Copyright © 2020 Pereira Silva, Dersch and Edwards. This is an open-access article distributed under the terms of the Creative Commons Attribution License (CC BY). The use, distribution or reproduction in other forums is permitted, provided the original author(s) and the copyright owner(s) are credited and that the original publication in this journal is cited, in accordance with accepted academic practice. No use, distribution or reproduction is permitted which does not comply with these terms.
*Correspondence: Marcus S. Dersch, bWRlcnNjaDJAaWxsaW5vaXMuZWR1