 Salmaan Craig1*
 Anna Halepaska2
 Katherine Ferguson2
 Preston Rains2
 Jacob Elbrecht2
 Andrew Freear2
 David Kennedy2
 Kiel Moe1
- 1Faculty of Engineering, Peter Guo-hua Fu School of Architecture, McGill University, Montreal, QC, Canada
- 2Rural Studio, College of Architecture, Design, and Construction, Auburn University, Newbern, AL, United States
Mass timber products, together with careful forestry management, could help decarbonize the construction industry. These products must be long-lasting, to safely store atmospheric carbon for decades or centuries, and multi-functional, to displace materials and equipment that are emissions-intensive. This paper shows how to optimize mass timber panels as heat-exchangers, suggesting how to eliminate insulation while simplifying HVAC systems. Test panels measured the heat-exchange in steady and transient conditions, when the ventilation was driven by a fan or by thermal buoyancy. The total heat transfer was predicted accurately by theory in all cases. Further investigation is needed to understand the possible heat-recovery effects at the exterior surface.
1. Introduction
Building operations are responsible for 28% of greenhouse gas (GHG) emissions, while 11% of emissions come from construction activities, mainly the production of building materials, such as cement and steel (International Energy Agency and the United Nations Environment Programme, 2018). In the coming decades, the growth and urbanization of the global population will create a vast demand for new buildings and infrastructure. “Embodied” emissions from the construction sector are therefore set to rise sharply, just as global emissions need to drastically fall (Röck et al., 2020). Is it possible to transform this potential threat to the global climate system into a powerful means to mitigate climate change?
1.1. Carbon Utilization
There is a growing likelihood that meeting climate goals will require carbon removal techniques, also known as “negative emissions.” Scientists and practitioners have started to analyze the potential of new buildings as a global carbon sink (Churkina et al., 2020; Hoxha et al., 2020; Pomponi et al., 2020). There is a range of materials that can store C or CO2, including timber, concrete, bamboo, hemp, and straw. Concrete has traditionally been a source of CO2 emissions due to its intensive production process, but can reabsorb significant amounts of carbon over its long service life (Cao et al., 2020). Recent advances in manufacturing—tailoring the curing process to absorb more C, or mineralizing the CO2 from production in the flue for use as aggregate—provide opportunities for carbon utilization in the concrete industry beyond lifetime carbonation (Monkman and MacDonald, 2017; Habert et al., 2020). Meanwhile, biogenic materials like timber and bamboo grow by photosynthesis, sequestering carbon in their biomass. Harvested biomass products may provide negative life-cycle emissions if forests or crops are well-managed and products are sufficiently long-lived relative to their biomass growth cycle (Guest et al., 2013; Levasseur et al., 2013). Composites like vegetal concretes—concretes using fast-growing crops like hemp or straw as binders—could potentially exploit the storage impacts of both biogenic carbon uptake and carbonation (Pittau et al., 2018). According to a recent analysis, timber and concrete could each store ~0.5 Gt CO2 annually assuming there is proper coordination of their production cycles (Hepburn et al., 2019). These potential quantities put new buildings on par with other front-runners for utilizing atmospheric carbon in the technosphere.
If buildings can work in concert with forests as a global carbon sink, then design integration can multiply the drawdown potential. For instance, if mass timber structures can actively produce interior climates using only low-grade heat, there will be less need for extra materials and mechanical systems. The metric for multiplying GHG reductions through functional substitution is known as the “displacement factor” (Smyth et al., 2018; Seppälä et al., 2019; Hurmekoski et al., 2020). For CO2 utilization to reach its full potential, however, carbon-storing materials must do more than replace conventional materials in a piecemeal fashion. The materials must perform as many functions as possible, so they can displace entire systems that are emissions-intensive.
1.2. Radical Integration
What advances in materials engineering could deliver this kind of radical integration? “Designed porous media” are materials shaped internally and externally to exchange heat and mass (Bejan et al., 2004). Like “Architecture-d materials” (Estrin et al., 2019) and “Form-active structures” (Wu et al., 2020), the innovative aspect is how the morphology of the material manages the flow of energy. Applying these new methods may be the key to upgrading carbon-storing building materials. Not only to enhance their structural performance, but to integrate thermal and ventilation functions, so extra materials and mechanical systems are less necessary.
One example is designing mass timber panels as heat exchangers or “breathing walls.” The principle is to introduce air-channels into the solid and to optimize their size and spacing, so the outgoing conduction heats the incoming air. This technique could make insulation and cladding materials redundant while helping to simplify HVAC systems. Figure 1 explains the heat exchange concept, and the principle for optimizing the geometry. A recent study used physical experiments to validate a correlation for optimizing heat-exchanging materials (Craig and Grinham, 2017). The design correlation was originally developed by other researchers (Kim et al., 2007) for extreme thermal conditions, but the 2017 study results show that it works for building materials in moderate conditions, too. This paper is a follow-up to their work. It examines how to apply the correlation and the design principles to mass timber panels. “Mass timber” refers to engineered wood products, laminated from smaller boards into structural components, such as glue-laminated (glulam) beams or cross-laminated timber (CLT) panels.
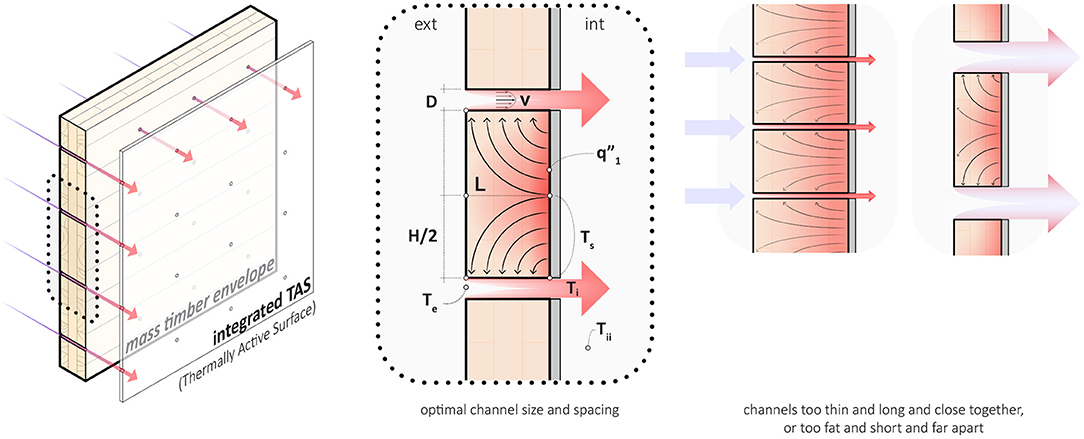
Figure 1. How to optimize the size and spacing of channels to design a mass timber panel as a heat-exchanger. The design correlations (Equations 1–14) were originally developed for aerospace applications (Kim et al., 2007), but it has been shown they work for building materials (Craig and Grinham, 2017). This study applies them to mass timber.
1.3. Dynamic Insulation
Designing a construction material as a heat-exchanger makes it a kind of Dynamic Insulation (DI) technology. DI began as a novel ventilation strategy for agricultural buildings in cold climates. Engineers described how to suck fresh air through a layer of fibrous insulation, reducing conduction losses while simultaneously heating the air (Bartussek, 1981). In the early nineties, researchers installed DI in a residential unit in Japan and reported a 50% reduction in thermal envelope losses (Dalehaug et al., 1993). Soon after, two significant advances in DI theory followed. A simple analytical model was developed to describe steady heat exchange in DI when the interior surface temperature or rate of surface convection is known (Taylor et al., 1996, 1998; Taylor and Imbabi, 1997, 1999, 2000). A detailed analytical model was also developed to incorporate thermal storage effects and show the impact of periodic changes in the exterior environment (Krarti, 1994).
There has been a renewed interest in the theory, measurement, and design of DI systems in recent years. A group from Politecnico di Milano has described the microscopic heat-exchange effects in fibrous insulation and developed an apparatus for testing DI panels (Alongi and Mazzarella, 2015a,b). They used the apparatus to validate the heat exchange behavior in steady and periodic conditions compared to simple and detailed analytical models (Alongi et al., 2017a,b, 2020). A group from Huazhong University has developed a finite-difference model and an apparatus for DI testing (Wang et al., 2018; Zhang et al., 2019a,b). Their work shows how to eliminate envelope gains in the summer by forcing exhaust air out through the insulation. Numerous collaborators have developed DI control strategies and defined the potential energy savings for “switchable” U-values in various contexts (Park et al., 2015; Menyhart and Krarti, 2017; Shekar and Krarti, 2017; Rupp and Krarti, 2019; Dabbagh and Krarti, 2020; Dehwah and Krarti, 2020). Instead of using a porous material as a heat exchanger, they designed partitions that can be opened or closed to control convection inside a sealed panel.
1.4. Why Wood?
It has been shown how to introduce air channels into standard construction materials and optimize them for heat-exchange (Craig and Grinham, 2017). This new capability suggests a different way of building, better suited to the challenges of carbon removal. Instead of building a structure and cladding it with layers of specialized materials, it may be possible to combine all primary functions into one material. But which material? As discussed, materials like timber, concrete, bamboo, straw, and hemp have the potential to store carbon at a global scale (Hepburn et al., 2019; Churkina et al., 2020). Timber and concrete are the only two in widespread use in the construction industry today, but there are significant challenges to overcome in each case. For instance, biogenic materials must be sufficiently long-lived relative to their biomass growth in order to increase carbon storage in the building sector without damaging forest or stand carbon stocks (Guest et al., 2013; Pingoud et al., 2018). Forests take decades to regrow, while crops like bamboo, hemp, and straw may have rotation periods as short as 1 year. However, these faster-growing materials require more intensive production and additional materials to render them into a monolithic material suitable for the suggested method of heat exchange. Meanwhile, concrete requires significant tailoring of its curing and manufacturing processes to reduce its cradle-to-gate emissions but stores carbonates for decades or centuries while biogenic materials like timber are at risk of late-life release.
Obstacles notwithstanding, the supply-chains and product life-cycles for all engineering materials need a fundamental overhaul, and there is essential research to be done in both areas. The industry will likely need both biogenic carbon storage and decarbonization technologies in the concrete industry to have a chance of reversing the trend for increasing emissions in the coming decades. The focus of this study is timber as it is already in widespread use and its thermal properties make it ideally suited for the proposed method of heat-exchange. Figure 2 compares the steady heat-exchange of two panels, one wood, one concrete. Both are optimal, designed for the same relative rate of heat-exchange. However, the concrete panel is not feasible because the absolute heating requirements and thermal losses are too high. The reason is the thermal conductivity of concrete, which is 10-fold higher than wood (see Figure 6 in section 4). The low thermal conductivity of timber makes it unique compared to other structural materials. Not only can it store carbon and support a building, but it can also meet stringent standards for conduction losses without overventilating or overheating.
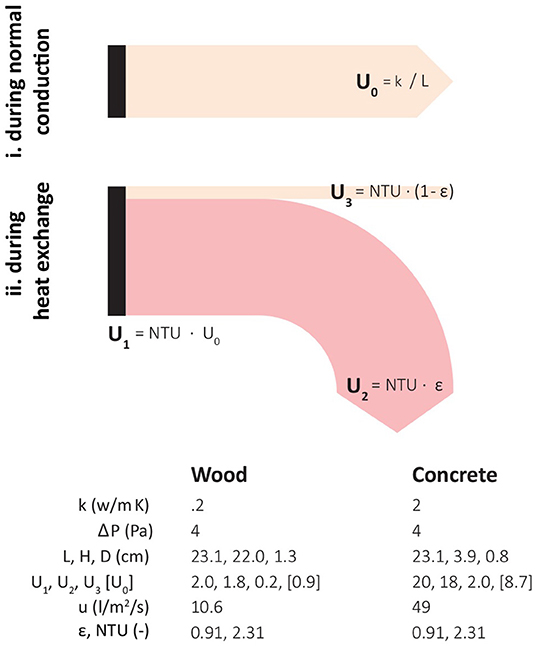
Figure 2. The heat-exchange principle shown in Figure 1, depicted as a sankey: U0 represents baseline heat loss, U1 total heat exchange, U2 ventilation heat gain, and U3 conduction heat loss. Wood has a lower thermal conductivity than concrete, so it is possible to reduce conduction losses (U3) without overventilating (U2) or overheating (U1), making it better suited to this application.
1.5. Boundary Conditions
One longstanding question in DI research with porous materials is what boundary conditions to assume in modeling. Field experiments have shown lower than predicted temperatures at the interior surface, with negative implications for thermal comfort and energy savings (Dalehaug et al., 1993).
How does the convection boundary film behave at the interior surface? This question is essential for DI research because porous materials must receive heat from the room before they can exchange it to the incoming air. Using Schlieren imaging, researchers found that porous materials lose thermal contact with the room air when the incoming air lifts the boundary film off the interior surface (Craig and Grinham, 2017). They found subtle effects at the exterior surface, too. Convection heat transfer was multiplied several-fold, and the heat in the boundary film was sucked back into the material. They concluded there was potential for heat recovery at the exterior surface, and that it was best to heat the interior surface by direct contact.
Following this recommendation, the test panels in the present study are directly heated at the interior surface. Not much heating is required. For instance, the wood panel example in Figure 2 only needs , which is in the range of standard underfloor heating. Electric resistance heating was used in the present study as this was practical given the available resources. A custom hydronic panel was fabricated to heat the test panels in the Schlieren study. Standard capillary tubing would also work for direct contact heating. For future applications, hydronic circuits are preferable. Heating or cooling technologies that use large exchange surfaces inside rooms are called radiant systems or thermally-active surfaces (TAS) (Moe, 2010; Rhee and Kim, 2015; Rhee et al., 2017). A large TAS, with a water-circuit connected to a “low-lift” heat pump, can make use of small temperature differences from renewable sinks and sources, such as solar, geothermal, and the infrared sky (Meggers et al., 2012; Lim, 2019).
1.6. Natural Ventilation
If hydronic surfaces are ideal for monomaterial heat-exchanging envelopes, are there other opportunities for integrating HVAC functions? Natural ventilation has an essential role in minimizing HVAC infrastructure and its lifecycle emissions (Kiamili et al., 2020). Significant advances have been made in understanding the fluid mechanics of buoyancy ventilation, which is driven by heat, not wind. For example, one breakthrough came in 2009, when researchers characterized an automatic heat recovery mechanism known as “natural mixing” (Woods et al., 2009). As warm air rises and exits, fresh air replaces it, falling through the same opening. The outgoing air preheats the incoming air in a state of dynamic equilibrium.
Some researchers have examined the possibility of coupling DI with natural ventilation (Etheridge and Zhang, 1998; Ascione et al., 2015; Park et al., 2016). The coupling can be enhanced by using monomaterial, heat-exchanging envelopes (i.e., “breathing walls”). By harnessing the buoyancy effect, all heat and air exchanges can be controlled by the integrated hydronic surface. Figure 3 shows two possibilities. On the left-hand side, buoyancy powers the ventilation but there is no heat recovery at the exhaust. The right-hand side shows a hypothesis for how to recover ventilation at the exhaust using a double shell. This article does not examine natural heat-recovery loops. However, it makes a first step by showing it is feasible to couple breathing walls with buoyancy ventilation in idealized circumstances.
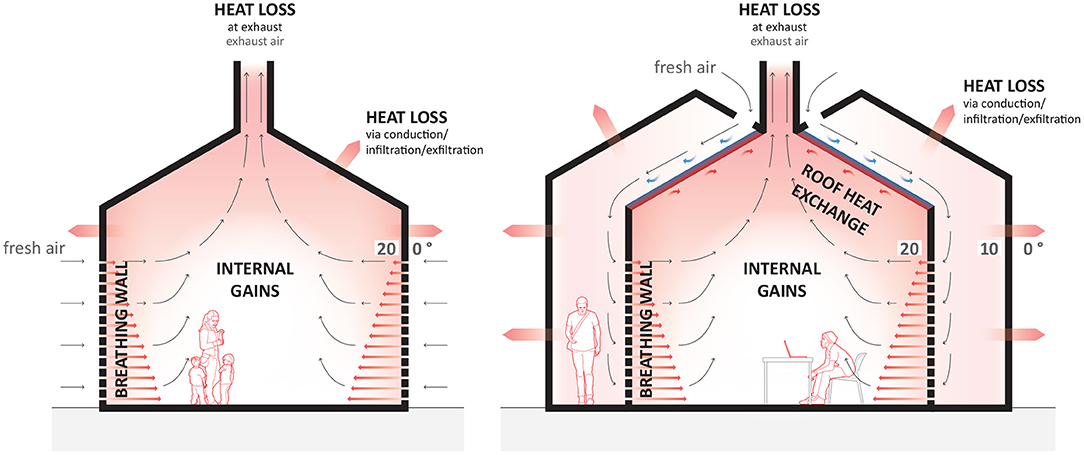
Figure 3. Speculative schemes suggesting how to couple “breathing walls” with buoyancy ventilation. (Left) Buoyancy powers the ventilation but there is no heat recovery at the exhaust. (Right) Hypothesis for how to recover ventilation at the exhaust using a double shell.
1.7. Outlook
This paper reports the results of three experiments, which characterize the behavior of mass timber panels that are optimized as heat-exchangers. An app is provided so readers can evaluate possible designs for themselves (Craig and Fortin, 2020). The first experiment measures the steady state behavior of a panel subjected to a step change in heating. The second experiment measures changes in heat-exchange due to changing temperature. The final experiment shows it is possible to suck ventilation through the panels using thermal buoyancy instead of a fan, while maintaining the expected rates of heat-exchange.
2. Theory
2.1. Steady Heat-Exchange
Figure 1 illustrates the principle of how to optimize parallel channels in a solid material for “contra-flux” heat-exchange. Two numerical correlations were developed for this scenario (Kim et al., 2007). Both correlations have been experimentally validated (Craig and Grinham, 2017). The first correlation gives the optimum spacing of the channels:
where Hopt is the optimized channel spacing, L is the panel thickness, k is the thermal conductivity of the panel material, and ka is the thermal conductivity of the air. The Bejan number, Be, is defined as:
where ΔP is the design pressure, μ is the dynamic viscosity of the air, and α is the thermal diffusivity of the air. The void fraction of the panel, Φ, is defined as:
where D is the diameter of the channels. The geometry is defined in Figure 4.
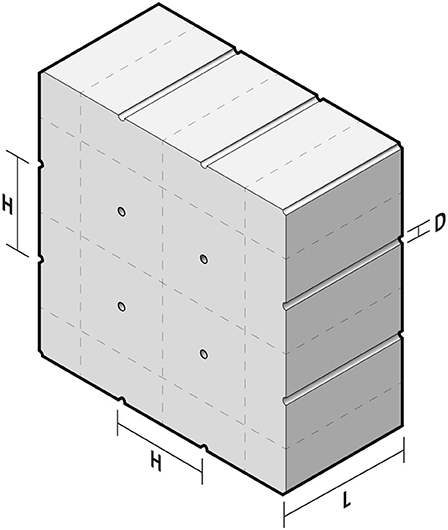
Figure 4. Panel geometry definition.
The second correlation predicts the total (normalized) heat transfer through the optimal design:
The Number of Thermal Units, NTU, is the ratio of the total heat transfer coefficient during heat-exchange, U1, to the baseline condition when there is no heat-exchange, U0:
where is the heat flux at the heated interior surface, Ts is the temperature of the heated interior surface, and Te is the temperature of the exterior air (which enters through the channels). During sensible, steady heat-exchange, the surface heat flux transfers in part to the incoming air while the remainder is lost to the exterior environment by conduction:
Figure 2 illustrates this heat-exchange balance, which can also be defined in terms of coefficients of heat transfer:
where:
and ε is the heat-exchange efficiency:
These definitions of ε and NTU are valid so long as the surface heat flux or the surface temperature (Ts) are constant and uniform. Integrated hydronics can closely approximate both boundary conditions (Craig and Grinham, 2017). In either condition, ε is equivalent to the relative temperature increase experienced by the incoming air:
where Ti is the temperature of the incoming air at the moment it leaves the channels and enters the interior space. Note that as ε → 1, Ti → Ts.
Following the convention in the dynamic insulation literature, U3 in Equation (10) can be referred to as the “dynamic U-value.” However, it is important to emphasize the balance expressed in Equation (7) and illustrated in Figure 2. That is, achieving low values for U3 should not come at the expense of over-ventilating (U2) or overheating (U1). The air flow rate per unit area of panel is defined as:
and has units of m/s or m3/m2/s. Finally, there is an important sizing limit to take note of:
Equations (1) and (4) are invalid if this limit is exceeded. The panel is too thin relative to the channel spacing. Physically, there is not enough space for the heat to bend toward the channels, as illustrated on the right-hand side of Figure 1 (heat only conducts to lower temperatures so ‘bending’ the flux more than 90° would contravene the second law of thermodynamics).
The equations above describe the steady heat-exchange in optimized panels. What are the design implications for mass timber? Figure 5 shows a screenshot of an app that is free to download and which solves the above equations to help evaluate options for optimizing mass timber panels as heat-exchangers (Craig and Fortin, 2020). The app has four control parameters. Designers can choose values for each parameter from a specified range (it is straightforward to adjust these ranges by changing the source code):
• The thermal conductivity k (W/m·K) of the base material. The range 0.1 < k < 0.4 was chosen to encompass most softwood and hardwood species, irrespective of grain orientation (see Figure 6).
• The conduction heat loss coefficient, i.e., the “dynamic U-value.” This wide range was selected so that researchers can evaluate different designs, choosing between U-value standards in different countries or high-performance standards, such as Passivhaus.
• The surface heating coefficient (which can be controlled by integrated hydronic heating). The range 1 < U1 < 4 is deliberately low, similar to standard underfloor heating. (Recall that it is pointless having low conduction losses if achieving this target requires too much heat input)
• The design pressure, △P (Pa) which is imposed on the panel by suction. The range 2 < △P < 8 was chosen because these pressures are feasible to sustain mechanically using a fan or naturally using thermal buoyancy (the stack effect).
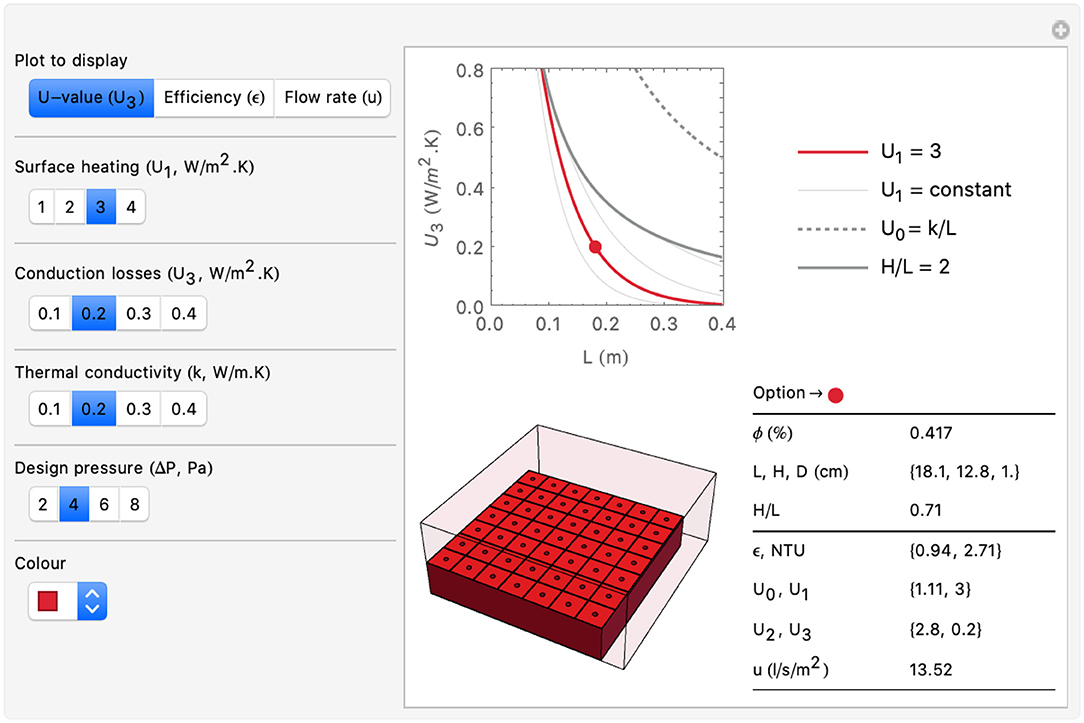
Figure 5. A screenshot of an app, written to partner this article, and free to download here (Craig and Fortin, 2020). It solves Equations (1)–(14), showing how to optimize mass timber panels as heat-exchangers.
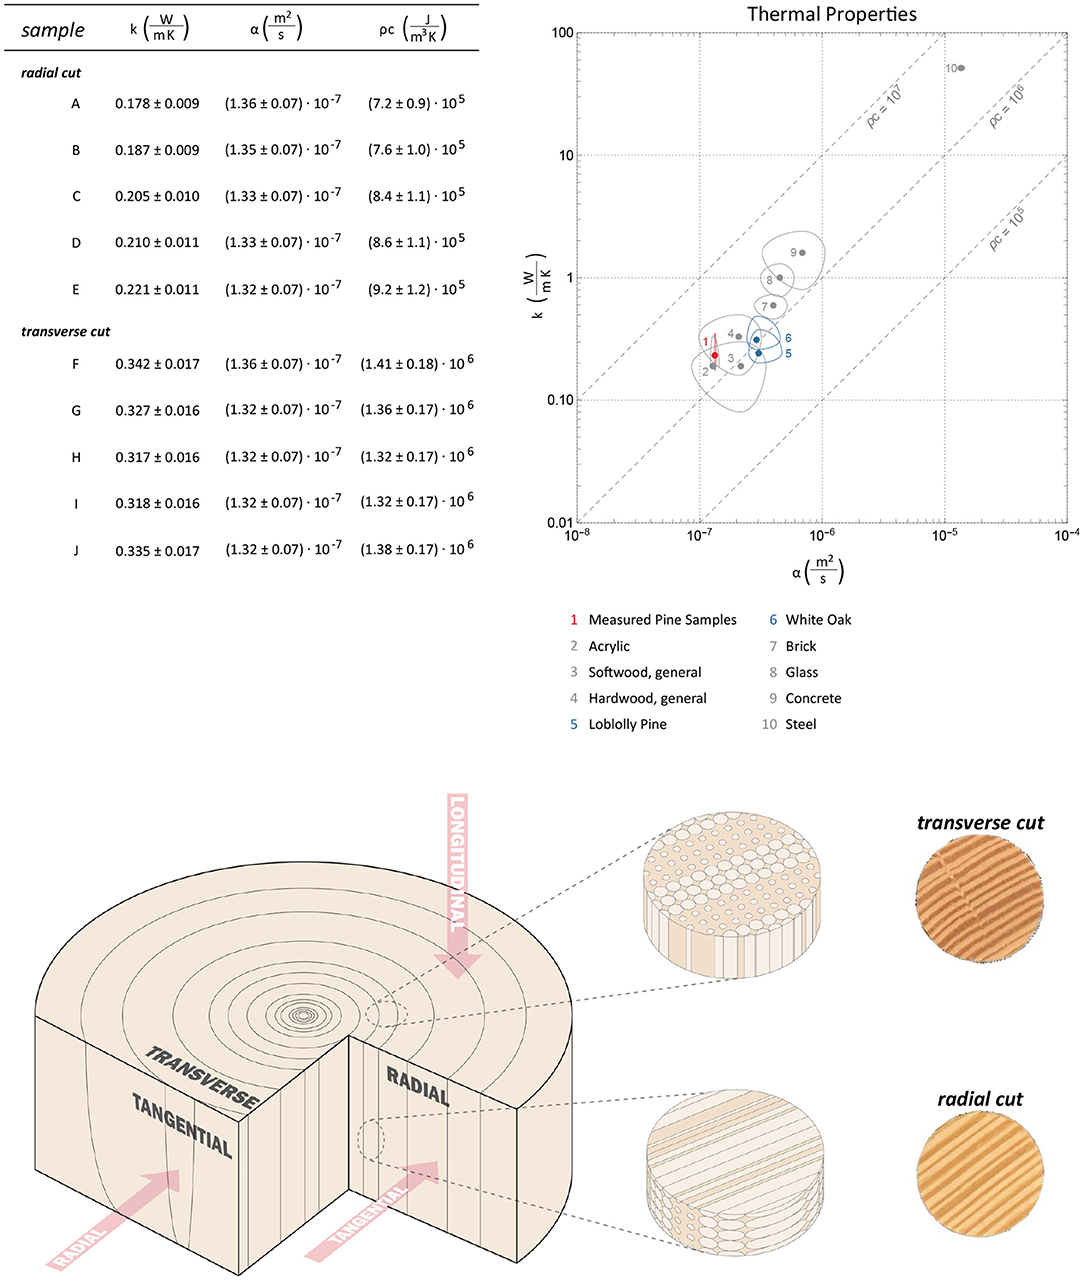
Figure 6. Thermal property measurements for Southern Yellow Pine: conductivity (k), diffusivity (α), and volumetric heat capacity (ρc). Measurements were taken from radial and transverse samples. The data are plotted alongside other wood materials and construction materials for reference. The pine samples of pine were tested in room conditions (T = 23 C and 49% RH).
Table 1 compares three potential designs for heat-exchanging mass timber panels, computed using the app. All three hypothetical cases achieve the same low “dynamic U-value,” , which is in range of U-values mandated by stringent energy efficiency codes. The differences between the design options stem from the surface heating, which varies by small increments . The panels get thinner as the surface heating increases (L ≈ 23, 18, 15 cm). Note that these thicknesses are in the range of standard thicknesses for CLT panels. The other change is to the air-flow rate per unit panel area, which increases (u ≈ 10, 14, 16 l/s/m2) as the panels get thinner. These rates mean that approximately one square meter of panel meets the ventilation needs of one person. For context, international standards recommend a ventilation rates ~10 l/s per person in an office environment, though adverse effects to health or productivity have been documented when the rate is as high as 25 l/s per person (Carrer et al., 2015).
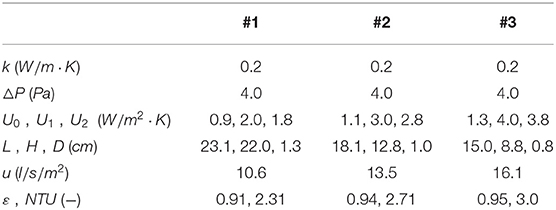
Table 1. Three example options for timber heat-exchange panels, each optimized for .
The provided app shows that relatively high ventilation rates (5 < u < 20 l/s/m2) are needed to deliver heat-exchange efficiencies (ε > 0.6) resulting in low heat-loss coefficients . The final air flow rate depends on the heating/cooling flux applied at the interior surface, the thermal conductivity and the design pressure. For instance, a panel with lower conductivity requires less ventilation to achieve the necessary rates of heat-exchange.
Since the panels require relatively high ventilation rates, they are best suited to relatively large buildings with high occupancy. Consider a cube building of square length x = 12 m. It is terraced so only two façades are exposed. The ventilation rate per unit area of panel is u = 0.01 m3/s/m2 (i.e., 10 l/s/m2). The number of air changes per hour are N = 3, 600 · u · 2x2/x3 = 7200 u/x. If the panels occupy 100% of the façade area, N = 6. If the panels occupy 50% of the façade area, N = 3, and so on.
2.2. Transient Heat-Exchange
The performance of timber panels in steady heat-exchange is promising, but how long do they take to reach steady-state, and how does the diurnal variation in exterior temperature influence the heat-exchange?
The 1994 model describing the transient behavior of dynamic insulation was recently validated in controlled, periodic conditions (Krarti, 1994; Alongi et al., 2020). However, this model is for heat exchange in one spatial dimension. It is suitable for fibrous or open-pore insulation materials in contra-flux but does not apply to materials where the conduction flux varies in two or three spatial dimensions, as illustrated in Figure 1. The basis for the “breathing wall” principle shown in Figure 1 is a study which showed how to optimize parallel channels for steady heat exchange in extreme thermal conditions (Kim et al., 2007). Those researchers extended their work by optimizing tree-shaped channels in steady-state then by characterizing the transient response to sudden heating (Kim et al., 2008, 2009). However, their transient analysis only applies to tree-shaped channels.
2.2.1. Time to Steady-State
It seems there is no model available in the literature to describe transient contra-flux heat-exchange in a panel with parallel channels. The thermal response can instead be approximated as a function of the Fourier number:
where α is the thermal diffusivity of the material, t is the time in seconds, and Lc is the characteristic length, defined as the ratio of the solid's volume to exposed surface area which, for the geometry defined in Figure 4, is:
The Fourier number is a measure of time without units. It is a ratio where 1 signifies that heat has penetrated the entire depth of the object. The thermal response of a “breathing wall” to a step-change in surface temperature or surface heat-flux can now be characterized as:
where NTU is the steady-state design value defined by Equation (4) and a1 and a2 are empirical coefficients. Recall that the 3D evolution of the heat-flux through the material is unknown. Hence, both coefficients act as correction factors for shape effects. In a plot of NTU(t) vs. Fo, a1 controls the position of the curve (and hence the magnitude of heat transfer) while a2 controls the curvature. For calibration, standard analytical solutions provide a useful benchmark (Bart and Hanjalić, 2003; Incropera et al., 2007). A plane wall is a solid wall subjected to heating at both surfaces. When the surface heating is with a constant heat flux:
And when the surface heating is with a constant temperature:
where a1 = 0 for both conditions. In summary, we hypothesize that, when subjected to a step-change in surface heating, the total heat transfer through a “breathing wall” will evolve in a similar manner to a plane wall of the same characteristic length, with slight differences due to shape effects.
2.2.2. Periodic Heat-Exchange
What about when the exterior temperature varies periodically in a daily cycle? When a constant surface temperature or surface heat flux is applied, and after sufficient time has passed to yield a quasi steady-state, the total (normalized) heat transfer should fluctuate periodically around a steady-state mean. The behavior should approximate a semi-infinite solid, but, again, with differences due to shape effects (Bart and Hanjalić, 2003; Incropera et al., 2007):
where ω is the angular frequency (2π/86400). Here, the coefficient a1 calibrates for the magnitude of the fluctuations. We hypothesize that the value for a1 will be the same in both Equations (17) and (20).
2.3. Heat-Exchange With Buoyancy Ventilation
Consider the building on the left-hand side of Figure 3, operating in steady-state and without occupants. Only the integrated TAS (Thermally Active Surface) heats the room. There are no other sensible heat gains or latent heat transfer effects. Some of the heat from the TAS transfers to the room while the rest is lost to the environment by conduction:
where q0 is the total heating from (both sides of) the TAS, qhx is the total heat-exchange to the room, and qcl is the total conduction loss through the envelope. The heat-exchange from the TAS to the room (qhx) happens in two ways. First, by transfer to the incoming air, via the heat-exchanging panel. Second, by direct contact with the room air, via the exposed surface:
The new terms, A1, h, and Tii are the total area of the integrated TAS, the average heat transfer coefficient between the heated surface and the room air, and the temperature of the interior air, respectively. For simplicity, assume the radiant exchanges inside the room are negligible and the interior air is well-mixed.
The conduction losses (qcl) also happen in two ways. First, through the back of the heat-exchanging panels, and second, through the parts of the building envelope that are not engaged in heat-exchange:
The term UA is the total conductance (W/K) of the building envelope that is not engaged in heat-exchange. The heat contained in the ventilation stream can now be defined as:
where ρcp is the volumetric heat capacity of air and Q is the ventilation rate powered by indoor/outdoor temperature difference:
where g is the gravity of Earth, Z is the change in height between the flow inlet and outlet (e.g., the mid-point of the heat-exchanging panel to the top of the chimney), and A* is the combined effective vent area (Acred, 2014)
which arises from the definition of bulk velocity:
where A1 and A2 are the physical areas of the inlet and outlet and c1 and c2 are the associated discharge coefficients, respectively. For the heat-exchanging panels, A1 is the total surface area, while the discharge coefficient is:
Rearranging Equation (13), the pressure drop across the heat-exchanger can be defined as:
For simplicity, assume the pressure difference along the height of the panel is uniform. Figure 3 depicts a more realistic variation in pressure due to buoyancy. Substituting Equation (29) into Equation (28) gives:
Finally, the discharge coefficient for the outlet, assuming it is sharp-edged, can be approximated as (Acred, 2014)
The proceeding equations describe the essential features of the thermal coupling between “breathing walls” and buoyancy ventilation. Looking ahead, section 4.3 reports on the results of an experimental apparatus designed to demonstrate this coupling in action. The heat-exchanging panel is installed horizontally at floor level so the pressure along the surface of the panel is uniform and the interior air is well-mixed. It should be emphasized that these are idealized circumstances. Horizontal installations are possible, but vertical or inclined envelopes are more likely in future applications. If the panel is vertical, the pressure across it would vary with height, as would the velocity and heat-exchange. The internal air may stratify below the top of the panel, depending on the height of the chimney relative to the top of the panel. In which case, there would be outflow through the upper channels. All these effects were purposely designed out of the experiment reported in 4.3, in order to validate the essential elements of the thermal coupling.
The apparatus is the height of a room (to generate reasonable stack pressure) and is proportioned like a slender chimney. Therefore, instead of flow contraction at the outlet, there are frictional losses at the side walls to compute. After converting friction factors to discharge coefficients (Jones et al., 2016), if the flow is laminar, then:
and if the flow is turbulent, then:
where the Reynolds number of flow is:
3. Materials and Methods
Experiments were designed and executed to test the heat-exchange performance in steady and transient conditions, and when the ventilation is powered by buoyancy instead of a fan. The first experiment measures the heat-exchange in steady-state and the time to reach steady-state when panels are subjected to a step-change in heating. The second experiment measures how the heat-exchange varies periodically with daily changes in the exterior temperature. The final experiment measures the interior temperature and flow rate inside a proxy building when the ventilation through the test panel is powered by thermal buoyancy instead of a fan.
3.1. Test Panels
Two test panels were fabricated, one from solid wood, the other from acrylic. Southern Yellow Pine was chosen for the wood panel. Acrylic was chosen as a control, because it has similar thermal properties to wood, except the thermal properties are isotropic instead of anisotropic and it does not absorb moisture. The panels measured 12″ × 16″ (30.48 × 40.64 cm) with a heat-exchange area of 12″ × 12″ (30.48 × 30.48 cm) and a thickness of 2″ (5.08 cm). Both panels were optimized for a design-pressure of 3 Pa. Table 2 summarizes the properties of each panel, and they are shown side-by-side in Figure 7.
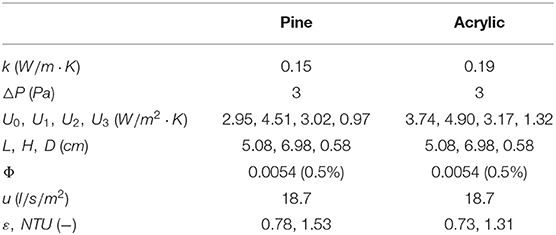
Table 2. Test panel design parameters.
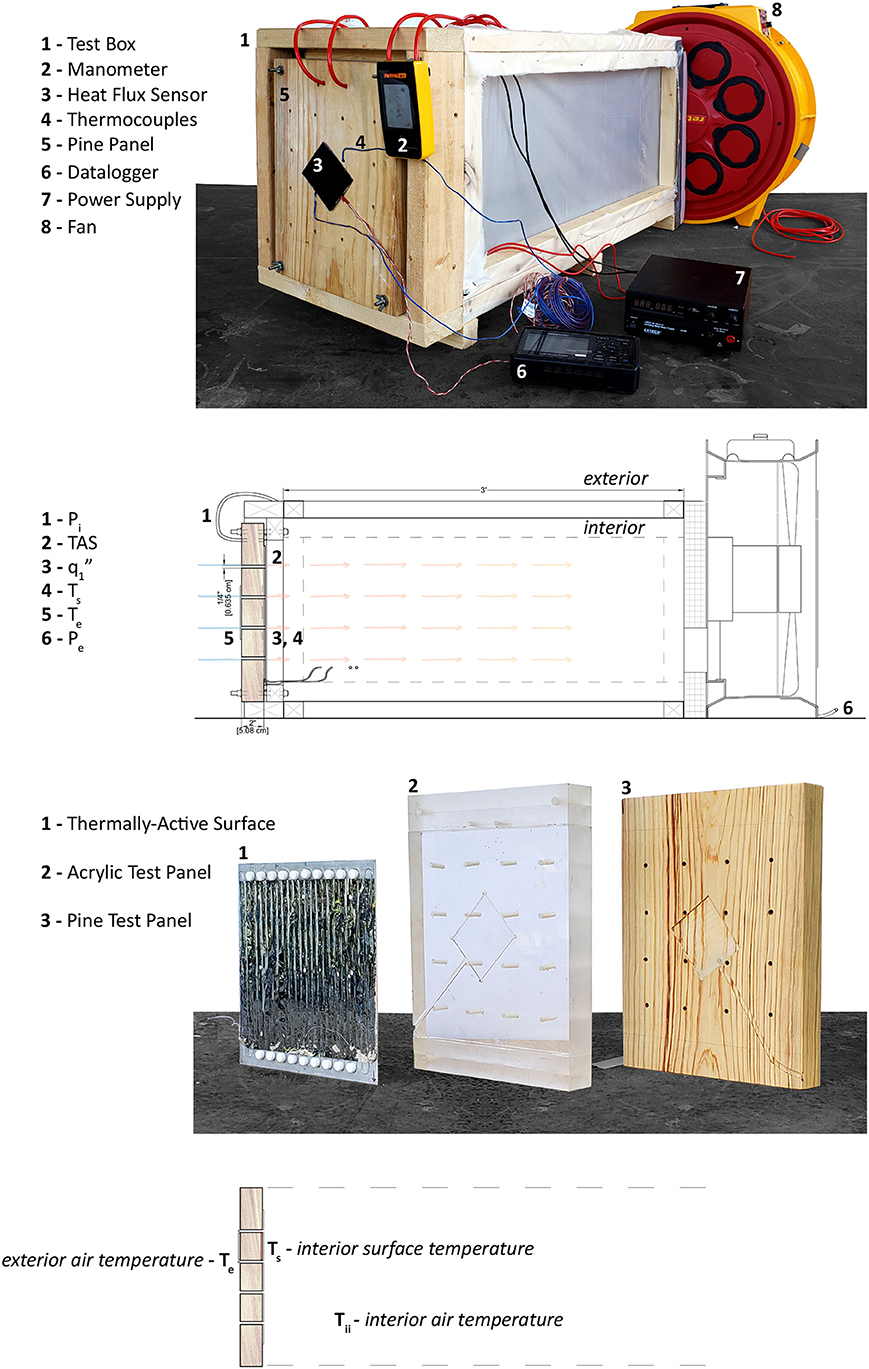
Figure 7. Experimental set-up for fan driven ventilation. This apparatus was used for the first and second experiments (see section 3.2), measuring (1) the steady-state behavior of a panel subjected to a step change in heating and (2) periodic variations in heat-exchange due to changing exterior temperature.
3.1.1. Thermal Properties
The material properties needed to predict steady and transient conduction are thermal conductivity k (W/m K), thermal diffusivity α (m2/s), and volumetric heat capacity ρc (J/m3·K). For wood, these properties depend on the species, the direction and location of measurement, and the ambient conditions. A measurement device (C-Therm Thermal Conductivity Analyzer) and the Transient Plane Source Method (ASTM D7984) were used to measure the thermal properties of Southern Yellow Pine. The samples were prepared from the same batch as the test panel and cut in radial and transverse directions to the grain. Five samples of each grain direction were prepared, each was tested ten times. The results are shown in Figure 6 in comparison with other wood species and building materials.
3.1.2. Sensors
FluxTeq Ultra 09 (85 × 95 mm) sensors were used to measure the heat-flux and temperature on both surfaces of the test panels. The “interior” heat flux sensor was placed in a routed indent so the TAS (see section 3.1.3) would fit flush to the surface. The size of the heat flux sensors determined the spacing of the channels in the panels. Air temperatures were measured using Omega Type T thermocouples. Temperature Te was measured by positioning the tip of two thermocouples over the center of two channels, then taking the average. This measurement was closely comparable to the temperature monitored outside the test box. Measurements were recorded using a GL240 data logger. The small channel made it impossible to measure Ti with the thermocouples. When positioned over the channel, the TAS influenced the thermocouple, and inserting the thermocouple into the channel blocked the flow.
3.1.3. Thermally-Active Surface
The surface heater, referred to here as the Thermally-Active Surface (TAS), was made using electrical resistance heating wires. An array of 26 Ga Nichrome 60 was mounted to a 0.063″ thick aluminum sheet drilled with holes to match the channels in the test panel. The wire array was wound around 1/4″ tall sections of 1/2″ PTFE rod. The rods were adhered to the aluminum plate at 1″ centers to create the 1/2″ wire spacing. The wire was electrically isolated from the aluminum by a sheet of adhesive-backed polyester film. An aluminum-coated polyester film was mounted on the wire array using a spray adhesive. The TAS was divided into two parallel circuits and was connected to an Extech 600 W adjustable power supply.
3.2. Fan-Driven Apparatus
This apparatus allowed air to be sucked through the test panel at constant pressure. The test chamber was made from wooden frames assembled with thin, transparent plastic sheet stretched over them (see Figure 7). Thin sheets were used so the chamber was airtight but did not accumulate heat. The joints of the chamber were sealed with caulk and a layer of tape. Attached to one end of the box was a wooden frame with a continuous gasket ring that was compressed against the edge of the test panel. Threaded rods, one at each corner, ran through the panel. Rubber washers and nuts were used to tighten the panel to the frame and compress the gasket. Mounted on the other end of the box was a piece of 2″ rigid insulation panel with a hole to accept the RetroTec 5000 series Calibrated Fan. The fan reduces pressure inside the box, simulating the interior of the building. The pressure difference was controlled and monitored by a RetroTec DM32 flow gauge and a pitot tube array. The TAS was applied to the surface of the panel facing the interior of the chamber and was controlled by an Extech 600W adjustable power supply.
3.2.1. Steady Heat-Exchange, Time to Steady-State
Tests were run at the design pressure (3 Pa) and increasing increments of pressure (5, 7, 9 Pa). Steady-state was defined as the point when the heat flux reached ±5% of the target heat flux. A round of three tests was run for each pressure using the design heat flux (i.e., the heat flux optimized for 3 Pa). Then another round of three tests were run for each pressure, this time increasing the heat flux incrementally as if the panel were optimized for that pressure. The difference between both methods was negligible and the results for all rounds were combined to calculate the standard error.
3.2.2. Periodic Heat-Exchange
This experiment used the same apparatus as the steady-state experiment. The test took place outdoors in a shaded location. A constant pressure (△P = 3 Pa) was maintained throughout the experiment, which ran for 5 days. Constant electrical power to the TAS was also maintained, so that the average heat flux was within ±5% of the design heat flux.
3.3. Buoyancy-Driven Apparatus
A separate chamber, acting as a proxy building, was fabricated to test the coupling with buoyancy ventilation. The heat-exchanging panel was installed horizontally at floor level to ensure the pressure across the surface of the TAS was uniform and the interior air was well-mixed (as discussed in section 2.3, if the panel was vertical, the pressure across it would vary with height, as would the velocity and heat-exchange, and there would be risk of back-flow if the internal air stratified; these effects will be investigated in future studies). The apparatus was 8′ tall (2.44 m), the height of a room, to generate reasonable stack pressure. The chamber was slender with a taper, like chimney, to avoid exchange flows at the top. The chamber was encased by batt and rigid insulation (see Figure 8). The test panel was mounted at the bottom of the chamber with the TAS facing the interior. A layer of tape was placed over the joint between the chamber and panel to create an airtight seal. The top opening of the chamber was 2″ by 2″ (5 × 5 cm). The entire assembly was mounted on legs that held the bottom of the chamber 2′ (60 cm) off the ground. Thermocouples were located at the same positions over the channels as the fan-driven experiment, and at even intervals up the interior of the chimney. Sensirion SDP800 differential pressure sensors were attached to a pitot tube assembly to measure air velocity at the exhaust. Tests were run by incrementally increasing the heating power of the TAS. Before measurements were taken, the panel was allowed to achieve steady-state (defined in this study as when the heat-flux reaches ±5% of the design heat flux).
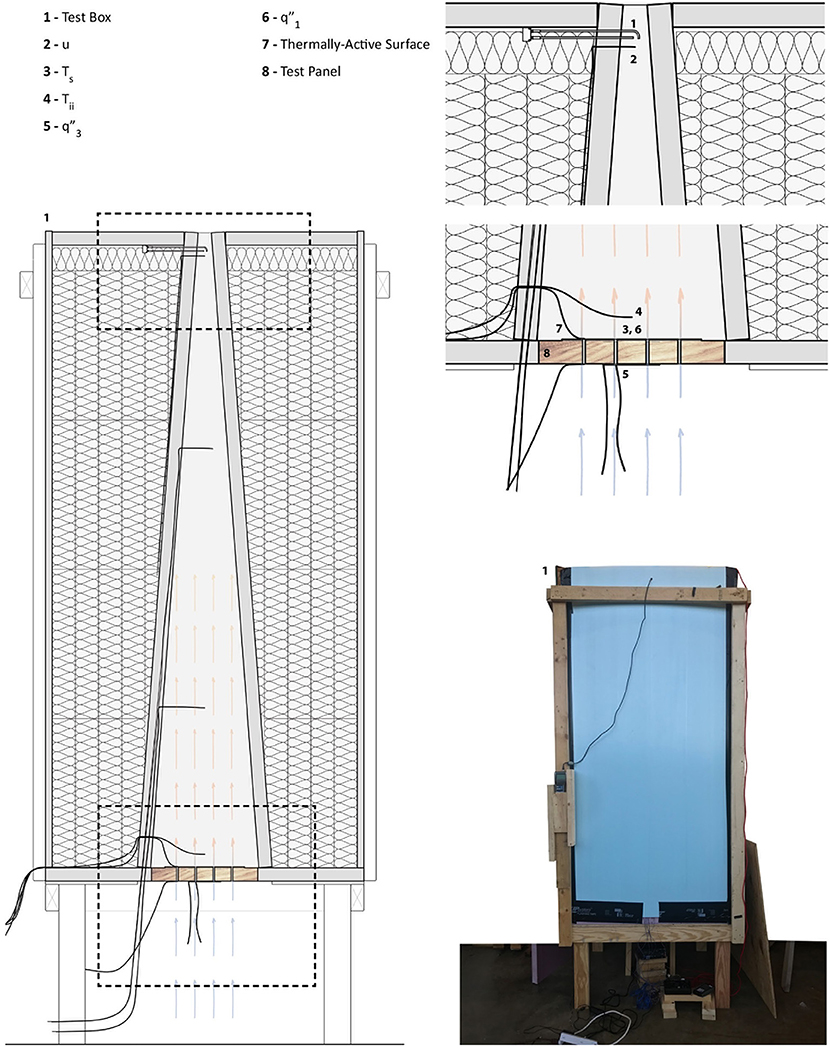
Figure 8. Experimental set-up for buoyancy-driven ventilation. This apparatus was used in the third experiment (see section 3.3), measuring the interior temperature and flow rate in a proxy building when ventilation through the test panel is powered by thermal buoyancy instead of a fan.
4. Results and Discussion
4.1. Steady Heat-Exchange
Figure 9 shows the total normalized heat transfer results for both panels. The black dotted lines represent Equation (4), while the shaded markers show measurements at the design pressure, namely 3 Pa. From left to right, the non-shaded markers show measurements at non-design pressures, namely 5, 7, and 9 Pa. Tables 3, 4 summarize the results in terms of U1, NTU, and ε.
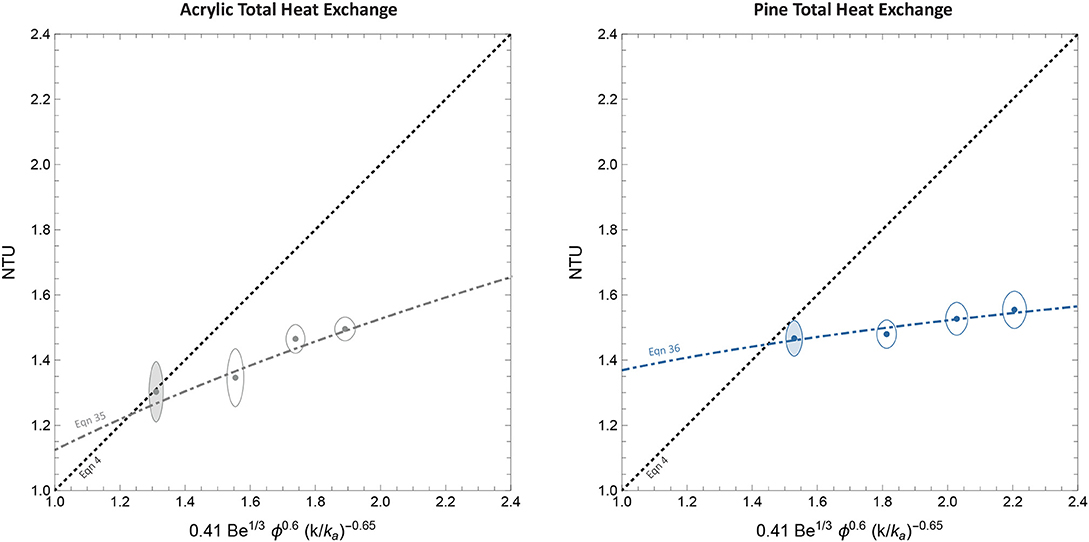
Figure 9. Measurements for steady heat-exchange for acrylic (left) and pine (right). Data is plotted against predicted heat-exchange from Equation (4) at design (filled) and non-design pressures (open). The secondary dashed lines show new correlations (Equations 35, 36) for heat-exchange for the full range of pressures.
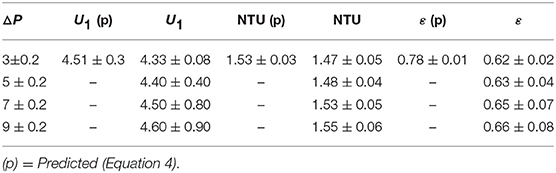
Table 3. Measurements for steady heat-exchange, pine panel.
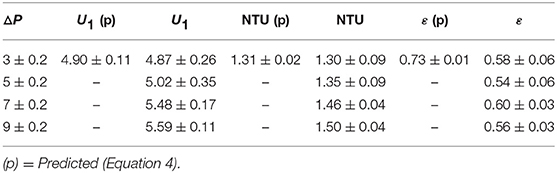
Table 4. Measurements for steady heat-exchange, acrylic panel.
Note that the “design pressure” is the pressure that a given panel is optimized for. Equation (1) shows how to optimize the geometry of the panel at the design pressure. Equation (4) predicts the total (normalized) heat transfer of the optimized panel at the design pressure. It can be used to predict the performance when the specifications (e.g., thermal conductivity, panel thickness) are flexibly changed, after specifying the design pressure, as shown in the provided app (Craig and Fortin, 2020).
Table 3 shows that the normalized heat transfer at the design pressure was NTU = 1.47 ± 0.05 for the wood test panel, compared to the predicted value of NTU = 1.53 ± 0.03. For the “control” test panel, the agreement was even closer (see Table 4). The close fit between predictions and measurements at the design pressure extend the findings of recent experimental validation (Craig and Grinham, 2017) and underline the robust nature of the original correlations. These correlations were developed for extreme thermal conditions (Kim et al., 2007), so it is remarkable they transfer to building materials in ambient conditions so accurately. The anisotropy of the wood grain did not influence the results significantly at the design pressure, only causing a slight reduction in total heat transfer. Further investigation is needed to understand if there is a way of exploiting the wood grain to enhance the heat-exchange efficiency.
Equation (4) only predicts the heat transfer at the design pressure. Therefore, it is no surprise that measurements at 5, 7, and 9 Pa deviate from Equation (4). The performance for the entire range of pressures correlated as follows for the acrylic panel:
and as follows for the pine panel:
Where NTU is the total heat transfer at the design pressure, defined by Equation (4). The correlating coefficients and exponents in Equations (35) and (36) were found automatically using the LinearModelFit function in Mathematica. The coefficient of determination (R2) was >0.999 for both linear fit models. In the experiments that follow, Equation (36) is used to predict the steady heat transfer of the test panel at non-design pressures (the pressures for which the panel was not optimized for).
Equations (35) and (36) both have different slopes (exponents). It seems, therefore, that anisotropy does play a role at limiting total heat transfer at non-design pressures. A gentle slope for NTU, as seen in Equation (36), implies a two-state U-value. That is, a U-value that does not vary much with pressure, but which toggles between designed values of U0 and U3.
The total heat transfer (U1, , NTU) behaves as expected. However, Tables 3, 4 show a mismatch between predictions and measurements for ε. What is the explanation? It helps to review the methods for measuring the heat-exchange efficiency, of which there are four. The first method is to measure it indirectly, having measured the NTU:
This method makes an assumption for how the heat-exchange efficiency behaves, based on standard heat-exchanger theory. The second method measures the ratio of outgoing conduction to total heat transfer:
This is a direct measurement and was used in the present study. To corroborate this measurement, it is necessary to track the heat-exchange to the ventilation stream, which can be measured directly in two ways. Either:
Or:
Both methods require an accurate measurement of Ti, since . However, it was not possible to measure Ti with the current apparatus. The small diameter of the channels meant the thermocouple either blocked the channel or was influenced by the TAS (see section 3.1.2). Hence, while this experiment validates the total heat transfer, further investigation is needed to understand what portion of heat is transferred to the incoming ventilation. Contrary to common sense, heat emanating from the exterior surface may not be entirely lost to the environment. Optical Schlieren imaging has shown that, during suction, convection multiplies at the exterior surface, while the boundary film is drawn into the channels (Craig and Grinham, 2017). Hence, higher than expected values for and U3 may be a sign of heat-recovery in action rather than increased losses. In further studies, a technique, such as Background Oriented Schlieren could be used to measure Ti, so the measurements for the heat-exchange efficiency can be triangulated, and the influence of exterior film heat-recovery can be determined.
4.2. Transient Heat-Exchange
4.2.1. Time to Steady-State
Figure 10 shows how the heat-exchange evolves with a step-change in surface heating. The data are from the pine panel, averaged over three tests at the design pressure (3Pa). The electrical power heating the surface was constant throughout the experiment. The left graph shows the total heat transfer (NTU (t)), the right graph shows the heat-exchange efficiency (ε). Both graphs track change in terms of the Fourier number, defined by Equation (15), a relative index of how conduction evolves inside an object over time. The characteristic length of the panel was Lc = 0.021, calculated using Equation (16). The experiments ran for just over 240 min. Hence, Fo = 1 marks ~1 h. It also marks a significant threshold: the time at which heat supposedly penetrates the full depth of an object.
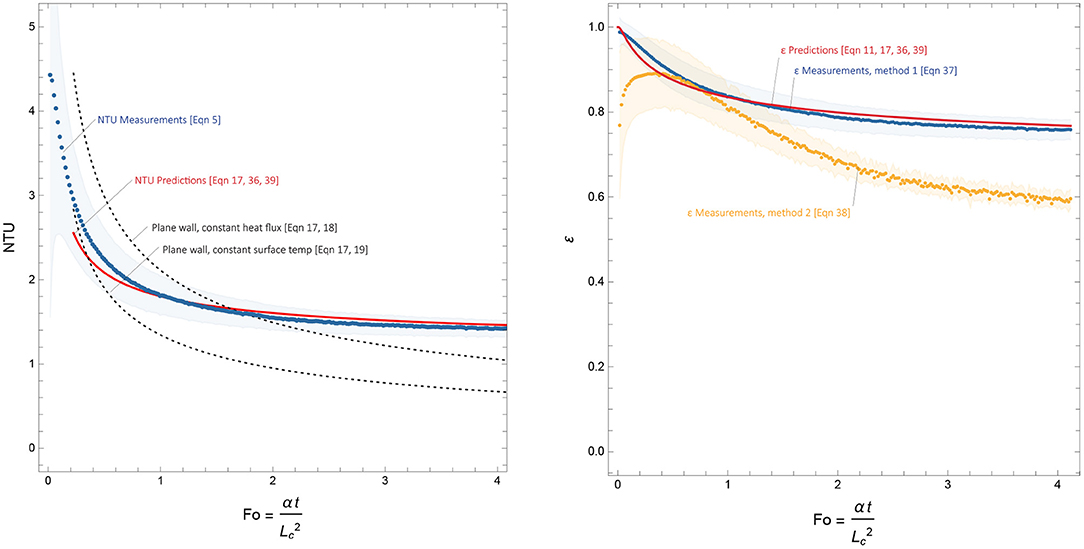
Figure 10. Pine test panel, time to reach steady heat-exchange plotted as a function of the Fourier number. Fo = 1 is ~1 h. Measurements for total heat-exchange (NTU) and heat-exchange effectiveness (ε) are compared to benchmark predictions for a plane wall (Equations 17–19).
At the surface of the test panel, the heat flux reached ±5% of the predicted rate after ~110 min, when Fo ~1.8. (After this point, the data were used to measure the steady heat-exchange, see section 4.1). Fo ~1.8 marks another significant moment, when the data veer outside the benchmarks, indicated by the black dotted lines. These benchmarks are the heat transfer through a plane wall of the same characteristic length during a step-change in heating, with constant temperature or constant heat flux applied at both surfaces (see Equations 17–19). As predicted, before steady-state is reached, the heat transfer evolves similar to a plane wall of the same characteristic length, with slight differences due to shape effects. The data for NTU (t) correlate well with Equation (17) when:
and:
when Equation (36) replaces Equation (4). Recall that a1 controls the position of the curve described by Equation (17) while a2 controls the curvature. Further investigation is needed to establish the extent to which these shape factors for transient conduction vary with different panel dimensions, if at all. Physical experiments or finite element analysis are both valid ways of approaching this question.
The right-hand graph shows how the heat-exchange efficiency changes with time, according to two methods of measuring it. As discussed, a question remains regarding the actual heat-exchange efficiency, and the additional measurements needed to confirm it. The deviating curve on the right-hand graph of Figure 10 may reflect enhanced heat transfer at the exterior surface due to suction. Furthermore, heat recovery at the exterior surface, due to the boundary film being sucked into the channels, may compensate the deviation between the two curves. In short, though U3 and are larger than expected, a significant proportion of this heat is likely recovered and not lost to the exterior environment.
4.2.2. Periodic Heat-Exchange
The pine panel was tested in shaded, outdoor conditions, using the same fan-powered apparatus as the previous experiments. Constant pressure (3Pa) and constant electrical power for heating were applied over the course of 3 days. The purpose of the experiment was to see if the total (normalized) heat transfer would vary periodically around the steady-state value, as predicted by Equation (20). Figure 11 shows the results. Plot (a) shows the variation of temperatures (Te, Ts, Ts − Te) over time while plot (b) shows the variation of heat-transfer coefficients (U1, U3). Note that the baseline U-value is U0 = k/L = 2.95 (see Table 2).
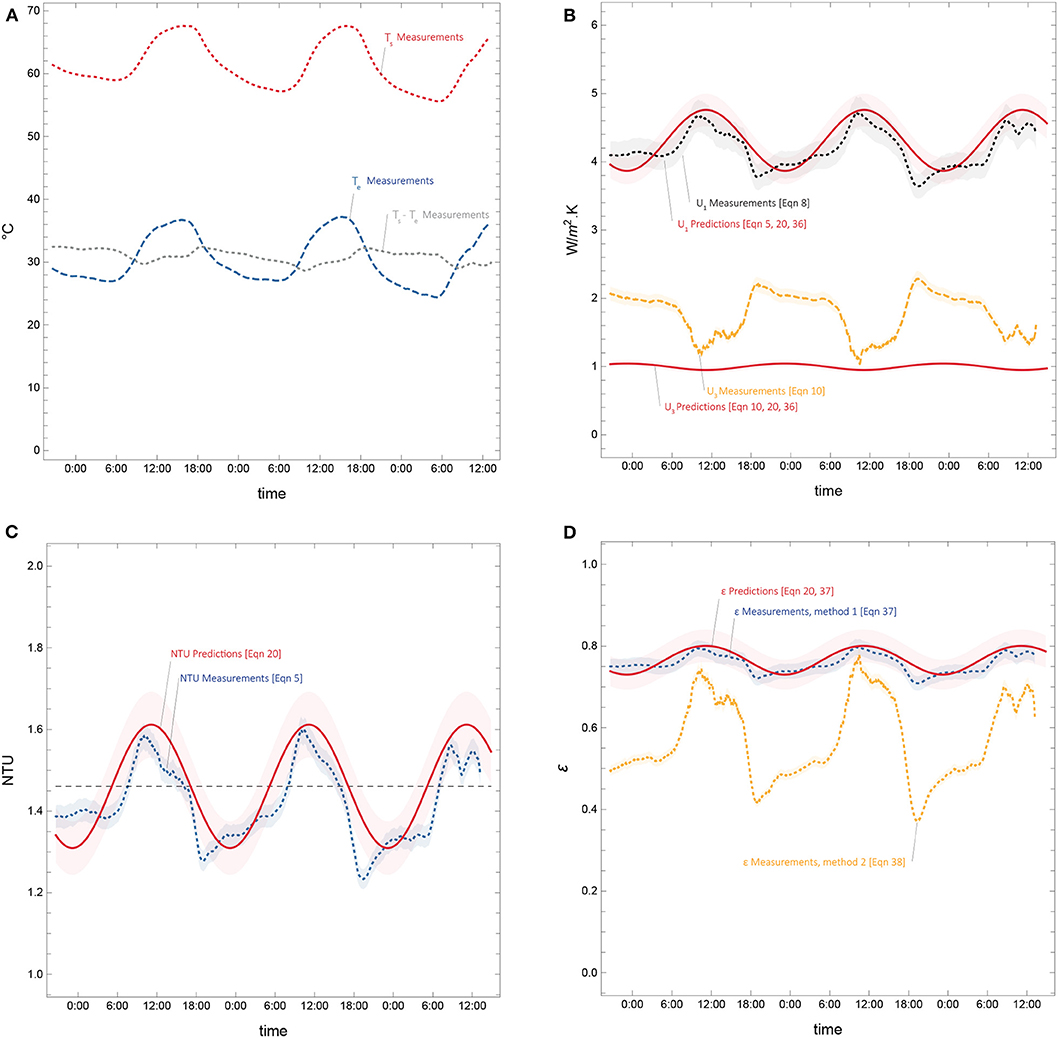
Figure 11. Periodic heat-exchange in outdoor conditions for pine test panel. (A) Temperatures. (B) Heat transfer coefficients. (C) Total (normalized) heat transfer. (D) Heat-exchange efficiency.
Plots (a) and (b) are included for reference, but plots (c) and (d) are the results of general interest, since the patterns for NTU (t) and ε should be replicable in different climates with different panel designs. The total (normalized) heat transfer did behave as predicted by Equation (20), despite exposure to slight breezes and normal variations in the exterior temperature (i.e., variations that were not perfectly sinusoidal). Equation (20) includes the coefficient a1, which accounts for shape effects and calibrates for the magnitude of heat transfer. The value for a1 determined in the previous experiment, Equation (41), was used here. The fact that a1 is the same in both experiments suggests it is a valid shape factor for transient conduction (Bart and Hanjalić, 2003). If this is true, it will not change significantly when the panel dimensions are different (though optimized).
The previous two experiments highlighted a discrepancy between two methods for measuring ε (see Table 3 and Figure 10B). This discrepancy is amplified in Figure 11D. The data signal from measurement method 2 (Equation 38) is lower and more volatile than measurement method 1 (Equation 37). In Figure 11, measurement method 2, shown in plot (d), superimposes the signals for U1 and U3, shown in plot (b). Recall that higher-than-expected values for U3 do not necessarily translate to greater losses. As discussed, further investigation is needed to measure the heat transfer to the ventilation stream (Equations 39 and 40) so the boundary effects at the exterior surface and their influence on ε can be fully determined.
4.3. Heat-Exchange With Buoyancy Ventilation
A separate chamber, acting as a proxy building, was fabricated to test the coupling with buoyancy ventilation in steady-state. Figure 12 presents the results. Plot (a) shows the relative temperature of the interior (Tii − Te) as a function of total heating from the TAS (q0). Plot (b) shows the rate of buoyancy ventilation (Q), also as a function of the total heating from the TAS. The plots show two predicted curves representing laminar (blue) or fully turbulent (red) flow. These predictions were made by numerically solving the system of equations in section 2.3, where Equations (32) and (33) estimate the discharge coefficient of the chimney according to either flow condition.
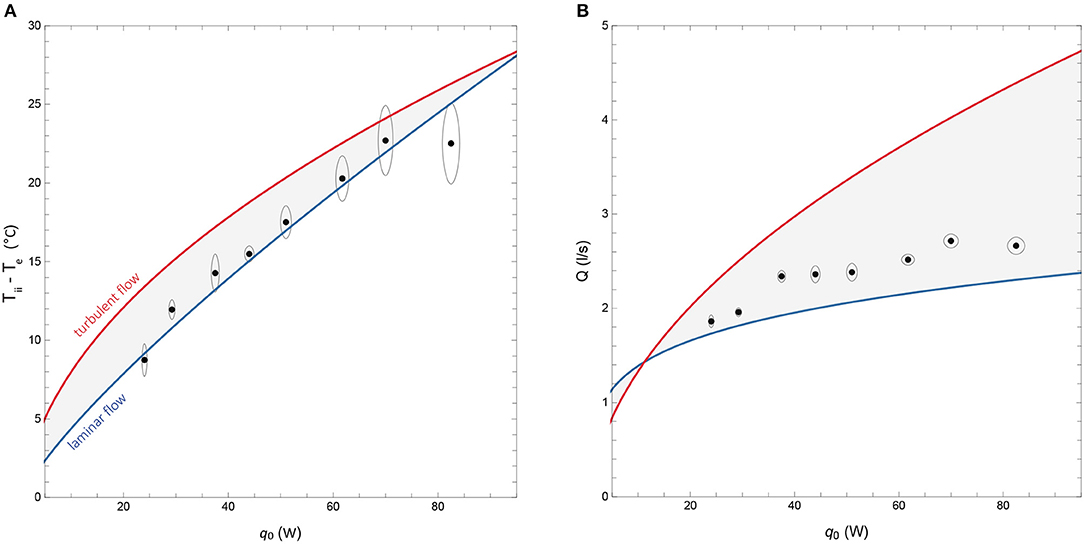
Figure 12. Pine test panel, coupling heat exchange with buoyancy ventilation. (A) Interior temperature (relative to outdoors) and (B) ventilation flow rate as a function of increasing heat input.
As the heating increases (q0), so too does the rate of buoyancy ventilation (Q) and the average temperature of the interior (Tii). The majority of the points fall in the shaded area, validating the theory described in section 2.3. These results give further confirmation that the expected rates of heat-exchange occur.
Notice that the measurement error for the temperature is greater than for the ventilation. The ventilation rate was measured at the narrowest point of the chimney, just below the top, where the flow converged before exiting. Temperature measurements were taken at several points up the chimney and averaged. The variation of temperature with height was not significant but the sensors did experience turbulence.
This experiment demonstrates it is possible to suck ventilation through the panels using thermal buoyancy instead of a fan, while maintaining the expected rates of heat-exchange and pressure. It should be emphasized that these are idealized circumstances. Horizontal installations are possible, but vertical or inclined envelopes are more likely in future applications. If the panel was vertical, the pressure across it would vary with height, as would the velocity and heat-exchange. The internal air may have stratified below the top of the panel (depending on the height of the chimney relative to the top of the panel). In which case, there would have been outflow through the upper channels. All these effects were purposely designed out of the experiment, in order to validate the essential elements of the thermal coupling. Further investigation is required to characterize what happens when the panels are vertical (or inclined) instead of horizontal. Further exploration is also needed to see if there are ways to naturally recover heat from the ventilation. The right-hand side of Figure 3 shows one possible configuration.
5. Conclusion
The general topic is how to radically simplify the design of timber buildings to reduce embodied and operational carbon emissions and facilitate carbon storage on a global scale. Our investigation focused on how to optimize channels in mass timber panels, so they exchange heat with the incoming air. The analysis and experiments suggest it is possible to achieve low heat-loss without external insulation. To achieve these low ‘dynamic’ U-values with wood, relatively high heat exchange efficiencies (ε > 0.6) are required, which in turn necessitates relatively high rates of ventilation (5 < u < 20 l/s).
We provided an app so that fellow researchers can evaluate the influence of different parameters on the optimal geometry and the theoretical performance of wood panels in steady heat-exchange. One can quickly see how the thermal conductivity, design pressure, interior heat flux, and target U-value influence the heat-exchange efficiency and the ventilation rate, as well as the thickness of the panel and the size and spacing of the channels.
We undertook an experiment to validate the total heat transfer in steady heat-exchange, measure the heat-exchange efficiency, and isolate the effect of anisotropy due to grain patterns in the wood. The normalized heat transfer at the design pressure was NTU = 1.47 ± 0.05 compared to the predicted value of NTU = 1.53 ± 0.03. The anisotropy of the wood did not, therefore, have a significant influence on the total heat transfer at the design pressure. The predicted heat-exchange at the design pressure was ε = 0.78 ± 0.01, compared to the indirect measurement of ε = 0.62 ± 0.02. In future experiments, external boundary layer effects will need isolating in order to take true measurements of the heat-exchange efficiency.
We then used the same experimental data to characterize the transient response of the test panel to a step-change in heating. We found that the total heat transfer evolves as it does through a plane wall of equivalent characteristic thickness, settling to steady state when Fo ≈ 2. We then tested the apparatus outdoors to characterize the heat transfer in response to a naturally oscillating exterior temperature, applying constant surface heating and pressure. The total heat transfer varied periodically around a mean value—the steady state design value. A simple model describing periodic oscillations—which included an empirical shape factor derived in step-change experiment—accounted for the heat transfer to within R2 = 0.9953 ± 0.0023.
Finally, we showed it is feasible to couple breathing walls with buoyancy ventilation. A test sample was installed horizontally at the bottom of a chimney. The apparatus was designed like this so that the interior air remained well-mixed. While this represented idealized conditions, it did allow us to validate the key relationships of the thermal coupling, as expressed by the system of equations in section 2.3. The measurements for the interior temperature and the ventilation rate fell within predicted limits depending on laminar or turbulent flow. According to these results, the rates of heat-exchange occurred as expected through the panel.
Data Availability Statement
The datasets generated during and/or analyzed during the current study are available in the Scholars Portal Dataverse repository, https://doi.org/10.5683/SP2/DCEJJR.
Author Contributions
SC: conceptualization, methodology, software, formal analysis, resources, data curation, writing—original draft, and writing—review and editing. AH, KF, PR, and JE: software, formal analysis, investigation, data curation, writing—original draft, writing—review and editing, visualization, and project administration. AF: supervision, resources, project administration, funding acquisition, and writing—review and editing. DK and KM: supervision and writing—review and editing. All authors contributed to the article and approved the submitted version.
Funding
Funding. This research was supported by the Rural Studio gift fund (http://ruralstudio.org/give/) and by the McGill Sustainability Systems Initiative (MSSI).
Conflict of Interest
The authors declare that the research was conducted in the absence of any commercial or financial relationships that could be construed as a potential conflict of interest.
Acknowledgments
The authors would like to thank all the staff and instructors at Auburn University Rural Studio, especially Stephen Long, for providing the resources and environment to make this research possible. Also, thank you to Dr. Daniel Harris and Dr. Chandon Roy, who assisted with the thermal properties testing. Lastly, thank you to the Sustainable Forestry Initiative for the interest and support.
References
Acred, A. (2014). Natural ventilation in multi-storey buildings: a preliminary design approach (Doctoral dissertation), Imperial College London.
Alongi, A., Angelotti, A., and Mazzarella, L. (2017a). Analytical modelling of breathing walls: experimental verification by means of the dual air vented thermal box lab facility. Energy Proc. 140, 36–47. doi: 10.1016/j.egypro.2017.11.121
Alongi, A., Angelotti, A., and Mazzarella, L. (2017b). Experimental investigation of the steady state behaviour of breathing walls by means of a novel laboratory apparatus. Build. Environ. 123, 415–426. doi: 10.1016/j.buildenv.2017.07.013
Alongi, A., Angelotti, A., and Mazzarella, L. (2020). Experimental validation of a steady periodic analytical model for breathing walls. Build. Environ. 168:106509. doi: 10.1016/j.buildenv.2019.106509
Alongi, A., and Mazzarella, L. (2015a). Characterization of fibrous insulating materials in their application in dynamic insulation technology. Energy Proc. 78, 537–542. doi: 10.1016/j.egypro.2015.11.732
Alongi, A., and Mazzarella, L. (2015b). The dual air vented thermal box: a laboratory apparatus to test air permeable building envelope technologies. Energy Proc. 78, 1543–1548. doi: 10.1016/j.egypro.2015.11.198
Ascione, F., Bianco, N., Stasio, C. D., Mauro, G. M., and Vanoli, G. P. (2015). Dynamic insulation of the building envelope: numerical modeling under transient conditions and coupling with nocturnal free cooling. Appl. Therm. Eng. 84, 1–14. doi: 10.1016/j.applthermaleng.2015.03.039
Bart, G. C. J., and Hanjalić, K. (2003). Estimation of shape factor for transient conduction. Int. J. Refrig. 26, 360–367. doi: 10.1016/S0140-7007(02)00079-8
Bejan, A., Dincer, I., Lorente, S., Miguel, A., and Reis, H. (2004). Porous and Complex Flow Structures in Modern Technologies. New York, NY: Springer-Verlag.
Cao, Z., Myers, R. J., Lupton, R. C., Duan, H., Sacchi, R., Zhou, N., et al. (2020). The sponge effect and carbon emission mitigation potentials of the global cement cycle. Nat. Commun. 11:3777. doi: 10.1038/s41467-020-17583-w
Carrer, P., Wargocki, P., Fanetti, A., Bischof, W., Fernandes, E. D. O., Hartmann, T., et al. (2015). What does the scientific literature tell us about the ventilation–health relationship in public and residential buildings? Build. Environ. 94, 273–286. doi: 10.1016/j.buildenv.2015.08.011
Churkina, G., Organschi, A., Reyer, C. P. O., Ruff, A., Vinke, K., Liu, Z., et al. (2020). Buildings as a global carbon sink. Nat. Sustain. 3, 269–276. doi: 10.1038/s41893-019-0462-4
Craig, S., and Fortin, R. (2020). Design of Mass Timber Panels as Heat Exchangers [Wolfram Demonstration]. Wolfram Demonstrations Project. Available online at: https://demonstrations.wolfram.com/DesignOfMassTimberPanelsAsHeatExchangers/
Craig, S., and Grinham, J. (2017). Breathing walls: the design of porous materials for heat exchange and decentralized ventilation. Energy Build. 149, 246–259. doi: 10.1016/j.enbuild.2017.05.036
Dabbagh, M., and Krarti, M. (2020). Evaluation of the performance for a dynamic insulation system suitable for switchable building envelope. Energy Build. 222:110025. doi: 10.1016/j.enbuild.2020.110025
Dalehaug, A., Fukushima, A., and Yoshinori, H. (1993). Dynamic Insulation in a Wall: Insulation, Ventilation, Energy Conservation. Report Collection of Architectural Institute of Japan, No. 66, 261–264.
Dehwah, A. H. A., and Krarti, M. (2020). Impact of switchable roof insulation on energy performance of US residential buildings. Build. Environ. 177:106882. doi: 10.1016/j.buildenv.2020.106882
Estrin, Y., Bréchet, Y., Dunlop, J., and Fratzl, P. (Eds.). (2019). Architectured Materials in Nature and Engineering: Archimats. Cham: Springer International Publishing.
Etheridge, D. W., and Zhang, J. J. (1998). Dynamic insulation and natural ventilation: feasibility study. Build. Serv. Eng. Res. Technol. 19, 203–212. doi: 10.1177/014362449801900403
Guest, G., Cherubini, F., and Strømman, A. H. (2013). Global warming potential of carbon dioxide emissions from biomass stored in the anthroposphere and used for bioenergy at end of life. J. Ind. Ecol. 17, 20–30. doi: 10.1111/j.1530-9290.2012.00507.x
Habert, G., Miller, S. A., John, V. M., Provis, J. L., Favier, A., Horvath, A., et al. (2020). Environmental impacts and decarbonization strategies in the cement and concrete industries. Nat. Rev. Earth Environ. 1, 559–573. doi: 10.1038/s43017-020-0093-3
Hepburn, C., Adlen, E., Beddington, J., Carter, E. A., Fuss, S., Dowell, N. M., et al. (2019). The technological and economic prospects for CO2 utilization and removal. Nature 575, 87–97. doi: 10.1038/s41586-019-1681-6
Hoxha, E., Passer, A., Saade, M. R. M., Trigaux, D., Shuttleworth, A., Pittau, F., et al. (2020). Biogenic carbon in buildings: a critical overview of LCA methods. Build. Cities 1, 504–524. doi: 10.5334/bc.46
Hurmekoski, E., Myllyviita, T., Seppälä, J., Heinonen, T., Kilpeläinen, A., Pukkala, T., et al. (2020). Impact of structural changes in wood-using industries on net carbon emissions in Finland. J. Ind. Ecol. 24, 899–912. doi: 10.1111/jiec.12981
Incropera, F., DeWitt, D., Bergman, T. L., and Lavine, A. S. (2007). Fundamentals of Heat and Mass Transfer. Hoboken, NJ: John Wiley & Sons.
International Energy Agency the United Nations Environment Programme. (2018). 2018 Global Status Report: Towards a Zero-emission, Efficient and Resilient Buildings and Construction Sector. (DTI/2213/PA). Available online at: https://www.worldgbc.org/news-media/2018-global-status-report-towards-zero-emission-efficient-and-resilient-buildings-and
Jones, B. M., Cook, M. J., Fitzgerald, S. D., and Iddon, C. R. (2016). A review of ventilation opening area terminology. Energy Build. 118, 249–258. doi: 10.1016/j.enbuild.2016.02.053
Kiamili, C., Hollberg, A., and Habert, G. (2020). Detailed assessment of embodied carbon of HVAC systems for a new office building based on BIM. Sustainability 12:3372. doi: 10.3390/su12083372
Kim, S., Lorente, S., and Bejan, A. (2007). Vascularized materials with heating from one side and coolant forced from the other side. Int. J. Heat Mass Transfer 50, 3498–3506. doi: 10.1016/j.ijheatmasstransfer.2007.01.020
Kim, S., Lorente, S., and Bejan, A. (2008). Dendritic vascularization for countering intense heating from the side. Int. J. Heat Mass Transfer 51, 5877–5886. doi: 10.1016/j.ijheatmasstransfer.2008.04.063
Kim, S., Lorente, S., and Bejan, A. (2009). Transient behavior of vascularized walls exposed to sudden heating. Int. J. Therm. Sci. 48, 2046–2052. doi: 10.1016/j.ijthermalsci.2009.03.019
Krarti, M. (1994). Effect of air flow on heat transfer in walls. J. Solar Energy Eng. 116, 35–42. doi: 10.1115/1.2930063
Levasseur, A., Lesage, P., Margni, M., and Samson, R. (2013). Biogenic carbon and temporary storage addressed with dynamic life cycle assessment. J. Ind. Ecol. 17, 117–128. doi: 10.1111/j.1530-9290.2012.00503.x
Lim, X. (2019). The super-cool materials that send heat to space. Nature 577, 18–20. doi: 10.1038/d41586-019-03911-8
Meggers, F., Ritter, V., Goffin, P., Baetschmann, M., and Leibundgut, H. (2012). Low exergy building systems implementation. Energy 41, 48–55. doi: 10.1016/j.energy.2011.07.031
Menyhart, K., and Krarti, M. (2017). Potential energy savings from deployment of dynamic insulation materials for US residential buildings. Build. Environ. 114, 203–218. doi: 10.1016/j.buildenv.2016.12.009
Moe, K. (2010). Thermally Active Surfaces in Architecture. New York, NY: Princeton Architectural Press.
Monkman, S., and MacDonald, M. (2017). On carbon dioxide utilization as a means to improve the sustainability of ready-mixed concrete. J. Clean. Prod. 167, 365–375. doi: 10.1016/j.jclepro.2017.08.194
Park, B., Srubar, W. V., and Krarti, M. (2015). Energy performance analysis of variable thermal resistance envelopes in residential buildings. Energy Build. 103, 317–325. doi: 10.1016/j.enbuild.2015.06.061
Park, K.-S., Kim, S.-W., and Yoon, S.-H. (2016). Application of breathing architectural members to the natural ventilation of a passive solar house. Energies 9:214. doi: 10.3390/en9030214
Pingoud, K., Ekholm, T., Sievänen, R., Huuskonen, S., and Hynynen, J. (2018). Trade-offs between forest carbon stocks and harvests in a steady state–a multi-criteria analysis. J. Environ. Manag. 210, 96–103. doi: 10.1016/j.jenvman.2017.12.076
Pittau, F., Krause, F., Lumia, G., and Habert, G. (2018). Fast-growing bio-based materials as an opportunity for storing carbon in exterior walls. Build. Environ. 129, 117–129. doi: 10.1016/j.buildenv.2017.12.006
Pomponi, F., Hart, J., Arehart, J. H., and D'Amico, B. (2020). Buildings as a global carbon sink? A reality check on feasibility limits. One Earth 3, 157–161. doi: 10.1016/j.oneear.2020.07.018
Rhee, K.-N., and Kim, K. W. (2015). A 50 year review of basic and applied research in radiant heating and cooling systems for the built environment. Build. Environ. 91, 166–190. doi: 10.1016/j.buildenv.2015.03.040
Rhee, K.-N., Olesen, B. W., and Kim, K. W. (2017). Ten questions about radiant heating and cooling systems. Build. Environ. 112, 367–381. doi: 10.1016/j.buildenv.2016.11.030
Röck, M., Saade, M. R. M., Balouktsi, M., Rasmussen, F. N., Birgisdottir, H., Frischknecht, R., et al. (2020). Embodied GHG emissions of buildings–the hidden challenge for effective climate change mitigation. Appl. Energy 258:114107. doi: 10.1016/j.apenergy.2019.114107
Rupp, S., and Krarti, M. (2019). Analysis of multi-step control strategies for dynamic insulation systems. Energy Build. 204:109459. doi: 10.1016/j.enbuild.2019.109459
Seppälä, J., Heinonen, T., Pukkala, T., Kilpeläinen, A., Mattila, T., Myllyviita, T., et al. (2019). Effect of increased wood harvesting and utilization on required greenhouse gas displacement factors of wood-based products and fuels. J. Environ. Manag. 247, 580–587. doi: 10.1016/j.jenvman.2019.06.031
Shekar, V., and Krarti, M. (2017). Control strategies for dynamic insulation materials applied to commercial buildings. Energy Build. 154, 305–320. doi: 10.1016/j.enbuild.2017.08.084
Smyth, C. E., Smiley, B. P., Magnan, M., Birdsey, R., Dugan, A. J., Olguin, M., et al. (2018). Climate change mitigation in Canada's forest sector: a spatially explicit case study for two regions. Carbon Balance Manag. 13:11. doi: 10.1186/s13021-018-0099-z
Taylor, B. J., Cawthorne, D. A., and Imbabi, M. S. (1996). Analytical investigation of the steady-state behaviour of dynamic and diffusive building envelopes. Build. Environ. 31, 519–525. doi: 10.1016/0360-1323(96)00022-4
Taylor, B. J., and Imbabi, M. S. (1997). The effect of air film thermal resistance on the behaviour of dynamic insulation. Build. Environ. 32, 397–404. doi: 10.1016/S0360-1323(97)00012-7
Taylor, B. J., and Imbabi, M. S. (1999). Dynamic insulation in multistorey buildings. Build. Serv. Eng. Res. Technol. 20, 179–184. doi: 10.1177/014362449902000403
Taylor, B. J., and Imbabi, M. S. (2000). “Environmental design using dynamic insulation,” ASHRAE Transactions. 106, 15–28.
Taylor, B. J., Webster, R., and Imbabi, M. S. (1998). The building envelope as an air filter. Build. Environ. 34, 353–361. doi: 10.1016/S0360-1323(98)00017-1
Wang, J., Du, Q., Zhang, C., Xu, X., and Gang, W. (2018). Mechanism and preliminary performance analysis of exhaust air insulation for building envelope wall. Energy Build. 173, 516–529. doi: 10.1016/j.enbuild.2018.05.045
Woods, A. W., Fitzgerald, S., and Livermore, S. (2009). A comparison of winter pre-heating requirements for natural displacement and natural mixing ventilation. Energy Build. 41, 1306–1312. doi: 10.1016/j.enbuild.2009.07.030
Wu, H., Liew, A., Mele, T. V., and Block, P. (2020). Analysis and optimisation of a rib-stiffened vaulted floor for dynamic performance. Eng. Struct. 213:110577. doi: 10.1016/j.engstruct.2020.110577
Zhang, C., Gang, W., Xu, X., Li, L., and Wang, J. (2019a). Modelling, experimental test, and design of an active air permeable wall by utilizing the low-grade exhaust air. Appl. Energy 240, 730–743. doi: 10.1016/j.apenergy.2019.02.087
Zhang, C., Wang, J., Li, L., and Gang, W. (2019b). Dynamic thermal performance and parametric analysis of a heat recovery building envelope based on air-permeable porous materials. Energy 189:116361. doi: 10.1016/j.energy.2019.116361
Nomenclature
Keywords: biogenic carbon, carbon utilization, low carbon materials, integrated materials design, mass timber construction, sustainable construction, thermally activated building system (TABS), buoyancy ventilation
Citation: Craig S, Halepaska A, Ferguson K, Rains P, Elbrecht J, Freear A, Kennedy D and Moe K (2021) The Design of Mass Timber Panels as Heat-Exchangers (Dynamic Insulation). Front. Built Environ. 6:606258. doi: 10.3389/fbuil.2020.606258
Received: 14 October 2020; Accepted: 30 November 2020;
Published: 06 January 2021.
Edited by:
Arno Schlueter, ETH Zürich, SwitzerlandReviewed by:
Graziano Salvalai, Politecnico di Milano, ItalyDang Mao Nguyen, EA4038 Laboratoire Génie des Procédés et Matériaux (LGPM), France
Guillaume Habert, ETH Zürich, Switzerland
Copyright © 2021 Craig, Halepaska, Ferguson, Rains, Elbrecht, Freear, Kennedy and Moe. This is an open-access article distributed under the terms of the Creative Commons Attribution License (CC BY). The use, distribution or reproduction in other forums is permitted, provided the original author(s) and the copyright owner(s) are credited and that the original publication in this journal is cited, in accordance with accepted academic practice. No use, distribution or reproduction is permitted which does not comply with these terms.
*Correspondence: Salmaan Craig, c2FsbWFhbi5jcmFpZ0BtY2dpbGwuY2E=