
ORIGINAL RESEARCH article

Front. Built Environ., 04 February 2021
Sec. Transportation and Transit Systems
Volume 6 - 2020 | https://doi.org/10.3389/fbuil.2020.607961

Early Indicators of Human Activity During COVID-19 Period Using Digital Trace Data of Population Activities

www.frontiersin.orgXinyu Gao1* www.frontiersin.orgChao Fan1 www.frontiersin.orgYang Yang2 www.frontiersin.orgSanghyeon Lee3 www.frontiersin.orgQingchun Li1 www.frontiersin.orgMikel Maron4 www.frontiersin.orgAli Mostafavi1
  • 1Department of Civil and Environmental Engineering, Texas A&M University, College Station, TX, United States
  • 2Department of Computer Science and Engineering, Texas A&M University, College Station, TX, United States
  • 3Department of Electrical and Computer Engineering, Texas A&M University, College Station, TX, United States
  • 4Community Team, Mapbox, Washington, DC, United States

The spread of pandemics such as COVID-19 is strongly linked to human activities. The objective of this article is to specify and examine early indicators of disease spread risk in cities during the initial stages of outbreak based on patterns of human activities obtained from digital trace data. In this study, the Venables distance (Dv) and the activity density (Da) are used to quantify and evaluate human activities for 193 United States counties, whose cumulative number of confirmed cases was greater than 100 as of March 31, 2020. Venables distance provides a measure of the agglomeration of the level of human activities based on the average distance of human activities across a city or a county (less distance could lead to a greater contact risk). Activity density provides a measure of level of overall activity level in a county or a city (more activity could lead to a greater risk). Accordingly, Pearson correlation analysis is used to examine the relationship between the two human activity indicators and the basic reproduction number in the following weeks. The results show statistically significant correlations between the indicators of human activities and the basic reproduction number in all counties, as well as a significant leader-follower relationship (time lag) between them. The results also show one to two weeks’ lag between the change in activity indicators and the decrease in the basic reproduction number. This result implies that the human activity indicators provide effective early indicators for the spread risk of the pandemic during the early stages of the outbreak. Hence, the results could be used by the authorities to proactively assess the risk of disease spread by monitoring the daily Venables distance and activity density in a proactive manner.

Introduction

The objective of this study is to reveal and evaluate early indicators of human activity during COVID-19 period in cities at the initial stages of the outbreak using measures of human activities derived from digital trace data. As an arguably unprecedented global pandemic, the coronavirus disease 2019 (COVID-19) has infected millions of people worldwide with a mortality rate of 6.6% and a high infection rate (Keni et al., 2020; World Health Organization, 2020). Since the spread of COVID-19 is highly dependent on human activities, incidence of infection could be contained by restricting human activities and mobility (Gollwitzer et al., 2020). Many countries and authorities have implemented various nonpharmaceutical interventions (e.g., shelter-in-place orders, regional lockdowns, and travel restrictions), which were undertaken to slow the spread of disease by disrupting transmission chains through restricting human mobility and activities. Such social distancing and activity reduction interventions have proven to be critical in slowing down the spread of pandemics both in previous epidemics (Caley et al., 2008) and during COVID-19 (Anderson et al., 2020; Tian et al., 2020; Li, et al., 2020b; Ramchandani, et al., 2020).

While reduction in human activities is considered an effective measure for containing epidemics and pandemics, there are limited reliable, proven, real-time leading indicators related to human activities that could provide early insights about the risk of disease spread in a region to inform proactive policy making. One reason for this limitation has been the absence of quantitative measures and data that could be examined to proactively evaluate human activities. With advancements in location intelligence data technologies, however, information derived from cellular devices offers a large depository of digital trace data related to human activities increasingly adapted and analyzed to promote understanding of and to quantify human activity and mobility in pandemic analysis, as well as in other applications (Balcan et al., 2009; Asgari et al., 2013; Barbosa et al., 2018). For example, in the context of COVID-19, the radius of gyration, which captures the mobility of individuals using human movement trajectories, was adopted to analyze the COVID-19 spread in Japan (Yabe et al., 2020). Daily step-counts (gathered from smartphones) were used to estimate and predict decreased movement of individuals within the United States during COVID-19 (Gollwitzer et al., 2020). Two of the most important aspects of human activities during an epidemic are agglomeration of activities and intensity of activities.

Although previous research reveals insights regarding human activities in the context of COVID-19, the relationship between human activities and disease-spreading risk has not been fully explored, and leading indicators of human activities to proactively assess the risk of disease spread during the early stages of pandemics are lacking. The majority of research studies (Chang et al., 2020; Cintia et al., 2020; Gao et al., 2020; Li et al., 2020a) focus on quantifying and analyzing the changes in human activities as a consequence of the outbreak of the virus and in response to protective policies (such as shelter-in-place policies). The time-lag relationship between these human activity metrics and the spread of virus, which can be generally described by the basic reproduction number (R0), has not yet been fully examined. The basic reproduction number, R0, is defined as the number of secondary cases produced by one previous case in a completely susceptible population (Dietz, 1993). Although research studies (Lampos et al., 2020; Lu and Reis, 2020) have focused on leading indicators obtained from users’ online search behavior, the decrease of online search frequencies may not have direct impact on the spread of the virus. Hence, the previous indicators cannot be utilized for proactive assessment of disease spread risk in a proactive manner. Epidemiological modeling and disease spread modeling are also widely used to predict the spread of the virus (Chen et al., 2020; Ellison, 2020; Wu et al., 2020). By using fine-grained aggregated human mobility data, Wu et al. (2020) forecasted the subsequent spread of COVID-19 in different geographic regions, with minimal parameterization of the model. Such simulation models could provide the authority handy tools to predict the spread of diseases in the future. The empirical studies and simulation studies are both important for understanding the spread of virus in either the COVID-19 or the future diseases.

In this study, the empirical data related to human activities during COVID-19 was used to reveal the leading relationship between the human activity and the basic reproduction number. We adopted the Venables distance (Dv) index (Louail et al., 2014) and also created the activity density (Da) index to serve as two recent empirical data indicators to examine the spatial and temporal patterns of human activities across 193 counties in the United States using Mapbox high-resolution temporal-spatial activity index data from January 1 to March 31, 2020. The Venables distance captures the average distance (i.e., concentration) of human activities across a city or county (less distance between persons might indicate a greater contact risk). The activity density captures the intensity level of overall activities in a county or city (higher activity levels might indicate a greater spread risk). Human activities were examined in four categories—social, traffic, work, and other—based on the location and time of activities. Accordingly, we analyzed the correlation between the two metrics (Dv and Da) and the basic reproduction number for 193 counties with the highest number of confirmed COVID-19 cases. The significant correlation between the two population activity measures and the extent of spread of the virus suggested that these two measures at the beginning stage of the outbreak could provide promising leading indicators of the risk of spread based on human activity. The examination of population activity measures as leading indicators of pandemic spread risk is critical for situational awareness and monitoring and would complement the insights obtained from standard mathematical disease spread models. Although the spread of the pandemic is a complex phenomenon and is affected by various factors, the focus of this research is only on the human activity aspect and early indicators related to human activity.

The rest of this article is organized into three sections. The first section discusses the description of the two datasets (Mapbox data and total confirmed cases number data), as well as the analysis methods. The second section describes the results of time-lag correlation analysis between the two metrics and the basic reproduction number. The last section presents the results and the implications of the findings for future work.

Methods

In this section, we describe the two datasets—Mapbox data and total confirmed cases number data—and the procedures for human activity categorization. Also covered in this section are definitions and equations related to the Venables distance (Dv), the activity density (Da), and the basic reproduction number (R0). The time-lag cross-correlation analysis method is presented at the end of this section.

Data Source and Preprocessing

We utilized digital trace telemetry data obtained from Mapbox from January 1 to March 30, 2020. The dataset contains a metric of telemetry-based human activity, aT,t, which varies across spatial tiles and time t. The partition of tiles is based on Mercantile, a Python library, which is capable of creating spatial-resolution grids all worldwide. The aT,t is collected, aggregated, and normalized by Mapbox from geography information updates of users’ cell phone locations by time flows. The more users located in a tile at time t, the higher the human activity (i.e., aT,t). The dataset comprises the United States and the District of Columbia; however, in this study, we examined only 193 counties whose cumulative confirmed cases were greater than 100 as of March 31, 2020 (Figure 1). In the raw data, the temporal resolution is 4 h. Each tile represents about 100 by 100 square meters for spatial resolution. Since the data is derived from cell phone activity, data may not exist for all cells at all times. For example, a park open during the day but closed at night would not generate any data at midnight. Also, for protecting users’ privacy and the data aggregation process, tiles with a small number of users are reported without any activity data. It is also noteworthy that the data is aggregated and normalized for each month, so the absolute values of activity indices for different months cannot be directly compared.

FIGURE 1
www.frontiersin.org

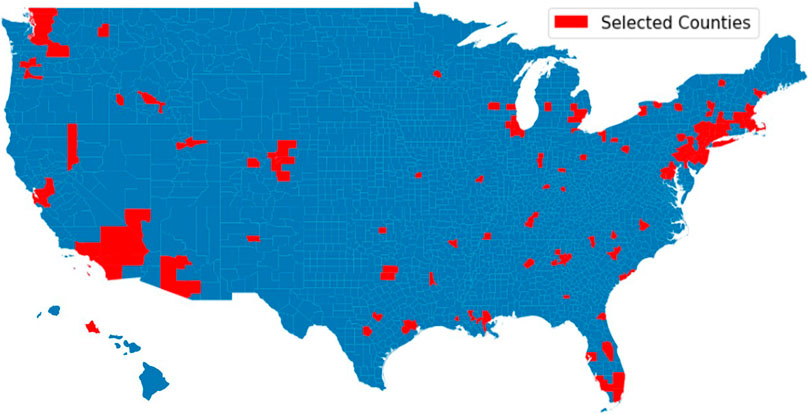
FIGURE 1. 193 selected counties whose cumulative confirmed cases were greater than 100 as of March 31, 2020.

To reveal the time-lag relationship between metrics and spread of the virus, the total number of confirmed cases was used. We obtained the data from the COVID-19 Data Repository by the Center for Systems Science and Engineering (CSSE) at Johns Hopkins University (2020). The data in this repository were gathered and aggregated from various sources, such as the World Health Organization (WHO) and the Centers for Disease Control and Prevention (CDC). We extracted the total number of confirmed cases ci,j from the CSSE repository, where i represents each date and j represents each county.

Tile Categorization

The nature of an activity might put its participants at a higher risk level for contracting the virus. For example, activities in public common areas, such as grocery stores or gyms, would lead to greater risk of disease spread compared to the activities in residential areas, such as working from home or walking a dog in the community. The fine granularity of the spatial resolution enables classification of each tile into one of the four categories: (1) social tiles, (2) traffic tiles, (3) work tiles, and (4) other tiles. Categorization is based on the following characteristics: (1) social tiles are the location of at least one point of interest location; the location information of point of interest is extracted from SafeGraph data (including restaurant, gas station, and commercial complex) (SafeGraph, 2020); (2) traffic tiles are extracted by mapping the traffic network with all tiles including roads; (3) work tiles are identified based on lack of activity during the late evening hours; and (4) other tiles are located in residential areas. We assigned these four tags to each tile from social, traffic, work to other. Once a tile is assigned with a tag, it is excluded for further categorization. We categorized tiles in this way to examine the importance of human activity in each category and its relationship with the reproduction number. The analysis in this research examines human activities for social, work, and traffic tiles separately. All the residential tiles are excluded from the analysis because the human activities in these tiles have less influence on the contact level among people. Example tile maps related to each category are shown in Figure 2 for Harris County, Texas.

FIGURE 2
www.frontiersin.org

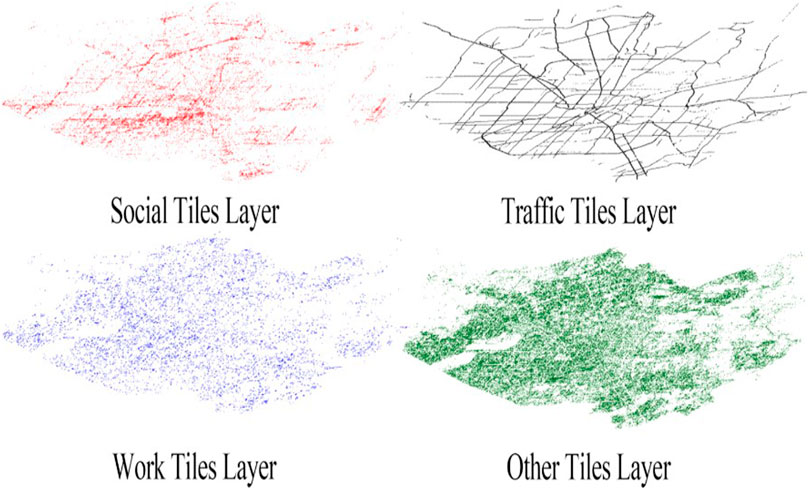
FIGURE 2. Maps of four different tile categories (social, traffic, work, and other) in Harris County, Texas.

Venables Distance (Dv)

To quantify the agglomeration of human activities, we used the Venables distance (Dv) as a weighted average distance of human activities. The Venables distance aggregates the spatial distribution of aT,t in a county and captures the urban spatial structure of human activities (Louail et al., 2014). The Venables distance is a metric to describe how distant the human activities are from each other. It also provides a metric for concentration activities. In examining the risk of pandemic, understanding the concentration of human activities is an important consideration. Hence, the Venables distance provides a metric to examine fluctuations in this aspect of human activities. Compared with the well-known spatial autocorrelation metric, the meaning of Dv is easier to be explained and understood. Also, the meaning of Dv is different from that of spatial autocorrelation, which describes the presence of systematic in spatial space. The value of spatial autocorrelation is from −1 to 1, and it could be negative if the adjacent observations tend to have very contrasting values. The Venables distance, however, is a metric to describe how far the human activities are apart from each other, and its unit, kilometer, has reality meaning. The Dv is calculated using Eq. 1:

Dv(t)=T1T2aT1,taT2,tdT1,T2T1T2aT1,taT2,t,(1)

where aT1,t and aT2,t are the metrics of human activities in Tile1 and Tile2 at time t, respectively, and dT1,T2 is the distance from the centroids between these two tiles. In Harris County, Texas, there are more than 70K unique tiles, which makes it computationally expensive to analyze all pairs of existing tiles. To reduce the computational burden, we aggregated the 100-by-100 square-meter tiles, aT,t, to square cells 2 km in length using Eq. 2:

ak,t= for all T in cell kaT,tAk,(2)

where ak,t is the intensity of human activity in cell k, at time t and Ak is the area of the cell k. By aggregating human activity into a larger spatial cell, we reduced the computational efforts, maintaining a meaningful spatial resolution without losing important characteristics in the raw data. Accordingly, the modified Venables distance is derived as shown in Eq. 3:

Dv(t)=k1k2ak1,tak2,tdk1,k2k1k2ak1,tak2,t,(3)

where ak1,t and ak2,t are the intensity of human activities in cells k1 and k2 at time t, respectively, and dk1,k2 is the distance from the centroids between these two cells. In Eq. 3, the values of the activity intensity (ak,t) are used as weights to calculate a human-activity-weighted distance for the whole area. In other words, the relative values of ak,t were used to examine changes in agglomeration of activities. We calculated Dv(t) for each county j, which is denoted as Dv(j,t) for all cells in the county j. Due to high computational cost of conducting, we aggregated the data into 2 km square. The Venables distance describes how human activities are apart from each other, and the spatial resolution of 2 km is capable to capture such feature.

Activity Density (Da)

Although Dv captures the agglomeration of human activities, the density of activities is also critical for examining population contact. To make the raw data (aT,t) from Mapbox comparable among different months, we denormalized the activity index to the contact activity metric caT,t for each tile and each month (where t is time). The original human activity data was obtained from the use of cell phones and was normalized within each month across all tiles and time windows. Every value above the 99.9 percentile is set to 1, and every value below that is scaled linearly. Since the maximum value of human activities across the entire United States (the denominator of the normalization process) could be different in different months, the normalized data cannot be compared across different months. In the denormalization process, the assumption was that, in each month, the minimum human activity intensity among tiles is the same. First, the tile with minimum human activity index (aT,t) in each month was found. Then we set the value of contact activity caT,t in that low-activity tile as 5 and denormalize the values for other tiles based on this value. The value of tiles with the lowest activity is set in order to keep the minimum activity in the tiles across the United States fixed and consistent. By doing so, we can denormalize the data uniformly for all other tiles in the country. For each county, the activity density at time t[Da(t)] was calculated using Eq. 4:

Da(t)=1NT=1NcaT,t2.(4)

Basic Reproduction Number Estimation

The basic reproduction number (R0) (the number of secondary cases arising from one previous case) is a critical parameter in epidemic modeling for understanding the speed of disease spread (Dietz, 1993; Gatto et al., 2020), as well as the risk of virus spread (Newman, 2002; Liu et al., 2018; Aleta et al., 2020; Giordano et al., 2020). We adopted the R0 in the analysis, assuming a complete susceptibility of the population. This is because, at the early stage of the COVID-19 pandemic (March, 2020), all people were susceptible. The effective reproduction number (Rt) is another metric which is widely used to describe the spread speed of disease (Nishiura and Chowell,, 2009; Althaus 2014). Rt assumes only partial population is susceptible and takes into account the effect of policies such as social distancing in measuring the disease spread. Thus, Rt can be used in cases with populations having immune members (Delamater et al., 2019). Hence, Rt would be more appropriate in analyses at the later stage of the pandemic. In the early stage of COVID-19, it was a novel virus for all people and everyone was susceptible. Hence the basic reproduction number (R0) was used in this study to represent the spread speed of the virus. R0 is calculated using Eq. 5:

ci+t=ciR0t/τ,(5)

where ci and ci+t represent the total confirmed cases in day i and day i+t, respectively, and τ is a constant parameter. We estimated R0 using CDC data (ci,j) in Eq. 6:

R0i,j=eτlnci,jlncit,jt,(6)

where R0i,j is the basic reproduction number at date i in county j. Because the CDC total confirmed cases data fluctuates within the course of a week (i.e., more reported cases in weekdays and less reported cases during weekends), the time interval t was set to 7 days. Based on the existing literature and simulation models related to COVID-19 (Zhang et al., 2020a; Zhang et al., 2020b; Fan et al., 2020), the constant parameter τ was set to 5.1 days. Accordingly, the R0 was calculated for all 193 counties for the analysis period. The daily basic reproduction number for each county will be used to conduct the correlation analysis with proposed two indicators of human activities.

Time Lagged Cross-Correlation Analysis

In the next step, we examined the correlation between the two human activity indicators and the basic reproduction number across all counties. Since these variables are a time series, we used time-lagged cross-correlation analysis to assess the synchrony of time series data sets. The cross-correlation coefficient was calculated using Eq. 7:

ρA1A2(τ)= Cov(A1(t),A2(t+δ))σA1σA2,(7)

where ρA1A2 is the cross-correlation coefficient for two time series data A1 and A2; δ is the time offset of A2; Cov(X,Y) is the function calculating the covariance of two variables; σA1 and σA2 are the standard deviation of data A1 and A2, respectively. Based on the definition, ρA1A2 represents the correlation between two variables and |ρA1A2|1(|ρA1A2|=1 happens if and only if A1=mA2+n, where m and n are constants). Then, by iteratively calculating the ρA1A2(δ) with different δ, the correlation coefficient would reach its peak when δ=T, and T was determined as the time lag between two variables.

Results

This section presents the results related to the calculation of the two human activity metrics and their time-lagged correlation with the basic reproduction number across 193 counties during the initial stage of the COVID-19 outbreak in the United States.

Evaluation of Human Activity for Each Category Among Counties

In this study, the Venables distance (Dv) and the activity density (Da) were calculated to assess the human activities at the county level using data from Mapbox. The very first four weeks (January 1–28) were considered as the baseline, and Dv and Da values were compared with the average baseline in corresponding weekdays. For example, the Dv values on March 1 (Sunday) were compared with the mean value of Dv values on Sundays between January 1 and 28. Three different ways of daily activity aggregation were used: peak, average, and noon. The peak (largest), average, or the noon (11 a.m.–3 p.m.) values of human activities atile,t were selected and set as the representative value of each tile at each day. Figure 3 and Figure 4 show the percentage of Dv and Da change for social, traffic, and work activity categories and for three types of daily tile aggregation.

FIGURE 3
www.frontiersin.org

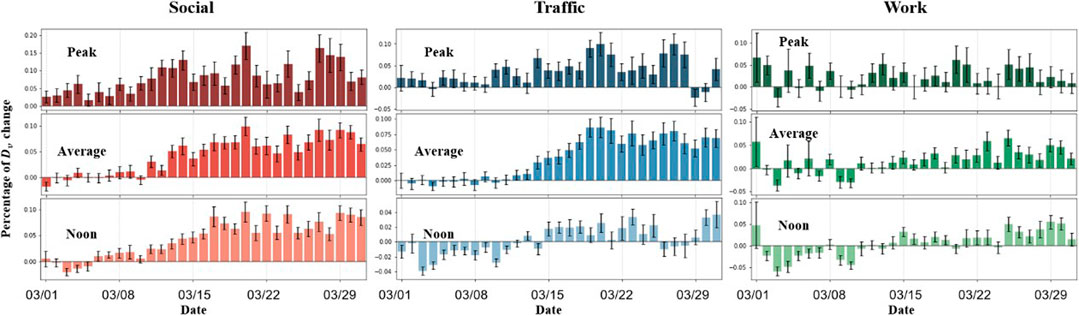
FIGURE 3. The percentage change of Dv for 193 counties in March 2020. The height of each bar is the average percentage change of all 193 counties. The error bar indicates the standard deviation among all counties. The three tile categories of social, traffic, and work are shown in each column, and three daily tile aggregations of peak, average, and noon are shown in each row.

FIGURE 4
www.frontiersin.org

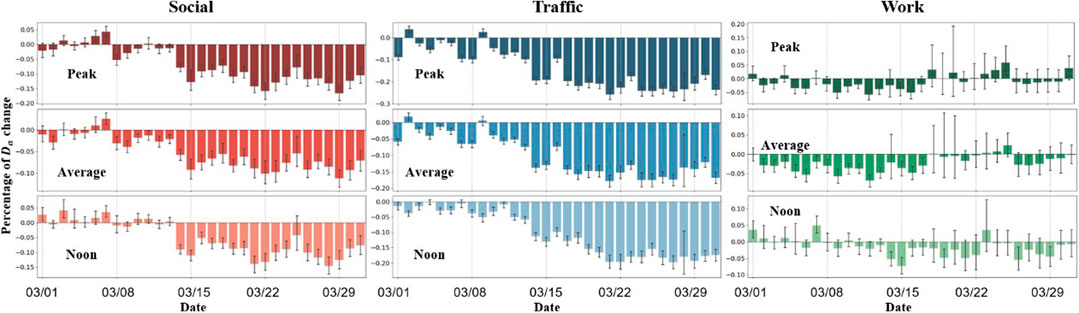
FIGURE 4. The percentage change of Da for 193 counties in March 2020. The height of each bar is the average percentage change of all 193 counties, and the error bar indicates the standard deviation among all counties. The three tile categories of social, traffic, and work are shown in each column, and three daily tile aggregations of peak, average, and noon are shown in each row.

The increasing trend of Venables distance (Dv) implies declining concentration and rising distance among people, and the decreasing trend of activity density (Da) indicates less human activity compared with the beginning of this year. Due to the shelter-in-place policies, residents changed their daily activity patterns. More and more people reduced the nonessential outdoor activities (e.g., shopping in supermarkets, exercising in gyms, and eating at restaurants). Such changes in daily human activity patterns led to the change of Dv and Da. For the three categories, significant change can be seen in both social and traffic tiles, while the change in work tiles is not obvious. This is because the activities in work tiles could be essential activities. The Dv increased the most, around 15%, in social tiles, while the Da fell the most in traffic tiles, which is around 25%. Differences among the three types of daily tile aggregation were not significant. The percentage change of peak values is slightly greater than the other two values, indicating that peak values are influenced more by COVID-19, while average values are more stable. The following analysis uses peak values to calculate Dv and Da.

Histograms of average percentage change of Dv and Da for each county are shown in Figure 5. The average percentage change is calculated during the last week of March. The Dv values in the majority of counties increased, and Da values decreased for social and traffic categories, while the work category shows more even distribution around 0% for both Dv and Da. These histogram plots are consistent with the claim that human activities in work tiles are more essential than the other two (social and traffic), which did not show significant change during the COVID-19 study period.

FIGURE 5
www.frontiersin.org

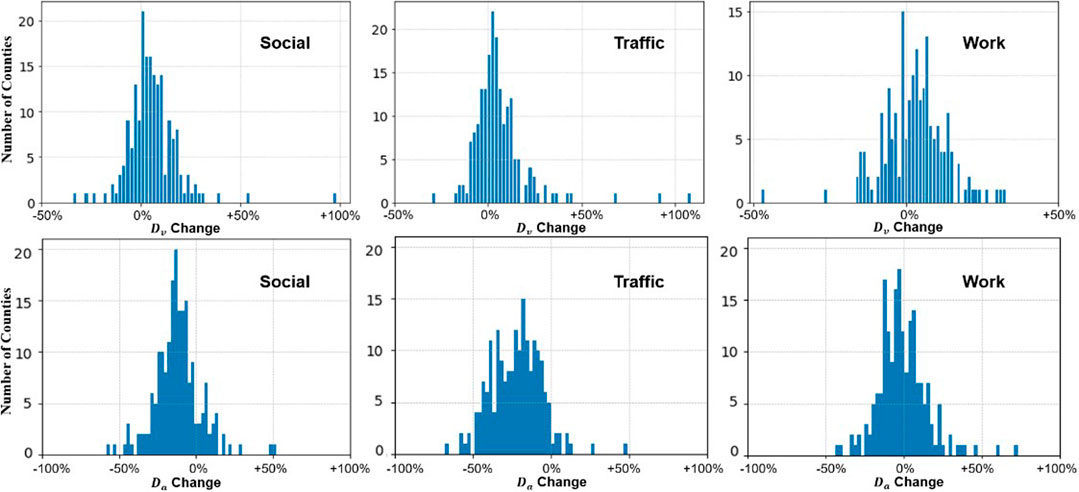
FIGURE 5. Histogram plots of average percentage change of Dv and Da (each row) for three different categories (each column).

While Dv and Da describe the different global characteristics of human activity—the Dv captures spatial distribution of human activity and the Da focuses on the intensity of human activity—they both reveal the insight of massive human activity patterns, which could have a quite significant influence on the spread of the virus. The correlation analysis between these two metrics and the basic reproduction number R0 becomes critical.

Time-Lagged Correlation Analysis

The spread of the coronavirus is closely related to the human activity patterns. In the previous section, we showed that the average distance between human activities (Dv) increased by 10%–15%, and the average human activity intensity (Da) decreased by 5%–10% for social tiles during March 2020 compared with the baseline period of January 2020. This result provides a good indication of the reduction in human activities in response to social distancing policies. In this section, we examine the extent to which the change in human activity metrics was related to the change in reproduction rate of coronavirus in the 193 counties under study. Hence, we conducted the time-lagged correlation analysis for the two human activity metrics calculated based on social, traffic, and work tile activity categories. Then all of the counties were grouped by the time lags. For each group, we counted the number of counties and summed the confirmed cases numbers. We plotted both the number of confirmed cases and the number of counties in Figures 6, 7 to show what the time lag is for most counties and for the most confirmed cases. The range of the confirmed cases numbers for different counties is large. The minimum confirmed cases number is 101, and the maximum number is almost 10,000 in New York Counties. That is why we used both of them to represent the result in a more comprehensive way. Figure 6 shows the time offset results between the Venables distance (Dv) change and the basic reproduction number (R0) for social, traffic, and work activity categories. Since the number of confirmed cases follows a skewed distribution during March 2020, the log scale is used to illustrate the results. The results show that, in majority of typical counties, the decline in the basic reproduction number (R0) happens 20–40 days after the increase in Venables distance. This result is consistent across all the three activity categories. In the right column of Figure 6, the bar charts show the correlation between the offset Dv and R0 within different p-value intervals. The average correlation coefficients (with p-values less than 0.05) are around 0.8 for each category, indicating a significant relationship between the increased distance among human activities and the decline in the virus spread speed. For the p-values greater than 0.05 (indicating no sufficient evidence to prove the correlation between two variables), the correlation indices are correspondingly smaller. The number of counties in each p-value interval shows that about 50% of the counties have p-values less than 0.001 for Venables distance calculated based on social and traffic activity tiles. The results related to work tiles, however, show a significant correlation between the two variables in a smaller number of counties.

FIGURE 6
www.frontiersin.org

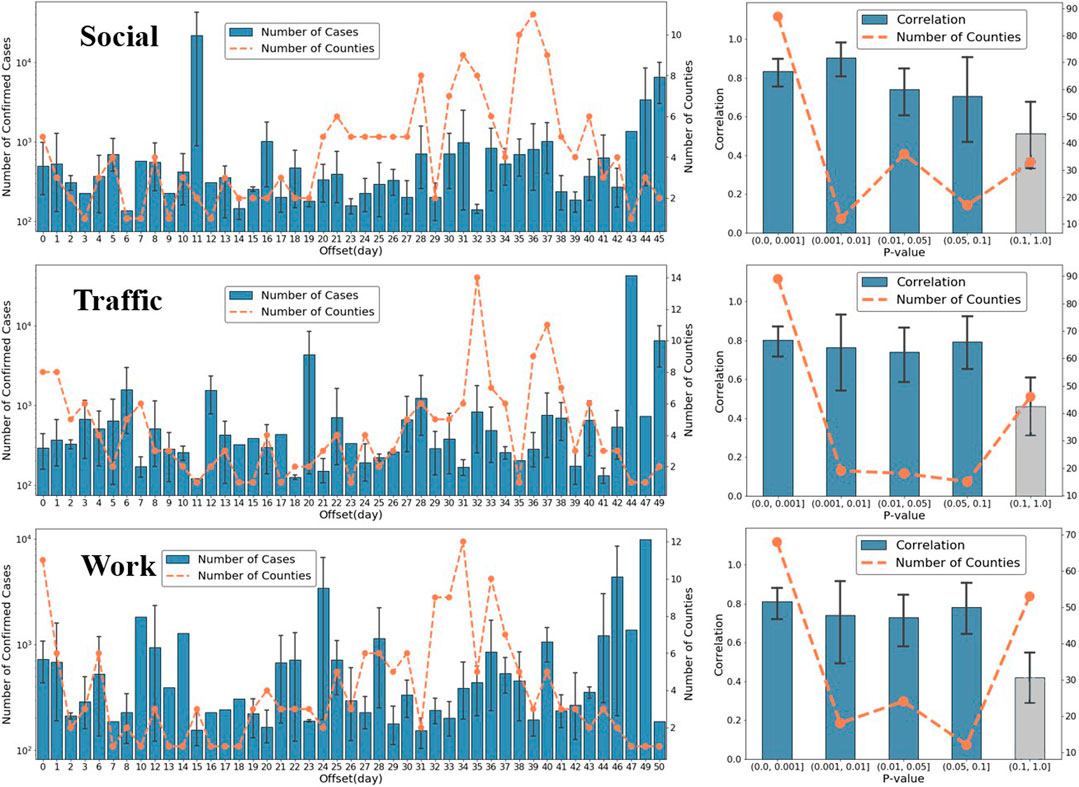
FIGURE 6. The time-lagged correlation analysis between Venables distance (Dv) change and reproduction number (R0). The left column shows the number of cases and the number of counties for different offset days, and the right column shows the correlation index and the number of counties with different p-value intervals. Each row presents one of the three tile activity categories: social, traffic, and work.

FIGURE 7
www.frontiersin.org

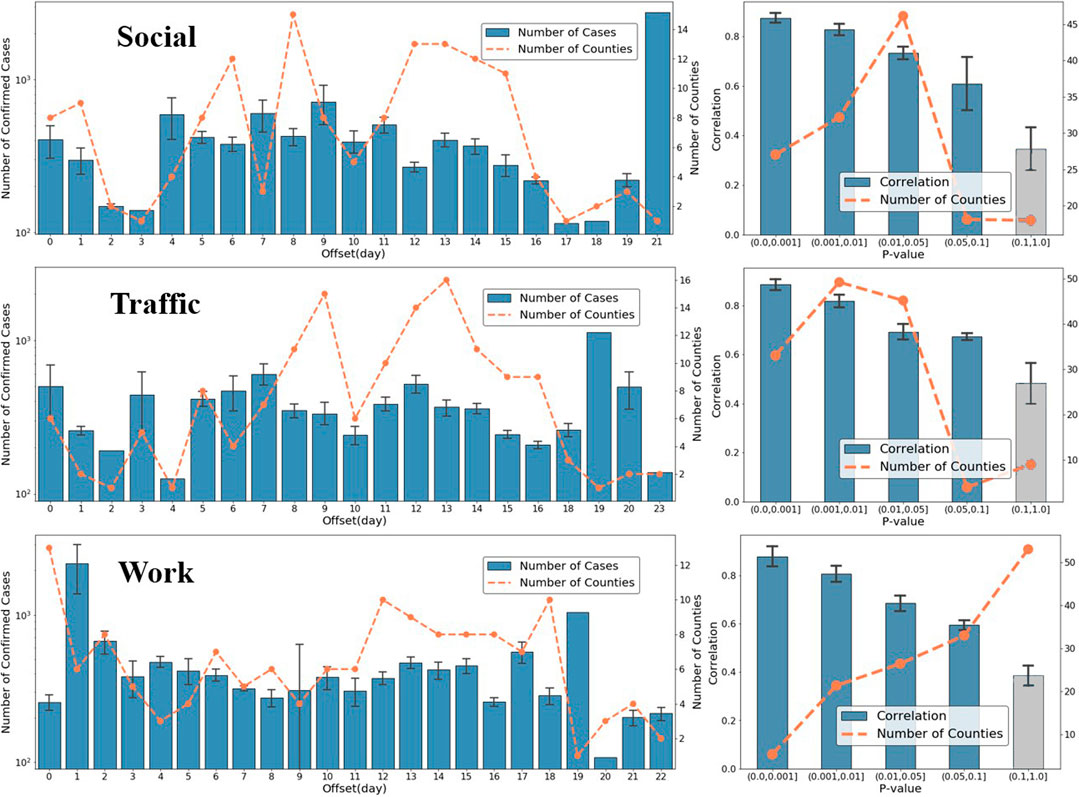
FIGURE 7. The time-lagged correlation analysis result between activity density (Da) change and reproduction number (R0). The left column shows the number of cases and the number of counties for different offset days, and the right column shows the correlation index and the number of counties with different p-value intervals. Each row presents one of the three tile activity categories: social, traffic, and work.

Figure 7 shows the time offset result between activity density (Da) change and reproduction number (R0) for the three activity categories. The results show that the decline in the basic reproduction number happens 6–17 days after the reduction of the activity intensity (Da); a similar result exists in all activity categories. The time lag is less than the one obtained for the Venables distance (Dv), which means that the spread of the virus responds to human activity intensity reduction more quickly than to human agglomeration reduction. In the right column of Figure 7, the bar charts show the correlation of offset Da and R0 in different p-value intervals. The average correlation indices for p-values less than 0.05 are around 0.9 for tile activity categories. This result indicates a significant relationship between the human activity intensity reduction and the decline in the virus spread speed. For p-values greater than 0.05, the correlation indices are smaller as well. The number of counties in each p-value interval shows that about 50% of counties have p-values less than 0.01 for social and traffic tiles, while the work tiles result shows p-values between 0.1 and 1.0 (indicating a nonsignificant correlation).

Heterogeneity for Different County Features

In the next step, we examined the variation of findings across counties with different population sizes, number of confirmed cases, and date of first confirmed cases. The goal is to examine the extent to which the correlation between the two metrics of human activities and the reproduction number is sensitive to these county features. The 193 counties were divided into three uniform categories according to population size and confirmed cases (on March 18, 2020) labeled high, medium, and low. Similarly, the first case dates were labeled as early, mid-range, and late for each one-third of counties. Then, the changes in Dv and Da (on March 31, 2020) were examined for each label in each tile category, and the results are plotted in Figure 8. Dv and Da show different heterogeneities facing these county features. In the left side of Figure 8, we cannot detect a clear difference in Dv value changes in different group. In the right side of Figure 8, however, we can observe that Da values decreased more in the counties with larger population size, higher confirmed cases number, and earlier first confirmed case, and such pattern exists for all the social, traffic, and work tiles. Based on the definition, Da represents the intensity of human activities. Based on this result shown in Figure 8, we can conclude that the intensity of human activities decreased more in counties with larger population size, higher confirmed cases number, and earlier first confirmed cases, which could imply a greater recognition and response to the pandemic risks in such counties.

FIGURE 8
www.frontiersin.org

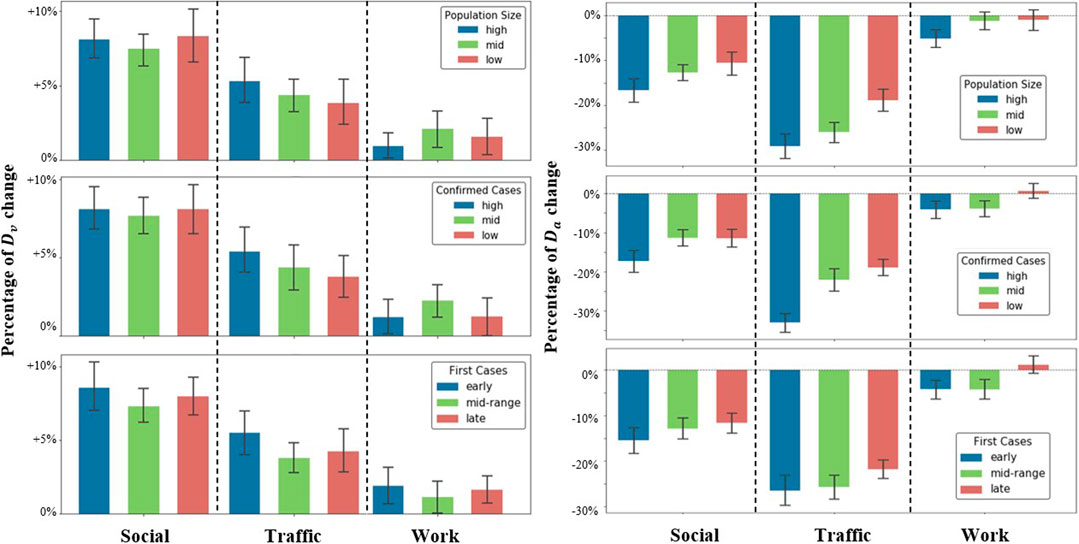
FIGURE 8. Change in Venables distances (Dv) and activity density (Da) across counties with different population sizes, confirmed cases number, and the date of first confirmed case in the three tile activity categories (social, traffic, and work).

Discussion

This study shows the utility of two human activity metrics [the Venables distance (Dv) and the activity density (Da)] as leading indicators of human activity for the spread speed of COVID-19 in the early stages of the outbreak. These metrics were derived from digital trace data obtained from Mapbox high-resolution temporal-spatial datasets. The results provide statistical evidence regarding the time-lag correlation between these two metrics and the basic reproduction number (R0) in the context of COVID-19. The results regarding the significant leader-follower relationship between human activities and the rate of spread of viral infections could be used by the public health officials and decision makers to monitor human activity and provide insights regarding the trends in the basic reproduction number in the future one to two weeks. For example, time lag indicates that the spread of the virus responds to human activity intensity reduction more quickly than to human agglomeration reduction. As for the heterogeneity of indicators, the result shows that the intensity of human activities decreased more in the counties with more population, more confirmed cases, and earlier first confirmed cases, which indicates a greater recognition and response to the pandemic risks in these counties.

There exist other studies that examined human mobility in the context of COVID-19. Wang et al. (2020) examined the similar time-lag effect of human mobility on the COVID-19 infections in the 80 cities most affected in China from Jan 17 to Feb 29. The results showed that the time lag is about 10 days. The index of intracity traffic volume (provided by Baidu) was used to represent the human mobility. Such highly aggregated data, however, may lose some critical spatial information about human activities. Xiong et al. (2020) analyzed mobile device data at each United States county for the COVID-19 period. The origin-destination travel demand and aggregate mobility inflow were used to represent the human activities, and the results showed the dynamics in a positive relationship between human mobility and COVID-19 transmission. Compared with the mentioned similar metrics describing human activities, the two indicators in this article (Dv and Da) capture both the agglomeration of activities and intensity of activities, which are two of the most important aspects of human activities during an epidemic. The Dv and Da are also easy to calculate based on the human activity data provided by Mapbox. They are the early indicators for authority to monitor in advance the spread of the virus in the future.

This study has some limitations which need to be improved in future studies. First, the tile activity categorization—social, work, and traffic—is not precise. One tile could be labeled as both social and work. In this study and due to data availability limitations, however, we classified tiles into only one of the three categories. Second, the CDC confirmed-cases data had limitations due to testing availability. In this study, we did not adjust the confirmed case data based on the extent of testing in different counties. A lack of testing in some areas resulted in the underestimation of the total cases.

Data Availability Statement

The data analyzed in this study is subject to the following licenses/restrictions: the data that support the findings of this study are available from Mapbox, but restrictions apply to the availability of these data, which were used under license for the current study and so are not publicly available. Requests to access these datasets should be directed to Mikel Maron, mikel@mapbox.com.

Author Contributions

Research design and conceptualization were carried out by XG, CF, and AM; data collection, processing, analysis, and visualization were performed by XG, CF, YY, SL, and QL; writing was done by XG and AM; reviewing and revising were made by all authors.

Funding

This work was supported by several grants including the United States National Science Foundation RAPID project #2026814, Urban Resilience to Health Emergencies: “Revealing Latent Epidemic Spread Risks from Population Activity Fluctuations and Collective Sense-making,” and Microsoft AI for Health COVID-19 Grant for cloud computing resources.

Conflict of Interest

The authors declare that the research was conducted in the absence of any commercial or financial relationships that could be construed as a potential conflict of interest.

Acknowledgments

The authors would also like to acknowledge that Mapbox provided digital trace telemetry data of human activity and that SafeGraph provided POI data. The authors would like to thank Kieran Gupta, Sofia Heisler, and Ruggero Tacchi from Mapbox for providing technical support.

References

Aleta, A., Martin-Corral, D., y Piontti, A. P., Ajelli, M., Litvinova, M., Chinazzi, M., et al. (2020). Modeling the impact of social distancing, testing, contact tracing and household quarantine on second-wave scenarios of the COVID-19 epidemic. medRxiv [Preprint]. Available at: https://doi.org/10.1101/2020.05.06.20092841 (Accessed May 18, 2020).

Google Scholar

Althaus, C. L. (2014). Estimating the reproduction number of Ebola virus (EBOV) during the 2014 outbreak in West Africa. PLoS Curr 6. doi:10.1371/currents.outbreaks.91afb5e0f279e7f29e7056095255b288

CrossRef Full Text | Google Scholar

Anderson, R. M., Heesterbeek, H., Klinkenberg, D., and Hollingsworth, T. D. (2020). How will country-based mitigation measures influence the course of the COVID-19 epidemic? Lancet 395 (10228), 931–934. doi:10.1016/S0140-6736(20)30567-5

PubMed Abstract | CrossRef Full Text | Google Scholar

Asgari, F., Gauthier, V., and Becker, M. (2013). A survey on human mobility and its applications. arXiv [Preprint]. Available at: https://arxiv.org/abs/1307.0814 (Accessed Jul 2, 2013).

Google Scholar

Balcan, D., Colizza, V., Gonçalves, B., Hu, H., Ramasco, J. J., and Vespignani, A. (2009). Multiscale mobility networks and the spatial spreading of infectious diseases. Proc. Natl. Acad. Sci. United States 106 (51), 21484–21489. doi:10.1073/pnas.0906910106

PubMed Abstract | CrossRef Full Text | Google Scholar

Barbosa, H., Barthelemy, M., Ghoshal, G., James, C. R., Lenormand, M., Louail, T., et al. (2018). Human mobility: models and applications. Phys. Rep. 734, 1–74. doi:10.1016/j.physrep.2018.01.001

CrossRef Full Text | Google Scholar

Caley, P., Philp, D. J., and McCracken, K. (2008). Quantifying social distancing arising from pandemic influenza. J. R. Soc. Interface 5 (23), 631–639. doi:10.1098/rsif.2007.1197

PubMed Abstract | CrossRef Full Text | Google Scholar

Chang, S. Y., Pierson, E., Koh, P. W., Gerardin, J., Redbird, B., Grusky, D., et al. (2020). Mobility network modeling explains higher SARS-CoV-2 infection rates among disadvantaged groups and informs reopening strategies. medRxiv [Preprint]. Available at: https://doi.org/10.1101/2020.06.15.20131979 (Accessed Aug 14, 2020).

Google Scholar

Chen, Y. C., Lu, P. E., Chang, C. S., and Liu, T. H. (2020). A Time-dependent SIR model for COVID-19 with undetectable infected persons. IEEE Transactions on Network Science and Engineering 7 4. arXiv [Preprint]. Available at: https://arxiv.org/abs/2003.00122 (Accessed Apr 28, 2020).

CrossRef Full Text | Google Scholar

Cintia, P., Fadda, D., Giannotti, F., Pappalardo, L., Rossetti, G., Pedreschi, D., et al. (2020). The relationship between human mobility and viral transmissibility during the COVID-19 epidemics in Italy. arXiv [Preprint]. Available at: https://arxiv.org/abs/2006.03141 (Accessed June 4, 2020).

Google Scholar

Delamater, P. L., Street, E. J., Leslie, T. F., Yang, Y. T., and Jacobsen, K. H. (2019). Complexity of the basic reproduction number (R0). Emerg. Infect. Dis. 25 (1), 1. doi:10.3201/eid2501.171901

CrossRef Full Text | Google Scholar

Dietz, K. (1993). The estimation of the basic reproduction number for infectious diseases. Stat. Methods Med. Res. 2 (1), 23–41. doi:10.1177/096228029300200103

PubMed Abstract | CrossRef Full Text | Google Scholar

Ellison, G. (2020). Implications of heterogeneous SIR models for analyses of COVID-19. Massachusetts, MA: National Bureau of Economic Research, Working paper No. w27373. doi:10.3386/w27373

CrossRef Full Text

Fan, C., Lee, S., Yang, Y., Oztekin, B., Li, Q., and Mostafavi, A. (2020). Effects of population co-location reduction on cross-county transmission risk of COVID-19 in the United States. arXiv [Preprint]. Available at: https://arxiv.org/abs/2006.01054. (Accessed Jun 1, 2020).

Google Scholar

Gao, S., Rao, J., Kang, Y., Liang, Y., and Kruse, J. (2020). Mapping county-level mobility pattern changes in the United States in response to COVID-19. Sigspatial Special 12 (1), 16–26. doi:10.1145/3404111.3404115

CrossRef Full Text | Google Scholar

Gatto, M., Bertuzzo, E., Mari, L., Miccoli, S., Carraro, L., Casagrandi, R., et al. (2020). Spread and dynamics of the COVID-19 epidemic in Italy: effects of emergency containment measures. Proc. Natl. Acad. Sci. U.S.A. 117 (19), 10484–10491. doi:10.1073/pnas.2004978117

PubMed Abstract | CrossRef Full Text | Google Scholar

Giordano, G., Blanchini, F., Bruno, R., Colaneri, P., Di Filippo, A., Di Matteo, A., et al. (2020). Modelling the COVID-19 epidemic and implementation of population-wide interventions in Italy. Nat. Med. 26, 855–860. doi:10.1038/s41591-020-0883-7

PubMed Abstract | CrossRef Full Text | Google Scholar

Gollwitzer, A., Martel, C., Marshall, J., Höhs, J. M., and Bargh, J. A. (2020). Connecting self-reported social distancing to real-world behavior at the individual and us state level. PsyArXiv [Preprint]. Available at: https://doi.org/10.31234/osf.io/kvnwp.

Google Scholar

John Hopkins University (2020). COVID-19 map - Johns Hopkins coronavirus resource center. Available at: https://coronavirus.jhu.edu/map.html (Accessed July 19, 2020).

Google Scholar

Keni, R., Alexander, A., Nayak, P. G., Mudgal, J., and Nandakumar, K. (2020). COVID-19: emergence, spread, possible treatments, and global burden. Front Public Health 8, 216. doi:10.3389/fpubh.2020.00216

PubMed Abstract | CrossRef Full Text | Google Scholar

Lampos, V., Moura, S., Yom-Tov, E., Cox, I. J., McKendry, R., and Edelstein, M. (2020). Tracking COVID-19 using online search. arXiv [Preprint]. Available at: https://arxiv.org/abs/2003.08086. (Accessed Jul 19, 2020).

Google Scholar

Li, Q., Bessell, L., Xiao, X., Fan, C., Gao, X., and Mostafavi, A. (2020a). Disparate patterns of movements and visits to points of interests located in Urban hotspots across US metropolitan cities during COVID-19. arXiv preprint [Preprint]. Available at: https://arxiv.org/abs/2006.14157 (Accessed Jun 26, 2020).

Google Scholar

Li, Q., Tang, Z., Coleman, N., and Mostafavi, A. (2020b). Detecting early-warning signals in time series of visits to points of interests to examine population response to COVID -19 pandemic. arXiv [Preprint]. Available at: https://arxiv.org/abs/2008.02905 (Accessed Aug 10, 2020).

Google Scholar

Liu, Q.-H., Ajelli, M., Aleta, A., Merler, S., Moreno, Y., and Vespignani, A. (2018). Measurability of the epidemic reproduction number in data-driven contact networks. Proc. Natl. Acad. Sci. U.S.A. 115 (50), 12680–12685. doi:10.1073/pnas.1811115115

PubMed Abstract | CrossRef Full Text | Google Scholar

Louail, T., Lenormand, M., Cantu Ros, O. G., Picornell, M., Herranz, R., Frias-Martinez, E., et al. (2014). From mobile phone data to the spatial structure of cities. Sci. Rep. 4, 5276. doi:10.1038/srep05276

PubMed Abstract | CrossRef Full Text | Google Scholar

Lu, T., and Reis, B. Y. (2020). Internet search patterns reveal clinical course of disease progression for COVID-19 and predict pandemic spread in 32 countries. medRxiv [Preprint]. Available at: https://doi.org/10.1101/2020.05.01.20087858 (Accessed Sep 16, 2020).

Google Scholar

Newman, M. E. (2002). Spread of epidemic disease on networks. Phys. Rev. E—Stat. Nonlinear Soft Matter Phys. 66 (1), 016128. doi:10.1103/PhysRevE.66.016128

CrossRef Full Text | Google Scholar

Nishiura, H., and Chowell, G. (2009). The effective reproduction number as a prelude to statistical estimation of time-dependent epidemic trends—Mathematical and statistical estimation approaches in epidemiology. Dordrecht, Netherlands: Springer, 103–121.

CrossRef Full Text

Ramchandani, A., Fan, C., and Mostafavi, A. (2020). DeepCOVIDNet: an interpretable deep learning model for predictive surveillance of COVID-19 using heterogeneous features and their interactions. IEEE Access 8, 159915–159930. doi:10.1109/ACCESS.2020.3019989

CrossRef Full Text | Google Scholar

SafeGraph (2020). Safe Graph weekly pattern Version 2. Available at: https://docs.safegraph.com/docs/weekly-patterns (Accessed Nov 4, 2020).

Google Scholar

Tian, H., Liu, Y., Li, Y., Wu, C. H., Chen, B., Kraemer, M. U. G., et al. (2020). An investigation of transmission control measures during the first 50 days of the COVID-19 epidemic in China. Science 368 (6491), 638–642. doi:10.1126/science.abb6105

PubMed Abstract | CrossRef Full Text | Google Scholar

Wang, X., Pei, T., Liu, Q., Song, C., Liu, Y., Chen, X., et al. (2020). Quantifying the time-lag effects of human mobility on the COVID-19 transmission: a multi-city study in China. IEEE Access 8, 216752–216761. doi:10.1109/ACCESS.2020.3038995

CrossRef Full Text | Google Scholar

World Health Organization (2020). WHO coronavirus disease (COVID-19) dashboard. Available at: https://covid19.who.int (Accessed Jul 19, 2020).

Google Scholar

Wu, N., Ben, X., Green, B., Rough, K., Venkatramanan, S., Marathe, M., et al. (2020). Predicting onset of COVID-19 with mobility-augmented SEIR model. medRxiv [Preprint]. Available at: https://www.medrxiv.org/content/10.1101/2020.07.27.20159996v2 (Accessed July 29, 2020).

Google Scholar

Xiong, C., Hu, S., Yang, M., Luo, W., and Zhang, L. (2020). Mobile device data reveal the dynamics in a positive relationship between human mobility and COVID-19 infections. Proc. Natl. Acad. Sci. U.S.A. 117 (44), 27087–27089. doi:10.1073/pnas.2010836117

PubMed Abstract | CrossRef Full Text | Google Scholar

Yabe, T., Tsubouchi, K., Fujiwara, N., Wada, T., Sekimoto, Y., and Ukkusuri, S. V. (2020). Non-compulsory measures sufficiently reduced human mobility in Japan during the COVID-19. arXiv [Preprint]. Available at: https://arxiv.org/abs/2005.09423 (Accessed May 18, 2020).

Google Scholar

Zhang, J., Litvinova, M., Liang, Y., Wang, Y., Wang, W., Zhao, S., et al. (2020a). Changes in contact patterns shape the dynamics of the COVID-19 outbreak in China. Science 368 (6498), 1481–1486. doi:10.1126/science.abb8001

PubMed Abstract | CrossRef Full Text | Google Scholar

Zhang, J., Litvinova, M., Wang, W., Wang, Y., Deng, X., Chen, X., et al. (2020b). Evolving epidemiology and transmission dynamics of coronavirus disease 2019 outside Hubei province, China: a descriptive and modelling study. Lancet Infect. Dis. 20 (7), 793–802. doi:10.1016/S1473-3099(20)30230-9

PubMed Abstract | CrossRef Full Text | Google Scholar

Keywords: COVID-19, early indicators, population activities, time lag relationship, Venables distance, activity density

Citation: Gao X, Fan C, Yang Y, Lee S, Li Q, Maron M and Mostafavi A (2021) Early Indicators of Human Activity During COVID-19 Period Using Digital Trace Data of Population Activities. Front. Built Environ. 6:607961. doi: 10.3389/fbuil.2020.607961

Received: 18 September 2020; Accepted: 29 December 2020;
Published: 04 February 2021.

Edited by:

Samiul Hasan, University of Central Florida, United States

Reviewed by:

Yuan Liao, Chalmers University of Technology, Sweden
Takahiro Yabe, Purdue University, United States

Copyright © 2021 Gao, Fan, Yang, Lee, Li, Maron and Mostafavi. This is an open-access article distributed under the terms of the Creative Commons Attribution License (CC BY). The use, distribution or reproduction in other forums is permitted, provided the original author(s) and the copyright owner(s) are credited and that the original publication in this journal is cited, in accordance with accepted academic practice. No use, distribution or reproduction is permitted which does not comply with these terms.

*Correspondence: Xinyu Gao, xy.gao@tamu.edu

These authors have contributed equally to this work

Download