 Slah Drira
 Sai G. S. Pai
 Ian F. C. Smith
- 1Applied Computing and Mechanics Laboratory (IMAC), School of Architecture, Civil and Environmental Engineering (ENAC), Swiss Federal Institute of Technology (EPFL), Lausanne, Lausanne, Switzerland
- 2Future Cities Laboratory, Singapore-ETH Centre, Singapore
In sensed buildings, information related to occupant movement helps optimize functions such as security, energy management, and caregiving. Due to privacy needs, non-intrusive sensing approaches for tracking occupants inside buildings, such as vibration sensors, are often preferred over intrusive strategies that involve use of cameras and wearable devices. Current sensor-based occupant-localization approaches are data-driven techniques that do not account for structural behavior and limited to slabs on grade. Varying-rigidity floors and inherent variability in walking gaits lead to ambiguous interpretations of floor vibrations when performing model-free occupant localization. In this paper, an extensive analysis of vibrations induced by a range of occupants is described. Firstly, the need for a structural-behavior model for occupant localization is assessed using two full-scale case studies. Structural behavior is found to significantly influence floor vibrations induced by footstep impacts. Since a simple relationship between distances from footstep-impact to sensor locations cannot be assured, the use of physics-based models is necessary for accurate occupant localization. Secondly, measured data are interpreted using physics-based models and information related to uncertainties from multiple sources. There are two types of uncertainties: modelling uncertainties and measurement uncertainties, including variability in walking gaits. Error-domain model falsification (EDMF) and residual minimization (RM) are model-based approaches for data interpretation. Unlike RM, EDMF explicitly accounts for the presence of systematic errors in parameters and overall model bias. In this paper, model-based occupant localization is carried out using EDMF and RM on a full-scale case study. By explicitly accounting for the presence of uncertainties and the influence of structural behavior, EDMF, unlike RM, accurately reveals possible occupant locations on floor slabs.
Introduction
Sensed buildings increasingly incorporate sophisticated technology to track occupants to provide services that enhance safety (Song et al., 2008), caregiving (Cully et al., 2011; Cully et al., 2012) and comfort (Erickson et al., 2013) of inhabitants. Information regarding occupant locations inside buildings may also be beneficial for energy saving and space management (Uotila and Skogster, 2007; Stoppel and Leite 2014; Diraco et al., 2015). The most commonly used techniques for occupant localization employ optical sensors including passive infrared sensors (Lu et al., 2010; Erickson et al., 2013) and cameras (Kamthe et al., 2009; Bamis et al., 2010). Also, radio-frequency identification devices including portable sensors (Fierro et al., 2012; Lazik et al., 2015), embedded Wi-Fi (Zeng et al., 2016; Lee et al., 2020) and Bluetooth beacons (Feldmann et al., 2003; Lazik et al., 2015) have been used for occupant localization. However, these sensing techniques require clear spaces and a dense deployment of sensors to provide accurate localization of occupants and above all undermine the privacy of building occupants (Tekler et al., 2020).
Alternative sensing approaches such as CO2 sensors (Candanedo and Feldheim 2016; Jiang et al., 2016), acoustic devices (Bian et al., 2005; Desai et al., 2011), smart-flooring systems (Yun, 2011; Serra et al., 2016) and vibration sensors (Richman et al., 2001; Mirshekari et al., 2018; Drira et al., 2019b) protect the privacy of occupants. A limitation of CO2-based approaches has been related to the slow spreading of CO2 within an indoor space. Also, air ventilation may compromise interpretation of CO2 concentrations inside buildings, leading to ambiguous results related to occupancy levels (Tekler et al., 2020). Acoustic-based methods have been found to be sensitive to ambient audible noise (Alpert and Allen, 2010; Geiger et al., 2014). Smart flooring systems have required highly instrumented floors (Yun, 2011; Serra et al., 2016). Such systems are not suitable for large full-scale applications (Tekler et al., 2020). This paper describes occupant detection and localization carried out using sensors measuring floor vibrations induced by human footsteps. Use of a physics-based model to interpret monitoring data from sparse configurations, as suggested in this paper, alleviates the requirement for dense instrumentation.
Typical data-driven techniques used to interpret vibration measurements have relied on evaluating time-difference-of-arrivals (TDoAs) of floor vibrations generated by a footstep at multiple sensors to triangulate occupant locations (Pakhomov et al., 2003; Schloemann et al., 2015; Lam et al., 2016; Mirshekari et al., 2018; Clemente et al., 2019). Model-free approaches provide precise results only for slabs on grade on ground floors and in basements (Mirshekari et al., 2018). Triangulation-based techniques are affected by the low signal-to-noize ratio (SNR) vibrations that result from the dispersive nature of typical floor slabs. Also, more complex structural configurations (upper floors) and the presence of elements (such as beams and walls) have limited their applicability (Bahroun et al., 2014; Mirshekari et al., 2018; Drira et al., 2019b). This has led to ambiguous localization results. Thus, highly instrumented floors are required to provide accurate localization (Bahroun et al., 2014; Pan et al., 2016) (∼one sensor per 2 m2).
Footstep impacts, characterized as an impulse, generate waves that travel through the floor slab. Floor slabs are typically approximated as solid plates that are freely supported in the vertical direction. Also, typical floor thicknesses are of the order of 20–30 cm. Since the ratio of wavelength to floor thickness is significant, waves resulting from a footstep impact are described as Lamb waves (i.e. plate waves) (Viktorov, 1970; Mirshekari et al., 2018).
However, Lamb waves are dispersive, which leads to distortion in the footstep-induced floor vibrations. These waves travel through the floor slab with frequency-dependent phase velocities (Worden, 2001; Lee and Oh, 2016; Pan et al., 2017). Mirshekari et al. (2018) have observed that the propagation of these waves in a dispersive medium resulted in shape changes of the floor signals induced by footstep impacts at sensors. Moreover, distortion effects of the wave propagation have been magnified by ambient noise (Mirshekari et al., 2016) and by support conditions leading to reflection issues (Gregory and Gladwell, 1983). This has led to ambiguous interpretations of TDoAs resulting in inaccurate occupant localizations (Mirshekari et al., 2016).
Data-driven techniques have been shown to provide accurate localization only when there is a monotonic relationship between signal characteristics and the distance from footstep-impact to sensor locations. An inversely proportional decay between distance from footstep-impact to a sensor location and impulse energy was shown by Pan et al. (2014). However, it has been shown by Drira et al. (2019b) and Pai et al. (2019) this relationship is not always observable due to the presence of support conditions such as columns and walls leading to varying rigidity of floors.
Preliminary analysis by Pai et al. (2019) has shown that due to the influence of structural behavior on floor vibrations, there is a need for model-based approaches for occupant localization. In addition, a sensitivity analysis over several signal characteristics was carried out to find suitable metrics for model-based occupant localization. However, this analysis was limited to a small area of a floor slab (∼35 m2) with measurements from only two occupants walking on floor. A more comprehensive evaluation of measurements from multiple occupants walking on larger area of full-scale floor slabs is necessary to ascertain effects of structural behavior on occupant localization.
Use of physics-based models introduces knowledge of structural behavior while interpreting data and may overcome shortcomings of current data-driven techniques. A model-based approach using error-domain model falsification (EDMF) has been shown to provide accurate localization (Reuland et al., 2017b; Drira et al., 2019b; Drira et al., 2019c; Drira et al., 2019d) and precise tracking of a single occupant (Drira et al., 2019b; Drira et al., 2019c; Drira et al., 2019d). EDMF is a population-based approach that explicitly accommodates systematic errors and model bias to provide accurate identification.
Another existing model-based approach for data-interpretation is residual minimization (RM) (Catbas and Kijewski-Correa, 2013). However, RM has been found to be sensitive to noisy measurements. Applications of RM have involved the assumption that residuals between simulated and measured responses were constrained only by the choice of model parameters to be identified (Mottershead et al., 2011). Moreover, uncertainties from each measurement source have been assumed to be independent. While more complicated formulations and the addition of fitting parameters are possible using RM, it has not been demonstrated that greater complication results in greater accuracy.
Furthermore, RM cannot account for the presence of multi-source model bias due to use of safe design models as well as systematic parameter uncertainties that vary with position in real applications. The presence of systematic bias and correlation between measurements (Simoen et al., 2013) do not satisfy typical assumptions of zero-mean independent Gaussian estimations of uncertainties (Jiang and Mahadevan, 2008; McFarland and Mahadevan, 2008). These inappropriate assumptions have resulted in many cases of inaccurate interpretations of data using RM in engineering applications, for example see (Beven, 2000; Pai et al., 2018).
In the context of model-based data interpretation approaches for locating building occupants, simulated and measured vibrations have been prone to large magnitudes of uncertainties. Potential uncertainties have originated from the natural variability in walking gaits of the same person and between individuals (Drira et al., 2019d). Variability in walking gaits have been engendered by sources such as individual anatomy, walking speed, shoe type, health and mood (Gage et al., 1995; Racic et al., 2009; Pan et al., 2015). The variability in gait of an occupant walking at the same location multiple times and wearing hard and soft-soled shoes has resulted in a relative measurement uncertainty of ±45% (Drira et al., 2019d). In the context of occupant localization, no previously published research has evaluated the accuracy of model-based occupant localization while accommodating systematic errors and model bias.
In this paper, an analysis of vibration measurements from multiple people is carried out to observe the influence of structural behavior on floor vibrations. This analysis involves evaluations of measurements from two full-scale case studies to demonstrate the need for model-based approaches for occupant localization. Then, EDMF, which accommodates uncertainties from multiple sources, is used to localize five occupants walking individually on a full-scale floor slab. Results are compared with those obtained using RM.
The paper starts with a description of model-based occupant localization strategies (Model-Based Methodologies for Occupant Localization section). Empirical analyses to evaluate the influence of structural behavior on footstep-impact vibrations are presented in Influence of Structural Behavior on Floor Vibrations under subheading of CASE-STUDY 1 and Influence of Structural Behavior on Floor Vibrations under subheading of Case-Study 2 sections, based on vibration measurements from two full-scale floor slabs. An evaluation of the relationship between signal magnitudes and footstep-impact locations is then provided in Relationship Between Signal Magnitudes and Occupant Locations under subheading of Case-Study 1 and Relationship Between Signal Magnitudes and Occupant Locations under subheading of Case-Study 2 sections. Subsequently, inter- and intra-subject variability in walking gaits is examined in Variability in Walking Gaits section. Finally, the application of model-based occupant-localization strategies to a full-scale floor slab is described in Model-Based Occupant Localization section. In Summary and Discussion section, results obtained from both case studies are discussed.
Model-Based Methodologies for Occupant Localization
Model-based methodologies involve comparing floor-vibration measurements with simulated footstep impacts to identify occupant locations. Measured floor vibration signals induced by footsteps are extracted from continuous streams of data from multiple sensors using a model-free technique developed by Drira et al. (2019a). Once signals from these sensors corresponding to a footstep are extracted, they are compared with model simulations to determine possible locations of an occupant on the floor slab. In the context of model-based data interpretation approaches, simulated and measured floor responses are prone to multiple sources of uncertainty. In the following sections, description of uncertainty sources and two model-based methodologies for interpreting vibration measurements are presented.
Modelling and Measurement Uncertainties
Development of physics-based models is an idealization of reality. Choices that are made to build a numerical model are inherently subjective to constraints such as time and prior knowledge. These subjective choices lead to modelling uncertainties as defined by Walker et al. (2003). Modelling uncertainties can be separated into two categories, aleatory and epistemic (Der Kiureghian and Ditlevsen, 2009). Aleatory uncertainties are intrinsic to the randomness of a phenomena. These uncertainties are thus assumed to be irreducible. Uncertainties that arise from lack of knowledge are presumed to be epistemic. The epistemic uncertainties are reducible with appropriate additional information.
Typical modelling uncertainties in civil engineering include support and boundary conditions, material and geometrical properties, as well as analysis details such as the choice of element type in finite-element modelling. These sources are mostly epistemic uncertainties. In the context of occupant localization, idealized loading to simulate footstep impacts may also increase modelling uncertainties.
Model predictions are also prone to uncertainties from sources such as simplification and omissions, which lead to systematic difference between simulated and measured responses. In this paper, these uncertainties are referred to as model bias. A literature survey on modeling assumptions that are assumed with the respect of omissions and simplifications has been presented by Goulet et al. (2014) and more recently by Simoen et al. (2015). Systematic errors and model bias need to be considered in the model-based approaches to ensure accurate identification (i.e. localization). Sources of modelling uncertainties, in the context of occupant localization, are further described in Uncertainty Estimation section.
Measurements are also prone to uncertainties from multiple sources. Measurement uncertainties include the resolution and precision of sensors, connection variations, and cable losses. For the application of occupant localization, in this paper, the natural variability in walking gaits can also contribute to variability in floor-vibration measurements. Occupants walk with different styles according to their walking speed, type of shoes, moods and health (Öberg et al., 1993; Gage et al., 1995; Hausdorff, 2007). This may lead to a significant variability in walking gaits from the same person and among individuals. Differences are denoted as inter- and intra-subject variability. Variabilities can also be classified as either aleatory or epistemic uncertainties depending on factors affecting gait patterns of occupants. Walking-gait variability in measurement is discussed in Variability in Walking Gaits section in which external factors that affect the walking-gait patterns are also described. Quantification of modelling and measurement uncertainties has generally been based on engineering judgment and prior observations (Pasquier et al., 2016; Pai et al., 2018; Drira et al., 2019b).
Residual Minimization (RM)
Residual minimization (RM) has been the most common data-interpretation technique utilized by practicing engineers to solve inverse problems for several decades, due to its simple formulation (Schlune et al., 2009; Catbas and Kijewski-Correa, 2013). Also referred to as “curve fitting” and “model calibration,” RM originates from the work of Gauss and Legendre (19th century) (Sorenson, 1970) on least-squares fitting. The RM approach is intended to minimize the difference between model predictions and actual measurements so as to determine the optimal (i.e. the most likely) model parameters. A typical RM formulation is described by the objective function shown in Eq. 1.
In Eq. 1 the optimal model-parameter set (
Parameter identification using RM has employed various optimization algorithms such as genetic algorithms (Chou and Ghaboussi, 2001) and particle-swarm optimization (Nanda et al., 2014). RM has also been performed by trial and error to estimate optimal parameters (Sanayei et al., 2012). In this paper, an exhaustive search is applied for localization where residuals are assessed from measured and pre-simulated floor responses. These simulated floor responses are induced by footstep impacts at possible locations. Thus, localization procedure using RM is a constrained satisfaction procedure.
Error-Domain Model Falsification (EDMF)
Error-domain model falsification (EDMF) is a population-based approach proposed by Goulet and Smith (2013). EDMF involves generation of an initial set of model instances (i.e. simulations) of a system to interpret its behavior regarding measured data (Tarantola, 2006). The initial model population is produced using possible ranges of parameter values that are obtained based on prior information about a system and engineering knowledge. Predictions obtained using physics-based models are then compared with the measured structural response using compatibility metrics to identify candidate models among the initial population. Based on prior estimation of uncertainties from multiple sources, model instances that are not falsified form a candidate-model set.
Assuming θ is the vector of model parameter values which correspond to cartesian coordinates (to be found) of occupant locations in this study and
The true (unknown) structural response at a measurement location i, denoted as
In Eq. 2,
Modelling (
Measurement and modelling uncertainties are subsequently combined using Monte Carlo sampling. The combined uncertainty (
In Eq. 4,
Regarding occupant-localization applications, following Drira et al. (2019b) and introduced above, θ represents x and y coordinates of possible occupant locations on the floor slab. The residual, which is the difference between footstep-impact simulations and footstep-event (e) measurement is denoted as
Using the initial location set, for each detected footstep event (
The identification of occupant locations is not computationally expensive since pre-simulated footstep impacts at a grid of possible locations compared with measured footstep-event signal. This allows repeated use of the same simulations for multiple comparisons with all measured footstep-event signals. Thus, the falsification process allows a near-real-time localization of occupant footsteps.
Sequential Analysis
Resulting CLSs are subjected to a sequential analysis that combines information about consecutive footstep events, as described in detail by Drira et al. (2019b). The sequential analysis involves the assumption that the distance between two consecutive footstep impacts cannot exceed a predefined average step length (approximately 70 cm) (Figueiredo et al., 2005; Racic et al., 2009). A candidate location is rejected when its minimum distance from the CLS of the preceding footstep event is greater than the predefined distance. Thus, the sequential analysis has the potential to reduce ambiguity within the CLSs of footstep events to increase localization precision.
Case-Study 1
Description
A preliminary evaluation of the influence of structural behavior on floor vibrations induced by footstep impacts is demonstrated using a large area of a full-scale floor slab that is shown in Figure 1. The relationship between signal magnitudes of detected footstep events and occupant locations is evaluated using the case study. The case study involves a reinforced-concrete slab located in a multi-story building in Switzerland. The floor slab is 20 cm thick and the floor surface is covered with a linoleum-based finishing. This case study includes a corridor and four offices (Offices A, B, C and D in Figure 1), and covers a surface of approximately 100 m2.
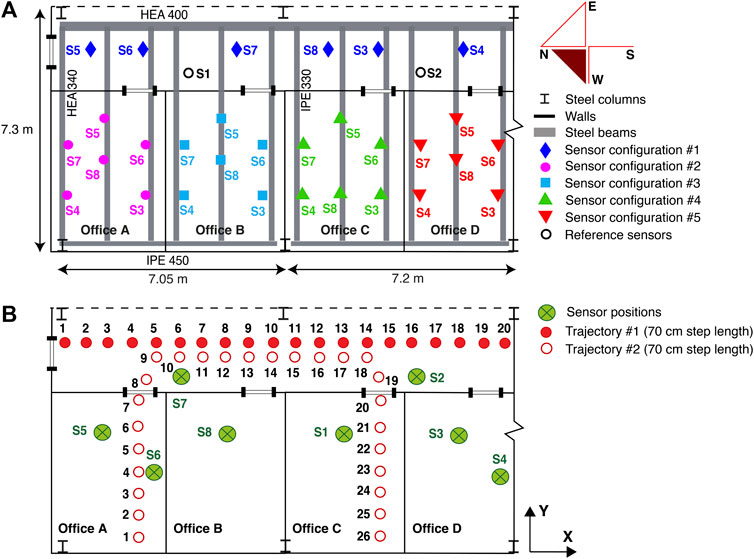
FIGURE 1. Case-Study 1. (A) In an initial commissioning stage, five sensor configurations used to record ambient vibrations for modal analysis. (B) Sensor configuration used to study the influence of the structure on recorded footstep-induced floor vibrations.
The reinforced-concrete slab rests on a steel frame composed of two H-beams and 13 I-beams, and it is supported by six steel columns, as shown in Figure 1. Separation walls made of plasterboard are underneath and above the structure. The floor is connected to reinforced concrete walls at the west end of the slab. The east end is free. The south end of the slab is connected to the remaining part of the structure (continuity of the floor slab). The north end of the slab is connected to a structural masonry wall.
Vertical velocity-response of the slab was captured using uni-directional vibration sensors (Geophones SM-24 by I/O Sensor Nederland). The floor vibrations were recorded using an acquisition unit (NI USB-6003) with a sampling rate of 1000 Hz. As shown in Figure 1A, eight vibration sensors in five configurations were used to record ambient vibrations. Ambient vibrations were recorded for 20 min for each set of sensors. In an initial commissioning stage, these measurements were used to perform an initial modal analysis of the floor slab. Since sensors were simply placed on top of the floor slab, they were easily moved from one configuration to another. Ambient vibrations were recorded separately at sensors of each configuration. Thereby, Sensors S1 and S2, placed at quarter-span and three-quarter-span of the corridor (see Figure 1A), were used as references to assess the fundamental mode shapes. Sensor layouts, as shown in Figure 1A, were chosen to cover the entire floor space while accommodating the positions of office furniture in order to provide good estimates of bending mode shapes. While such coverage was not sparse, it was only employed for an initial study, prior to localization measurements.
Figure 1B shows sensor locations that have been used to measure footstep-induced floor vibrations. Measurements were carried out for a single occupant walking along two fixed trajectories (dots and circles in Figure 1B) with a moderate walking speed of 1.6 Hz and wearing hard-soled shoes. Trajectory #1 started from the north end of the corridor and ended at the south end, leading to 20 footstep-impact locations. Trajectory #2 extended from the west end of Office B to the west end of Office C, leading to 26 footstep-impact locations. Walking tests following trajectories # 1 and #2 were repeated 10 times.
Modal Analysis
In an initial commissioning stage, modal analysis is carried out prior to the evaluation of footstep-induced floor vibrations to understand the structural behavior of the floor. The frequency-domain decomposition approach (FDD) (Wang et al., 2016) is used to ascertain vertical mode-shapes that correspond to fundamental bending modes of the floor slab. FDD also implicates evaluation of the cross-power spectral density (CPSD) (Kanazawa and Hirata, 2005) of ambient vibrations that are recorded by each sensor configuration (see Figure 1A). Matrices resulting from the CPSD operation are then decomposed into singular values and vectors.
Fundamental frequencies of the floor slab are identified using the resulting singular values. Estimates of mode shape of the fundamental frequencies are defined by the singular vectors. Higher magnitudes of the first singular values for each sensor configuration reveal the modes with most energy contribution to vertical bending. The modes of the floor slab with most energy contribution to vertical bending have frequencies between 20 and 40Hz. Estimates of the fundamental bending modes of the structure are at frequencies of 20 and 27.5Hz.
In Figure 2, the deformed-shape patterns that correspond to the first and the second modes of the floor slab of Case-Study 1 (see Figure 1) are shown. In Figure 2 diamonds, circles, squares, upward- and downward-pointing triangles are deformed shape amplitudes at positions defined by sensor configurations #1 to #5 (see Figure 1A). The amplitude of the deformed shape at each sensor location is normalized by the deformed-shape amplitude given by the reference Sensor S2 (see Figure 1A). Boxes represent the locations of steel columns. Empty circles represent the reference amplitudes at each sensor location. Dashed lines indicate the free end of the slab (see Figure 1).
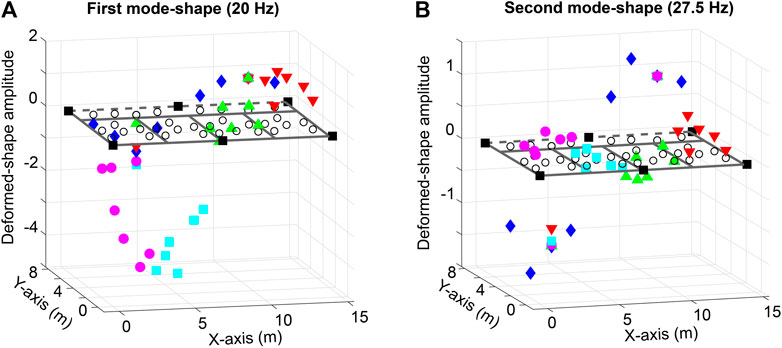
FIGURE 2. Normalized deformed-shape amplitudes corresponding to the first and second modes of the floor slab of Case-Study 1.
The mode shape at 20 Hz, as shown in Figure 2A, governs the fundamental mode of the floor slab that mainly affects the office region. The mode shape at 27.5 Hz, as shown in Figure 2B, governs the behavior of the corridor region of the floor slab. Maximum amplitudes associated with the first mode-shape are located at the quarter-span and the three-quarter-span of the floor slab. The mode shape at frequency of 27.5 Hz (see Figure 2B) also governs the second mode of the floor within the office region. Amplitudes associated with the second mode-shape present local maxima at quarter-span, three-quarter-span and mid-span of the floor slab.
The resulting deformed shape amplitudes are compared with recorded footstep-induced floor vibration at various locations to understand the effect of the structural behavior. Details of this analysis are presented in the following section.
Influence of Structural Behavior on Floor Vibrations
The influence of structural behavior on floor vibrations is assessed using measurements from occupants walking on the floor. These measurements are recorded from the floor of office environment using the sensor configuration shown in Figure 1B. Footstep impacts are from a walking occupant following Trajectory #1, as shown in Figure 1B. Standard deviation (σ) values of extracted footstep-impact signals at several sensors are used to characterize the detected footstep events. The standard deviation (σ) of recorded signals is expressed mathematically through the following equation:
In Eq. 6,
Standard deviation (σ) values of processed footstep-event signals in terms of velocity are illustrated in Figure 3. In Figure 3, the σ values are presented as a function of footstep-impact locations. Footstep-induced floor vibrations are decomposed using CWT and reconstructed using IWT at a frequency range of 20–40 Hz corresponding to frequencies of the first few bending modes of the floor slab (see Modal Analysis section). This frequency range helps increase the SNR of extracted footstep-impact signals. Bars represent the variability of 10 measurements defined as one standard deviation. Circles correspond to the mean values. In Figure 3A, σ values are for footstep-impact signals that are recorded by sensors S2 and S7 at impact locations #1 to #20, as shown in Figure 1B. Sensors S2 and S7 are placed at quarter-span and three-quarter-span of the corridor (see Figure 1B). In Figure 3B, σ values are for footstep-impact signals that are recorded by sensors S5, S6 and S8. These sensors are placed inside Offices A and B, that define half of the region at the north end of the floor slab (see Figure 1B).
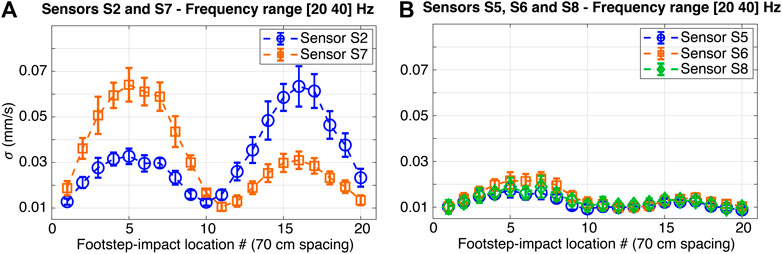
FIGURE 3. Standard deviation (σ) values of footstep-impact signals in terms of velocity spaced at 70 cm. Footstep impacts are from a walking occupant following Trajectory #1 on the floor of Case Study 1 (see Figure 1B). (A) σ of footstep-impact signals recorded by sensors S2 and S7. (B) σ of footstep-impact signals recorded by sensors S5, S6 and S8.
Average standard deviation (σ) values of low-frequency components of footstep-impact signals, in Figure 3, reveal an increasing trend to a maximum when footstep-impact locations are close to quarter-span and three-quarter-span of the corridor. The trend of these σ values follows the deformed shapes governed by the fundamental modes of the floor slab, as shown in Figure 2. In Figure 3B, average σ values of the recorded signals by sensors S5, S6 and S8 result in similar magnitude levels for all footstep locations, while locations of these sensors are scattered on the mid-span of the floor. This demonstrates the influence of the structure on vibration measurements, since the locations of sensors S5, S6, and S8 belong to a region presenting similar floor rigidity (see Figure 2).
Moreover, average standard deviation (σ) values of the footstep events recorded by sensors S5, S6, and S8 (see Figure 3B) have lower magnitudes (up to 64% less) compared with signals recorded by Sensor S7 (see Figure 3A). These discrepancies arise from the close distances between footstep-impact locations and the location of Sensor S7 compared with other sensors. Similar results are observed for measurements recorded at Sensor S2 and compared with sensors S1, S3 and S4 (see Figure 1B).
In addition, comparing event signals induced by footsteps at locations #1, #2 and #3 and recorded by sensors S5 and S7, standard deviation (σ) values present a significant discrepancy in magnitudes while these impact locations are at equal distances to sensors (see Figure 3). This disparity in magnitudes between sensors S5 and S7 arises from the varying rigidity of the floor slab between the corridor and the offices due to difference in boundary conditions and presence of separation walls (see Figure 1). Low-frequency components of recorded footstep-impact signals are thus affected by the structural behavior of the floor slab as well as non-structural elements such as separation walls. This necessitates a model-based approach for occupant-localization.
Relationship Between Signal Magnitudes and Occupant Locations
Standard deviation (σ) values of processed signals generated by footstep impacts captured at sensors S2 and S7 from Case-Study 1 (see Figure 1B) are illustrated in Figure 4. The σ values are presented as a function of the distance between footstep impacts to sensor locations. In Figure 4, footstep impacts are from an occupant walking along Trajectory #1 (a and b) and Trajectory #2 (c and d). Circles and squares represent the mean σ values of detected footstep-event signals. Bars represent the variability of 10 measurements defined as one standard deviation.
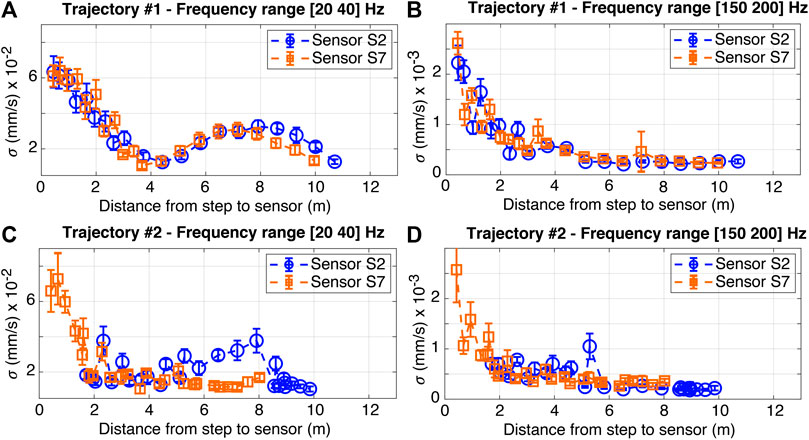
FIGURE 4. Standard deviation (σ) values of processed signals generated by footstep impacts captured at sensors S2 and S7 from Case-Study 1 (see Figure 1B). Footstep impacts are from a walking occupant following Trajectory #1 (A, B) and Trajectory #2 (C, D). Signals are decomposed and reconstructed at frequency ranges of 20–40 Hz (A, C) and 150–200 Hz for (B, D).
Footstep-event signals are decomposed using CWT and reconstructed using IWT at frequency ranges of 20–40 Hz as shown in Figures 4A,C. High-frequency components of event signals are extracted at a frequency range of 150–200 Hz as shown in Figure 4B,D. This high-frequency range is chosen based on the given bandwidth of the vibration sensors (see Description section). It has been shown empirically by Drira et al. (2019b) that the amplitudes of footstep-impact signals in this frequency range have the best sensitivity to footstep-impact locations for this case study.
Standard deviation (σ) values assessed for low-frequency components of impact signals, as shown in Figure 4A, present a decreasing monotonic trend for footstep impacts (following Trajectory #1) that are adjacent to the locations of sensors S2 and S7 (see Figure 1B). An increasing trend to a maximum is observed for footstep impacts that are distant from the locations of sensors S2 and S7. This change in the trend of σ values arises from the presence of a column as a support condition in the middle of the walking trajectory (see Trajectory #1 in Figure 1B). The occurrence of an impact load at a mid-span region of the floor slab generates a displacement of the adjacent region of the floor slab. This can also be explained by the first bending mode of the floor slab, as shown in Figure 2A.
Similarly, standard deviation (σ) values that are assessed for low-frequency components of impact signals as shown in Figure 4C reveal a non-monotonic relationship between distances from footstep-impact locations (following Trajectory #2) to Sensor S2 (see Figure 1B). Footstep impacts that define maximum σ values are 2 and 8 m away from Sensor S2. These fluctuations in the resulting trend are due to the excitation of the fundamental modes related to the corridor and the offices (see Figure 2) when an occupant walks between offices. Thus, structural behavior of the slab is found to have significant influence on floor vibrations induced by footstep impacts. The structural behavior varies spatially due to changes in fundamental mode governing the response of the varying rigidity of the floor slab. This justifies the necessity for model-based approaches for occupant localization.
Standard deviation (σ) values that are assessed for high frequency components of impact signals reveal a monotonic relationship between distances from footstep-impact locations (following trajectories #1 and #2) to sensors S2 and S7, as shown in Figures 4B,D. High frequency components of footstep-impact signals are found to not follow the behavior of the floor slab. Thus, the high frequency components of recorded signals are not significantly affected by global structural behavior. However, from a distance of 2 m and above, the overall trend resulting from σ values at high-frequency ranges contains several fluctuations. Wave propagation induced by footstep impacts inside offices is subjected to obstructions such as walls, vertical beams and furniture that affect local modes (i.e. high frequency modes). Therefore, high-frequency components of measured floor-vibration response are not always useful for occupant localization.
It is concluded that low-frequency components of impact signals are dominated by global structural effects and high-frequency components of impact signals are dominated by impact positions and local structural effects. Therefore, in this situation, a combination of information from low and high frequency components are taken into account for occupant localization using a structural-model-based approach.
Case-Study 2
Description
An analysis of vibration measurements from multiple people walking individually is carried out on a second full-scale case study, as described in Figure 5. The analysis of these measurements is used to demonstrate once more the need for model-based approaches for occupant-localization applications. The relationship between signal magnitudes of detected footstep events and occupant locations is also evaluated using this case study. The application of model-based occupant-localization strategies explained in Model-Based Methodologies for Occupant Localization section are carried out.
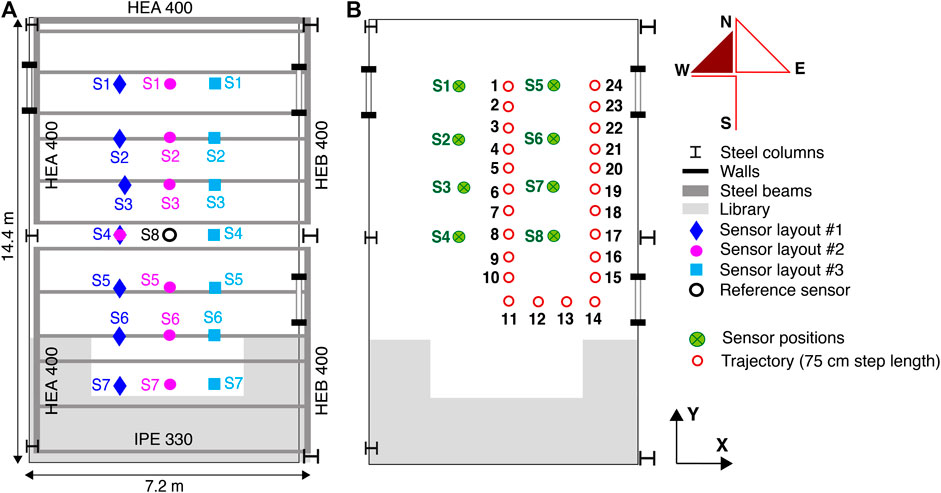
FIGURE 5. Case-Study 2. (A) In an initial commissioning stage, three sensor configurations used to record ambient vibrations for modal analysis during the commissioning stage. (B) Sensor configuration used to study the influence of the structure on recorded footstep-induced floor vibrations and for the application of model-based occupant localization approaches.
The floor of the Case-Study 2 is a reinforced-concrete slab located in the same multi-story building as Case-Study 1 (see Figure 1). This case study covers a surface of approximately 100 m2. The reinforced-concrete slab rests on a steel frame composed of five H-beams and 12 I-beams and is supported by six steel columns, as shown in Figure 5. The east end and upper half of the west end of the slab are connected to the remaining part of the structure (giving continuity of the floor slab). A non-structural wall made of plasterboard is above the structure on the east end. The lower half of the west end and the south end of the slab are connected to prefabricated reinforced concrete walls. The remaining parts of the slab are joined to masonry walls.
The floor slab of Case-study 2 was instrumented with the same vibration sensors as used for the floor of Case-Study 1 (see Description section). Similar to Case-Study 1, the floor vibrations in terms of velocity were recorded with a sampling rate of 1000 Hz. In Figure 5A, eight vibration sensors following three configurations were used to record ambient vibrations. Ambient vibrations were recorded for 20 min for each set of sensors. In an initial commissioning stage, these measurements were used to perform modal analysis of the floor slab during the commissioning stage. Sensor S8, placed at mid-span of the floor (see Figure 5A), was used as a reference to assess the fundamental mode shapes. Sensor layouts, as shown in Figure 5A, were chosen to cover the entire floor space in order to provide good estimates of bending mode shapes.
In Figure 5B, sensor locations that were used to measure footstep-induced floor vibrations are shown. Measurements were carried out from five people walking individually along a fixed trajectory. Information related to occupant weights are presented in Table 1 where occupants O1 to O5 weights ranged from 58 to 92 Kg. Occupants walked along fixed footstep-impact locations (28 locations separated by 75 cm as step length) and at fixed speeds.
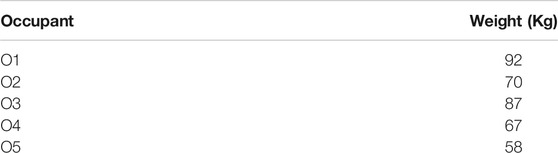
TABLE 1. Occupant characteristics.
The test for each occupant walking was repeated with two types of shoes (hard-and-soft soled shoes) and five speeds. Walking speeds (in terms of steps per second) were 1.4; 1.6; 1.8; 2 and 2.2 Hz. Measurements were repeated on average 14 times for each occupant wearing a particular shoe type and walking at a fixed speed. For each impact location an average of 700 measurements were recorded. These measurements are used to analyze the relationship between footstep-impact locations and signal characteristics. They are also used to quantify the inter- and intra-subject variability in walking-gaits.
Additional vibration measurements recorded by all sensors (one sensor per ∼10 m2), as presented in Figure 5B, were used for the application of model-based occupant-localization strategy explained in Model-Based Methodologies for Occupant Localization section. Localization resulting using EDMF were compared with other model-based approches such as residual minimization (RM) explained in Model-Based Methodologies for Occupant Localization section. In practice, vibration sensors can be fixed underneath the floor slab, where they do not impair building functionality. Measurements were from the same occupants (see Table 1) walking individually along the same trajectory (see Figure 5B). Each occupant walked at the same speed levels (1.4; 1.6; 1.8; 2 and 2.2 Hz) leading to 25 walking tests.
Modal Analysis
Ambient vibrations recorded using the sensor configuration shown in Figure 5A are processed using FDD approach as explained in Model Analysis section to extract the fundamental bending modes of the floor slab of Case-Study 2. The modes of the floor slab with most energy contribution to vertical bending have frequencies between 15 and 40 Hz. Estimates of the fundamental bending modes of the structure are at frequencies 15.5 and 24 Hz. The deformed-shape patterns that correspond to the first and second modes of the floor slab are presented in Figure 6.
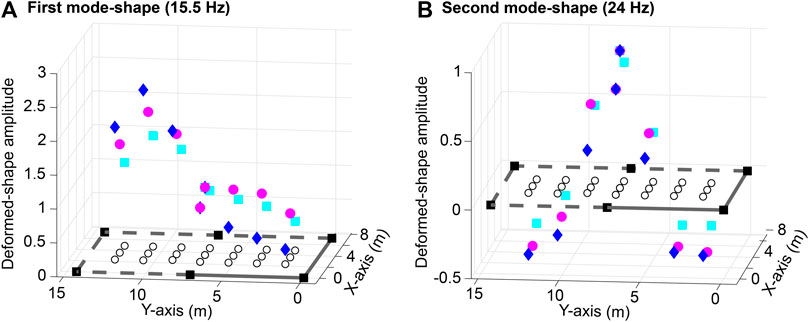
FIGURE 6. Normalized deformed-shape amplitudes that correspond to the first and second modes of the floor slab of Case-Study 2.
In Figure 6, diamonds, circles and squares represent deformed-shape amplitudes at positions defined by sensor-configurations #1 to #3 (see Figure 5A). The amplitude of the deformed shape at each sensor location is normalized by the deformed-shape amplitude, given by the reference Sensor S8 (see Figure 5A). Boxes indicate the locations of steel columns. Empty circles represent the reference amplitudes at each sensor location. Dashed lines indicate the continuity of the floor slab as well as the separation walls (see Figure 5). Lines represent the reinforced concrete walls.
The first mode-shape of the floor slab is governed by the bending mode at 15.5 Hz, as shown in Figure 6A. The south part of the slab has lower amplitudes compared to the north part, due to the connection of the slab to reinforced concrete walls (see Figure 6). In Figure 6A, the maximum deformed-shape amplitude regarding the first mode is located at quarter-span of the floor slab. The second mode-shape of the slab is governed by the bending mode at 24 Hz, as shown in Figure 6B. Maximum deformed-shape amplitude regarding the second mode is located at mid-span of the floor slab.
The deformed shape amplitudes are compared with recorded footstep-induced floor vibration at various locations to understand the effect of the structural behavior as presented in the following sections. The frequency band (15–40 Hz) of the floor slab with most energy contribution to vertical bending is used to process the signal for the assessment of the walking gait variability (see Variability in Walking Gaits section) and for the model-based localization (see Model-Based Occupant Localization section).
Influence of Structural Behavior on Floor Vibrations
Measurements from five occupants walking individually on the floor of Case-Study 2 (see Figure 5B) are also used to demonstrate the influence of structural behavior on floor vibrations. An average of 700 footstep-impact signals are recorded for each impact location defining the tested trajectory (see Figure 5B). Footstep impacts at 24 possible locations, as shown in Figure 5B, are involved in this analysis.
Similar to Case-Study 1, the standard deviation (σ) values of extracted footstep-impact signals at several sensors are used to characterize the detected footstep-events (see Eq. 6). The σ values of footstep-event signals, as a function of impact locations, are shown in Figure 7. Footstep-induced floor vibrations are decomposed using CWT and reconstructed using IWT at a frequency range of 15–40 Hz.
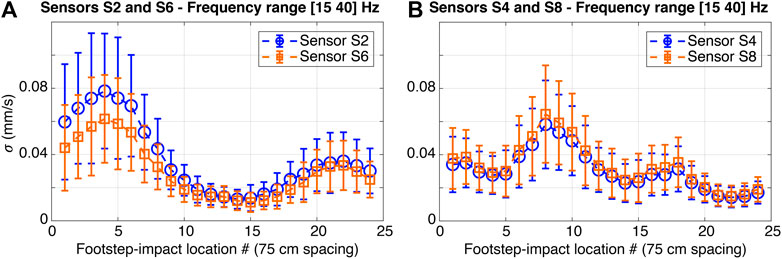
FIGURE 7. Standard deviation (σ) values of footstep-impact signals in terms of velocity. Footstep impacts are from walking occupants following the tested trajectory on the floor of Case Study 2 (see Figure 5B). (A) σ values of processed footstep-impact signals recorded by sensors S2 and S6. (B) σ values of processed footstep-impact signals recorded by sensors S4 and S8.
In Figure 7, bars represent the variability of recorded footstep-impact signals defined as one standard deviation. Circles correspond to the mean values for each impact location. In Figure 7A, σ values are for footstep-impact signals that are recorded by sensors S2 and S6. These sensors are horizontally placed at quarter-spans of the floor (see Figure 5B). In Figure 7B, σ values are for footstep-impact signals that are recorded by sensors S4 and S8. These sensors are horizontally placed at mid-span of the floor slab (see Figure 5B).
In Figure 7, the scatter between repeated footstep impacts at the same location is significant. The observed scatter results from the inter- and intra-subject variability in walking gaits. Also, this variability is increased for footstep impacts that are close to sensor locations.
In Figure 7A, the average standard deviation (σ) values of processed footstep-impact signals recorded at sensors S2 and S6 reveal an increasing trend to a maximum when footstep locations are close to quarter-span of the floor slab (impact locations #4 and #21). As seen in Figure 6A, sensors S2 and S6 are placed at quarter-span of the floor slab, where maximum deformed-shape amplitudes of the first bending mode of the slab are ascertained. Thus, the trend of σ values of the impact signals corresponds to the mode shape governed by the first fundamental mode of the floor slab.
Also, in Figure 7A, the average standard deviation (σ) values of footstep-event signals recorded by Sensor S2 for impact locations #1 to #10 have higher magnitudes compared with those recorded by Sensor S6. Since sensors S2 and S6 are located symmetrically at quarter-span of the floor and define equal distances to footstep-impact locations #1 to #10, the difference in amplitudes arises from the varying rigidity of the floor slab (see Figure 6A).
Amplitudes of footstep-impact signals recorded for impact locations #1 to #11 have higher magnitudes (up to 50%) compared with those induced by footstep-impacts at locations #14 to #24, as shown in Figure 7A. This disparity arises from the close distance between the footstep-impact locations #14 to #24 and the non-structural walls (see Figure 5).
In Figure 7B, average standard deviation (σ) values of processed footstep-impact signals, recorded at sensors S4 and S8, reveal an increasing trend for footstep-impact locations that are close to the north end of the floor slab (impact locations #1 and #24). Moreover, average σ values of processed footstep-impact signals define local maxima at footstep locations close to mid-span of the floor slab (impact locations #8 and #18). Since sensors S4 and S8 are located at mid-span of the seminar room, the trend of the resulting σ values is determined by the structural behavior of the second mode shape, as shown in Figure 6B.
This analysis reveals that signals are affected by structural behavior. Therefore, knowledge of structural behavior from physics-based models is necessary to interpret measurements for occupant localization.
Relationship Between Signal Magnitudes and Occupant Locations
Standard deviation (σ) values of processed signals generated by footstep impacts captured at sensors S2, S4 and S7 placed on the floor of Case-Study 2 (see Figure 5B) are illustrated in Figure 8. The σ values are presented as a function of the distance between footstep impacts and sensor locations. In Figure 8, recorded footstep-impact signals from five occupants walking individually along the tested trajectory, as shown in Figure 5B, are involved for this analysis. Extracted signals are decomposed using CWT and reconstructed using IWT at frequency ranges of 15–40 Hz (a, c and e) and of 150–200 Hz (b, d and f). In Figure 8 circles represent the mean σ values. Bars represent the variability of repeated measurements at each footstep location defined as one σ. Dashed lines represent three-standard deviation values of ambient vibrations filtered at the same frequency ranges.
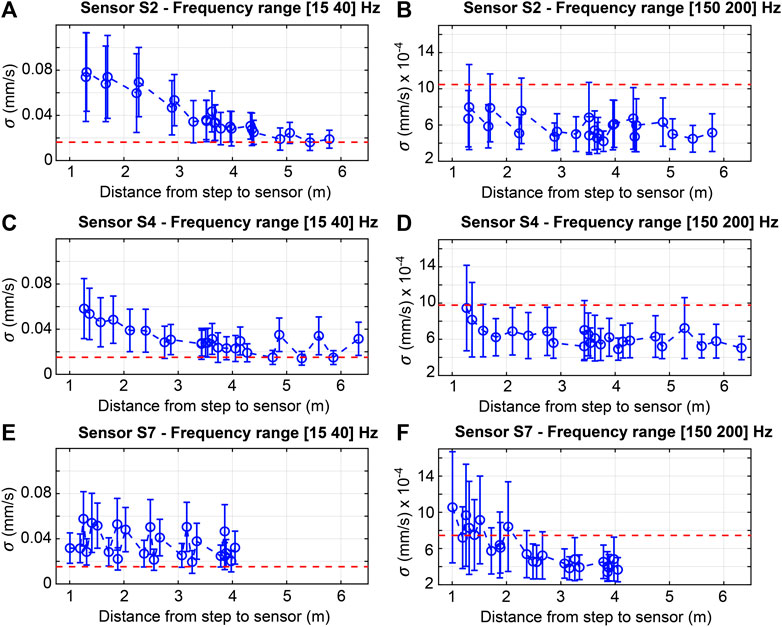
FIGURE 8. Standard deviation (σ) values of processed signals generated by footstep impacts captured at sensors S2, S4 and S7 from Case-Study 2 (see Figure 5B). Footstep impacts are from walking occupants following the tested trajectory individually. Signals are decomposed and reconstructed at frequency ranges of 15–40 Hz (A, E) and of 150–200 Hz (B, F).
For low-frequency components of the recorded footstep-impact signals, as shown in Figure 8A, standard deviation (σ) values define a monotonic relationship between distances from footstep impacts to the location of Sensor S2. Similarly, in Figure 8C, σ values of processed footstep-event signals recorded at Sensor S4 present a decreasing trend with respect to distances between impacts and sensor location. However, distant footstep impacts from sensor locations, as observed in Figure 8C, lead to non-monotonic variations in standard deviation values.
The decreasing trends of standard deviation (σ) values observed at sensors S2 and S4 can be explained by their locations on the floor slab. Sensors S2 and S4 are placed at floor regions where maximum deformed-shape amplitudes of the first and second modes of the slab are defined. These trends can be explained by the absence of support conditions along the tested trajectory (see Figure 5B).
However, standard deviation (σ) values that are assessed for footstep-event signals recorded by Sensor S7 do not define a decaying trend with respect to distances between impacts and sensor location, as shown in Figure 8E. Significant fluctuations are observed over the σ values of signals recorded by Sensor S7. In Figure 8E, footstep-impact locations adjacent to Sensor S7 do not lead to response (signals) with the highest amplitudes. This is due to the position of Sensor S7 on the floor slab with respect to similar rigidity regions, as shown in Figure 6. Also, footstep-impact locations close to the separation walls (see Figure 5B) may influence measurements.
Standard deviation (σ) values that are assessed for high-frequency components of footstep-event signals reveal a non-monotonic relationship between distances from impacts to the locations of sensors S2 and S4, as shown in Figures 8B,D. In Figure 8F, the σ values of high-frequency components of footstep-event signals recorded at Sensor S7 define a decaying trend with respect to distances from impacts and sensor location. However, the trends in σ values as shown in Figures 8B,D,F contain significant fluctuations. Also, most of average σ values are below the baseline level of ambient vibrations that is filtered at the same high frequency range (see Figures 8B,D,F). These fluctuations can be explained by the presence of structural and non-structural elements such as supporting beams, columns, walls and furniture that can affect local modes at high-frequency ranges.
Through these observations, it is concluded that high-frequency components of recorded signals are not significantly affected by global structural behavior. However, high-frequency components of footstep-event signals are sensitive to the presence of noise and to local structural effects (local modes). Thus, the use of high-frequency signal components only is not appropriate for occupant localization (see Model-Based Occupant Localization section).
Variability in Walking Gaits
Floor vibrations induced by a footstep impact depend on the walking-gait pattern of an occupant. This leads to significant variability in measured vibrations, as observed in Figure 7, since occupants walk with different styles. A natural variability in walking gaits can be from the same person and between individuals (i.e. inter- and intra-subject variability). Variability in walking gaits arises from sources such as individual anatomy, walking speed, shoe type, health and mood (Gage et al., 1995; Racic et al., 2009; Pan et al., 2015).
In order to have a reliable estimate of the inter- and intra-subject variability in walking gaits, repeated measurements from five occupants (∼700 footstep-event signals for each impact location), walking at various speeds and wearing two types of shoes, have been conducted on the floor of Case-study 2 (see Description section). Recorded footstep-event signals at several impact locations (locations #2, #4, #6, #8, #10, #12, #13, #15, #17, #19, #21 and #23 shown in Figure 5B) are used to estimate the walking-gait variability. Footstep-event signals are decomposed using CWT and reconstructed using IWT at the frequency range of 15–40 Hz. This results in an increase in the SNR of the event signals. Estimates of relative variability in gaits with and without prior information from walking tests are presented in Figure 9.
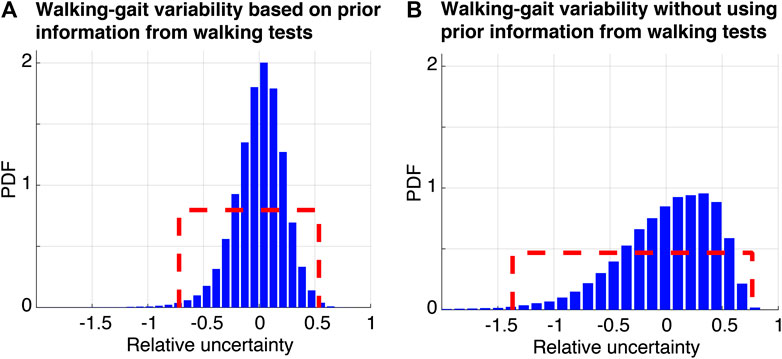
FIGURE 9. Relative walking-gait variability assessed using measurements from occupants walking on the floor of Case-Study 2 (see Figure 5B).
In Figure 9A, the walking-gait variability is estimated based on comparing the standard deviation, σ values (see Eq. 6) of processed event signals from the same footstep-impact location induced by an occupant wearing a particular type of shoe and walking at a particular speed with their mean σ values. Statistics that are computed individually for each occupant at each impact location and each sensor location are combined. Regarding prior information from walking tests, the resulting statistics lead to the estimation of the inherent change in walking gaits between occupants without accounting for external factors such as walking speeds and type of shoes.
Without considering prior information from walking tests, assessing the relative uncertainty involves an extensive study of inter- and intra-subject variability. This relative variability is estimated based on comparing standard deviation (σ) values of processed event signals from the same footstep-impact location induced by all occupants (walking at various speeds and shoe types) with their mean σ value, as shown in Figure 9B. Statistics that are computed individually for each impact location and each sensor location are combined.
A uniform distribution is assumed to define the walking-gait variabilities due to the lack of precise information about the probability distribution. Bounds corresponding to the 99th percentile of the distribution of the resulting statistics are used to define a uniform distribution for the gait variabilities, as shown by the dashed lines in Figure 9. Based on prior information from walking tests, the variability in walking gaits without accounting for external factors is bounded between approximately −72% and +54% as shown in Figure 9A. Thus, repeated walking tests by single occupants on the same locations leads to significant variability in walking gaits. Moreover, this inter-subject variability in walking gaits, where external factors such as walking speed and shoe type are fixed, define an aleatory uncertainty. The aleatory uncertainty, as defined in Model-Based Methodologies for Occupant Localization section, is intrinsic to the randomness of a phenomena which is repeated walks at same impact locations. This uncertainty is assumed to be irreducible.
Without using prior information from walking tests, the inter- and intra-subject variability in walking gaits is found to be bounded between −137 and 77%, as shown in Figure 9B. It can be observed in Figure 9 that including the variability contribution from all occupants as well as from external factors such as walking speeds and types of shoes leads to a significant increase of approximately 70% in the walking-gait variability. Therefore, variability in walking gaits from the same person and between individuals is significantly affected by the walking speeds and types of shoes. Moreover, this inter- and intra-subject variability define an epistemic uncertainty. This uncertainty arises from lack of knowledge of external factors that affect the way occupants walk. The epistemic uncertainty, as defined in Model-Based Methodologies for Occupant Localization section, are reducible with appropriate additional information.
An extensive evaluation of the variability in walking gaits is carried out separately for each occupant (see Table 2) walking at five speeds and wearing soft- and hard-soled shoes, as presented in Table 2. Walking speeds vary between 1.4 and 2.2 Hz. In Table 2, minimum and maximum bounds corresponding to the 99th percentile of the distribution of the resulting statistics are used to define a uniform distribution for each relative variability.
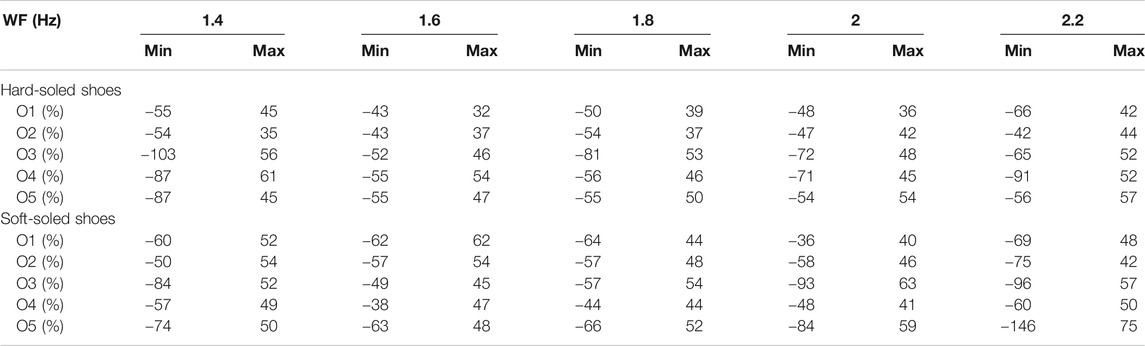
TABLE 2. Relative variability in walking gaits evaluated for each occupant, wearing soft- and hard-soled shoes, and walking at five different speeds on the floor of Case-Study 2 (see Figure 5B). WF is walking frequency.
Significant variability in walking gaits is observed between occupants, walking at various speeds, as shown in Table 2. A similar interpretation is observed between occupants while wearing soft-and-hard soled shoes. It has been found that a change in shoes from soft to hard soles leads to an increase of up to 30% of the variability of the recorded floor-signal amplitudes induced by occupants O1, O2, O3 and O5. However, for Occupant O4, a change in the shoe type during the walking tests, from hard to soft soles, leads to a decrease of 23% of the recorded amplitudes. This can be explained by the mood of the Occupant O4. During the walking tests, Occupant O4 appeared more comfortable while wearing soft-soled shoes instead of hard ones, while for other occupants no such effects were observed.
Moreover, significant variability in gaits is observed in Table 2 for each individual resulting in a change in the walking speed. It is found that the lowest uncertainties are found for event signals from all occupants walking at moderate speeds including 1.6 and 1.8 Hz. Walking at slow and fast speeds (1.4 and 2.2 Hz) leads to an average increase in the walking-gait variability of 22 and 30% respectively for all occupants. To sum up, significant variability is observed in measured responses at sensor locations for footsteps at the same location. The variability is from two sources. One is the inherent variability in gait of an individual. The other source of uncertainty is variability in gait between multiple individuals.
Model-Based Occupant Localization
Model-based occupant localization is carried out using EDMF (see Error-Domain Model Falsification (EDMF) section). Localization results are compared with those obtained using RM (see Residual Minimization (RM) section). Occupant localization using EDMF and RM is performed independently for each detected footstep-event signal. These approaches involve incorporating physics-based models (i.e. model predictions) in the interpretation of extracted footstep-event signals. Unlike RM, EDMF accommodates systematic errors and model bias to identify a population of possible locations denoted as candidate-location set (CLS) as explained in Error-Domain Model Falsification (EDMF) section. Using EDMF, model instances that contradict footstep-induced floor vibration measurements are rejected. The precisions of the resulting CLSs from the falsification process are then enhanced using a sequential analysis that incorporates information about previous footsteps (see Error-Domain Model Falsification (EDMF) section). Using RM, estimates of occupant locations (i.e. candidate locations, CLs) are ascertained by comparing simulated footstep impacts at possible locations with measured footstep-event signals.
Occupant localization using EDMF and RM are tested on measured floor vibrations induced by five occupants (see Table 1). Each occupant walks individually along a fixed trajectory (see Figure 5B) at five speeds within a range of 1.4–2.2 Hz (see Description section). These measurements are not involved in the uncertainty estimation (see Variability in Walking Gaits section). Each occupant walks at five speed levels (1.4; 1.6; 1.8; 2 and 2.2 Hz). In this application, the type of shoes during these walking tests is not fixed.
Model Predictions
The first step in model-based occupant localization is generating footstep-impact simulations using a finite element model of the floor slab. Footstep-impact simulations have been carried out using a finite element model of the floor of Case-Study 2 (see Figure 5B). The dynamic response induced by a footstep-impact load model has been computed using a linear model superposition in ANSYS (APDL, 2010).
Shell (SHELL181) and beam (BEAM188) elements were used to build the finite element model of the floor slab. The shell elements were used to model the reinforced concrete slab, where the elastic modulus for concrete was taken to be 35 GPa. The beam elements were used to model the steel frame underneath the floor slab (see Figure 5), where the elastic modulus for steel was taken to be 210 GPa. Shell and beam elements were assumed to be fully connected (i.e. share the same nodes). The steel columns were assumed to be simple supports (see Figure 5).
Due to incomplete knowledge of boundary conditions of the floor slab, the separation walls (see Figure 5) were modeled using translational zeros-length springs in the vertical direction (COMBIN14). Four spring elements were used to design the boundary conditions in the finite elements including: 1) the masonry walls at the upper half of the west end of the slab; 2) reinforced concrete walls at the lower half of the west end and the south end of the slab; 3) plasterboard walls at the east end of the slab; and 4) the masonry wall that is connected to a concrete staircase at the north end of the slab (see Figure 5).
Stiffness values of these springs were estimated based on a prior sensitivity analysis. Latin-hypercube sampling approach (Stein, 1987) was used to generate 500 spring-stiffness values from sufficiently small to sufficiently large. Values of each spring element were varied at a time using modal analysis simulations. This analysis resulted in an s-shaped function of the fundamental frequency as a function of each spring stiffness. The spring stiffnesses were assumed to be equal to values that are between freely supported and completely fixed. The stiffness values between freely supported and completely fixed of all spring elements were 316 N/mm, 631 N/mm, 1259 N/mm and 200 N/mm respectively.
The finite element model was subjected to a load model that approximated a typical vertical footstep-impact force (i.e. vertical ground-reaction force) in the time domain, as illustrated in Figure 10. Footstep-impact simulations were generated repeatedly at a grid of possible locations that define two-thirds of the floor slab (see Figure 5). Since measurement tests were conducted for occupants walking at a predefined step length of 75 cm, the distance between two possible locations was taken to be equal to be 37.5 cm. This led to 432 possible locations.
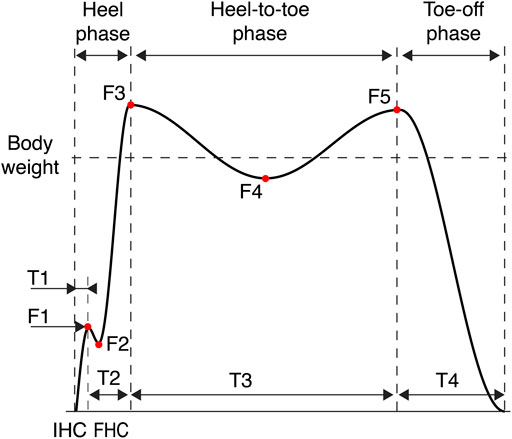
FIGURE 10. Vertical footstep-impact load model.
The vertical ground reaction force is composed of three phases including the heel phase, the heel-to-toe phase and the toe-off phase as explained in detail by Racic et al. (2009). The heel phase starts with an initial heel-contact (IHC) phase as shown in Figure 10. This phase is characterized by a brief duration, denoted as T1, during which an abrupt transfer of the bodyweight to the ground is achieved. This force is denoted as F1. Subsequently, the heel phase ends with a full heel-contact (FHC) phase whose duration is denoted as T2. During this phase, the foot is in full contact with the ground until the ground-reaction force reaches a maximum, denoted as F3. F2 refers to the attenuation in magnitudes within the heel phase.
Afterward, the heel phase is followed by the heel-to-toe phase, during which the bodyweight is supported by the stance foot. T3 refers to the duration of this phase. During the heel-to-toe phase, the opposite foot leaves the ground for the next footstep impact. At the same time, the heel of the stance foot starts to rise from the floor surface, which explains the descending trend that defines a minimum magnitude denoted as F4. The heel-to-toe phase ends when the foot contact is completely transferred to toes, and the opposite foot heel is in contact with the floor surface. These movements define an ascending trend to a maximum magnitude denoted as F5. Finally, the toe-off phase refers to the rising of the stance foot. During this phase, denoted as T4, the ground-reaction force presents a decreasing trend to zero.
The footstep-impact load function (
Average parameter values defining forces F1 to F5 and durations T1 to T3 that are used to apply the footstep-impact load function (see Eq. 7) for simulations are presented in Table 3. These values are determined based on prior analysis of measured vertical ground-reaction forces from multiple occupants. These measurements are provided by the Laboratory of Movement Analysis and Measurement (EPFL, Switzerland) (Falbriard, 2019). 483 measurements have been recorded from 12 occupants walking on a pressure plate mounted on the ground, with a sampling rate of 200 Hz. Occupants weigh between 63 and 82 Kg and their heights vary between 165 and 186 cm.
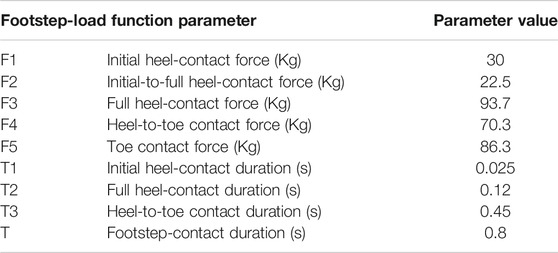
TABLE 3. Average parameter values for footstep-impact load function.
Uncertainty Estimation
As noted in Error-Domain Model Falsification (EDMF) section, EDMF explicitly accommodates uncertainties from multiple sources to ensure accurate identification (see Eq. 3). These uncertainties are from modeling and measurement sources. Modeling uncertainties are typically related to the imperfections of the finite element model, including idealized boundary conditions and omissions.
The finite element model of the floor of Case-Study 2 (see Model Predictions section) involves several simplifications including the use of shell elements for the concrete slab, and one-dimensional bar elements for the supporting beams. Also, model simplification includes the use of translational springs (rotation free) to model the plasterboard, masonry and reinforced concrete walls (see Figure 5). The finite element model contains omissions such as the room furniture, linoleum floor finishing and connections (in the horizontal direction) between the floor slab and the reinforced concrete walls (Pai et al., 2018; Drira et al., 2019b; Reuland et al., 2019).
The resulting model prediction involves the simulation of independent footstep impacts at a grid of possible locations (single nodes). This results in excluding the contribution of the opposite foot within the walking-gait pattern when the two feet are in contact with the floor (toe-off phase in Figure 10). Moreover, idealized footstep-impact load functions (with fixed parameter values as shown in Table 3) can increase the modeling uncertainties. Thus, uncertainty from model simplifications and omissions are biased and estimated to be uniformly distributed between −15% to +25% based on engineering judgement and previous work (Pai et al., 2018; Drira et al., 2019b; Reuland et al., 2019).
The heel phase is the most important stage within the walking-gait pattern (Racic et al. 2009). Since the frequency of the heel phase (1/duration) of the applied load function operates with low-frequency components (see Table 3), low-frequency components of simulated footstep-event signals are highly affected (Drira et al., 2019b). Thus, simulated velocity amplitudes are over-estimated with a bias. This has led to additional model uncertainties of −30–0%.
Similar to modeling errors, measurements are prone to uncertainties from multiple sources, mainly the variability in walking gaits (see Variability in Walking Gaits section) and to a lesser extent the sensor resolution and precision (∼2% according to the sensor manufacturer). For the sake of simplicity, the variability in walking gaits due to factors other than walking speeds and types of shoes are accounted for as a major contributor to the measurement uncertainty, as shown in Figure 9A.
For each detected footstep event, modeling and measurement uncertainties are subsequently combined using Monte-Carlo sampling with one million samples (see Eq. 4). With respect to EDMF as shown in Eq. 5, localization thresholds are then ascertained based on the combined uncertainty with a target reliability of localization of 95%.
Occupant Locations
Prior to the application of model-based occupant-localization, the measured and simulated footstep-impact signals are decomposed using CWT and reconstructed using IWT at a frequency of 15–40 Hz (see Model Analysis section). This frequency range contains the modes of the floor slab with most energy contribution to vertical bending. Standard deviation (σ) of the filtered signals, as shown in Eq. 6, is used as a metric for the model-based occupant localization strategies. In this application, footstep-induced floor vibrations are recorded using eight sensors as shown in Figure 5B.
In Figure 11, CLSs of few footstep events for all occupants (O1–O5) walking along a fixed trajectory (see Figure 5B). For the results shown in Figure 11, occupants have been walking at speeds of 1.4 Hz (O4), 1.6 Hz (O1 and O3), 1.8 Hz (O5) and 2 Hz (O2). Also, Occupants O1, O2 and O3 has been wearing soft-soled shoes, while the other occupants have been wearing hard-soled shoes. In Figure 11, footstep events are at locations #4, #9, #13, #15, and #22 (see Figure 5B). CLSs resulting from EDMF and a sequential analysis (see Error-Domain Model Falsification (EDMF) and Sequential Analysis Sections) are shown in Figure 11A, and are compared with CLs that are obtained using RM (see Residual Minimization (RM) Section) as shown in Figure 11B.
FIGURE 11. Candidate-location sets (CLSs) and candidate locations (CLs) that correspond to footstep events from occupants O1 to O5 walking at locations #4, #9, #13, #15 and #22 on the floor of Case-Study 2 (see Figure 5B). CLSs that are obtained using EDMF and a sequential analysis (A) are more accurate than CLs obtained using RM (B).
In Figure 11, CLSs and CLs are represented with squares, while falsified locations are represented with dots. Real impact locations for all footstep events, as shown in Figure 11, are represented with crosses. Dashed lines represent the separation walls and black boxes represent the steel columns. Finally, diamonds represent sensor locations.
Accurate occupant localization of a detected footstep event is achieved when at least one candidate location is within a radius from the correct location defined by the distance between two consecutive footsteps. In this application, the step length is predefined as 0.75 cm (see Model Predictions section). The tolerance of plus-or-minus one footstep-location in the determination of the localization accuracy is assumed because the initial location set (432 possible locations) does not coincide necessarily with the real impact locations during measurement tests. This allows a better estimate of the localization accuracy for detected footstep events at impact locations #11 and #14, where the occupants change their walking direction (see Figure 5B).
It can be observed in Figure 11 that EDMF provides accurate localization results (accuracy of 100%) compared with those obtained using RM (accuracy of 28%). For footstep events induced by all occupants the CLSs provided by EDMF contain the true impact locations, as shown by crosses in Figure 11A. However, only CLs of seven footstep events (out of 25)—at Location #4 for occupants O1, O2 and O5, Location #9 for occupants O3, O4 and O5, and Location #15 for Occupant O4—result in accurate localization using RM, as shown in Figure 11B. The CLs of the remaining footstep events provided by RM result in inaccurate localization. Therefore, incorporating uncertainties from multiple sources in the interpretation of footstep-induced floor vibrations using EDMF provides more accurate localization results compared with RM.
The average accuracy of localization results that are obtained from EDMF and RM for each participant are presented in Table 4. The average accuracy for each occupant is ascertained based on localization results generated from the 24 detected footstep events that define the walking trajectory (see Figure 5B). For each occupant the walking trajectory is repeated at five speed levels (1.4, 1.6, 1.8, 2 and 2.2 Hz).

TABLE 4. Accuracy of occupant localization results using EDMF compared with those from RM.
Regarding the five walking tests (including 24 footstep events each) recorded from each occupant, the average localiaztion accuracy using EDMF varies approximately between 91 and 100% as shown in Table 4, whereas the average accuracy of the localization results obtained using RM varies approximatively between 11 and 23%. Moreover, the average accuracy for all occupants resulting from EDMF is approximately 95%, compared with RM where the average accuracy does not exceed 16%. It is found from the results shown in Table 4 that model-based occupant localization is significantly more reliable when using EDMF than RM.
According to Figure 11 and Table 4, occupant localization using EDMF results in low precision, while RM provides a single response defining a single location. Localization precision refers to the percentage of falsified locations from all possible locations (432 possible locations). The precisions of CLSs that correspond to all footstep events is approximately 46%. This is because EDMF incorporates systematic uncertainties and model bias (see Error-Domain Model Falsification (EDMF) section), to sacrifice precision for accuracy compared with RM.
Therefore, incorporating systematic uncertainties and model bias helps achieve accurate model-based localization (EDMF) with relatively low precision. RM, which does not take into account uncertainties from multiple sources explicitly, provides inaccurate occupant localization.
Summary and Discussion
An empirical analysis of measured floor vibrations from two case studies has been carried out to study the influence of structural behavior on footstep-impact signals. It has been found from Case-Study 1 that the low-frequency components of recorded footstep-event signals from a single occupant walking at moderate speed are affected by the structural behavior of the floor slab. The trend of the standard deviation (σ) values of the measured footstep-impact signals follows significantly the shapes of the fundamental vertical bending modes of the floor slab. The analysis has also shown that the non-structural elements such as separation walls affect the amplitudes of signals that are induced by footstep impacts. Thus, a monotonic relationship of the distance from footstep impacts to the sensor locations is not always present.
The analysis of extensive floor-vibration measurements from five occupants walking at five walking speeds and wearing two types of shoes on the floor of Case-Study 2 have led to the same interpretations provided by Case-Study 1. The low-frequency components of recorded signals are affected by the structural behavior of the floor slab as well as by the presence of separation walls. Also, a monotonic relationship between sensor signal characteristics and the distance from footstep impacts to sensor locations can exist only when both footstep impacts and sensor locations belong to regions of floor slab that have similar rigidities. Therefore, information on structural behavior from physics-based models is necessary to interpret measured footstep-induced floor vibrations for occupant localization.
The high-frequency components of recorded footstep-impact signals from the floors of Case-Studies 1 and 2 are not significantly affected by global structural behavior. A monotonic relationship between signal characteristics and the distance from footstep impacts to sensor locations has been highlighted for high-frequency components of footstep-impact signals recorded from the floor of Case-Study 1. However, from a distance of 2 m and above, the overall trend resulting from σ values of footstep-impact signals (from both case studies) processed at high-frequency ranges contains several fluctuations. These fluctuations are due to the presence of multiple obstructions such as walls, vertical beams, and furniture that can affect the high-frequency components of the propagated waves induced by footstep impacts. These obstructions, and to a lesser external signal sources such as electrical devices and outside traffic, affects local structural response at high-frequency ranges. Thus, the use of high-frequency components is not appropriate for model-free localization even though there is a monotonic relationship between signal magnitude and distance.
Measured footstep-impact signals from the floor of Case-Study 2 reflect significant variability in walking gaits. The walking-gait variability is observed in the measured responses at sensor locations for footsteps at the same location. The uncertainty is from two sources. One is the inherent variability in gait of an individual. The other source of uncertainty is variability in gait between multiple individuals. Moreover, it has been found that external factors such as changes in walking speed or type of shoes significantly increase the variability in gaits. Quantification of uncertainties from these two sources using independent data helps achieve accurate model-based localization using EDMF (see Figure 11A and Table 4).
The incorporation of physics-based models in the interpretation of footstep-induced floor vibration for occupant localization is carried out on measured vibrations from Case-Study 2. Two model-based strategies including EDMF and RM are applied for the localization of single occupants. This has shown that EDMF provides significantly more accurate results compared with localization results obtained by RM. Unlike RM, EDMF explicitly accommodates systematic errors and model bias to provide accurate localization.
The application of EDMF and a sequential analysis on footstep-event signals from five occupants walking at five speed levels have led to an average precision of the localization results of approximately 46%. Accounting for external factors in the estimation of the variability in walking gaits leads to an increase of the combined uncertainty, which affects localization precision. Thus, a data analysis of recorded floor vibrations from multiple occupants can help understand footstep-contact dynamics that may be useful to provide better estimations of measurement uncertainties. These data analyses have the potential to increase localization precision using EDMF.
Rearranging sensors to locations close to boundaries may be useful to decrease in the number of CLSs. Increasing knowledge of the behavior of the slab near supports thus has the potential to enhance localization precision. Optimal sensor placement studies could help to do this using, for example, the joint entropy of footstep impacts (Bertola et al., 2020).
Conclusions
In this paper, observations of floor vibrations from two case studies are carried out to evaluate the influence of the structural behavior on measured footstep-impact signals. Applications of model-based strategies (using EDMF and RM) for the localization of multiple occupants walking individually are compared. The conclusions are as follows:
• Low-frequency components of recorded signals are affected by structural behavior. Therefore, information on structural behavior from physics-based models is necessary to interpret measurements for occupant localization.
• High-frequency components of recorded signals are not significantly affected by global structural behavior. However, the use of only high-frequency components is not appropriate for model-free localization because high-frequency components are sensitive to the presence of local structural effects (i.e. local modes) as well as other factors, such as furniture.
• Incorporating systematic uncertainties and model bias helps achieve accurate occupant based localization using model falsification (EDMF).
• Residual minimization (RM) provides inaccurate occupant localization since uncertainty bias from multiple sources is neglected.
Data Availability Statement
The raw data supporting the conclusions of this article will be made available by the authors, without undue reservation.
Author Contributions
Footstep-impact vibration measurements were carried out by SD. Analysis of footstep-induced floor vibrations from multiple people was performed by SD. SD developed occupant localization using a model-based data-interpretation approach and created the footstep-impact load model for simulations. SP assisted throughout the elaboration of the methodology and measurement interpretation. SP was involved in adapting EDMF and RM approaches to occupant localization as well as finite-element modelling. IS was actively involved in developing and adapting the data-interpretation methodology and interpreting results. All authors reviewed and accepted the final version of the manuscript.
Funding
This work was funded by the Applied Computing and Mechanics Laboratory (IMAC) EPFL and the Singapore-ETH Center (SEC) under contract no. FI 370074011-370074016.
Conflict of Interest
The authors declare that the research was conducted in the absence of any commercial or financial relationships that could be construed as a potential conflict of interest.
Acknowledgments
The authors acknowledge all participants that have been involved in vibration measurements: Nils Olsen, Yves Reuland, Amal Trabelsi and Arka Reksowardojo. The authors acknowledge Mathieu Falbriard (Laboratory of Movement Analysis and Measurement, EPFL) for providing measurements of ground reaction forces induced by footstep impacts. The authors also acknowledge Mostafa Mirshekari, Jonathon Fagert and Hae Young Noh for fruitful discussions.
References
Alpert, D. T., and Allen, M. (2010). “Acoustic gait recognition on a staircase,” in 2010 World automation congress, Kobe, Japan, September 19–23, 2010 (New York, NY: IEEE) 1–6.
Bahroun, R., Michel, O., Frassati, F., Carmona, M., and Lacoume, J. L. (2014). New algorithm for footstep localization using seismic sensors in an indoor environment. J. Sound Vib. 333 (3), 1046–1066. doi:10.1016/j.jsv.2013.10.004
Bamis, A., Lymberopoulos, D., Teixeira, T., and Savvides, A. (2010). The BehaviorScope framework for enabling ambient assisted living. Pers. Ubiquitous Comput. 14 (6), 473–487. doi:10.1007/s00779-010-0282-z
Bertola, N. J., Costa, A., and Smith, I. F. C. (2020). Strategy to validate sensor-placement methodologies in the context of sparse measurement in complex urban systems. IEEE Sensors J. 20 (10), 5501–5509. doi:10.1109/jsen.2020.2969470
Beven, K. J. (2000). Uniqueness of place and process representations in hydrological modelling. Hydro. Earth Sys. Sci. 4 (2), 203–213. doi:10.5194/hess-4-203-2000
Bian, X., Abowd, G. D., and Rehg, J. M. (2005). “Using sound source localization in a home environment,” in International conference on pervasive computing, Munich, Germany, May 8–13, 2005, 19–36. doi:10.1007/11428572_2
Candanedo, L. M., and Feldheim, V. (2016). Accurate occupancy detection of an office room from light, temperature, humidity and CO2 measurements using statistical learning models. Energ. Build. 112, 28–39. doi:10.1016/j.enbuild.2015.11.071
Catbas, F. N., and Kijewski-Correa, T. (2013). Structural identification of constructed systems: collective effort toward an integrated approach that reduces barriers to adoption. J. Struct. Eng. 139 (10), 1648–1652. doi:10.1061/(asce)st.1943-541x.0000682
Chou, J.-H., and Ghaboussi, J. (2001). Genetic algorithm in structural damage detection. Comput. Struct. 79 (14), 1335–1353. doi:10.1016/s0045-7949(01)00027-x
Clemente, J., Li, F., Valero, M., and Song, W. (2019). Smart seismic sensing for indoor fall detection, location and notification. IEEE J. Biomed. Health Inform. 24, 524–532. doi:10.1109/smartcomp.2019.00081
Cully, W. P. L., Cotton, S. L., and Scanlon, W. G. (2012). Empirical performance of RSSI-based Monte Carlo localisation for active RFID patient tracking systems. Int. J. Wirel. Inf. Netw. 19 (3), 173–184. doi:10.1007/s10776-012-0189-x
Cully, W. P. L., Cotton, S. L., Scanlon, W. G., and McQuiston, J. B. (2011). “Localization algorithm performance in ultra low power active RFID based patient tracking,” in 2011 IEEE 22nd international symposium on personal, indoor and mobile radio communications, Toronto, ON, Canada, September 11–14, 2011 (New York, NY: IEEE), 2158–2162.
Desai, P., Baine, N., and Rattan, K. S. (2011). “Indoor localization for global information service using acoustic wireless sensor network.” in Geospatial infofusion systems and solutions for defense and security applications, 805304, 16 May 2011, Orlando, FL.
Diraco, G., Leone, A., and Siciliano, P. (2015). People occupancy detection and profiling with 3D depth sensors for building energy management. Energ. Build. 92, 246–266. doi:10.1016/j.enbuild.2015.01.043
Drira, S., Reuland, Y., Olsen, N. F. H., Pai, S. G. S., and Smith, I. F. C. (2019a). “Occupant-detection strategy using footstep-induced floor vibrations,” in The 1st ACM international workshop on device-free human sensing, New York, United States, November 10, 2019, DFHS (New York, NY: ACM).
Drira, S., Reuland, Y., Pai, S. G. S., Noh, H. Y., and Smith, I. F. C. (2019b). Model-based occupant tracking using slab-vibration measurements. Front. Built Environ. 5, 63. doi:10.3389/fbuil.2019.00063
Drira, S., Reuland, Y., and Smith, I. F. C. (2019d). “Model-based interpretation of floor vibrations for indoor occupant tracking,” in 26th international workshop on intelligent computing in engineering, Leuven, Belgium, June 30–July 3, 2019, RWTH (Leuven, Belgium: CEUR Workshop Proceedings).
Drira, S., Reuland, Y., and Smith, I. F. C. (2019c). “Occupant tracking using model-based data interpretation of structural vibrations,” in 9th international conference on structural health monitoring of intelligent infrastructure, St. Louis, MO, Augest 4–7, 2019 (St. Louis, MO: SHMII-9).
Erickson, V. L., Achleitner, S., and Cerpa, A. E. (2013). “POEM: power-efficient occupancy-based energy management system,” in Proceedings of the 12th international conference on Information processing in sensor networks. Philadelphia, United States, April 8–11, 2013 (New York, NY: IEEE), 203–216.
Falbriard, M. (2019). "Personal communication,” in Laboratory of movement analysis and measurement. (Lausanne: EPFL).
Feldmann, S., Kyamakya, K., Zapater, A., and Lue, Z. (2003). “An indoor bluetooth-based positioning system: concept, implementation and experimental evaluation,” in International conference on wireless networks, Las Vegas, Nevada, United States, June 23–26, 2003.
Fierro, G., Rehmane, O., Krioukov, A., and Culler, D. (2012). “Zone-level occupancy counting with existing infrastructure,” in Proceedings of the fourth ACM workshop on embedded sensing systems for energy-efficiency in buildings, Toronto, Canada, November 6, 2012.
Figueiredo, F. P., da Silva, J. G. S., and de Lima, L. R. O. (2005). “A parametric study of composite footbridges with pedestrian walking loads.” in Proceedings of the tenth international conference on civil, structural and environmental engineering computing, Rome, Italy, September 2, 2012, 85.
Gage, J. R., Deluca, P. A., and Renshaw, T. S. (1995). Gait analysis: principles and applications. J. Bone Jt. Surg. 77 (10), 1607–1623. doi:10.2106/00004623-199510000-00017
Geiger, J. T., Kneißl, M., Schuller, B. W., and Rigoll, G. (2014). “Acoustic gait-based person identification using hidden markov models,” in Proceedings of the 2014 workshop on mapping personality traits challenge and workshop, Istanbul Turkey, November, 2014 (New York, NY: Association for Computing Machinery), 25–30.
Goulet, J.-A., Michel, C., and Smith, I. F. C. (2013). Hybrid probabilities and error-domain structural identification using ambient vibration monitoring. Mech. Syst. Signal Process. 37 (1–2), 199–212. doi:10.1016/j.ymssp.2012.05.017
Goulet, J.-A., and Smith, I. F. C. (2013). Structural identification with systematic errors and unknown uncertainty dependencies. Comput. struct. 128, 251–258. doi:10.1016/j.compstruc.2013.07.009
Goulet, J.-A., Texier, M., Michel, C., Smith, I. F. C., and Chouinard, L. (2014). Quantifying the effects of modeling simplifications for structural identification of bridges. J. Bridge Eng. 19 (1), 59–71. doi:10.1061/(asce)be.1943-5592.0000510
Gregory, R. D., and Gladwell, I. (1983). The reflection of a symmetric Rayleigh-Lamb wave at the fixed or free edge of a plate. J. Elast. 13 (2), 185–206. doi:10.1007/bf00041235
Hausdorff, J. M. (2007). Gait dynamics, fractals and falls: finding meaning in the stride-to-stride fluctuations of human walking. Hum. Mov Sci. 26 (4), 555–589. doi:10.1016/j.humov.2007.05.003
Jiang, C., Masood, M. K., Soh, Y. C., and Li, H. (2016). Indoor occupancy estimation from carbon dioxide concentration. Energ. Build. 131, 132–141. doi:10.1016/j.enbuild.2016.09.002
Jiang, X., and Mahadevan, S. (2008). Bayesian validation assessment of multivariate computational models. J. Appl. Stat. 35 (1), 49–65. doi:10.1080/02664760701683577
Kamthe, A., Jiang, L., Dudys, M., and Cerpa, A. (2009). “Scopes: smart cameras object position estimation system,” in European conference on wireless sensor networks, Cork, Ireland, February 11–13, 2009, 279–295. doi:10.1007/978-3-642-00224-3_18
Kanazawa, K., and Hirata, K. (2005). Parametric estimation of the cross-power spectral density. J. Sound Vib. 282 (1–2), 1–35. doi:10.1016/j.jsv.2004.02.009
Kiureghian, A. D., and Ditlevsen, O. (2009). Aleatory or epistemic? does it matter?. Struct. Saf. 31 (2), 105–112. doi:10.1016/j.strusafe.2008.06.020
Lam, M., Mirshekari, M., Pan, S., Zhang, P., and Noh, H. Y. (2016). Robust occupant detection through step-induced floor vibration by incorporating structural characteristics. Dyn. Coupled Struct. 4, 357–367. doi:10.1007/978-3-319-29763-7_35
Lazik, P., Rajagopal, N., Shih, O., Sinopoli, B., and Rowe, A. (2015). “ALPS: a bluetooth and ultrasound platform for mapping and localization,” in Proceedings of the 13th ACM conference on embedded networked sensor systems. Seoul, South Korea, November 1–4, 2015, 73–84.
Lee, H., Ahn, C. R., and Choi, N. (2020). Fine-grained occupant activity monitoring with Wi-Fi channel state information: practical implementation of multiple receiver settings. Adv. Eng. Inform. 46, 101147. doi:10.1016/j.aei.2020.101147
Lee, Y. H., and Oh, T. (2016). The simple lamb wave analysis to characterize concrete wide beams by the practical masw test. Mater. 9 (6), 437. doi:10.3390/ma9060437
Lu, J., Sookoor, T., Srinivasan, V., Gao, G., Holben, B., Stankovic, J., et al. (2010). “The smart thermostat: using occupancy sensors to save energy in homes,” in Proceedings of the 8th ACM conference on embedded networked sensor systems, Zürich, Switzerland, November 2, 2010 (New York, NY: Association for Computing Machinery), 211–224.
McFarland, J., and Mahadevan, S. (2008). Error and variability characterization in structural dynamics modeling. Comp. Methods Appl. Mech. Eng. 197 (29–32), 2621–2631. doi:10.1016/j.cma.2007.07.029
Mirshekari, M., Pan, S., Fagert, J., Schooler, E. M., Zhang, P., and Noh, H. Y. (2018). Occupant localization using footstep-induced structural vibration. Mech. Syst. Signal Process. 112, 77–97. doi:10.1016/j.ymssp.2018.04.026
Mirshekari, M., Pan, S., Zhang, P., and Noh, H. Y. (2016). “Characterizing wave propagation to improve indoor step-level person localization using floor vibration,” in Sensors and smart structures technologies for civil, mechanical, and aerospace systems 2016, March 21–24, 2016 (Las Vegas, NV: SPIE), 980305.
Mottershead, J. E., Link, M., and Friswell, M. I. (2011). The sensitivity method in finite element model updating: a tutorial. Mech. Syst. signal Process. 25 (7), 2275–2296. doi:10.1016/j.ymssp.2010.10.012
Nanda, B., Maity, D., and Maiti, D. K. (2014). Modal parameter based inverse approach for structural joint damage assessment using unified particle swarm optimization. Appl. Math. Comput. 242, 407–422. doi:10.1016/j.amc.2014.05.115
Öberg, T., Karsznia, A., and Öberg, K. (1993). Basic gait parameters: reference data for normal subjects, 10–79 years of age. J. Rehabil. Res. Dev. 30, 210–223.
Pai, S. G. S., Nussbaumer, A., and Smith, I. F. C. (2018). Comparing structural identification methodologies for fatigue life prediction of a highway bridge. Front. Built Environ. 3, 73. doi:10.3389/fbuil.2017.00073
Pai, S. G. S., Reuland, Y., Drira, S., and Smith, I. F. C. (2019). “Is there a relationship between footstep-impact locations and measured signal characteristics?,” in The 1st ACM international workshop on device-free human sensing, New York, USA, November, 2019 (New York, NY: Association for Computing Machinery).
Pakhomov, A., Sicignano, A., Sandy, M., and Goldburt, E. T. (2003). Single-and three-axis geophone: footstep detection with bearing estimation, localization, and tracking. Unattended Ground Sensor Tech. Appl. V, 155–162. doi:10.1117/12.487755
Pan, S., Bonde, A., Jing, J., Zhang, L., Zhang, P., and Noh, H. Y. (2014). “Boes: building occupancy estimation system using sparse ambient vibration monitoring,” in Sensors and smart structures technologies for civil, mechanical, and aerospace systems 2014, San Diego, California, United States, March 10–13, 2014, 90611O.
Pan, S., Mirshekari, M., Zhang, P., and Noh, H. Y. (2016). “Occupant traffic estimation through structural vibration sensing,” in Sensors and smart structures technologies for civil, mechanical, and aerospace systems 2016, Las VegasNevada, United States, March 21–24, 2016, 980306.
Pan, S., Wang, N., Qian, Y., Velibeyoglu, I., Noh, H. Y., and Zhang, P. (2015). “Indoor person identification through footstep induced structural vibration,” in Proceedings of the 16th international workshop on mobile computing systems and applications, New Mexico, United States, February 12, 2015, 81–86.
Pan, S., Yu, T., Mirshekari, M., Fagert, J., Bonde, A., Mengshoel, O. J., et al. (2017). “Footprintid: indoor pedestrian identification through ambient structural vibration sensing,” in Proceedings of the ACM on interactive mobile wearable and ubiquitous technologies, September, 2017 1 (3), 89, (New York, NY: ACM). doi:10.1145/3130954
Pasquier, R., D’Angelo, L., Goulet, J.-A., Acevedo, C., Nussbaumer, A., and Smith, I. F. C. (2016). Measurement, data interpretation, and uncertainty propagation for fatigue assessments of structures. J. Bridge Eng. 21 (5), 04015087. doi:10.1061/(asce)be.1943-5592.0000861
Racic, V., Pavic, A., and Brownjohn, J. M. W. (2009). Experimental identification and analytical modelling of human walking forces: literature review. J. Sound Vib. 326 (1–2), 1–49. doi:10.1016/j.jsv.2009.04.020
Reuland, Y., Lestuzzi, P., and Smith, I. F. C. (2019). A model-based data-interpretation framework for post-earthquake building assessment with scarce measurement data. Soil Dyn. Earthq. Eng. 116, 253–263. doi:10.1016/j.soildyn.2018.10.008
Reuland, Y., Lestuzzi, P., and Smith, I. F. C. (2017a). Data-interpretation methodologies for non-linear earthquake response predictions of damaged structures. Front. Built Environ. 3, 43. doi:10.3389/fbuil.2017.00043
Reuland, Y., Pai, S. G. S., Drira, S., and Smith, I. F. C. (2017b). “Vibration-based occupant detection using a multiple-model approach,” in 35th International conference on structural dynamics challenges in next generation aerospace systems (IMAC XXXV), Los Angeles, United States, February 02, 2017 (Cham, Switzerland: Springer), 49–56.
Richman, M. S., Deadrick, D. S., Nation, R. J., and Whitney, S. (2001). Personnel tracking using seismic sensors. Unattended Ground Sensor Tech. Appl. 4393, 14–22. doi:10.1117/12.441276
Sanayei, M., Phelps, J. E., Sipple, J. D., Bell, E. S., and Brenner, B. R. (2012). Instrumentation, nondestructive testing, and finite-element model updating for bridge evaluation using strain measurements. J. Bridge Eng. 17 (1), 130–138. doi:10.1061/(asce)be.1943-5592.0000228
Schloemann, J., Malladi, V. V. N. S., Woolard, A. G., Hamilton, J. M., Buehrer, R. M., and Tarazaga, P. A. (2015). “Vibration event localization in an instrumented building,” in Experimental techniques, rotating machinery, and acoustics. Editor J. De Clerck (Cham, Switzerland: Springer), Vol. 8, 265–271.
Schlune, H., Plos, M., and Gylltoft, K. (2009). Improved bridge evaluation through finite element model updating using static and dynamic measurements. Eng. Struct. 31 (7), 1477–1485. doi:10.1016/j.engstruct.2009.02.011
Serra, R., Knittel, D., Di Croce, P., and Peres, R. (2016). Activity recognition with smart polymer floor sensor: application to human footstep recognition. IEEE Sens. J. 16 (14), 5757–5775. doi:10.1109/jsen.2016.2554360
Šidák, Z. (1967). Rectangular confidence regions for the means of multivariate normal distributions. J. Am. Stat. Assoc. 62 (318), 626–633. doi:10.2307/2283989
Simoen, E., De Roeck, G., and Lombaert, G. (2015). Dealing with uncertainty in model updating for damage assessment: a review. Mech. Syst. Signal Process 56, 123–149. doi:10.1016/j.ymssp.2014.11.001
Simoen, E., Papadimitriou, C., and Lombaert, G. (2013). On prediction error correlation in Bayesian model updating. J. Sound Vib. 332 (18), 4136–4152. doi:10.1016/j.jsv.2013.03.019
Song, B., Choi, H., and Lee, H. S. (2008). “Surveillance tracking system using passive infrared motion sensors in wireless sensor network,” in 2008 International conference on information networking, Busan, Korea (South), January 23–25, 2008 (New York, NY: IEEE) 1–5.
Sorenson, H. W. (1970). Least-squares estimation: from Gauss to kalman. IEEE Spectr. 7 (7), 63–68. doi:10.1109/mspec.1970.5213471
Stein, M. (1987). Large sample properties of simulations using Latin hypercube sampling. Technometrics 29 (2), 143–151. doi:10.2307/1269769
Stoppel, C. M., and Leite, F. (2014). Integrating probabilistic methods for describing occupant presence with building energy simulation models. Energ. Build. 68, 99–107. doi:10.1016/j.enbuild.2013.08.042
Tarantola, A. (2006). Popper, Bayes and the inverse problem. Nat. Phys. 2 (8), 492. doi:10.1038/nphys375
Tekler, Z. D., Low, R., Gunay, B., Andersen, R. K., and Blessing, L. (2020). A scalable bluetooth low energy approach to identify occupancy patterns and profiles in office spaces. Build. Environ. 171, 106681. doi:10.1016/j.buildenv.2020.106681
Uotila, V., and Skogster, P. (2007). Space management in a DIY store analysing consumer shopping paths with data-tracking devices. Facilities 25 (9/10), 363–374. doi:10.1108/02632770710772469
Viktorov, I. A. (1970). Rayleigh and Lamb waves: physical theory and applications. 1st Edn. (New York, NY: Plenum press).
Walker, W. E., Harremoës, P., Rotmans, J., Van Der Sluijs, J. P., Van Asselt, M. B. A., Janssen, P., et al. (2003). Defining uncertainty: a conceptual basis for uncertainty management in model-based decision support. Integr. Assess. 4 (1), 5–17. doi:10.1076/iaij.4.1.5.16466
Wang, T., Celik, O., Catbas, F. N., and Zhang, L. M. (2016). A frequency and spatial domain decomposition method for operational strain modal analysis and its application. Eng. Struct. 114, 104–112. doi:10.1016/j.engstruct.2016.02.011
Worden, K. (2001). Rayleigh and lamb waves-basic principles. Strain 37 (4), 167–172. doi:10.1111/j.1475-1305.2001.tb01254.x
Yun, J. (2011). User identification using gait patterns on UbiFloorII. Sensors 11 (3), 2611–2639. doi:10.3390/s110302611
Keywords: footstep-induced floor-vibrations, structural influence, model-based data interpretation, error-domain model falsification, residual minimization, walking-gait variability
Citation: Drira S, Pai SGS and Smith IFC (2021) Uncertainties in Structural Behavior for Model-Based Occupant Localization Using Floor Vibrations. Front. Built Environ. 7:602118. doi: 10.3389/fbuil.2021.602118
Received: 02 September 2020; Accepted: 21 January 2021;
Published: 09 April 2021.
Edited by:
Fikret Necati Catbas, University of Central Florida, United StatesCopyright © 2021 Drira, Pai and Smith. This is an open-access article distributed under the terms of the Creative Commons Attribution License (CC BY). The use, distribution or reproduction in other forums is permitted, provided the original author(s) and the copyright owner(s) are credited and that the original publication in this journal is cited, in accordance with accepted academic practice. No use, distribution or reproduction is permitted which does not comply with these terms.
*Correspondence: Slah Drira, c2xhaC5kcmlyYUBnbWFpbC5jb20=