 Chenjiyu Liang
 Sihang Jiang1
 Huan Wang
 Xianting Li
- 1Beijing Key Laboratory of Indoor Air Quality Evaluation and Control, Department of Building Science, School of Architecture, Tsinghua University, Beijing, China
- 2School of Civil and Resource Engineering, University of Science and Technology Beijing, Beijing, China
Severe acute respiratory syndrome coronavirus-2 (SARS-CoV-2) is spreading globally, and its high transmission speed and mortality rate are severely interfering with people’s normal lives and the economy. Governments are now reopening their economies; however, the opening of theaters has been delayed, owing to their (often) crowded audiences and potentially higher infection risk. To determine whether it is safe to reopen theaters, in this study, the transport of contaminants released by an infected person in a theater hall with an overhead air supply system is analyzed numerically. The infection risks are calculated for occupants at various distances from the infected person in different directions and with/without wearing masks based on a revised Wells-Riley model, and under different supply air states and locations of the infected person. The results show that, first, the probabilities of infection in return air with filtration and all-fresh-air operations are decreased by 39.8 and 55.6%, respectively, as compared when the return air is not filtered. Second, the probabilities of infection for audiences sitting nine seats away from the infected person on the right, right-back, and back sides are 84.9–92.3%, 37.3–74.0%, and 36.3–72.0% lower, respectively, than those for audiences sitting one-seat away from the infected person. In addition, sitting in separate rows can reduce the maximum probability by 7.4–68.3%. Third, the probability of infection can be reduced by 93.7% after all the audiences wear masks with efficiencies of 75%. Fourth, the probability of infection can be controlled under a relatively safe range even though the quanta emission rate is 30 or 50 quanta/h, and even with two infected people in unfavorable seats. Thus, theaters can be safely reopened under return air filtration or all fresh air operations, and when audiences are sitting in separate seats and wearing masks.
Introduction
Severe acute respiratory syndrome coronavirus-2 (SARS-CoV-2) is currently spreading globally. As of October 30, 2020, more than 40 million cases worldwide had been confirmed, and the number of confirmed cases was increasing at a rate of more than 400,000 per day. The epidemic of SARS-CoV-2 has not only spread rapidly, but also has a mortality rate as high as 2.6% (World Health Organization, 2020).
To prevent the spread of SARS-CoV-2, quarantines and city lockdowns have been employed by many countries, and have proven to be effective (Cui et al., 2020; Džiugys et al., 2020). However, quarantine strategies severely interfere with economic development worldwide (Kanitkar, 2020; Nicola et al., 2020). The gross national product (GDP) of China for the first quarter of 2020 fell by 6.8% year-on-year (Statistics, National Bereau of Statistic in China, 2020), and it was estimated that the GDP of India for the entire year of 2020 would drop by 10–31% (Kanitkar, 2020). Therefore, in the face of a financial crisis and high unemployment, governments have introduced a series of policies for ensuring safe recoveries of production and the economy.
The film industry has also been substantially affected by the SARS-CoV-2 epidemic. Because theaters are always crowded with audiences (resulting in higher infection risks), theaters worldwide closed after the outbreak of the pandemic. It was predicted that the global box office would lose 5 billion US dollars from the pandemic (Shoard, 2020). The Chinese film industry has closed all its of cinemas since the Lunar New Year, and had lost 2 billion US dollars by March 2020 (Clark, 2020). From March 13 to 15, 2020, North America experienced its lowest box office weekend since 1998 (D'Alessandro, 2020). Although theaters in China opened after July 20, 2020 as a result of the relatively low infection risks in China, the film industry has not fully recovered to normal: many movies have been postponed, tickets are sold in separate rows of seats, and people remain worried regarding watching movies in theaters. In other countries, theaters remain closed. Both decision-makers and ordinary people are still wondering whether fully reopening theaters is safe.
Like other viruses, including influenza, SARS, tuberculosis, and measles, it is possible for SARS-CoV-2 to spread through the air (Buonanno et al., 2020; Morawska et al., 2020; Somsen et al., 2020), and to be transmitted via exhaled droplets from an infected person to other people (Buonanno et al., 2020). The transmission characteristics of respiratory droplets in different types of buildings have been studied by researchers using computational fluid dynamics (CFD). A study on exhaled droplet transmissions between occupants in an office room was conducted by He et al. (2011) and the results showed that the different ventilation strategies had significant influences on the risk of exposure. The transmission of airborne contaminants exhaled by the nose or mouth was simulated by using N2O as the tracer gas in an experimental room by Villafruela et al. (2016). The non-uniform distribution of droplets in an aircraft cabin as exhaled by coughing, breathing, and talking was studied by Gupta et al. (2011). After obtaining the airflow field, Gupta et al. used the Wells-Riley equation (Riley et al., 1978) to calculate the infection risks for passengers with different locations, and reported that infection risks could be significantly reduced if the passengers wear N95 masks (Gupta et al., 2012). Shao and Li used the revised Wells-Riley equation and CFD method to predict the infection risks for Biden, Wallace, and the audience during the first presidential debate (Shao and Li, 2020).
However, as per the literature review, studies on the transmission of airborne contaminants and infection risks in theater halls remain rare. Nada et al. studied the airflow pattern in a crowded theater hall (Nada et al., 2016), but they only focused on the distribution of the velocity and temperature, and the thermal comfort of the audience. There was no research considering the distribution of polluted air, transmission of viruses, and/or probability of infection.
In this study, to determine whether it is safe to reopen theaters during the COVID-19 pandemic, the concentration distribution of a contaminant released by an infected person in a theater hall with an overhead air supply system is simulated using the CFD method under different supply air states, and with different locations of the infected person. According to the calculated results, the probabilities of infection for audiences with various distances from the infected person in different directions and with/without wearing masks are calculated using a revised Wells-Riley equation. Subsequently, recommendations for decreasing infection risks are proposed, and whether it is safe to reopen theaters during the epidemic is discussed.
Methodology
Probability of Infection
In this study, the probability of infection was calculated using the classical Wells-Riley equation. The Wells-Riley equation was first proposed by Riley et al., and achieved remarkable success in explaining the spread of a measles outbreak (Riley et al., 1978). It is a classic probabilistic model for indicating the probability of a person becoming infected, and is commonly used when the air in the room is evenly mixed; it is written as shown in Eq. 1.
where
After considering the impact of wearing masks, the quanta release rate (q) of the infected person can be calculated as
After correcting for the masks, Eq. 1 can be rewritten as Eq. 2.
The aforementioned Wells-Riley equation assumes that the predicted probability of infection is uniform within the room (Dai and Zhao, 2020). However, under actual ventilation and airflow patterns, the air in a room is not evenly mixed, leading to different concentrations of the quanta at different locations. To describe the non-uniform distribution of the quanta, a new parameter, the dilution ratio (
where,
When not considering the role of masks, and the supply air is only composed of fresh air, then
After considering the role of masks, the concentration of the quanta at the infected person is
Considering the role of masks, Eq. 5 can be written as Eq. 6.
It is convenient to analyze the probability of infection after considering the
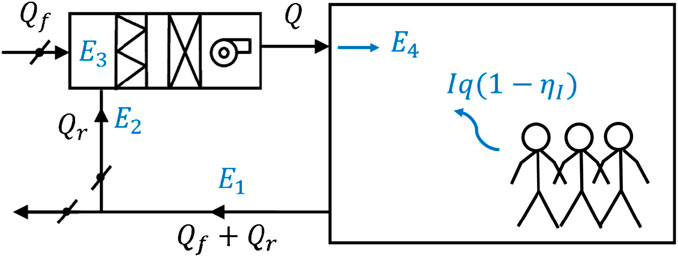
FIGURE 1. Distribution of quanta rate in a primary return air system.
For a primary return air system, the supply air comprises the return air and fresh air, and their volumes obey Eq. 7.
where
After the air flow in the system reaches a balance, the quanta concentration at the air exhaust, can be calculated using Eq. 8.
where
After part of the air leaves the system, the quanta concentration of the return air (
Because fresh air is considered as clean air, i.e., without contamination by viruses, the quanta concentration at the mixing chamber of the AHU (
After considering the filtration efficiency of the return air (
By combining Eqs 8–11, the conservation of the quanta in the primary return air system can be described using Eq. 12.
Therefore, the quanta concentration of the supply air (
When the system is under all fresh air operation,
In this study, there is one infected person in the theater hall, and the breath of the infected person and supply air are taken as the quanta source. The local concentration of the quanta is simulated using the CFD method. Subsequently, the local
The diameter of the new coronavirus has been observed as 0.06–0.14 µm (Zhu et al., Massachusetts Medical Society, 2020), and the diameters of the expiratory aerosols, which are the carriers of the new coronavirus, are between 1 and 1,000 μm; however, their diameters shrink rapidly (by approximately 50%) after evaporation. Thus, the diameters of the droplet nuclei mostly fall in the range of 1–10 μm, and can be considered as passively transported with the air flow, leading to a greater probability of infection for the susceptible person (Gao et al., 2008). Tracer gas is a commonly used method for indicating the concentration distribution(s) of passively transported pollutants. Thus, this study uses tracer gas to determine the local quanta concentration, and then the local
At the end of December 2020, more than 10 thousand cases are confirmed every day in London, covering more than 0.12% of the city’s total population (Londen Evening Standard, 2020). This proportion is for the whole city, however, for the areas where the epidemic is relatively more serious, the proportion is much higher. Thus, the probability of an infected person in the theater hall is assumed as 1% (the actual value is expected to be lower). The overall probability of infection is the combined result of the probability of an infected person in the theater hall and the probability of an audience being infected by that infected person during a movie. The overall probability of infection is considered as four levels, i.e., very dangerous, dangerous, slightly dangerous, and safe when the value is larger than 0.1%, 1.0E-4 - 0.1%, 1.0E-5 - 1.0E-4, and less than 1.0E-5, respectively. Thus, based on the calculated probability of infection for the audience, the risk level for an audience can be considered as very dangerous, dangerous, slightly dangerous, and safe when the value of the probability of an audience being infected by an infected person during a movie is larger than 10%, 1–10%, 0.1–1%, and less than 0.1%, respectively.
Computational Model of CFD
The physical model of the theater hall was selected according to the size of an actual movie theater hall, as shown in Figure 2A. The computational domain of this study was 15.4 m (length) × 8.0 m (width) × 6.1 m (height), and had seats arranged as 10 rows and 10 lines. An overhead mixing air flow was adopted in the theater hall: six square ceiling diffusers were arranged as the air inlets on the ceiling and two air exhausts were in the back of the theater hall, with an independent AHU (as commonly adopted in theaters) (Wan, 2012; Liu, 2014; Fu et al., 2018). 100 square ceiling simulators were used to simulate the 100 seated audiences and the size of each simulator was 0.4 m (length) × 0.4 m (width) × 0.9 m (height) (Nada et al., 2016). To simulate the air exhaled by the infected person, the nose was simplified to an opening with a diameter of 0.01 m (Gao et al., 2008). The grids for the air inlets and the nose of the infected person were denser than surroundings, as shown in Figures 2B,C, respectively.
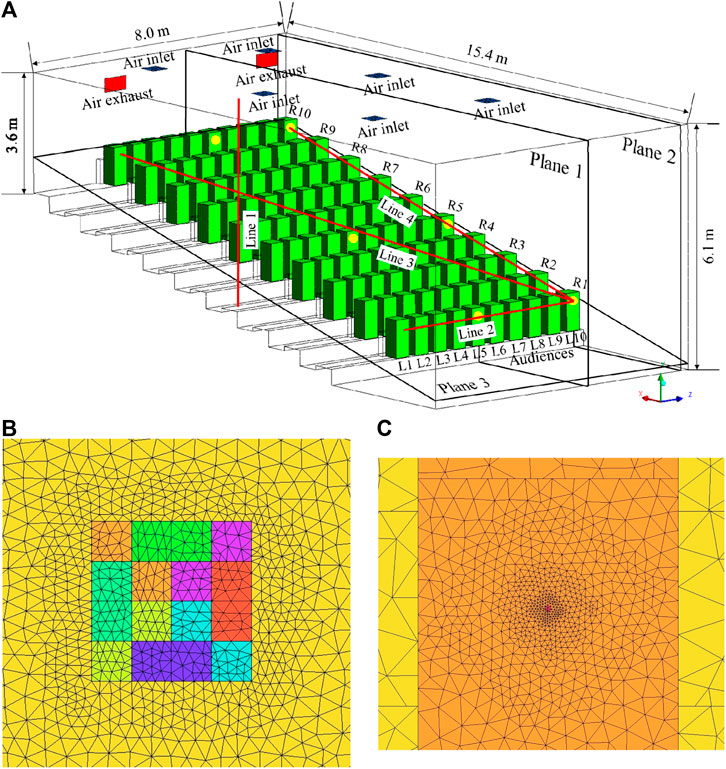
FIGURE 2. Physical model and grid distribution of the theater hall: (A) physical model; (B) grid distribution at the ceiling and air inlet; (C) grid distribution at the audience and nose.
The local concentration of the polluted air exhaled by the infected person was calculated by solving the species equation of the tracer gas. CO2 was chosen as the tracer gas, and its mass fraction at the nose of the infected person was considered as 4%. The steady flow field of the modeled theater hall was solved using the commercial software ANSYS FLUENT 16.0. The Boussinesq model was adopted to consider the buoyancy effect. The standard k-ε model was used to calculate the turbulence flow, and the standard wall function was chosen, as y+ was 5–30 for most of the walls in the simulated region. The finite volume method was used to discretize the turbulence and continuity equations. The body force weighted scheme was used for the discretization of the pressure equation, and the second-order upwind scheme was used for the discretization of the momentum, energy, and species equations. The pressure–velocity coupling was achieved by the “semi-implicit method for pressure-linked equations” (SIMPLE) algorithm. After the normalized residuals for the continuity, momentum, turbulence, energy, and species equations achieved 10–4, 10–6, 10–5, 10–7, and 10–5, respectively, and the parameters (velocity, temperature, and mass fraction of CO2) of each monitoring point did not change much with iteration, it was considered that the solution had converged.
Setup of Cases
To calculate the probability of infection, the parameters for Eqs. 1–15 were chosen. In the theater hall, one infected person with a pulmonary ventilation rate of 0.3 m3/h (Jin, 2010; Dai and Zhao, 2020) was considered. As audiences are sitting still when watching a movie lasting 2.5 h, the quanta release rate for the infected person was chosen as 10.5 quanta/h (Buonanno et al., 2020; Dai and Zhao, 2020). The efficiencies of the ordinary medical surgical masks and N95 masks were considered as 60% (Dai and Zhao, 2020) and 90% (Gupta et al., 2012), respectively. Therefore, in this study, the efficiencies of the masks for infected and susceptible persons were both considered as 75%. The filtration efficiency of the return air was considered as 60%.
Because the fresh air volume for the theater hall per capita was 20 m³/h (Ministry of Housing and Urban-Rural Development of the People's Republic of China, 2012), the total fresh air volume for the 100 audiences was set as 2,000 m³/h. According to the designed parameters of the AHU for the theater hall, the total supply air volume was 8,000 m³/h for adequate indoor velocity and temperature distributions. Thus, the return air volume was considered as 6,000 m³/h. To determine the optimal ventilation strategies during the epidemic, three different supply air states were chosen, as follows.
(1) Fresh air + return air without filtration: the supply air contained 2,000 m³/h of fresh air and 6,000 m³/h of return air, and the return air was not filtered.
(2) Fresh air + return air with filtration: the supply air contained 2,000 m³/h of fresh air and 6,000 m³/h of return air, and the return air was filtered, with an efficiency of 60%.
(3) All Fresh air: the supply air contained 8,000 m³/h of fresh air only.
The pollutant distribution was significantly affected by the relative positional relationship between the pollution source, air inlets, and air exhausts (Li and Zhao, 2004; Zhao et al., 2004). Therefore, to provide a comprehensive evaluation of the infection risks by considering different locations for the front, middle, and back seats, six positions were selected for the infected person, as shown in Figure 2A. The infected person was assumed to be located at row 1, line 10 (R1L10); row 5, line 10 (R5L10); row 10, line 10 (R10L10); row 1, line 5 (R1L5); row 5, line 5(R5L5); and row 10, line 5 (R10L5).
Additionally, four lines and three planes were selected for the grid independence study, validation, and presentation of the results, and their locations are shown in Figure 2A. Line 1 was selected for the grid independence study and validation, based on presenting the variations in the velocity, temperature, and mass fraction of the CO2. Three sample lines, i.e., Lines 2 to 4, with directions as right, right-back, and back, were selected for calculating the probability of infection with various distances from the infected person at R1L10. The three planes were selected to show the flow field and mass fraction distribution of the CO2. Planes 1 and 2 show the details of the vertical sections through the noses of audiences in lines 5 and 10, respectively. Plane 3 shows the details of the section through the noses of all the audiences. It was believed that these three planes can provide sufficient information regarding the theater hall.
From the combination of the two aforementioned factors, i.e., the supply air state and position of the infected person, eight working conditions were selected in this study, and their parameters are shown in Table 1. In Cases 1 to 3, the impact of the supply air state on the probability of infection was compared. In Cases 3 to 8, the impacts of the positions of the infected person on the probability of infection were compared. Additionally, the probabilities of infection when sitting in separate rows and lines, and when wearing or not wearing masks were also calculated and compared.
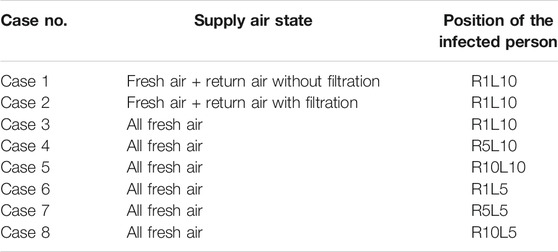
TABLE 1. Parameters of each working condition.
The boundary conditions for these eight cases are listed in Table 2. Square ceiling diffusers were used as air inlets, owing to their high airflow rates and high mixing effects. The momentum model was developed by Srebric and Chen (2002), and was used to simulate a square ceiling diffuser by dividing it into sixteen areas and providing the velocity and direction of each area, respectively. Thus, in this study, the square ceiling diffusers were considered as a velocity inlet with a velocity angle of 30° between the velocity direction and ceiling, and the effective area of each diffuser was divided into sixteen equal-sized areas, with four rows and four columns. The velocity magnitude was calculated as the ratio of the supply air volume to the effective area of the air inlet, and the temperature of the supply air was considered as 20°C. Additionally, the mass fraction of CO2 for the air inlets was determined according to Eq. 8. The nose of the infected person was considered as a velocity inlet with denser grids and the velocity magnitude was calculated according to the exhaled air volume and nose area. The human bodies were considered as constant heat flux walls, and only the sensible heat was calculated.
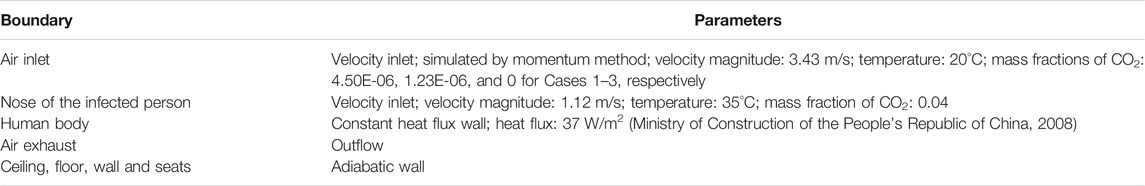
TABLE 2. Boundary conditions.
Grid Independence Study and Validation
Grid Independence Study
Unstructured grids obtained by ICEM CFD 16.0 were chosen in this study. The grid was denser where the gradients of velocity, temperature, and concentration were larger, i.e., the regions near the nose of the infected person, air inlets and exhausts, and wall. In Case 1, three different grids (1,052,450 cells, 1,993,370 cells, and 2,917,572 cells) were used to study the grid independence. Because natural convection and forced convection existed simultaneously in the room, the grid independence study was a challenge (He et al., 2011). The velocity, temperature, and mass fraction distribution were presented along the selected Line 1, as shown in Figure 3. The variances of velocity along Line 1 were similar for the three grids, however, the variances of temperature and mass fraction along Line 1 for grids with 1,993,370 cells and 2,917,572 cells were similar and were different from those for grid with 1,052,450 cells. Therefore, the grid with 1,993,370 cells was chosen for the study, because of its sufficient accuracy and low computational time consumption.
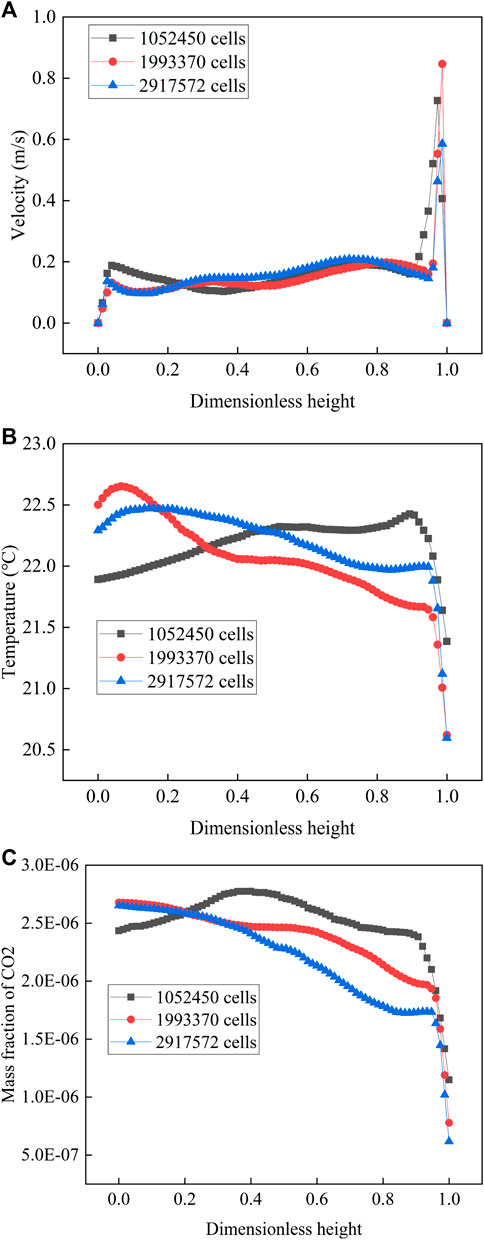
FIGURE 3. Comparison between different numbers of grids along Line 1: (A) variation of velocity; (B) variation of temperature; (C) variation of mass fraction.
Validation
The distributions of the velocity, temperature, and concentration in a theater hall are significantly affected by the supply air parameters. Therefore, validation was completed by comparing the velocity and temperature distributions near the square ceiling diffuser between the results simulated by this study, and the experimental results reported by Srebric and Chen Srebric and Chen (2002).
The distributions of the dimensionless velocity and dimensionless temperature along Line 1 are shown in Figures 4A,B, respectively. The discrepancies between the results from the CFD model used in this study and the experimental results from Srebric and Chen (2002), are acceptable. Thus, the CFD models presented in this study can be used to predict the flow field in a room influenced by square ceiling diffusers.
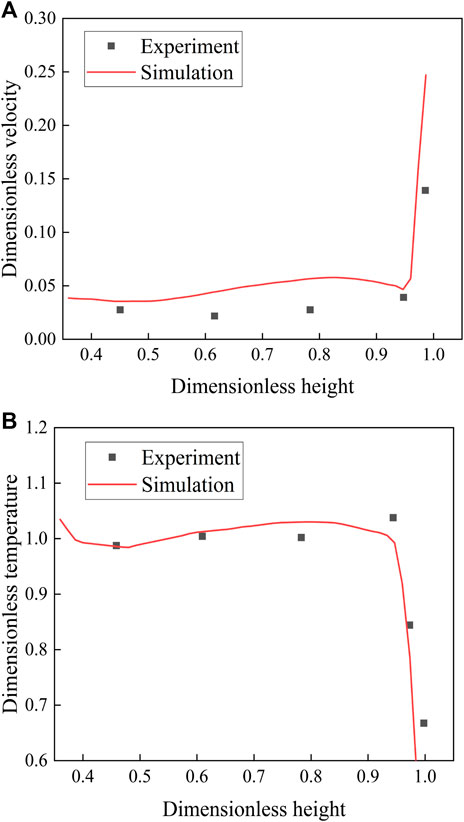
FIGURE 4. Comparison between the simulated results and experimental results from Srebric and Chen (Srebric and Chen, 2002): (A) variation of dimensionless velocity; (B) variation of dimensionless temperature.
Results and Analysis
The flow field of the theater hall was calculated using the CFD method, and the distributions of the mass fraction of CO2 under various supply air states and various locations of infected person are presented below. Subsequently, the probabilities of infection are calculated, and the results are analyzed.
Flow Field and Temperature Distribution
The infection risk was calculated according to the concentration distribution of CO2 in the theater hall, which was affected by the flow field. Thus, the flow field is considered first.
As the exhaled air volume from the infected person is significantly less than the clean air volume supplied by the air inlets, the indoor flow field is mainly affected by the air inlets and air exhausts. Thus, the flow fields in the theater hall for the eight cases are similar, as shown in Figure 5.
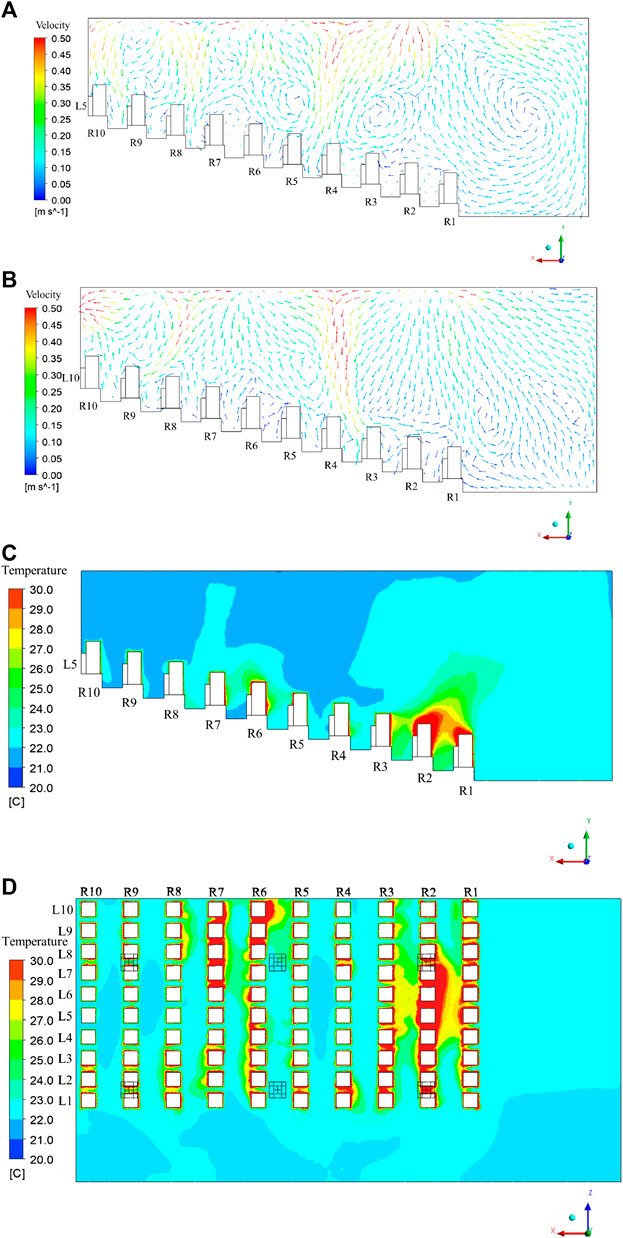
FIGURE 5. Flow field and temperature distribution in the theater hall: (A) flow field in Plane 1; (B) flow field in Plane 2; (C) temperature distribution in Plane 1; (D) temperature distribution in Plane 3.
The supply air flow moves closely to the ceiling after leaving the air inlets, and moves downward after colliding with other airflows or the wall. For the plane through the audiences at line 5, because the square ceiling diffusers are arranged above rows 2, 6, and 9, the audiences sitting in rows 4, 8, and 10 are mainly affected by the downward air flows, as shown in Figure 5A. After hitting the audiences and the floor, the supply air moves upward, and part of it is entrained by the supply airflow. Thus, local vortexes are generated, and the upward airflow returns to the bottom of the theater hall. The local vortexes are mainly located above rows 3 and 5 and in front of row 1, and are not conducive to the diffusion of pollutants.
As shown in Figure 5B, for the plane through the audiences at line 10, the audiences sitting at rows 1, 4, and 9 are mainly affected by the downward air flow. Owing to the suction of the air exhaust on the left side of Plane 2, the direction of the air flow is upward in row 10, and pollutants can be easily moved from the room. Additionally, owing to the suction of the air exhaust, the air flow moves from row 8 at the top to row 9 at the bottom. The influence of the air exhaust on the flow field is smaller than that of the air inlets; thus, only the back area of the theater hall is affected by the air exhaust.
The temperature distribution in the theater hall for the eight cases are similar, as shown in Figures 5C,D. For Plane 1 (the plane passing through the audiences in fifth line), the temperature is relatively high at the bottom of the theater hall, especially at the first to the third rows because of the local vortex, as explained in Figure 5A. The buoyancy effect affects the temperature distribution around the audiences: The temperature in the upper area is higher than that in the lower area around the audiences. However, the buoyancy effect, also known as natural convection, is weaker than forced convection. Thus, the indoor temperature distribution is mainly affected by supply airflow. As shown in Figure 5D, the temperature for most of the area in Plane 3 (the plane passing through all the audiences) is in the range of 22–26°C, though higher temperature areas exist locally. Thus, the air conditioning system is adequate for controlling the environment of the theater.
Impact of Supply Air State
The probabilities of infection were calculated based on the concentrations of CO2 near the noses of the audiences. Therefore, the mass fraction distribution of CO2 in Plane 3, that is, the plane passing through the noses of all the audiences, is presented below.
When the infected person is located at R1L10, i.e., far from the air inlets and air exhausts, the distributions of the mass fraction of CO2 in Plane 3 with different supply air states as “Fresh air + return air without filtration,” “Fresh air + return air with filtration,” and “All fresh air” are shown in Figures 6A–C, respectively; the right side of Figure 6 represents the front of the theater hall.
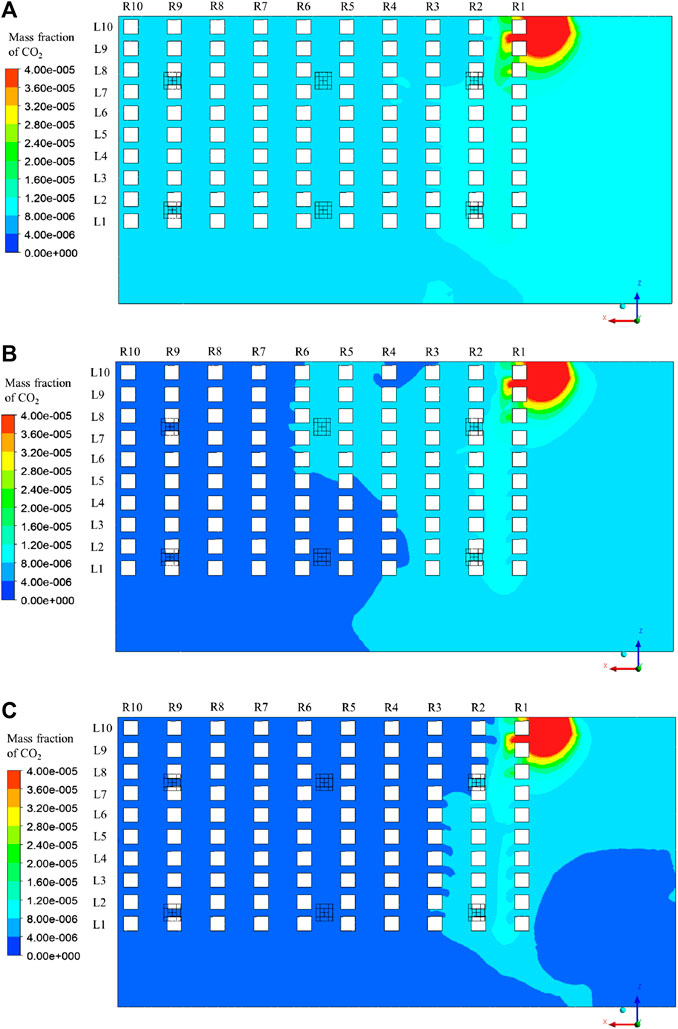
FIGURE 6. Distribution of mass fraction of CO2 in Plane 3: (A) Case 1; (B) Case 2; (C) Case 3.
The magnitude of the mass fraction changes with changes in the supply air states, resulting in different infection risks. When the valve controlling the return air is turned on, part of the pollutant exhaled by the infected person moves back to the theater hall again from the air inlets, resulting in a larger background concentration. When the return air is filtered, part of the pollutant can be removed and the supply air is cleaner than that without filtration, leading to a lower background concentration. When the supply air is fully composed of fresh air, only the pollutant exhaled by the infected person can directly influence the distribution of the mass fraction. Thus, Case 1 shows the largest mass fraction of CO2, followed by Case 2 and Case 3, and the overall infection risks of the audiences gradually decrease from Case 1 to Case 3.
The relative positional relationships between the infected person, air inlets, and exhausts are identical for the three cases; therefore, the distributions of the mass fraction of the CO2 for the three cases are similar. In general, the exhaled air from the infected person severely affects the front of the theater hall, especially the audiences sitting close to the infected person, i.e., the audiences at R1L9 and R1L8. As the distance from the infected person increases, the probability of infection decreases. The first row is the most affected, followed by the second row, and relatively less of the polluted air reaches the back area of the theater hall.
The mass fraction distributions of the CO2 in Plane 3 for the three cases are shown in Figures 7–C, respectively.
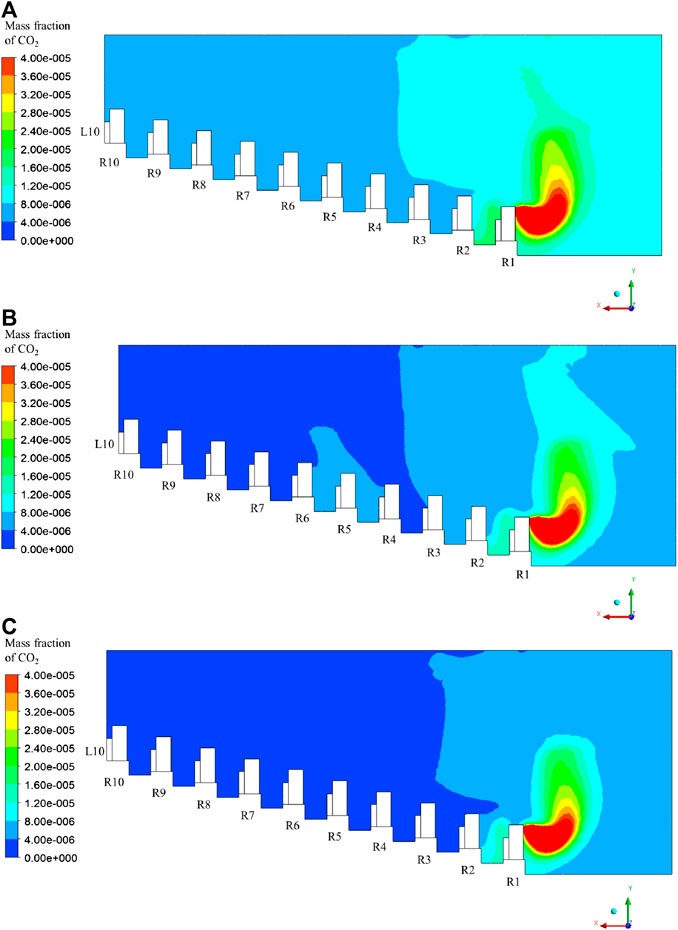
FIGURE 7. Distribution of mass fraction of CO2 in Plane 2: (A) Case 1; (B) Case 2; (C) Case 3.
The polluted air moves downward after leaving the nose of the infected person because of the downward air stream, as shown in Figure 5B. The local vortex existing in front of row 1 makes the downward airflow move upward, but part of it circulates and moves back to the audiences in row 1. Thus, adjacent audiences are affected. Additionally, part of the pollutant moves to rows 5 and 6 owing to the supply air flow above, and the local vortex prevents the diffusion of pollutants. Thus, the concentration here is relatively larger than in the adjacent area.
The impacts of the supply air states on the probability of infection for Cases 1 to 3 were compared. The probabilities of infection when all the audiences are not wearing masks under the three different supply air states along Lines 2 to 4 are shown in Figure 8. The probability of infection is always the largest in Case 1, followed by Cases 2 and 3. Thus, filtration of the return air and all fresh air operation can significantly reduce the probability of infection. Although the values of the probabilities for the different supply air states are different, they have the same trend when changing with the position of the audience. When the distance from the infected person gradually increases to the right, the probability of infection decreases rapidly, from 2.84 to 3.09% in the ninth line to 0.90–1.14% in the eighth line; then, it gradually decreases to 0.22–0.47%, as shown in Figure 8A. When the distance from the infected person gradually increases in the right-back direction, the probability of infection also gradually decreases. It decreases from 0.25 to 0.50% at R2L9 to 0.17–0.41% at R3L8, then increases to 0.18–0.43% at R4L7, and finally decreases gradually to 0.07–0.31%, as shown in Figure 8B. This can be explained by the entrainment effect of the supply air: the polluted air moves down again in row 4, leading to a local high probability of infection for the audience. When the distance from the infected person gradually increases to the back, the probability of infection first decreases from 0.25 to 0.50% in row 2 to 0.13–0.38% at 4, then increases to 0.17–0.41% at row 5, and finally decreases gradually to 0.07–0.32%, as shown in Figure 8C. Based on the results, it is necessary for the audiences to sit at certain distances, e.g., audiences should be arranged in separate seats.
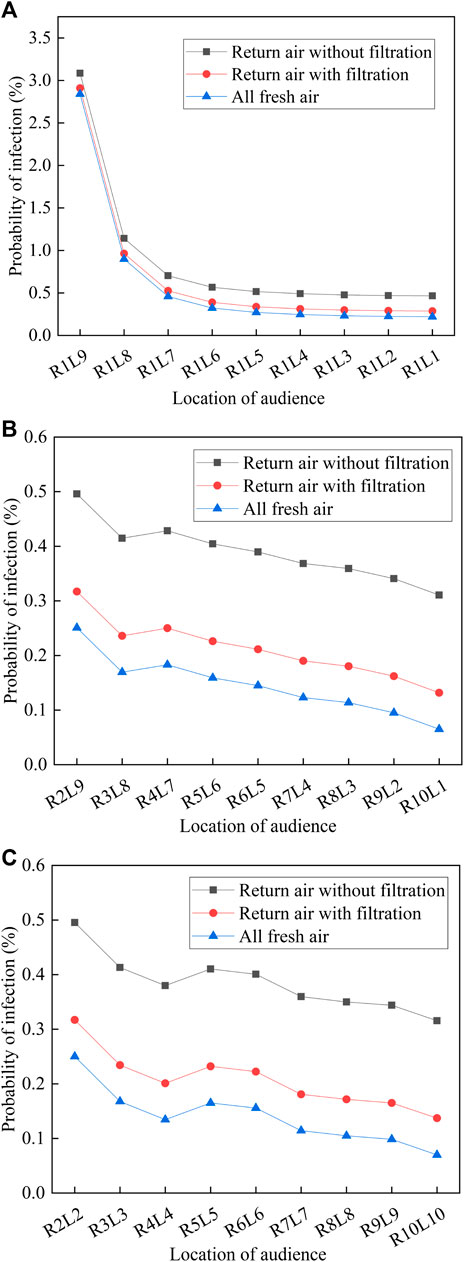
FIGURE 8. Probability of infection under three different supply air states: (A) Line 2; (B) Line 3; (C) Line 4
The probabilities of infection for all the audiences in the theater hall (except for the infected person) when wearing masks or not wearing masks and under different supply air volumes are presented in Figure 9. When not wearing masks, the probabilities of infection for Cases 1 to 3 are 0.31–3.09%, 0.13–2.91%, and 0.07–2.84%, respectively, and the average values are 0.45, 0.27, and 0.20%, respectively. Compared with the return air is not filtered, the probabilities of infection for return air with filtration and all fresh air operation decrease by 39.8 and 55.6%, respectively. Therefore, an all fresh air operation of the air-conditioning system and installation of a filter device on the return air duct are recommended for achieving a smaller overall probability of infection. Additionally, wearing masks can significantly reduce the overall probability of infection. When all the audiences, including the infected person, wear masks with efficiencies of 75%, the probabilities of infection in Cases 1 to 3 are 0.02–0.20%, 0.01–0.18%, and 4.1E-05–0.18%, respectively, leading the risk level to decrease from dangerous/slightly dangerous to slightly dangerous or safe.
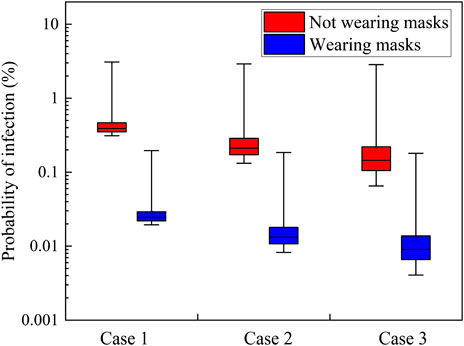
FIGURE 9. Probability of infection when wearing or not wearing masks for Cases 1–3.
Impact of Location of the Infected Person
To provide a comprehensive evaluation of the infection risks, when the supply air state is “All fresh air,” the mass fraction distributions of CO2 under Cases 4–8 with different positions of the infected person are presented in Figures 10, 11, and are compared with those under Case 3.
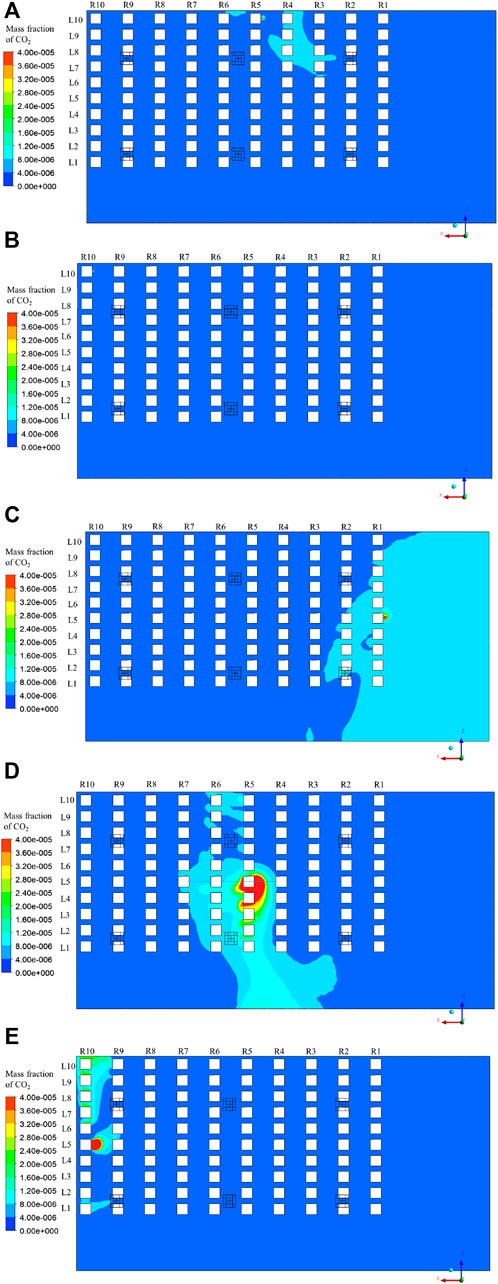
FIGURE 10. Distribution of mass fraction of CO2 in Plane 3: (A) Case 4; (B) Case 5; (C) Case 6; (D) Case 7; (E) Case 8.
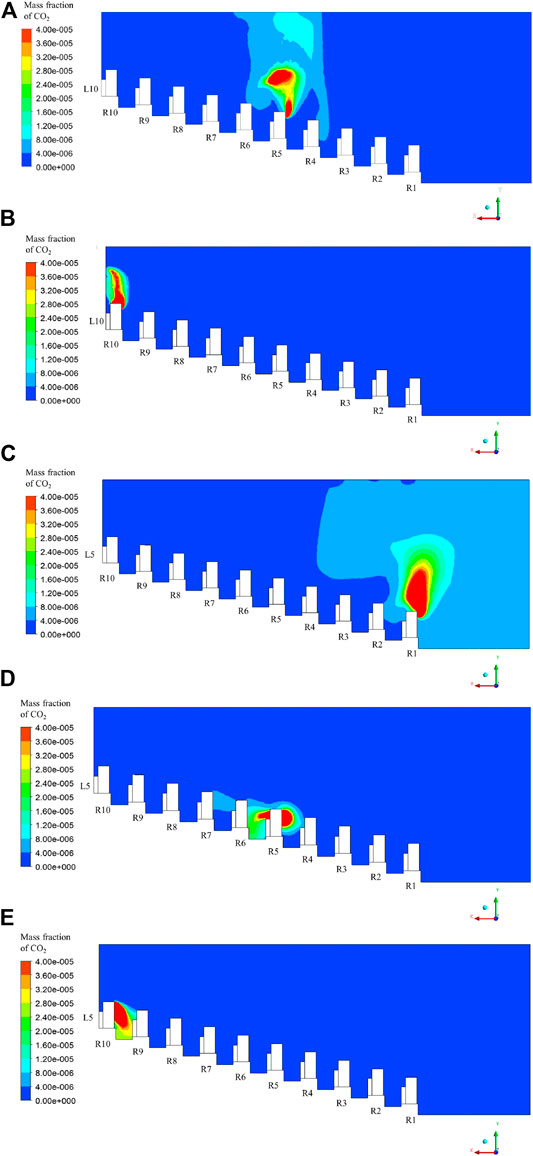
FIGURE 11. Distribution of mass fraction of CO2 in Plane 2: (A) Case 4; (B) Case 5; (C) Case 6; (D) Case 7; (E) Case 8.
In Case 4, the infected person is located at row 5, line 10. Because of the upward airflow at the nose as shown in Figure 5B, the polluted air exhaled by the infected person moves upward. However, local vortices exist above the infected person; thus, the pollutant gathers here, and part of it moves downward with the supply air, reaching row 4 again, as shown in Figure 11A. Thus, the audiences sitting in row 4, especially at R4L8, R4L9, and R4L10 have higher infection risks than others, as shown in Figure 10A.
In Case 5, the infected person sits in row 10, line 10, which is under the air exhaust. As shown in Figure 10B, the magnitude of the mass fraction in Plane 3 is lower than that in Cases 3 and 4. This phenomenon can be explained by the entrainment of the air exhaust: most of the exhaled air from the infected person moves upward and leaves the room, as shown in Figure 11B, resulting in a minimal influence on other audiences.
In Case 6, the infected person sits in row 1, line 5. As shown in Figure 10C, the magnitude of the mass fraction at the right side of Plane 3 is significantly higher than that at the left part. This is explained by the large vortex existing at the front of the theater hall, as shown in Figure 5A. The exhaled pollutant first moves upward as the air flows after leaving the infected person. However, until it reaches the ceiling, it is infected by the supply air from the front diffusers, and moves toward the screen. Then, it collides with the screen and floor and moves to the audiences sitting at row 1 again to complete its cycle, as shown in Figure 11C. Thus, all the audiences in row 1 and some in row 2 are significantly affected.
In Case 7, the infected person sits in row 5, line 5. As shown in Figure 10D, the magnitude of the mass fraction around the infected person is significantly large, resulting in large infection risks for audiences in the middle of rows 5 and 6. Because the infected person sits under the downward air stream, as shown in Figure 5A, the exhaled pollutant moves downward, which is different from the aforementioned cases. Thus, the exhaled pollutant cannot quickly leave the audience zone, affecting a large area, as shown in Figure 11D.
In Case 8, the infected person sits in row 10, line 5. The pollutant moves downward as shown in Figure 11E owing to the downward air stream near the infected person (as shown in Figure 5A), moves to the left and right at the bottom for a certain distance, and moves up, owing to the entrainment effects of the air exhausts. Thus, the audiences at R10L4 and R10L6 are not severely affected, but the audiences sitting under the two air exhausts, that is, the audiences at R10L1 and R10L7 to R10L10, are significantly affected, as shown in Figure 10E.
When wearing masks or not wearing masks, the probabilities of infection for all the audiences in the theater hall, except for the infected person, and under different positions of the infected person, are presented in Figure 12.

FIGURE 12. Probability of infection when wearing or not wearing masks for Cases 3–8.
When not wearing masks, the probabilities of infection for Cases 3 to 5 are 0.07–2.84%, 0.05–0.27%, and 4.14E-10–9.79E-09, respectively, as corresponding to the location of the infected person sitting in Line 10, but from the front to the back of the theater hall; the average values are 0.20, 0.12%, and 2.44E-09, respectively. When not wearing masks, the probabilities of infection for Cases 6 to 8 are 0.06–0.35%, 0.05–2.05%, and 3.0E-07–0.94%, respectively, as corresponding to the location of the infected person sitting in Line 5 but from the front to the back of the theater hall; the average values are 0.16, 0.17, and 0.03%, respectively. For Cases 3, 4, 6, and 7, when the infected person sits in the front or middle of the theater hall, there exists a certain distance from the infected person to the air exhaust and the exhaled pollutant stays longer in the room because of the downward streams or local vortexes, resulting in larger probabilities of infection. However, for Cases 5 and 8, when the infected person sits at the back of the theater hall and is near the air exhaust, the majority of the exhaled pollutant can be removed directly, thereby achieving a relatively low probability of infection. The probability of infection is the lowest in Case 8, because the infected person is the closest to the air exhaust. Additionally, when all the audiences wear masks, the overall probability of infection can be significantly reduced by 93.7% (as compared with the situation without wearing masks). The probabilities of infection when wearing masks for Cases 3–8 are 4.1E-05–0.18%, 3.2E-05–0.02%, 2.6E-11–6.1E-10, 4.0E-05–0.02%, 3.3E-05–0.13% and 1.9E-08–5.9E-04, respectively.
As mentioned in Impact of Supply Air State, because the probability decreases as the distance from the infected person increases, maintaining a certain distance while arranging the seats is necessary for safely reopening the theater. When the audiences are sitting in separate rows and lines but not wearing masks, the maximum probabilities are 0.90, 0.25, 0.29, and 1.02%, respectively, and the average probabilities are 0.18, 0.21, 0.16, and 0.16%, respectively, for the infected person being located at R1L10, R5L10, R1L5, and R5L5. Compared with the results of Cases 3, 4, 6, and 7, arranging the seats in separate rows and lines can significantly reduce the maximum infection risks by 68.3, 7.4, 50.2, and 17.1% (the effect of reducing the average value is insignificant), respectively, which is beneficial for reopening the theater.
Discussion
The probabilities of infection for Cases 1 to 8 when wearing or not wearing masks are calculated based on the assumption that the quanta emission rate is 10.5 quanta/h, according to Buonanno et al. (2020) and Dai and Zhao (2020). However, this value is estimated when the audience is resting and breathing. To decide whether it is safe to reopen theaters, this study takes two larger values for the quanta emission rate as 30 and 50 quanta/h to discuss the probabilities, which are in the reasonable range described by Buonanno et al. (2020). The probabilities of infection when quanta emission rates are 30 and 50 quanta/h are shown in Table 3.
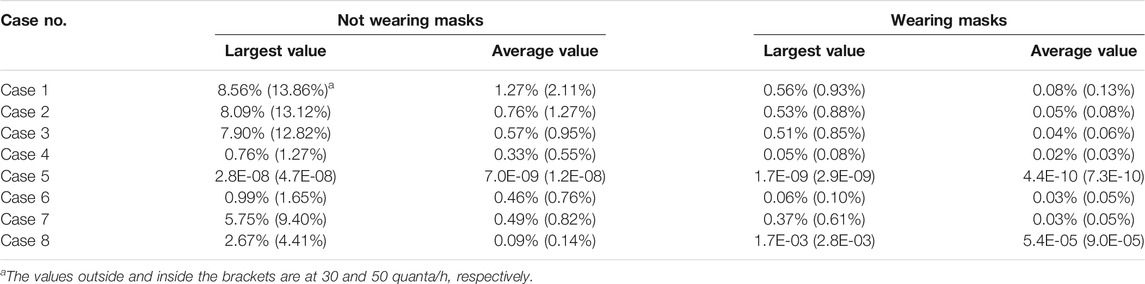
TABLE 3. Probability of infection when quanta emission rates are 30 and 50 quanta/h.
Comparing Cases 1–3, the average probability of infection decreases significantly after using return air filtration and is less than 1% (slightly dangerous) after operation under all fresh air condition, even when the quanta emission rate is as high as 50 quanta/h. Thereby, filtration of the return air can significantly reduce the overall infection risks for all of the audiences, and all fresh air operation can further guarantee the lowest overall infection risks. Thus, they are both recommended ventilation strategies for reopening theaters.
If all the audiences wear masks with 75% efficiency, the probability of infection can be reduced by 93.7%. Even under unfavorable conditions (e.g., the infected person at R1L10; return air without filtration; 50 quanta/h), the maximum and average probabilities are 0.93 and 0.13%, respectively; thus, the risk level is considered as slightly dangerous. However, for the majority of other cases when wearing masks, the overall risk level can be considered as safe. Therefore, wearing masks should be required when reopening theaters.
Additionally, the infection risks when there are two infected people (located at two unfavorite seats: R1L10 and R5L5) are considered, and are compared with the results of Cases 3 and 7. As tracer gas is passively transmitted, the probabilities for the two-infected-people condition are calculated according to the summary of the CO2 concentrations for Cases 3 and 7. When not wearing masks and under 10.5, 30, and 50 quanta/h, the maximum probabilities under the two-infected-people condition are 2.90, 8.05, and 13.06%, respectively, i.e., approximately the same as the maximum values for Cases 3 and 7, and the average probabilities are 0.38, 1.07, and 1.77%, respectively, i.e., approximately the summary values for Cases 3 and 7. Thus, even though there may exist two infected people in unfavorable seats after opening theaters, the maximum probabilities change little, and can be avoided by sitting in separate rows and lines. The average probabilities increase significantly, but can be decreased by wearing masks: the average probabilities are 0.02, 0.07, and 0.11% after wearing masks, and are considered approximately safe, along with those using return air filtration or all fresh air operation.
When all the audiences are wearing masks during a 2.5-h movie, but the infected person takes off the mask for half an hour, the overall possibilities of infection are calculated by weighting the length of the two periods: the infected person wears mask for 2 h and doesn’t wear mask for half an hour. The results show that compared with the conditions when the infected person wears mask during the whole movie, the possibilities of infection increase 60%. When quanta emission rate is 10.5 quanta/h, the largest probabilities of infection for Cases 1–8 are 0.32%, 0.29%, 0.29%, 0.03%, 9.8E-10, 0.03%, 0.21%, and 0.09%, respectively, which can still be considered as enough safe.
In summary, even though the quanta emission rate may be as high as 30–50 quanta/h and there may exist two infected people, theaters can be reopened safely under return air filtration or all fresh air operation, and when the audiences are sitting in separate seats and wearing masks.
Conclusion
In this study, the distribution of the polluted air released by an infected person in a theater hall with an overhead air supply system is numerically calculated using the CFD method under different supply air states and different locations of the infected person. Based on the simulated results and a revised Wells-Riley equation, the probabilities of infection for audiences with various distances from the infected person in different directions and with/without wearing masks are calculated. Recommendations for decreasing the infection risks are proposed, and whether it is safe to reopen theaters is discussed. Unfavorable situations are discussed, e.g., when the quanta emission rate is high and there are two infected people. According to the results, the following conclusions are drawn.
(1) The probabilities of infection for return air filtration and all fresh air operation decrease by 39.8 and 55.6%, respectively, relative to when the return air is not filtered. Thus, an all fresh air operation of the air-conditioning system and an installation of a filter device on the return air duct are recommended.
(2) The probabilities of infection for the audiences sitting nine seats away from the infected person on the right, right back, and back are 84.9–92.3%, 37.3–74.0%, and 36.3–72.0% lower, respectively, than those of the audiences sitting one seat away from the infected person. Thus, for safety and epidemic prevention, the audiences should keep a certain distance when sitting. Sitting in separate rows can reduce the maximum probability by 7.4–68.3%.
(3)The probability of infection can be reduced by 93.7% if all the audiences wear masks with efficiencies of 75%. The maximum and average probabilities of infection do not exceed 0.20 and 0.03%, respectively, and are considered to be sufficiently safe. Thus, the audiences should be required to wear masks when watching a movie.
(4) After adopting the recommended methods in conclusions (1)–(3), the probability of infection can be controlled within a relatively safe range, even when, e.g., the quanta emission rate is 30 or 50 quanta/h, and there are two infected people in unfavorable seats. Thereby, under return air filtration or all fresh air operation, when all the audiences are sitting in separate seats and wearing masks, theaters can be safely reopened.
Data Availability Statement
The original contributions presented in the study are included in the article/Supplementary Material, further inquiries can be directed to the corresponding author.
Author Contributions
CL: Conceptualization, methodology, investigation, writing—original draft. SJ: Methodology, investigation. XS: Methodology, Writing—review and editing. HW: Writing—review and editing. SY: Investigation. ZY: Investigation. XL: Conceptualization, Supervision, Funding acquisition, Writing—review and editing.
Funding
The authors gratefully acknowledge the support from Tsinghua University Spring Breeze Fund (grant number 2020Z99CFZ025).
Conflict of Interest
The authors declare that the research was conducted in the absence of any commercial or financial relationships that could be construed as a potential conflict of interest.
Acknowledgments
The authors gratefully acknowledge the support from Professor Xudong Yang from Tsinghua University for his contribution to the revised Wells-Riley equation.
Abbreviations
AHU, air handling unit; CFD, computational fluid dynamics; COVID-19, corona virus disease 2019; DR, dilution ratio; GDP, gross national product; SARS, severe acute respiratory syndrome SARS-CoV-2, severe acute respiratory syndrome coronavirus-2; SIMPLE, semi implicit method for pressure linked equations
Nomenclature
Greek symbols
References
Buonanno, G., Stabile, L., and Morawska, L. (2020). Estimaton of airborne viral emission: quanta emission rate of SARS-CoV-2 for infection risk assessment. Environ. Int. 141, 105794. doi:10.1016/j.envint.2020.105794
Clark, T. (2020). China’s box office is down nearly $2 billion as movie theaters remain closed amid coronavirus concerns. New York, NY: Business Insider.
Cui, Q., Hu, Z., Li, Y., Han, J., Teng, Z., and Qian, J. (2020). Dynamic variations of the COVID-19 disease at different quarantine strategies in Wuhan and mainland China. J. Infect. Public Health 13 (6), 849–855. doi:10.1016/j.jiph.2020.05.014
D’Alessandro, A. (2020). Weekend box office headed to 22-year-low at $58M+ as coronavirus fears grip nation. Los Angeles, CA: Deadline Hollywood.
Dai, H., and Zhao, B. (2020). Association of the infection probability of COVID-19 with ventilation rates in confined spaces. Build. Simul. 13, 1–7. doi:10.1007/s12273-020-0703-5
Džiugys, A., Bieliūnas, M., Skarbalius, G., Misiulis, E., and Navakas, R. (2020). Simplified model of Covid-19 epidemic prognosis under quarantine and estimation of quarantine effectiveness. Chaos Solitons Fractals 140, 110162. doi:10.1016/j.chaos.2020.110162
Fu, X., Jiang, Z., Cui, E., and Xue, Y. (2018). Optimal design of ventilation and air conditioning system in cinema. Energy Conserv. 5 (428), 26–27. doi:10.3969/j.issn.1004-7948.2018.05.007
Gao, N., Niu, J., and Morawska, L. (2008). Distribution of respiratory droplets in enclosed environments under different air distribution methods. Build. Simul. 1 (4), 326–335. doi:10.1007/s12273-008-8328-0
Gupta, J. K., Lin, C. H., and Chen, Q. (2011). Transport of expiratory droplets in an aircraft cabin. Indoor Air 21 (1), 3–11. doi:10.1111/j.1600-0668.2010.00676.x
Gupta, J. K., Lin, C. H., and Chen, Q. (2012). Risk assessment of airborne infectious diseases in aircraft cabins. Indoor Air 22 (5), 388–395. doi:10.1111/j.1600-0668.2012.00773.x
He, Q., Niu, J., Gao, N., Zhu, T., and Wu, J. (2011). CFD study of exhaled droplet transmission between occupants under different ventilation strategies in a typical office room. Build. Environ. 46 (2), 397–408. doi:10.1016/j.buildenv.2010.08.003
Jin, W. (2010). Influence of environmental conditions on airborne infection risk in ward. J. Southeast Univ. 26 (2), 266–269. doi:10.3969/j.issn.1003-7985.2010.02.027
Kanitkar, T. (2020). The COVID-19 lockdown in India: impacts on the economy and the power sector. Global Transit. 2, 150–156. doi:10.1016/j.glt.2020.07.005
Li, X., and Zhao, B. (2004). Accessibility: a new concept to evaluate ventilation performance in a finite period of time. Indoor Built Environ. 13, 287–293. doi:10.1177/1420326X04045440
Liu, N. (2014). Construction and design for project. 106–108. doi:10.13616/j.cnki.gcjsysj.2014.06.024106
Londen Evening Standard (2020). London coronavirus cases rise by 56,000 in a week as hospital patient numbers jump. Available at: https://www.standard.co.uk/news/london/london-coronavirus-cases-rise-hospitals-b453615.html, (Accessed December 23, 2020).
Ministry of Construction of the People’s Republic of China (2008). JGJ 58-2008. Code for architectural design of cinema Beijing, China.
Ministry of Housing and Urban-Rural Development of the People's Republic of China (2012). GB 50736-2012. Design code for heating ventilation and air conditioning of civil buildings Beijing, China.
Morawska, L., Tang, J. W., Bahnfleth, W., Bluyssen, P. M., Boerstra, A., Buonanno, G., et al. (2020). How can airborne transmission of COVID-19 indoors be minimised? Environ. Int. 142, 105832. doi:10.1016/j.envint.2020.105832
Nada, S. A., El-Batsh, H. M., Elattar, H. F., and Ali, N. M. (2016). CFD investigation of airflow pattern, temperature distribution and thermal comfort of UFAD system for theater buildings applications. J. Build. Eng. 6, 274–300. doi:10.1016/j.jobe.2016.04.008
National Bereau of Statistic in China (2020). Preliminary accounting results of gross domestic product (GDP) for the second quarter and first half of 2020. Available at: http://www.stats.gov.cn/tjsj/zxfb/202007/t20200717_1776516.html, (Accessed July 17, 2020).
Nicola, M., Alsafi, Z., Sohrabi, C., Kerwan, A., Al-Jabir, A., Iosifidis, C., et al. (2020). The socio-economic implications of the coronavirus pandemic (COVID-19): a review. Int. J. Surg. 78, 185–193. doi:10.1016/j.ijsu.2020.04.018
Riley, E. C., Murphy, G., and Riley, R. L. (1978). Airborne spread of measles in a suburban elementary school. Am. J. Epidemiol. 107 (5), 421–432. doi:10.1093/oxfordjournals.aje.a112560
Shao, X., and Li, X. (2020). COVID-19 transmission in the first presidential debate in 2020. Phys. Fluids 32 (11), 115125. doi:10.1063/5.0032847
Shoard, C. (2020). Cinema bullish in the face of coronavirus despite projected $5bn loss. Manchester, United Kingdom: The Guardian.
Somsen, G. A., van Rijn, C., Kooij, S., Bem, R. A., and Bonn, D. (2020). Small droplet aerosols in poorly ventilated spaces and SARS-CoV-2 transmission. Lancet Respir. Med. 8 (7), 658–659. doi:10.1016/s2213-2600(20)30245-9
Srebric, J., and Chen, Q. (2002). Simplified numerical models for complex air supply diffusers. HVAC&R Res. 8 (3), 277–294. doi:10.1080/10789669.2002.10391442
Villafruela, J. M., Olmedo, I., and San José, J. F. (2016). Influence of human breathing modes on airborne cross infection risk. Build. Environ. 106, 340–351. doi:10.1016/j.buildenv.2016.07.005
Wan, L. (2012). A cinema of ventilation and air conditioning design. Refrigeration 31 (2), 43–46. doi:10.3969/j.issn.1005-9180.2012.02.009
Wells, W. F. (1955). Airborne contagion and air hygiene. An ecological study of droplet infections. Oxford: Oxford University Press.
World Health Organization (2020). WHO coronavirus disease (COVID-19) dashboard. Available at: https://covid19.who.int/, (Accessed October 30, 2020).
Zhao, B., Li, X., Chen, X., and Huang, D. (2004). Determining ventilation strategy to defend indoor environment against contamination by integrated accessibility of contaminant source (IACS). Build. Environ. 39 (9), 1035–1042. doi:10.1016/j.buildenv.2004.01.025
Keywords: COVID-19, theater, infection risk, CFD, reopen economy
Citation: Liang C, Jiang S, Shao X, Wang H, Yan S, Yang Z and Li X (2021) Is it Safe to Reopen Theaters During the COVID-19 Pandemic?. Front. Built Environ. 7:637277. doi: 10.3389/fbuil.2021.637277
Received: 03 December 2020; Accepted: 18 January 2021;
Published: 04 March 2021.
Edited by:
Bin Yang, Xi’an University of Architecture and Technology, ChinaReviewed by:
Haiguo Yin, Xi’an University of Architecture and Technology, ChinaJiying Liu, Shandong Jianzhu University, China
Copyright © 2021 Liang, Jiang, Shao, Wang, Yan, Yang and Li. This is an open-access article distributed under the terms of the Creative Commons Attribution License (CC BY). The use, distribution or reproduction in other forums is permitted, provided the original author(s) and the copyright owner(s) are credited and that the original publication in this journal is cited, in accordance with accepted academic practice. No use, distribution or reproduction is permitted which does not comply with these terms.
*Correspondence: Xianting Li, eHRpbmdsaUB0c2luZ2h1YS5lZHUuY24=