 Dimitrios Kalliontzis
 Maryam Nazari
- 1Department of Civil and Environmental Engineering, University of Houston, Houston, TX, United States
- 2Department of Civil Engineering, California State University, Los Angeles, CA, United States
Over the past two decades, precast concrete members have been utilized in seismically resilient structures. In developing these structures, different techniques have been used for connecting the precast members to the foundation. In building construction, unbonded post-tensioning (PT) tendons can anchor a precast wall to the foundation, resulting in the so-called rocking wall system. The rocking wall system develops a dry connection with the foundation and provides moment resistance by means of the PT tendons. The PT tendons remain elastic when the wall is subjected to design-level ground motions to preserve the re-centering capability of the wall. Moreover, the structural damage is concentrated near the wall toes and can be minimized with proper detailing of the toes. Rocking wall systems can consist of a Single precast Rocking Wall (SRW), which uses no supplemental damping, or walls with supplemental damping in the form of viscous or hysteretic energy dissipating devices. In addition to the supplemental damping, rocking walls dissipate the seismic energy through their impacts on the foundation base, their inherent viscous damping, and the hysteresis of concrete near the wall base. While the investigation of rocking walls continues to gain interest, there is no widely accepted means of modeling their dynamic behavior. This paper investigates two popular approaches for modeling rocking walls with and without supplemental damping: the finite element method and analytical modeling. The ability of the two approaches to capture the local and global responses of the walls is evaluated against shake table tests of walls with multiple-level intensity base motions. Next, the behavior characteristics of the two modeling approaches and their ability to simulate impact damping are discussed.
Background
Unbonded Post-tensioned Precast Concrete Walls
Figure 1A shows an unbonded post-tensioned precast concrete wall with a rocking connection to the foundation base, named as the Single Rocking Wall (SRW). Under seismic lateral loads, the bottom corner of the SRW uplifts as the wall experiences a rocking motion. Seismic shear forces are transferred from the wall to the foundation through friction and the post-tensioning (PT) force enhances re-centering of the wall, following a seismic excitation.
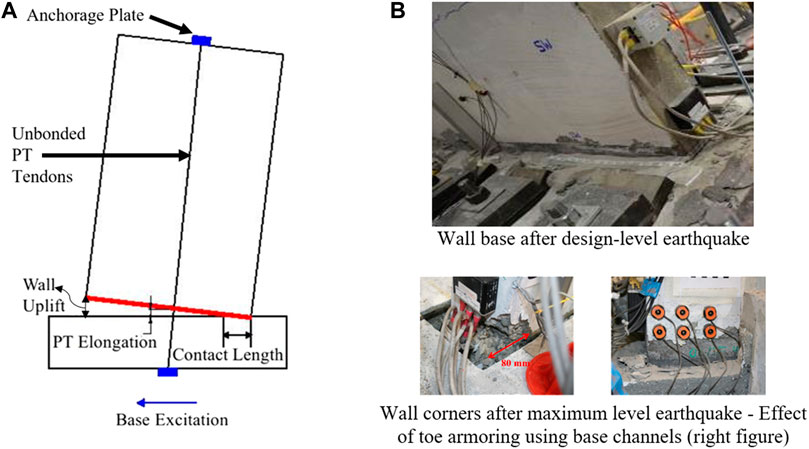
FIGURE 1. Single rocking wall (SRW) (Nazari et al., 2017): (A) System setup; (B) Damage status after earthquakes.
During the rocking motion, the PT tendons remain elastic and damage of the wall due to concrete nonlinearity is limited to the bottom toes of the wall, as shown in Figure 1B (Kurama et al., 1999; Perez et al., 2004; Twigden, 2016; Nazari et al., 2017; Kalliontzis and Sritharan, 2020). Due to the limited hysteretic action in SRWs, these walls have been viewed as inadequate to efficiently dissipate the absorbed seismic energy. This observation has been formalized in ACI ITG-5.1 (2008) and, subsequently, in ACI 550.6 (2019) which require a minimum energy dissipation ratio as part of the acceptance criteria for precast concrete rocking walls. This ratio is defined as the area enclosed by the hysteresis loop in the force-displacement curve for a cycle over the area of the circumscribing parallelogram. This ratio shall not be less than 12.5%, which exceeds the ratio provided by SRWs. More recently, a performance-based design approach for precast concrete rocking walls has also been presented by Mpampatsikos et al. (2020).
To improve the hysteretic damping of SRWs, different wall systems have been developed utilizing supplemental damping devices. For example, Priestley et al. (1999) developed the jointed wall system where two or more precast concrete walls are connected horizontally with special stainless U-shaped Flexural Plates (UFPs). Though adequate hysteretic damping can be provided through the UFPs, the jointed wall system has not found its way to practice because it provides reduced moment capacity compared to monolithic reinforced concrete walls and the fabrication of UFPs is uneconomical. Restrepo and Rahman (2000) investigated a different concept where partially de-bonded mild steel bars cross the rocking connection of the walls to dissipate the absorbed seismic energy through axial yielding of the bars. This system, named as the hybrid wall system, can provide improved moment capacity and adequate hysteretic energy dissipation. One disadvantage of the hybrid wall system is the inability to inspect and, if needed, replace the mild steel bars in the aftermath of a seismic event. To facilitate replaceability of the supplemental damping devices, Marriott et al. (2008) investigated the use of external energy dissipators across the rocking connection. More recently, Sritharan et al. (2015) developed the PreWEC (PREcast Wall with End Columns) system where replaceable and cost-effective Oval-shaped connectors, namely O-connectors, are utilized. The O-connectors join the wall horizontally with two end or side columns, as shown in Figures 2A,B, respectively. Under seismic lateral loads, the O-connectors undergo inelastic deformations through vertical relative movements of the connector legs, providing hysteretic damping to the PreWEC. As shown experimentally by Sritharan et al. (2015), the O-connectors can be designed to produce different levels of hysteretic damping for the PreWEC and moment capacity that is comparable to monolithic reinforced concrete walls.
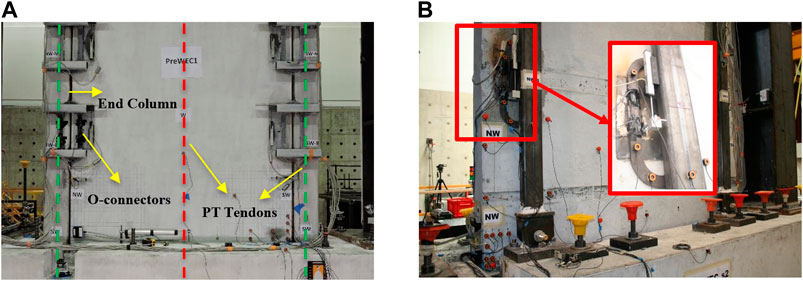
FIGURE 2. PreWEC (PREcast wall with end columns) system: (A) Connectors at the ends of the wall panel; (B) Connectors on the sides of the wall panel.
Damping Behavior
In the above-referenced studies, the lateral behavior of the walls was characterized through quasi-static testing, which inhibited the energy dissipation produced by viscous damping and wall impacts on the foundation. Though dynamic tests were also performed (e.g., Marriott et al., 2008), the individual contribution of different damping mechanisms was not assessed.
More recently, research studies used free vibration and shake table tests of walls to investigate the dynamic sources of energy dissipation. In Kalliontzis et al. (2016), Nazari et al. (2017), and Nazari and Sritharan (2020), appropriate test conditions were established by excluding the supplemental damping devices. Using shake table tests of four SRWs, Nazari et al. (2017) and Nazari and Sritharan (2020) quantified an average value of 1.5% equivalent damping ratio due to wall impacts and 4.2% due to hysteretic action and inherent viscous damping combined, which was based on lateral drift responses in the range of 1.4–2.6%. A different approach of quantifying impact damping experimentally was followed by Kalliontzis et al. (2016) utilizing the coefficient of restitution model proposed by Housner (1963). Kalliontzis et al. (2016) tested three precast concrete members in free vibration, which included one SRW, and recorded the kinetic energy losses of the three members during the impacts. Using the experimental measurements, a generalized formula was developed for the coefficient of restitution,
where
However, Eq. 1 may be impractical for use in design procedures, where the expression of impact damping in terms of an equivalent viscous damping ratio,
Nazari and Sritharan (2018) observed experimentally that the impact damping may be less significant in walls with supplemental damping devices, such as the PreWECs. They indicated that only 1.14% of the 16.3% total
where
Modeling Approaches
Following the experimental observations, researchers attempted to reproduce the behaviors of the different wall systems using modeling approaches. One approach was the use of existing finite element platforms with frame element models in the form of distributed or lumped plasticity models or with three-dimensional models (e.g., Marriott et al., 2008; Henry 2011; Belleri et al., 2013; Kalliontzis and Sritharan, 2014; Twigden 2016; Nazari et al., 2017; Kalliontzis and Sritharan, 2018; Nazari and Sritharan, 2018). In the existing finite element platforms, all damping components (e.g., hysteretic, inherent viscous, and impact damping) were lumped into single or multiple continuous energy dissipating elements, with the damping terms being tailored based on the experimental data of individual walls. Moreover, energy loss due to impact was implemented with continuous damping, which neglected that impacts are short-time events, as shown experimentally by Kalliontzis et al. (2016) and Nazari et al. (2017). Some of these models showed good accuracy for lateral drift responses of walls up to 4–5% (Nazari et al., 2017; Nazari and Sritharan 2018).
To improve modeling of impact damping in the finite element method, researchers utilized the numerical damping generated by the Hilber-Hughes-Taylor (HHT) time-integration scheme, which was shown to dissipate seismic energy in short-time intervals, thus closely simulating the impact damping (Vassiliou et al., 2016; Aghagholizadeh, 2020). Outside existing finite element platforms, frame elements have been developed with methodologies to incorporate instantaneous or short-time impact energy loss (Diamantopoulos and Fragiadakis, 2019; Avgenakis and Psycharis, 2020). Although, these latter studies were validated with analytical models of free-standing rigid blocks, their accuracy with respect to experiment data of precast concrete walls with or without supplemental damping devices was not examined.
Kalliontzis and Sritharan (2020) and Kalliontzis et al. (2020) enhanced the capabilities of the simple analytical model proposed by Housner (1963) to simulate the seismic behavior of rocking walls. In Kalliontzis et al. (2020), a dynamic analysis approach was developed for SRWs to represent the different damping components individually, which included an event-based approach for capturing impact damping. The proposed dynamic analysis approach is generalized, in that it is independent of a specific wall problem, so that it can be applied to various wall geometries, designs, and materials. It is computationally efficient and has been verified with experiments of precast concrete as well as masonry SRWs. Until this research study, the generalized dynamic analysis approach (GDAA) has not been investigated with respect to walls with supplemental damping devices (e.g., PreWEC).
Research Significance
This paper is an effort to understand and compare the accuracy of the finite element and analytical models for simulating unbonded post-tensioned precast concrete walls with and without supplemental damping. For this purpose, the finite element model (FEM) developed by Nazari et al. (2017) and the generalized dynamic analysis approach (GDAA) by Kalliontzis et al. (2020) are compared against shake table tests of walls without (i.e., SRWs) and with supplemental damping (i.e., PreWECs). To enable these comparisons, the GDAA is enhanced with the capability to model the supplemental damping in the PreWECs and the lateral inertia effects induced by floor systems. For this purpose, a constitutive model for the O-connectors is also developed. Next, the behavior characteristics of the two modeling approaches and their ability to simulate impact damping are discussed.
Review of Shake Table Tests of Rocking Walls
A total of eight unbonded post-tensioned precast concrete walls were tested using the National Earthquake Engineering Simulation (NEES) shake table facility at the University of Nevada, Reno by Nazari et al. (2015). The walls were designed as part of the lateral load resisting system of a 6-story office building located in Los Angeles, CA, which is considered as a high seismic region per ASCE 7-16 (2016). These walls were scaled by a factor of 5/18 with respect to the original wall sizes in the 6-story office building. The different test units, including four SRWs and four PreWECs, were designed with variation in the initial post-tensioning stress, the external energy dissipation capacity, and the base moment-to-shear ratio.
From the above-referenced database, the shake table test results of one SRW, namely SRW2, and one PreWEC, namely PreWEC-2, were used in the present research study to compare with the FEM and the GDAA. The SRW2 and PreWEC-2 had an average shear resistance near 175 kN. The key design variables of the SRW2 and the PreWEC-2 are noted in Table 1. Figure 3 shows the fabrication and design details of the wall panels.
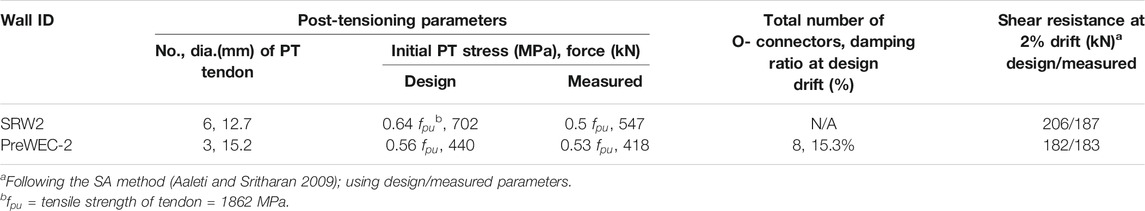
TABLE 1. Summary of design variables for SRW2 and PreWEC-2.
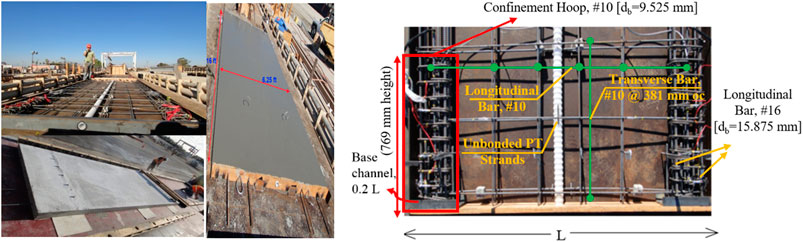
FIGURE 3. Fabrication and design details of the wall panels.
Figure 4 shows the experimental test setup for the two walls. The two walls were placed on a uniaxial shake table and were connected to an external mass-rig system, which was placed adjacent to the table and was horizontally aligned with the walls. The mass-rig system was connected to the walls through a pin-ended rigid beam, simulating the transfer of horizontal inertia forces from the floor systems of the 6-story office building to the walls. The horizontal inertia forces by the mass-rig system corresponded to an effective weight of 267 kN and were transferred to the wall at an effective height (
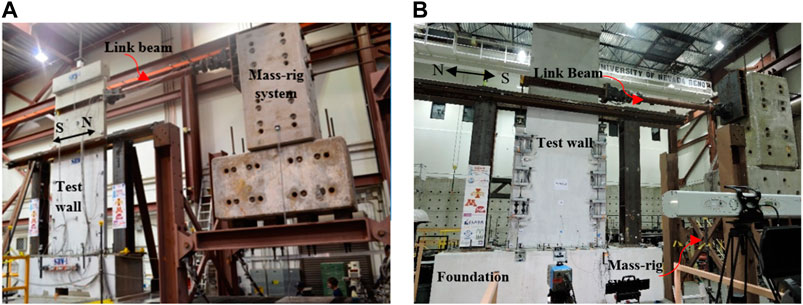
FIGURE 4. Shake table test setups at UNR: (A) SRW; (B) PreWEC (Nazari and Sritharan, 2020).
The seismic performance of the SRWs and PreWECs was evaluated by exciting the shake table into a series of ground motions with different levels of intensities. The present study employed the following two shake table excitations:
A short duration motion, namely Eq. 4s, which is a spectrum-compatible motion representing the strong portion of the 1994 Northridge earthquake-Sylmar station, with the Peak Ground Acceleration (PGA) of 0.71 g.
A long duration motion, which corresponds to the earthquake record at the 1995 Kobe-Takatori station, with the PGA of 0.62 g.
The amplitudes of these records were scaled by a factor of 2.88 and 3.6, respectively, to meet the design basis (EQ-III) and maximum considered (EQ-IV) earthquake events for the scaled walls. The time step of the ground motion records was decreased by a factor of 5/18 to meet the scale. More information about the scaling procedure, the acceleration response spectra of the scaled ground motions, and the recorded shake table motions are presented in Nazari et al. (2015) and Nazari et al. (2017).
Description of the Models
Two approaches were employed for modeling the experimental responses of the SRW2 and PreWEC-2. The first approach is a Finite Element Model (FEM) that was developed using OpenSees (McKenna et al., 2000). The FEM is a lumped-plasticity model, which uses a nonlinear rotational spring at the wall base to simulate the moment vs. rotation behavior of the wall base section. This model has the capability of capturing the global behavior of different rocking wall systems, which is key for use in performance-based seismic analysis. In this model, the energy dissipation of the rocking wall systems due to impact is represented by an equivalent viscous damping ratio, which was derived based on the experimental study reported in Nazari et al. (2017) and Nazari and Sritharan (2018). The supplemental damping by the O-connectors is modeled with a lumped-plasticity element at the wall-to-foundation interface.
The second approach is an analytical model, named in this research study as the Generalized Dynamic Analysis Approach (GDAA). This model was developed by Kalliontzis et al. (2020) with the capability of capturing both the global and local (i.e., contact length at the rocking connection and post-tensioning forces) behaviors of SRWs. The GDAA is extended in this research study for modeling the PreWECs and the lateral inertia effects induced by floor systems.
Finite Element Method
The Finite Element Model (FEM) was developed to simulate the lateral seismic responses of SRWs and PreWECs for the purpose of performance-based analysis up to lateral drift ratios of 4–5%, within which the walls experience little damage at their bottom toes and the material nonlinearity in the PT tendons is limited. A schematic view of the FEM as developed in OpenSees (OS) is presented in Figure 5. The FEM is composed of a linear elastic beam-column element representing the concrete wall. As shown in Figure 5, a seismic mass was assigned to the top node of the beam-column element to simulate the horizontal inertial load provided by the mass-rig system in the experiments. The bottom node of the element was connected to the foundation base through one and two rotational springs for the SRW2 and the PreWEC-2, respectively. For the SRW, a single spring was used to simulate the re-centering and moment vs. rotation behavior of the wall base with the uniaxial SelfCentering material in OS. The key properties of the SelfCentering material were selected to match the back-bone moment-rotation curve of the wall base as defined by the Simplified Analysis method of Aaleti and Sritharan (2009). The area enclosed by the hysteretic curve of the SelfCentering material is controlled by a beta factor, which represents the hysteretic energy dissipation of the system due to concrete nonlinearity as a ratio of the yield force. A beta factor of 0.2 and 0.3 was respectively suggested to model the walls with relatively no damage and higher damage in the toe regions (Nazari et al., 2017). In this study, both SRW2 and PreWEC-2 were modeled using a beta factor of 0.2. As shown in Figure 5B, an additional rotational spring was used for the PreWEC-2 to simulate the O-connectors with the OS Steel02 material model. The yield and ultimate strengths of the OS Steel02 material model corresponded to the respective yield and ultimate moment resistances provided by the O-connectors in the PreWEC-2.
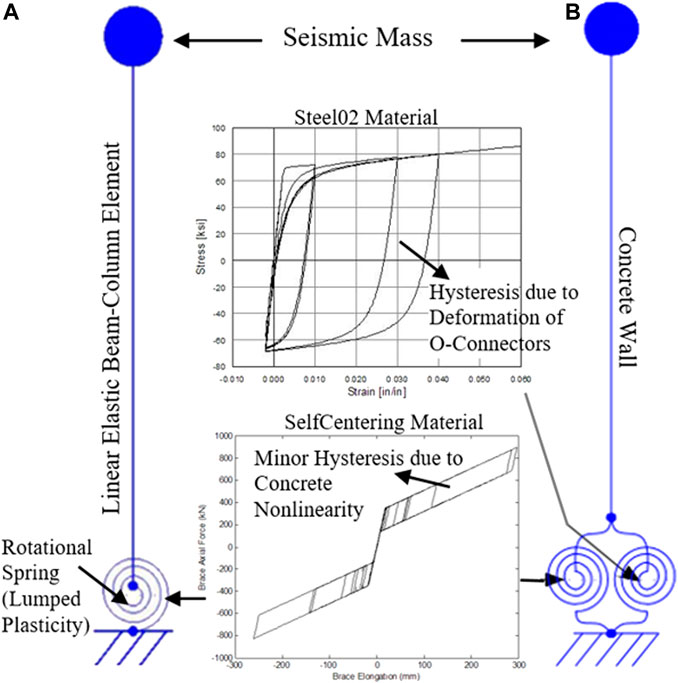
FIGURE 5. Finite element model (FEM): (A) SRW; (B) PreWEC.
In addition to the hysteretic damping in the moment-rotation curve of the wall base and the O-connectors, a tangent stiffness proportional Rayleigh damping was included to simulate the impact energy dissipation. The assigned damping values were 3 and 2%, respectively for the SRW2 and the PreWEC-2, which were derived based on the experimental data as follows: average equivalent damping ratios of 1.5 and 1.0% were calculated experimentally for the SRW2 (Nazari et al., 2017) and the PreWEC-2 (Nazari and Sritharan, 2018), respectively, using the Jacobson’s secant stiffness approach (Priestley, 2002). Next, these values were multiplied by a modification factor of 2 to represent the tangent stiffness-based damping as defined by Priestley et al. (2007).
Analytical Modeling
The GDAA was developed to simulate the seismic behavior of SRWs. Three damping components are included in the GDAA: 1) inherent viscous damping of the SRWs; 2) hysteretic damping due to damage of the wall toes and yielding of the unbonded post-tensioning steel; and 3) impact damping, which is implemented with an event-based approach. The GDAA simulates the rocking response of SRWs with respect to the foundation base and first-mode flexural response of the wall body. For the purpose of this paper, the flexural response is eliminated from the formulation of GDAA, because it is small in unbonded post-tensioned precast concrete walls (Nazari et al., 2017; Nazari and Sritharan, 2018; Kalliontzis et al., 2020; Kalliontzis and Sritharan, 2020).
Figure 6A presents an SRW as modeled by the GDAA, excluding flexure of the wall body. The wall has a height of
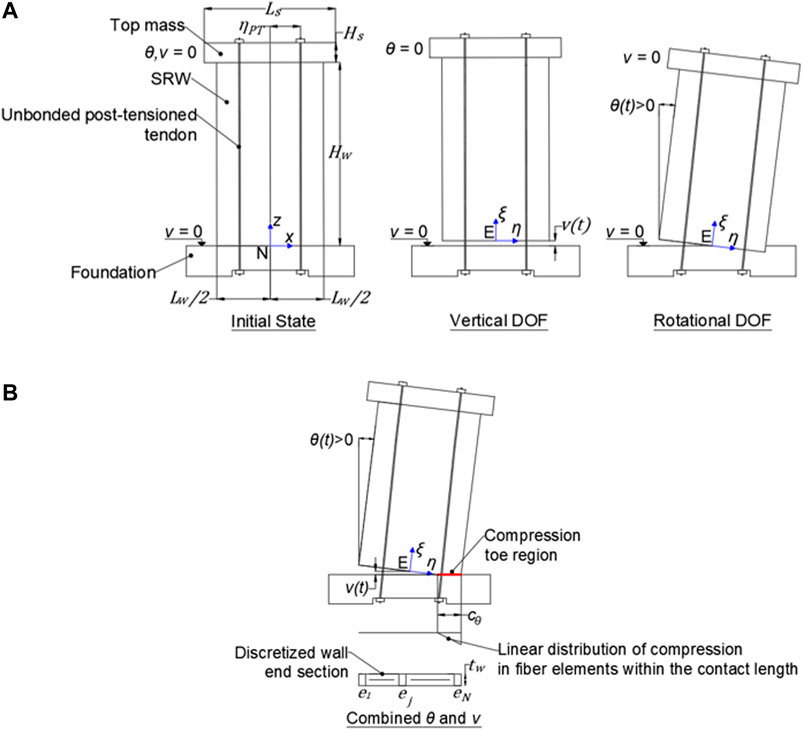
FIGURE 6. (A) A single rocking wall (SRW) modeled by the generalized dynamic analysis approach (GDAA); (B) Combined rotational
The dynamic motion of the SRW is calculated with respect to the inertia frame
To capture the compressive deformations of the wall base, the base section is discretized into
Equation of Motion
The equation of motion of the GDAA for SRWs was developed by Kalliontzis et al. (2020) using the extended Hamilton’s principle (Baruh 1999):
where
Excluding flexure of the wall body, the equation of motion of the GDAA becomes
In Eq. 5,
Moreover,
The GDAA formula of Eq. 5 is enhanced in this paper to account for 1) the horizontal seismic mass provided by the mass-rig system at the effective height of
where
The kinetic energy of the seismic mass,
where
The seismic mass contributes to the potential energy due to the horizontal ground excitation,
The variation of the work produced by the O-connectors,
where
where
Using Eqs 9, 10, 13, Eq. 5 is modified to include the effects of the horizontal seismic mass and the O-connectors:
Using Eq. 14, the seismic behavior of the SRW2 and PreWEC-2 was computed in this investigation. The contribution of O-connectors is eliminated from Eq. 14 (i.e.,
Constitutive Models
This section describes the constitutive models used for the concrete fibers of the wall base section, the PT tendons, and the O-connectors.
Concrete Fibers
The compressive stress-strain loading and reloading curves for the concrete fibers are computed with the constitutive model described by Kalliontzis et al. (2020). The compressive strain in a concrete fiber of the wall base section shown in Figure 6B is obtained as.
where
where
PT Tendons
The tensile loading and reloading stress-strain behaviors of the PT tendons are modeled with the constitutive model described by Kalliontzis et al. (2020). The strain in the PT tendons is obtained by adding the initial strain due to prestressing to the tendon elongation induced by the wall uplift over the unbonded length of the tendon:
where
O-Connectors
A phenomenological hysteretic law is proposed in this research study for the O-connectors. The law was calibrated with data of the O-connector tests by Nazari et al. (2015). The O-connectors are modeled as nonlinear axial springs. The backbone force-deformation curve of the springs consists of a linear and a nonlinear branch, as given in the following expression:
where
where
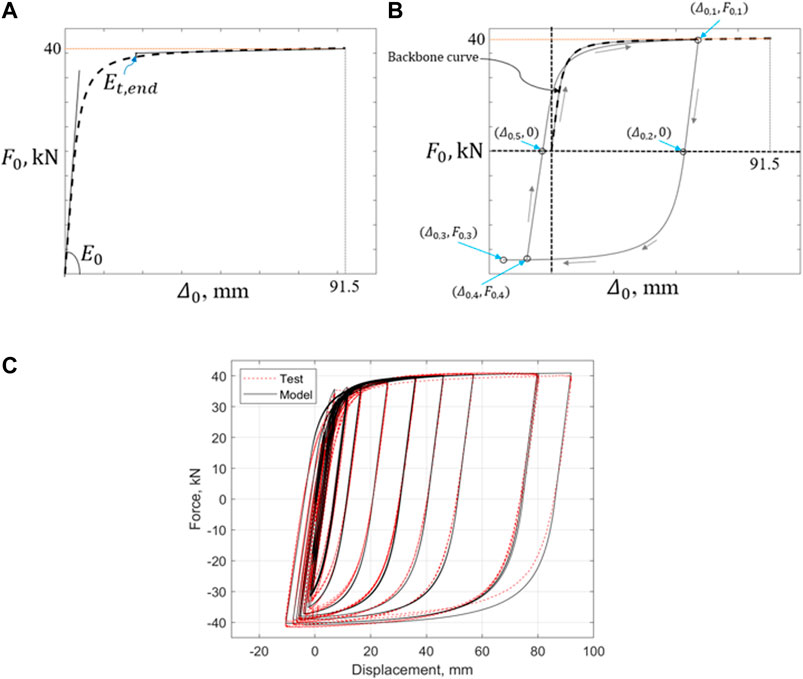
FIGURE 7. Force-deformation curves for the O-connectors; (A) Backbone curve; (B) Hysteretic curve; (C) Comparison of hysteretic law with the test data by Nazari et al. (2015).
The hysteretic behavior of the O-connectors is described in Figure 7B. Once a load reversal takes place on the backbone curve, the resultant force-deformation curve is linear up to the zero resistance,
where
with
If loading toward the negative direction continues beyond the deformation
where
where
The proposed hysteretic law is compared with the O-connector test data in Figure 7C.
Impact Event
Rocking walls dissipate part of their kinetic energy during impact on the foundation base. The GDAA models the impact with an event-based approach, which computes the post-impact response of the wall with impulse-momentum equations. It is assumed that the impacts occur when either of the points of the wall base with coordinates
Comparisons Between Experimental and Model Responses
The shake table responses of the SRW2 and PreWEC-2 are compared with those computed using the FEM and the GDAA. As discussed previously, the FEM is a lumped-plasticity model which can compute the global responses of the SRW2 and PreWEC-2, including the maximum and residual lateral drifts, the absolute acceleration, the base shear and moment resistance due to the shake table excitations. Hence local wall responses, such as the wall contact length at the rocking interface and the variation of PT stress are not computed. If computing these local responses is of interest, the use of GDAA, is recommended. This point is discussed below.
Figure 8 presents the global responses of the FEM and GDAA in comparison with the test data. Figures 8A–D present the lateral drift time histories. In all cases, the models adequately captured the maximum drift responses and the drift variations as a function of time. Using the GDAA, some deviations from the experimental responses were observed for the SRW2 during the Takatori ground motion and the PreWEC-2 during the Sylmar ground motion. The FEM also deviated from the experimental response of the PreWEC-2 during the Takatori ground motion. Both the GDAA and the FEM were able to capture the decay of motion during the free vibration of SRW2 (i.e., after the first 2.5 s in Figure 8A). On the other hand, the FEM was able to better capture the response of the SRW2 in Figure 8B after the first 6 s. The inaccuracy exhibited by the GDAA in this response is partly attributed to the overestimation of the hysteretic action at the compression toes of the wall panel after the wall drift reached a value of 5%.
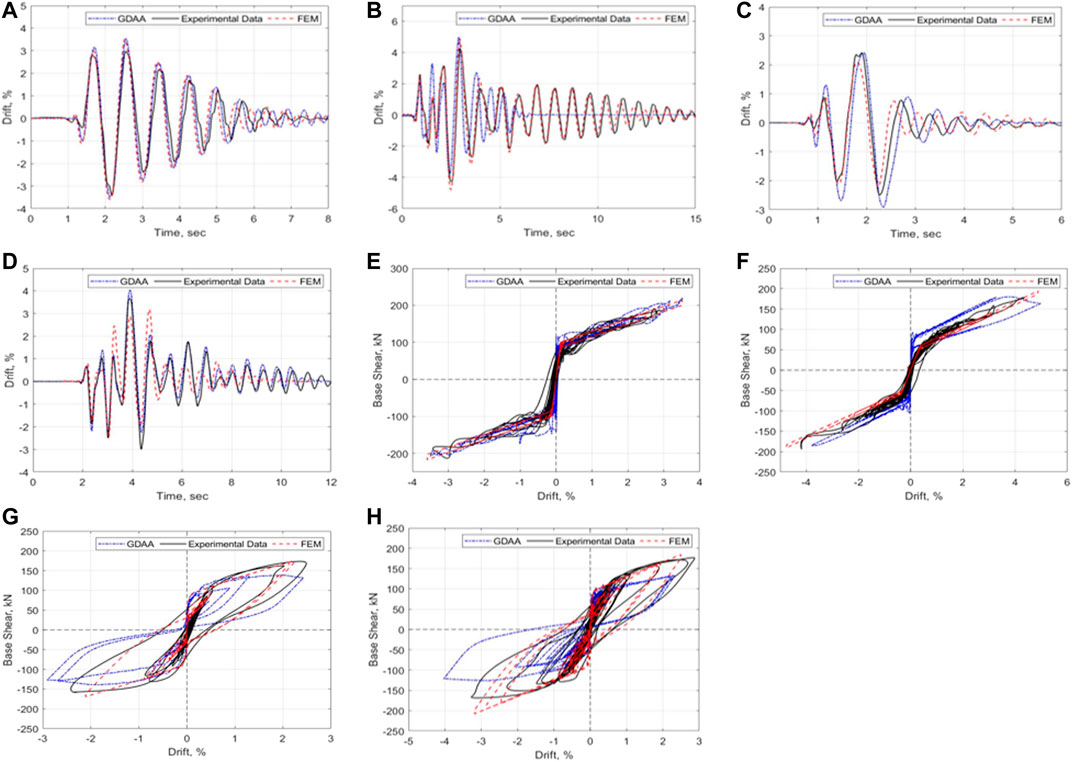
FIGURE 8. Global responses of FEM and GDAA in comparison with the experimental data: (A) Time history of lateral drift, SRW2-Sylmar; (B) Time history of lateral drift, SRW2-Takatori; (C) Time history of lateral drift, PreWEC2-Sylmar; (D) Time history of lateral drift, PreWEC2-Takatori; (E) base shear vs. lateral drift, SRW2-Sylmar; (F) Base shear vs. lateral drift, SRW2-Takatori; (G) Base shear vs. lateral drift, PreWEC2-Sylmar; (H) Base shear vs. lateral drift, PreWEC2-Takatori.
Figures 8E–H present the base shear-lateral drift response of the test units, using the two modeling approaches. The comparisons between the two models and the experimental results are satisfactory for the responses of the SRW2 (Figures 8E,F). The FEM shows good accuracy for the PreWEC-2 for both ground motions, while the GDAA overestimates the re-centering capability of PreWEC-2 during the Takatori ground motion. This deviation is attributed to the estimation of the O-connector deformation,
As noted previously, one advantage of using the GDAA as opposed to the FEM described in this paper is the capability to compute the local wall responses. As an example, Figure 9 compares typical local responses computed by the GDAA against the test data. Variations of the PT stress vs. the lateral drift are plotted in Figure 9A for the PreWEC-2, showing that the GDAA provides a good accuracy for this variable. Next, Figure 9B compares the GDAA’s estimates of contact length between the wall panel and the foundation with the corresponding experimental data for the SRW2. It is shown that the GDAA adequately reproduces the experimental contact lengths.
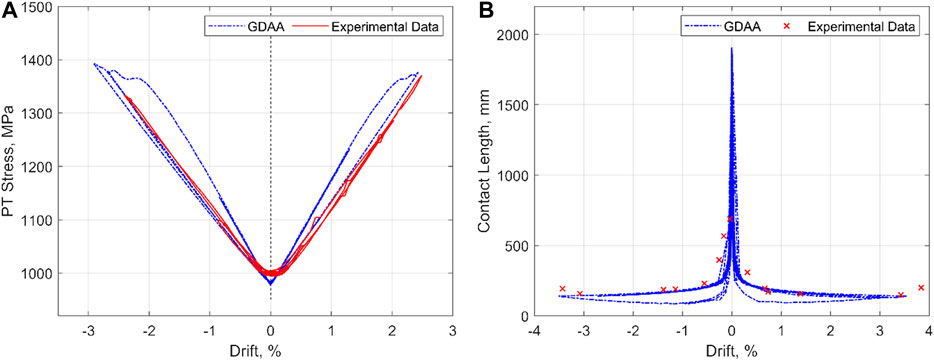
FIGURE 9. Local responses of GDAA in comparison with the experimental data during Sylmar: (A) Variation of PT Stress, PreWEC-2; (B) Variation of Contact Length, SRW2.
Overall, the FEM satisfactorily reproduced the global behavior of the SRW2 and the PreWEC-2 for ground motions of different intensities. This model can be used for performance-based analysis of rocking wall systems, when estimating the global behavior of the walls is of interest, up to the lateral drift ratios of 4–5%. On the other hand, when estimation of the local wall responses is of interest, the GDAA may be used, because of its ability to compute these responses with good accuracy.
Model Behavior Characteristics
As described in Finite Element Method, the FEM was developed to model the rocking wall responses up to lateral drift of 4–5% where no significant wall base damage or material nonlinearity in the PT tendons can occur, in accordance with the design requirements (ACI ITG-5.1 2008, SEAOC 2000). Because of its capability to capture these local responses, the GDAA may be used for modeling the wall responses at larger lateral drifts. Based on the assumptions made in the development of the FEM and the GDAA, key behavior characteristics of the two models are discussed below.
Wall Degradation
When subjected to large lateral drifts, the lateral stiffness and strength of the unbonded post-tensioning precast concrete walls may degrade due to yielding of the unbonded tendons and concrete damage at the compression toes. To examine the behavior of the FEM and GDAA in cases where wall degradation may occur, the horizontal component of the 1994 Northridge earthquake as recorded in the Sylmar-Converter Station (PEER 2020 NGA record sequence number or RSN—1084), was used to excite the FEM and the GDAA for the case of SRW2.
Figure 10 presents the responses of the SRW2 as modeled by the FEM and the GDAA. The two models agree well in their lateral drift time histories during the first 7.5 s of the ground excitation. Subsequently, the GDAA computes lateral drifts as high as ±9.4% while the FEM computes a decaying motion for the SRW2, eventually reaching a zero drift at about 15 s from the beginning of the excitation. The discrepancy between the two models stems from the different approaches in computing the global wall behavior. The FEM uses a predefined global hysteretic law that does not experience strength degradation (see Figure 5), while the GDAA computes the global behavior as a function of the local responses at the wall-to-foundation contact and in the PT tendons, which accounts for the strength degradation of the wall. As the SRW2 experiences large lateral drifts, the tendon yields, which reduces the residual prestress, as shown in Figure 10C. Moreover, due to the concrete damage at the compression toes, the neutral axis depth at the wall base shifts toward the centerline of the wall, because an increased contact length is required to transfer the vertical compression forces from the wall base to the foundation base. This is explained in Figure 10D, which shows that the contact length increases at drifts larger than 3%. The local degradations of the PT tendon and the wall base result in a global degradation of the wall in the GDAA. This is reflected in the base shear vs. drift response of Figure 10B showing that the lateral strength of the wall decreases with increasing lateral drift beyond the value of 3%. At the lateral drift of 9.4%, the lateral strength of SRW2 has reduced by 23.4%.
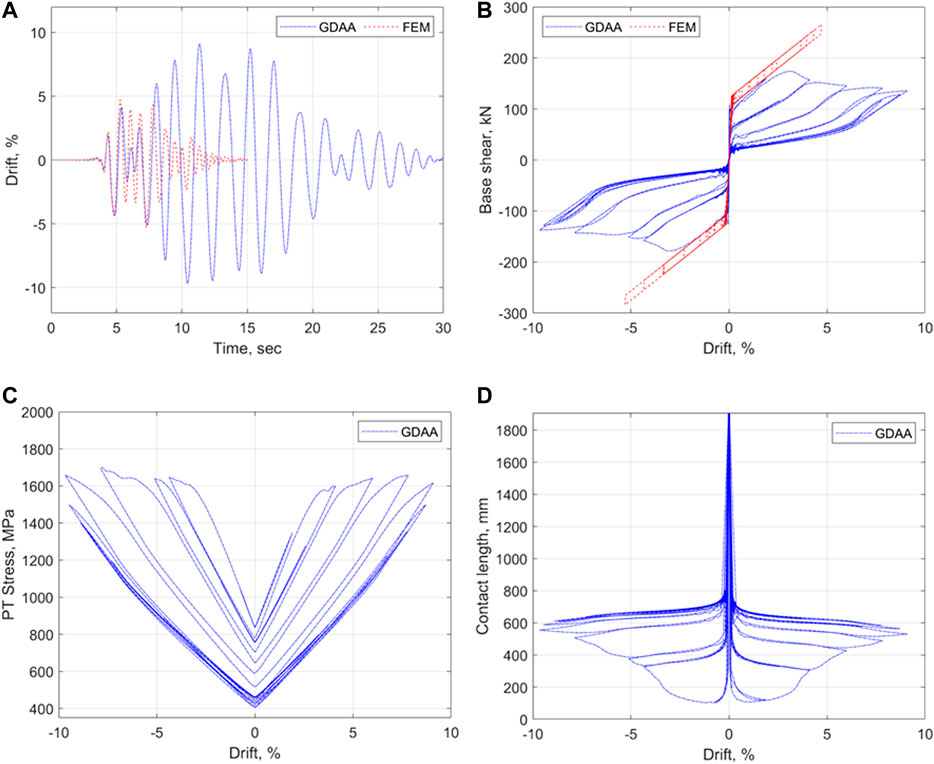
FIGURE 10. Responses of SRW2 to the horizontal component of Sylmar as modeled by the GDAA and the FEM: (A) Time history of lateral drift; (B) base shear vs. lateral drift; (C) PT Stress vs. lateral drift; (D) Contact Length vs. lateral drift.
On the other hand, the base shear vs. drift response of the FEM, shown in Figure 10B is based on a predefined hysteretic law that does not account explicitly for the local behaviors described previously. This law produces a different global behavior of the wall than the GDAA.
Vertical Ground Excitation
The effect of vertical components of ground motions on the rocking behavior has been considered in previous analytical research studies of free-standing rigid blocks (e.g., Yim et al., 1980; Dimentberg et al., 1993; Shi et al., 1996; Makris and Zhang 1999; Linde et al., 2020). Most research studies on unbonded post-tensioned precast concrete walls have been limited to horizontal components of the ground motions. This section investigates the responses of the SRW2 to the horizontal and vertical components of the 1994 Northridge earthquake as modeled by the GDAA and the FEM.
The responses of the FEM and the GDAA were calculated considering 1) the horizontal component of the 1994 Northridge earthquake alone; and 2) the horizontal and vertical components of the 1994 Northridge earthquake combined. The lateral drift time histories for the two cases are plotted in Figure 11. Because the FEM is a lumped plasticity model, it does not account explicitly for the interaction between the axial and rocking behaviors, which is necessary to capture the inertia effects of the SRW2 induced by the vertical ground excitation. Hence the responses of the FEM to the cases (a) and (b) were identical, suggesting that the model had no sensitivity to the vertical ground excitation. Because the GDAA uses a fiber-based sectional analysis at the wall base, its behavior was influenced by the vertical ground excitation. This is shown in Figure 11 where the drifts computed by the GDAA are different between cases (a) and (b). Based on these analytical data, the presence of a vertical ground excitation may influence the seismic behavior of the SRW2. The accuracy of this analytical observation, however, needs to be verified experimentally in future research studies.
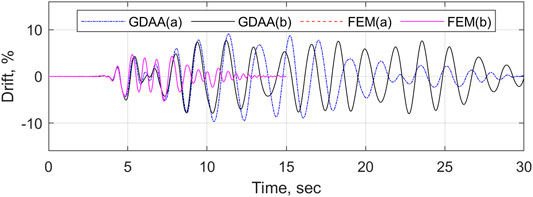
FIGURE 11. Lateral drift time histories of the FEM and the GDAA for (a) the horizontal component of Sylmar alone; and (b) the horizontal and vertical components of Sylmar combined.
Impact Damping
The impact damping influences the seismic behavior of SRWs, as observed experimentally by Nazari and Sritharan (2020) and by Kalliontzis and Sritharan (2020). However, the sensitivity of rocking wall models to the numerical simulation of impact damping has not received adequate attention. This is investigated in this section using the FEM and the GDAA.
The seismic response of the SRW2 to the Sylmar excitation (i.e., namely Eq. 4s, as per Review of Shake Table Tests of Rocking Walls) was computed using the GDAA by varying the
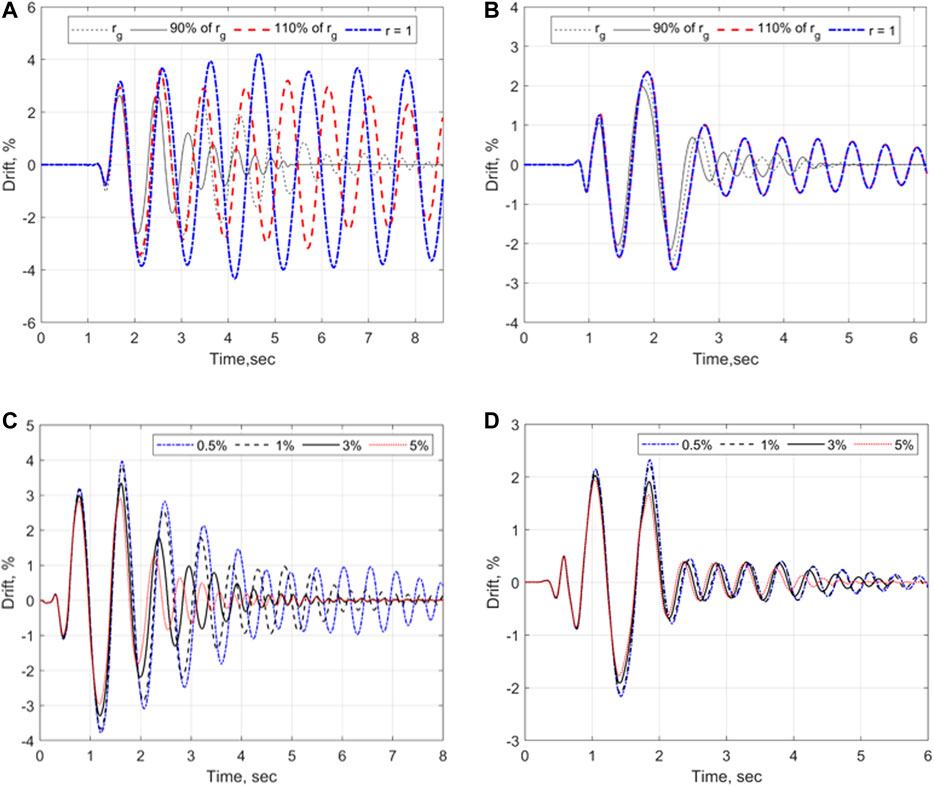
FIGURE 12. Lateral drift time histories by the GDAA and FEM, respectively for various values of
Modeling of the impact damping can also influence the dynamic behavior of walls with supplemental damping devices, such as the PreWEC. This is discussed in Figures 12B,D with the use of GDAA and FEM, respectively. For example, Figure 12B shows that neglecting impact damping (i.e.,
Modeling Impact Damping in the FEM
Based on the above discussion, accurate modeling of impact damping is important for capturing the experimental behavior of rocking walls. While the use of a generalized coefficient of restitution,
To investigate modeling of impact damping in the FEM for walls with different aspect ratios, five additional case study SRWs were designed by varying the wall aspect ratio from 2.0 to 4.0, as shown in Table 2 (i.e., cases B–F). The five SRWs were designed following the Simplified Analysis Method by Aaleti and Sritharan (2009) to match the moment capacity of SRW2 at the 2% design drift. Table 2 presents the design parameters of the case study SRWs.
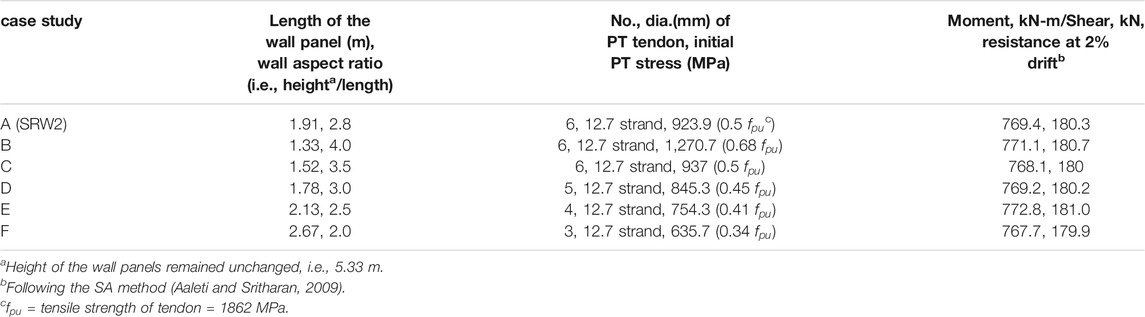
TABLE 2. Design parameters of case study walls.
Next, the seismic responses of the five SRWs were computed with the FEM by calibrating the tangent stiffness proportional Rayleigh damping to achieve an adequate comparison with the corresponding responses by the GDAA. The selected seismic excitation in this case was the Sylmar excitation (i.e., namely Eq. 4s, as per Review of Shake Table Tests of Rocking Walls) because both the FEM and the GDAA showed good accuracy in capturing the experimental response of SRW2 to this excitation, as shown previously in Figure 8A.
Figure 13 presents the comparison of the seismic responses of the five case study SRWs obtained by the FEM and the GDAA. The FEM used a 3% tangent stiffness proportional Rayleigh damping for the Cases B-E, which is the same as recommended in Finite Element Method; however, this ratio was increased to 5% for case F, which had the smallest aspect ratio of 2.0. As shown in Figures 13A,B, for slender walls (i.e., Cases B and C), the FEM did not reproduce accurately the free vibration phase of the GDAA (i.e., after the first 2.5 s of the time history); however, the FEM captured the maximum drift of the GDAA satisfactorily. Moreover, Figures 13C,D show that the FEM accurately reproduced the lateral drift time histories of the GDAA with the aspect ratio of 3.0 and less (i.e., case D and E) using the damping ratio of 3%. Using the larger damping ratio of 5%, the FEM was able to capture the response of case F by the GDAA, as shown in Figure 13E.
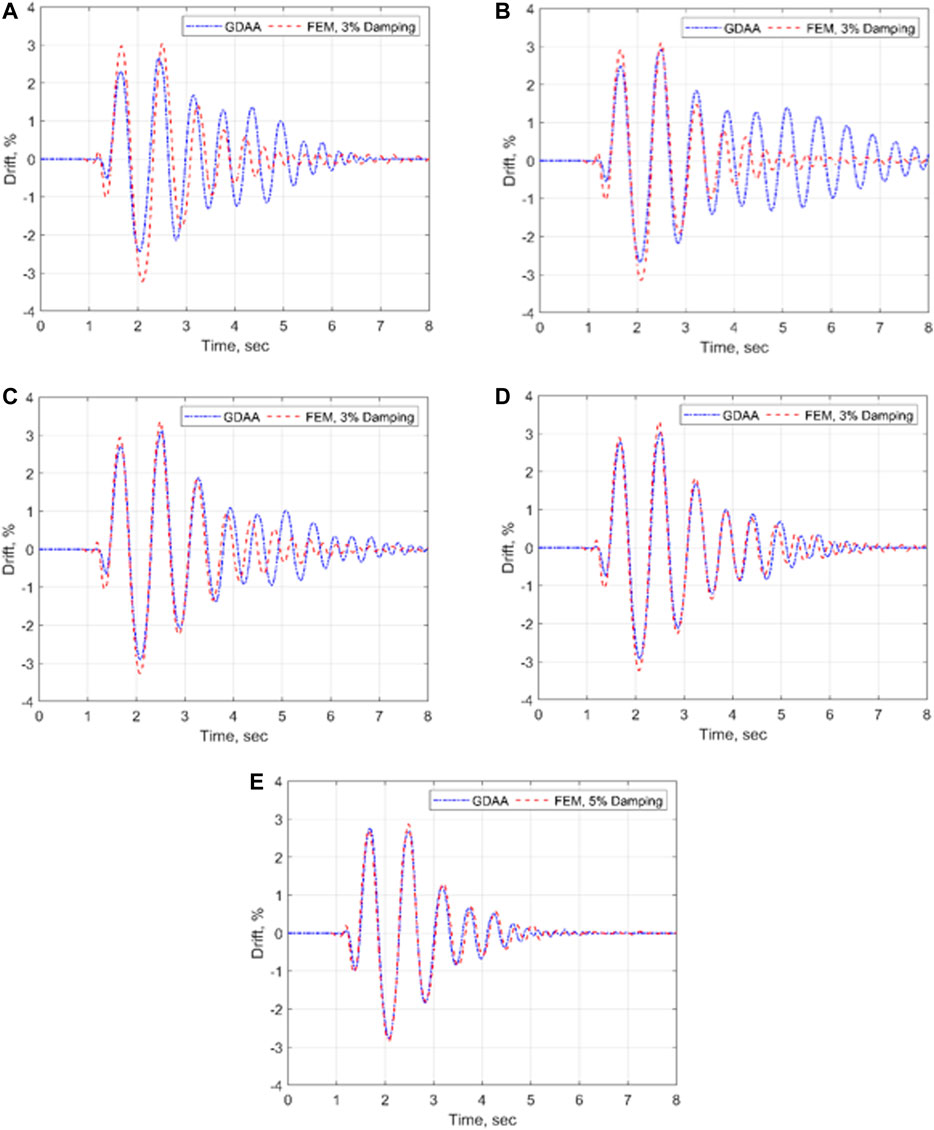
FIGURE 13. Lateral drift time histories of case study SRWs during Sylmar–the FEM with selected damping ratios vs the GDAA: (A) Case B, with aspect ratio of 4; (B) case C, with aspect ratio of 3.5; (C) Case D, with aspect ratio of 3; (D) Case E, with aspect ratio of 2.5; (E) Case F, with aspect ratio of 2.
Conclusion
Modeling of unbonded post-tensioned precast concrete walls with rocking connections was discussed in this research study. Two modeling approaches were investigated, namely 1) a Finite Element Model (FEM), which was developed based on lumped plasticity to capture the global wall responses up to lateral drift ratios of 4–5%; and 2) a Generalized Dynamic Analysis Approach (GDAA), which is an analytical model developed to capture both the global and local wall responses up to lateral drift ratios of 10%. The accuracy of the two models was evaluated with shake table tests of unbonded post-tensioned precast concrete walls without (SRW2) and with (PreWEC-2) supplemental damping devices. The following conclusions were made:
Both the FEM and the GDAA satisfactorily reproduced the experimental global behaviors of the SRW2 and the PreWEC-2.
The GDAA was capable of computing the experimental local responses of the SRW2 and the PreWEC-2, including the variation of the post-tensioning force and the contact length of the wall to the foundation base. Because the FEM is a lumped plasticity model, it cannot compute these local responses. The use of a fiber-based modeling approach can be investigated for improving the FEM in future research studies.
While the FEM satisfactorily reproduced the global behavior of the walls up to the drifts of 4–5%, the GDAA may be preferred for computing wall responses to larger drifts, because of its ability to simulate concrete damage and yielding of the PT tendons.
It was shown that the use of a fiber-based sectional analysis in the GDAA provided the capability to capture the effect of vertical ground excitations to the wall responses and that vertical excitations may alter the seismic behavior of the walls.
The FEM and the GDAA corroborated that small variations of the impact damping can influence the seismic behavior of unbonded post-tensioned precast concrete walls significantly. The GDAA captured impact damping with an event-based approach, while the FEM used a tangent stiffness-based equivalent impact damping ratio of 3% for SRWs, which was derived based on shake table test data.
Results of a case study analysis on five SRWs with different aspect ratios confirmed the accuracy of the FEM’s 3% impact damping for walls with aspect ratios of 2.5 and higher. It was found that an equivalent damping ratio of 5% is more suitable for modeling SRWs with lower aspect ratios.
Data Availability Statement
The original contributions presented in the study are included in the article/Supplementary Material, further inquiries can be directed to the corresponding author.
Author Contributions
DK: Modeling and Analysis (GDAA), Results and Discussions, Writing. MN: Modeling and Analysis (FEM), Comparison with the Shake Table Data, Results and Discussions, Writing.
Conflict of Interest
The authors declare that the research was conducted in the absence of any commercial or financial relationships that could be construed as a potential conflict of interest.
Appendix: constants
References
Aaleti, S., and Sritharan, S. (2009). A simplified analysis method for characterizing unbonded post-tensioned precast wall systems. Eng. Struct. 31 (12), 2966–2975. doi:10.1016/j.engstruct.2009.07.024
ACI 550.6-19 (2019). Acceptance criteria for special unbonded post-tensioned precast structural walls based on validation testing and commentary. Farmington Hills, MI: American Concrete Institute.
ACI Innovation Task Group 5.1 (2008). Acceptance criteria for special unbonded post-tensioned precast structural walls based on validation testing and commentary. Farmington Hills, MI: American Concrete Institute.
Aghagholizadeh, M. (2020). A finite element model for seismic response analysis of vertically-damped rocking-columns. Eng. Struct. 219, 110894. doi:10.1016/j.engstruct.2020.110894
Avgenakis, E., and Psycharis, I. N. (2020). An integrated macroelement formulation for the dynamic response of inelastic deformable rocking bodies. Earthq. Eng. Struct. Dyn. 49 (11), 1072–1094. doi:10.1002/eqe.3279
Belleri, A., Torquati, M., and Riva, P. (2013). “Finite element modeling of rocking walls,” in 4th ECCOMAS thematic conference on computational methods in structural dynamics and earthquake engineering, Kos Island, Greece, June 12–14, 2013.
Chang, G. A., and Mander, J. B. (1994). Seismic energy based on fatigue damage analysis of bridge columns: part 1—evaluation of seismic capacity. NCEER technical report no. NCEER-94-0006. Buffalo, NY State University of New York.
Diamantopoulos, S., and Fragiadakis, M. (2019). Seismic response assessment of rocking systems using single degree‐of‐freedom oscillators. Earthq. Eng. Struct. Dyn. 48 (7), 689–708. doi:10.1002/eqe.3157
Dimentberg, M. E., Hou, Z. K., Noori, M. N., and Zhang, W. (1993). Non-Gaussian response of a single-degree-of-freedom system to a periodic excitation with random phase modulation.Recent development in the mechanics of continua (special volume). New York, NY: ASME.
Henry, R. S. (2011). Self-centering precast concrete walls for buildings in regions with low to high seismicity. PhD thesis. Auckland (New Zealand): University of Auckland.
Housner, G. W. (1963). The behavior of inverted pendulum structures during earthquake excitations. Bull. Seismol. Soc. Am. 53 (2), 403–417.
Kalliontzis, D., Schultz, A. E., and Sritharan, S. (2020). Generalized dynamic analysis of structural single rocking walls (SRWs). Earthq. Eng. Struct. Dyn. 49 (7), 633–656. doi:10.1002/eqe.3257
Kalliontzis, D., and Sritharan, S. (2014). “A finite element approach for modelling controlled rocking systems,” in Proceedings of the 2nd European Conference on earthquake Engineering and seismology, Turkey, Istanbul, August, 2014.
Kalliontzis, D., and Sritharan, S. (2018). Characterizing dynamic decay of motion of free-standing rocking members. Earthq. Spectra 34 (2), 843–866. doi:10.1193/011217eqs013m
Kalliontzis, D., and Sritharan, S. (2020). Dynamic response and impact energy loss in controlled rocking members. Earthq. Eng. Struct. Dyn. 49 (4), 319–338. doi:10.1002/eqe.3240
Kalliontzis, D., Sritharan, S., and Schultz, A. (2016). Improved coefficient of restitution estimation for free rocking members. J. Struct. Eng. 142 (12), 06016002. doi:10.1061/(asce)st.1943-541x.0001598
Kalliontzis, D., and Sritharan, S. (2021). Seismic behavior of unbonded post-tensioned precast concrete members with thin rubber layers at the jointed connection. PCI J. 66 (1), 60–76. doi:10.15554/pcij66.1-02
Kurama, Y., Sause, R., Pessiki, S., and Lu, L.-W. (1999). Lateral load behavior and seismic design of unbonded post-tensioned precast concrete walls. ACI Struct. J. 96 (4), 622–632.
Linde, S. A., Konstantinidis, D., and Tait, M. J. (2020). Rocking response of unanchored building contents considering horizontal and vertical excitation. ASCE J. Struct. Eng. 146 (9). doi:10.1061/10.1061/(asce)st.1943-541x.0002735
Makris, N., and Zhang, J. (1999). Rocking response and overturning of anchored equipment under seismic excitation. Report No. PEER-99/06. Berkeley (United States): University of California.
Mander, J. B., Priestley, M. J. N., and Park, R. (1988). Theoretical stress‐strain model for confined concrete. J. Struct. Eng. 114 (8), 90–103. doi:10.1061/(ASCE)0733-9445(1988)114:8(1804)
Marriott, D., Pampanin, S., Bull, D., and Palermo, A. (2008). Dynamic testing of precast, post-tensioned rocking wall systems with alternative dissipating solutions. Bull. N.Z. Natl. Soc. Earthqu. Eng. 41 (2), 90–103. doi:10.5459/bnzsee.41.2.90-103
McKenna, F., Fenves, G., and Scott, M. (2000). Open system for earthquake engineering simulation. Berkeley, CA: University of California.
Mpampatsikos, V., Bressanelli, M. E., Belleri, A., and Nascimbene, R. (2020). A non-dimensional parametric approach for the design of PT tendons and mild steel dissipaters in precast rocking walls. Eng. Struct. 212, 110513. doi:10.1016/j.engstruct.2020.110513
Nazari, M., Aaleti, S., and Sritharan, S. (2015). Shake table testing of single rocking walls and PreWECs @ UNR. Network for Earthquake Engineering Simulation (distributor). doi:10.4231/D3H98ZF0B(SRW2) and doi:10.17603/DS2WK5B(PreWEC-2)
Nazari, M., Sritharan, S., and Aaleti, S. (2017). Single precast concrete rocking walls as earthquake force-resisting elements. Earthq. Eng. Struct. Dyn. 46 (5), 753–769. doi:10.1002/eqe.2829
Nazari, M., and Sritharan, S. (2018). Dynamic evaluation of PreWEC systems with varying hysteretic energy dissipation. ASCE J. Struct. Eng. 144 (10), 04018185. doi:10.1061/(ASCE)ST.1943-541X.0002169
Nazari, M., and Sritharan, S. (2020). Influence of different damping components on dynamic response of concrete rocking walls. Eng. Struct. 212, 110468. doi:10.1016/j.engstruct.2020.110468
Nazari, M., and Sritharan, S. (2019). Seismic design of precast concrete rocking wall systems with varying hysteretic damping. PCI J. 64 (5), 58–76. doi:10.15554/pcij64.5-04
Pacific Earthquake Engineering Research Center (PEER) (2020). Next generation attenuation (NGA) database. Available at: http://peer.berkeley.edu/nga/ (Accessed December 08, 2020).
Perez, F. J., Pessiki, S., and Sause, R. (2004). Experimental and analytical lateral load response of unbonded post-tensioned precast concrete walls. ATLSS report No. 04-11. Bethlehem (United States): Lehigh University.
Priestley, M., Calvi, G. M., and Kowalsky, M. J. (2007). Displacement-based seismic design of structures. Building 23 (33), 1453–1460.
Priestley, M. J. N. (2002). Direct displacement-based design of precast/prestressed concrete buildings. PCI J. 47 (6), 66–79. doi:10.15554/pcij.11012002.66.79
Priestley, M. J. N., Sritharan, S., Conley, J. R., and Pampanin, S. (1999). Preliminary results and conclusions from the PRESSS five-story precast concrete test building. PCI J. 44 (6), 42–67. doi:10.15554/pcij.11011999.42.67
Rahman, A. M., and Restrepo, J. I. (2000). Earthquake resistant precast concrete buildings: seismic performance of cantilever walls prestressed using unbonded tendons. Research Report 2000-5. Christchurch (New Zealand): University of Canterbury.
Shi, B., Anooshehpoor, A., Zeng, Y., and Brune, J. N. (1996). Rocking and overturning of precariously balanced rocks by earthquake. Bull. Seismological Soc. Amer. 86 (5), 1364–1371.
Sritharan, S., Aaleti, S., Henry, R. S., Liu, K. Y., and Tsai, K. C. (2015). Precast concrete wall with end columns (PreWEC) for earthquake resistant design. Earthq. Eng. Struct. Dyn. 44 (12), 2075–2092. doi:10.1002/eqe.2576
Twigden, K. M. (2016). Dynamic response of unbonded post-tensioned concrete walls for seismic resilient structures. PhD Thesis. Auckland (New Zealand): University of Auckland.
Vassiliou, M. F., Mackie, K. R., and Stojadinović, B. (2016). A finite element model for seismic response analysis of deformable rocking frames. Earthq. Eng. Struct. Dyn. 46 (3), 447–466. doi:10.1002/eqe.2799
Keywords: rocking wall, analytical modeling, finite element method, impact damping, precast concrete
Citation: Kalliontzis D and Nazari M (2021) Unbonded Post-tensioned Precast Concrete Walls With Rocking Connections: Modeling Approaches and Impact Damping. Front. Built Environ. 7:638509. doi: 10.3389/fbuil.2021.638509
Received: 06 December 2020; Accepted: 11 February 2021;
Published: 06 April 2021.
Edited by:
Andrea Belleri, University of Bergamo, ItalyReviewed by:
Roberto Nascimbene, Fondazione Eucentre, ItalyEkkachai Yooprasertchai, King Mongkut’s University of Technology Thonburi, Thailand
Copyright © 2021 Kalliontzis and Nazari. This is an open-access article distributed under the terms of the Creative Commons Attribution License (CC BY). The use, distribution or reproduction in other forums is permitted, provided the original author(s) and the copyright owner(s) are credited and that the original publication in this journal is cited, in accordance with accepted academic practice. No use, distribution or reproduction is permitted which does not comply with these terms.
*Correspondence: Maryam Nazari, bW5hemFyMTJAY2Fsc3RhdGVsYS5lZHU=