 Donya Sheikh Khan
 Jakub Kolarik
 Peter Weitzmann1,2
- 1Department of Civil Engineering, Technical University of Denmark, Kongens Lyngby, Denmark
- 2NCC Denmark, Søborg, Denmark
Occupants can provide valuable feedback on the indoor environmental quality of buildings. Research on occupant voting systems (OVS) has demonstrated that apps or electronic devices can act as viable tools for collecting long-term feedback from occupants. However, previous research has only to a limited extent explored occupants’ interaction with OVS and the impact it might have on the reliability of the collected feedback. The present paper presents three case studies on applying a tangible OVS, denoted TiAQ, to collect feedback on thermal and indoor air quality (IAQ) in office spaces. The main objective of the present study was first to explore occupants’ interaction with TiAQ and their motivation. Second, identifying whether feedback collected with TiAQ could represent occupants’ comfort and discomfort with the thermal environment and IAQ. Thirdly, identifying challenges related to occupants’ interaction with TiAQ that might affect the representativeness of collected feedback. The present study was conducted at three office buildings in up to 7 months and demonstrated that TiAQ was suitable for collecting long-term feedback on occupants’ comfort and discomfort with the thermal environment. On average, one vote was cast per day per occupant. Additionally, in one of the office buildings, 60% of occupants reported to have interacted with TiAQ daily or weekly when, e.g., passing the device going to/from the office spaces. Occupants’ expectations of TiAQ and getting “feedback on feedback” need to be further addressed to identify ways to sustain occupants’ long-term use of the device and reduce “ill-willed” interactions.
Introduction
Occupants are a valuable source of information regarding their needs and requirements to and experiences of the indoor environment in office buildings (Peretti and Schiavon, 2011; Frontczak et al., 2012; Geng et al., 2019). This information is typically acquired through indoor environmental quality (IEQ) questionnaires (Li et al., 2018) and have provided valuable insight to the research community and building industry about factors (e.g., indoor environment, building design and services, workplace conditions) that can affect occupants’ perceived comfort and satisfaction. For example, Altomonte and Schiavon (2013) compared occupant satisfaction of LEED and none-LEED certified commercial buildings. The comparison was based on a database containing 21,477 individual responses to a web-based IEQ questionnaire from 144 buildings collected over 10 years. The authors found no statistically significant difference between the two types of buildings for several IEQ parameters such as thermal comfort, workspace cleanliness and visual comfort. Concurrent indoor environmental measurements and IEQ questionnaires can provide additional insight into the questionnaire responses (Parkinson et al., 2019). For example, Choi et al. (2012) used data from simultaneously collected spot measurements and IEQ questionnaires from 402 workstations in 20 commercial buildings collected over 3 years. The study identified inter alia that differences in clothing level led to a significant difference in thermal satisfaction level between female and male occupants.
The aforementioned questionnaires represent a viable method for conducting building performance evaluation at a large scale (e.g., multiple buildings in different nations, Bluyssen et al., 2016). Because they can be fast, cheap and easy to distribute and collect (Peretti and Schiavon, 2011; Guerra-Santin and Tweed, 2015; Gilani and O’brien, 2017). However, they have limitations that might affect their reliability. For example, retrospective cross-sectional questionnaires typically used as part of post-occupancy surveys (POE) (Dykes and Baird, 2013; Gilani and O’brien, 2017; Li et al., 2018) can be subject to bias as occupants might exaggerate or underreport how they experienced previous indoor conditions (Raphael, 1987). Furthermore, cross-sectional questionnaires might not capture possible changes in occupants’ general experience over time (Brauer et al., 2006; Levin, 2006). “Here and now” or longitudinal questionnaires can address these problems. However, they require more frequent participation of the occupants (Parkinson et al., 2019) resulting in lower participation (i.e., response rates) (Alessandra et al., 2013; Gilani and O’brien, 2017).
Compared to conventional survey tools (e.g., web-based or paper-based questionnaires), tools denoted as occupant voting systems (OVS) (Jung and Jazizadeh, 2019) might provide a more viable method for conducting longitudinal surveys. The responses submitted with the OVS can be timestamped and related to contextual factors such as indoor environmental measurements (Konis, 2013; Guerra-Santin and Tweed, 2015; Carre and Williamson, 2018; Geng et al., 2019). OVS is designed to “continuously” collect feedback on occupants’ perception of IEQ (Sheikh Khan et al., 2020). Various applications of OVS (e.g., for indoor temperature control or POE) have been studied. Berquist et al. (2019) had set up electronic panels with five buttons at an entrance to a gymnastics centre in Ontario, Canada for 7 months to demonstrate the feasibility of collecting long-term thermal and indoor air quality (IAQ) votes in transient occupancy spaces. They collected over 1000 votes and demonstrated a significant correlation between the votes and measured indoor conditions. Lassen et al. (2020) conducted a 3-month study in two office buildings. They placed tablets near entrances to office spaces to collect votes on occupants’ general satisfaction with the indoor environment. The results showed that OVS was mostly used by occupants when they were dissatisfied. The authors concluded that the OVS was not suitable for benchmarking but appropriate for collecting occupants’ complaints on the thermal environment. Winkler et al. (2016) explored different implementations and designs of a smartphone app to collect thermal sensation votes. The votes were used as an input to the thermal comfort model developed by Fanger (ANSI/ASHRAE, 2013) which was used to determine the preferred indoor temperature for controlling heating, ventilation and air-conditioning (HVAC). They demonstrated an increase in occupant satisfaction of 59% and an energy saving of 19%.
The aforementioned studies have demonstrated that OVS can be inter alia used to collect a vast amount of responses over a relatively short time (e.g., Berquist et al., 2019). However, some prevailing limitations were identified in existing research studies on OVS. First, very few studies were identified (e.g., Lassen et al., 2020) that evaluated the reliability of occupant votes (Lee and Karava, 2020; Sheikh Khan et al., 2020). Second, most studies used smartphone apps (e.g., Winkler et al., 2016) without considering other alternatives of user interfaces (Lee and Karava, 2020; Sheikh Khan et al., 2020) and how that might affect the collected occupant votes. Finally, researchers in some studies actively encouraged and reminded occupants to frequently vote (e.g., Jazizadeh et al., 2014; Lee and Karava, 2020; Sheikh Khan et al., 2020). But this is neither necessarily viable nor representative in case of real-life settings where the objective is to integrate the OVS as part of building operation management.
This paper aimed to address the aforementioned research gaps through three case studies on a tangible OVS device denoted as TiAQ. TiAQ was characterised as a non-intrusive, accessible and simple device for collecting thermal and IAQ feedback in office spaces. The main objective of the study presented in this paper was to explore occupants’ interaction with TiAQ and their motivation. The paper addresses whether responses collected with TiAQ could represent occupants’ comfort and discomfort with the thermal environment and IAQ and identify challenges related to occupants’ interaction with TiAQ that might affect the representativeness of responses.
Materials and Methods
The Concept and Design of TiAQ
Based on previous research (Mathur et al., 2015) and literature reviews on OVS (Jung and Jazizadeh, 2019; Sheikh Khan et al., 2020) the authors identified the following three main characteristics, “non-intrusive,” “accessible” and “simple,” to guide the design of TiAQ for use in office spaces. First, it was important that the OVS was non-intrusive and did not act as a stressful and disturbing factor in the occupants’ daily activities. Second, all occupants in the office space needed to have easy access to the device to ensure everyone could vote and be represented in the voting poll. Third, the OVS interface had to be as simple as possible to allow for quick and easy voting without requiring too much time and effort from the occupants.
The authors evaluated that a tangible user interface was able to satisfy the aforementioned characteristics. Consequently, TiAQ was designed as a physical panel of five buttons that gave occupants access to provide their “here and now” feedback on the thermal environment and IAQ at their office space using the following buttons: “Too Cold,” “Too Warm,” “Draught,” “Stuffy,” and “Fine” (Figure 1A). It was placed in the office space at areas (Figure 1A, e.g., near entrances) where occupants likely passed. The buttons transmitted data with the Zigbee communication protocol to an internet-connected gateway, which sent the data for storage in a cloud platform. The location of the panel and information flyers distributed in the office space (Figure 1B) were expected to act as a source of information and reminder to occupants to use TiAQ. Furthermore, a dashboard (Figure 1B) developed in R Shiny1 showing the weekly voting distribution, daily temperature, humidity and CO2 measurements was also provided as an incentive to motivate occupants to use the OVS. The occupants could access the dashboard by scanning a QR code on the information flyers or next to the panels.
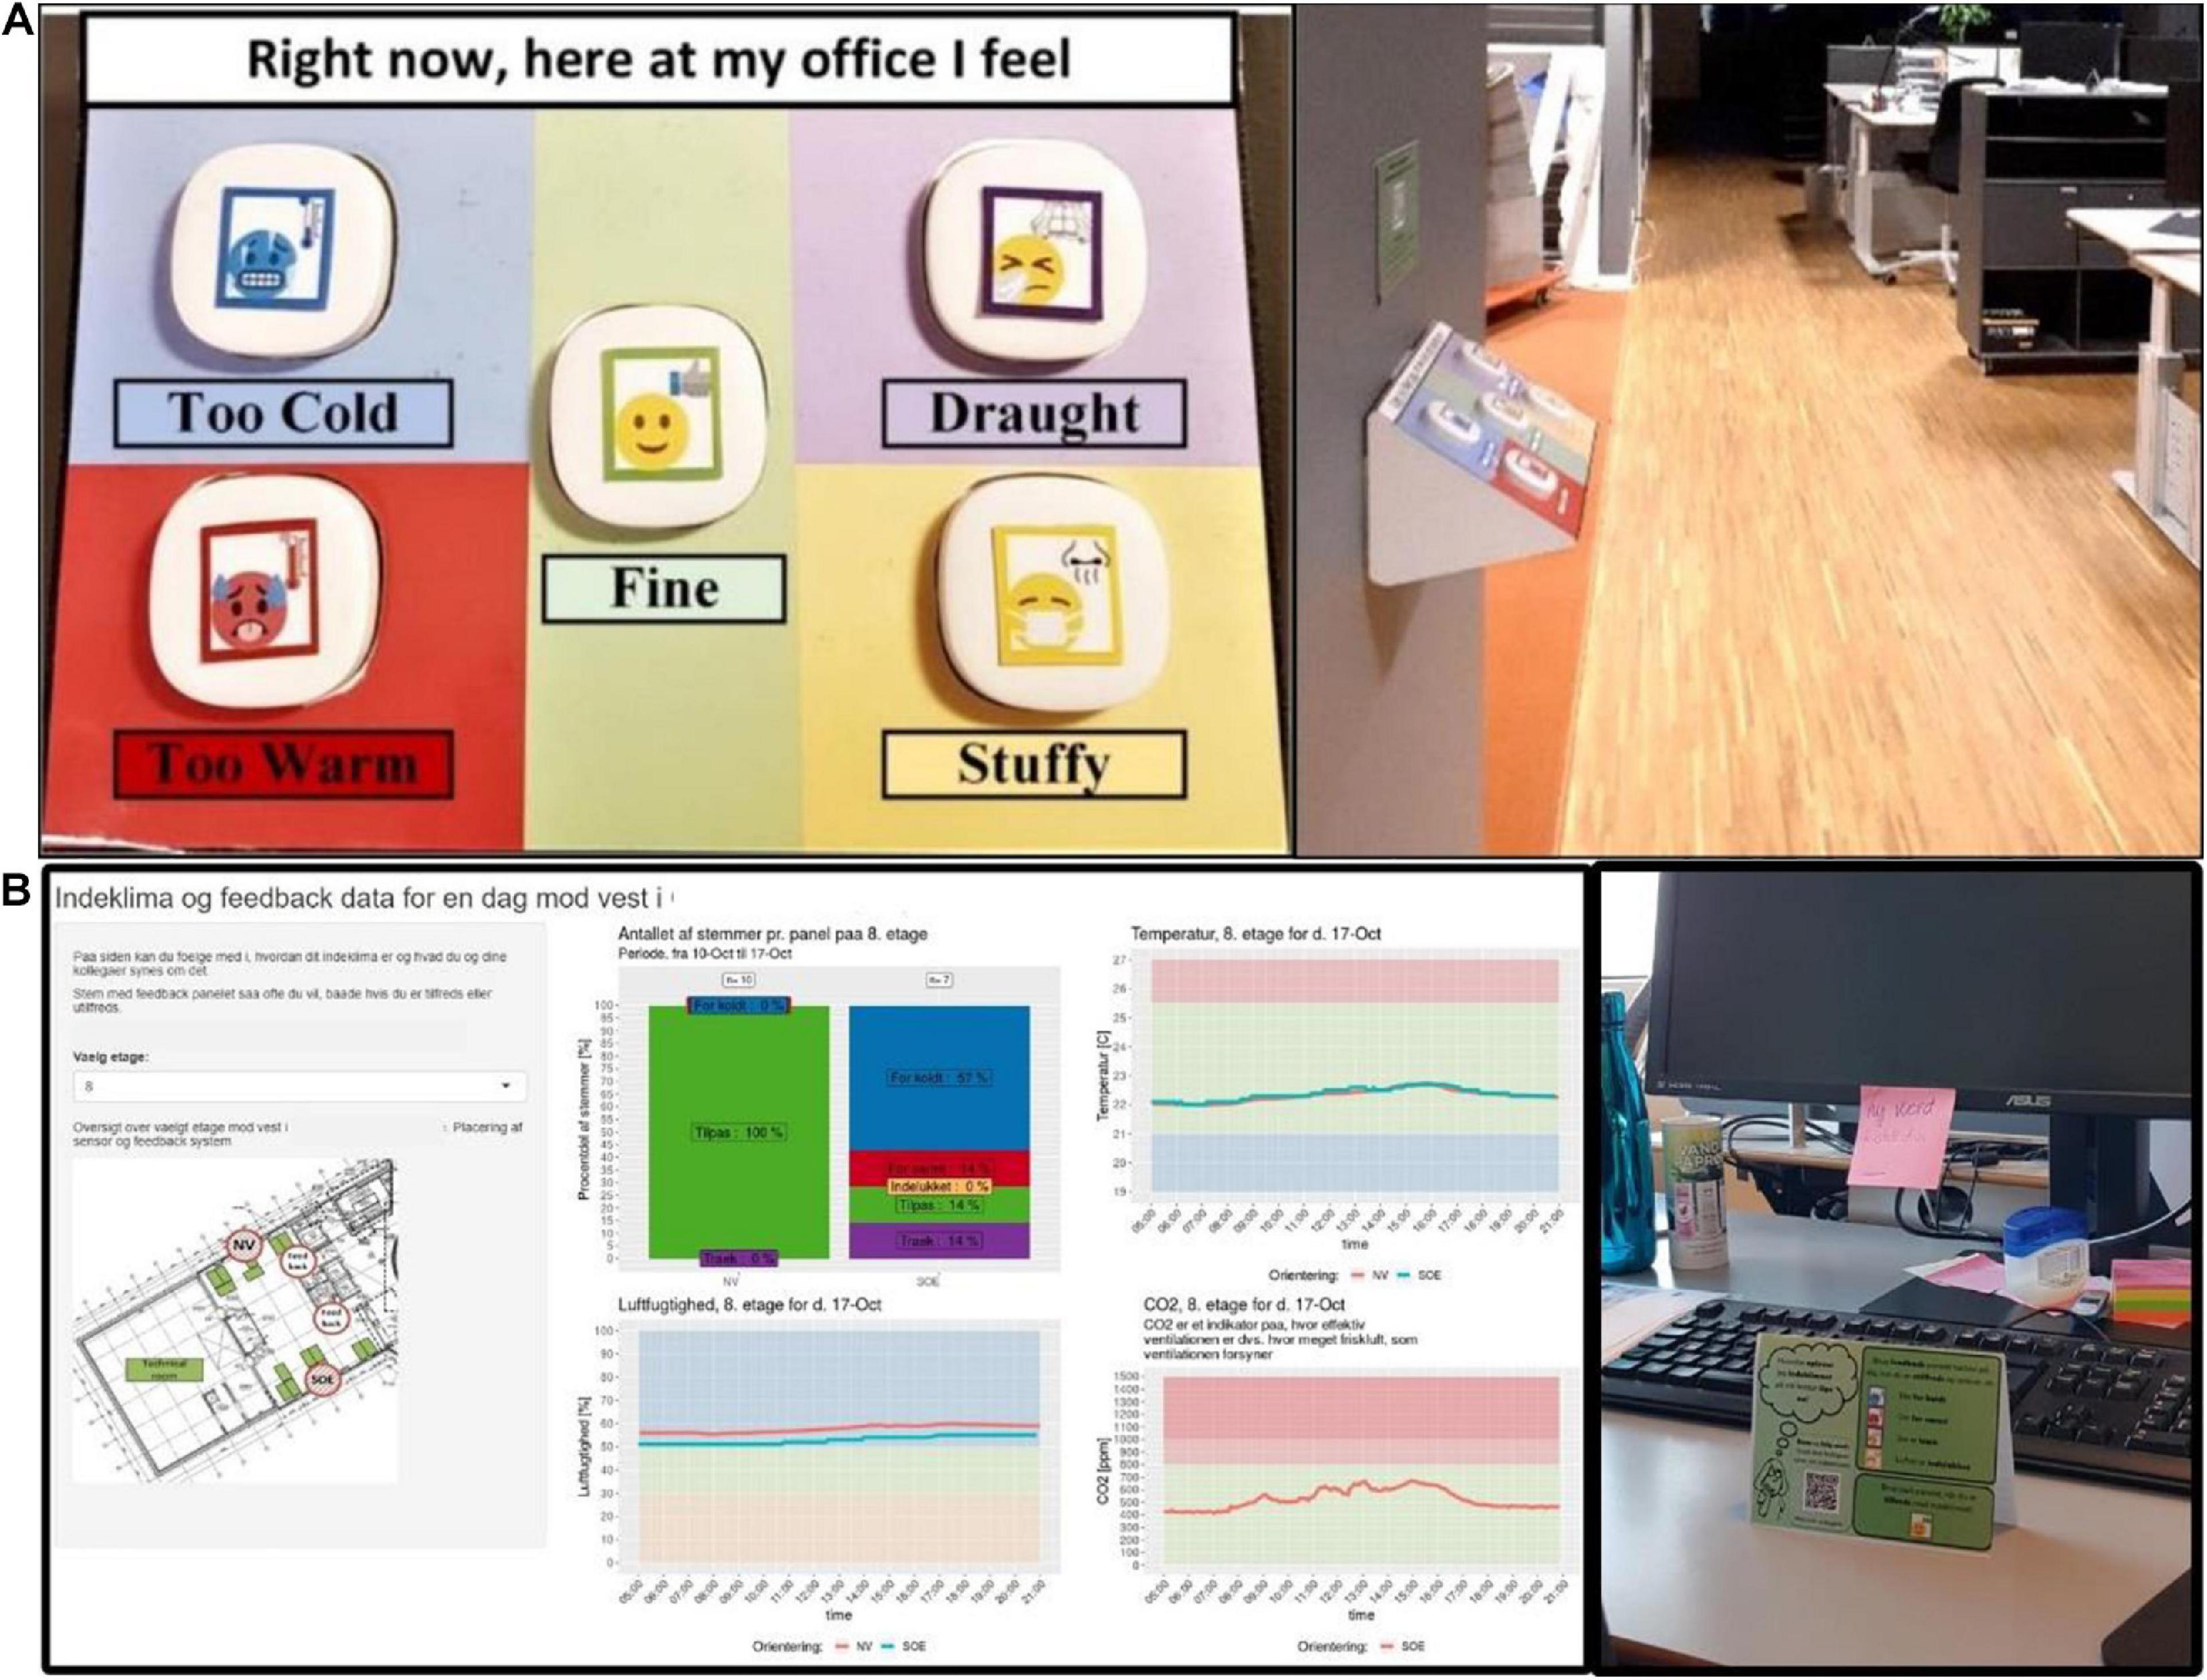
Figure 1. (A) Interface of TiAQ and an example of the mounting location of TiAQ in one of the studied office spaces. (B) Overview of web-dashboard (left) and information flyer (right).
Description of the Case Studies
The research objectives were investigated using three case studies (Table 1). The purpose of case study I was to develop TiAQ and explore how it was received and used by office workers in an office space. Specifically, the study was intended to determine the number of TiAQ panels to place in a space and determine potential challenges related to occupants’ interaction with TiAQ.
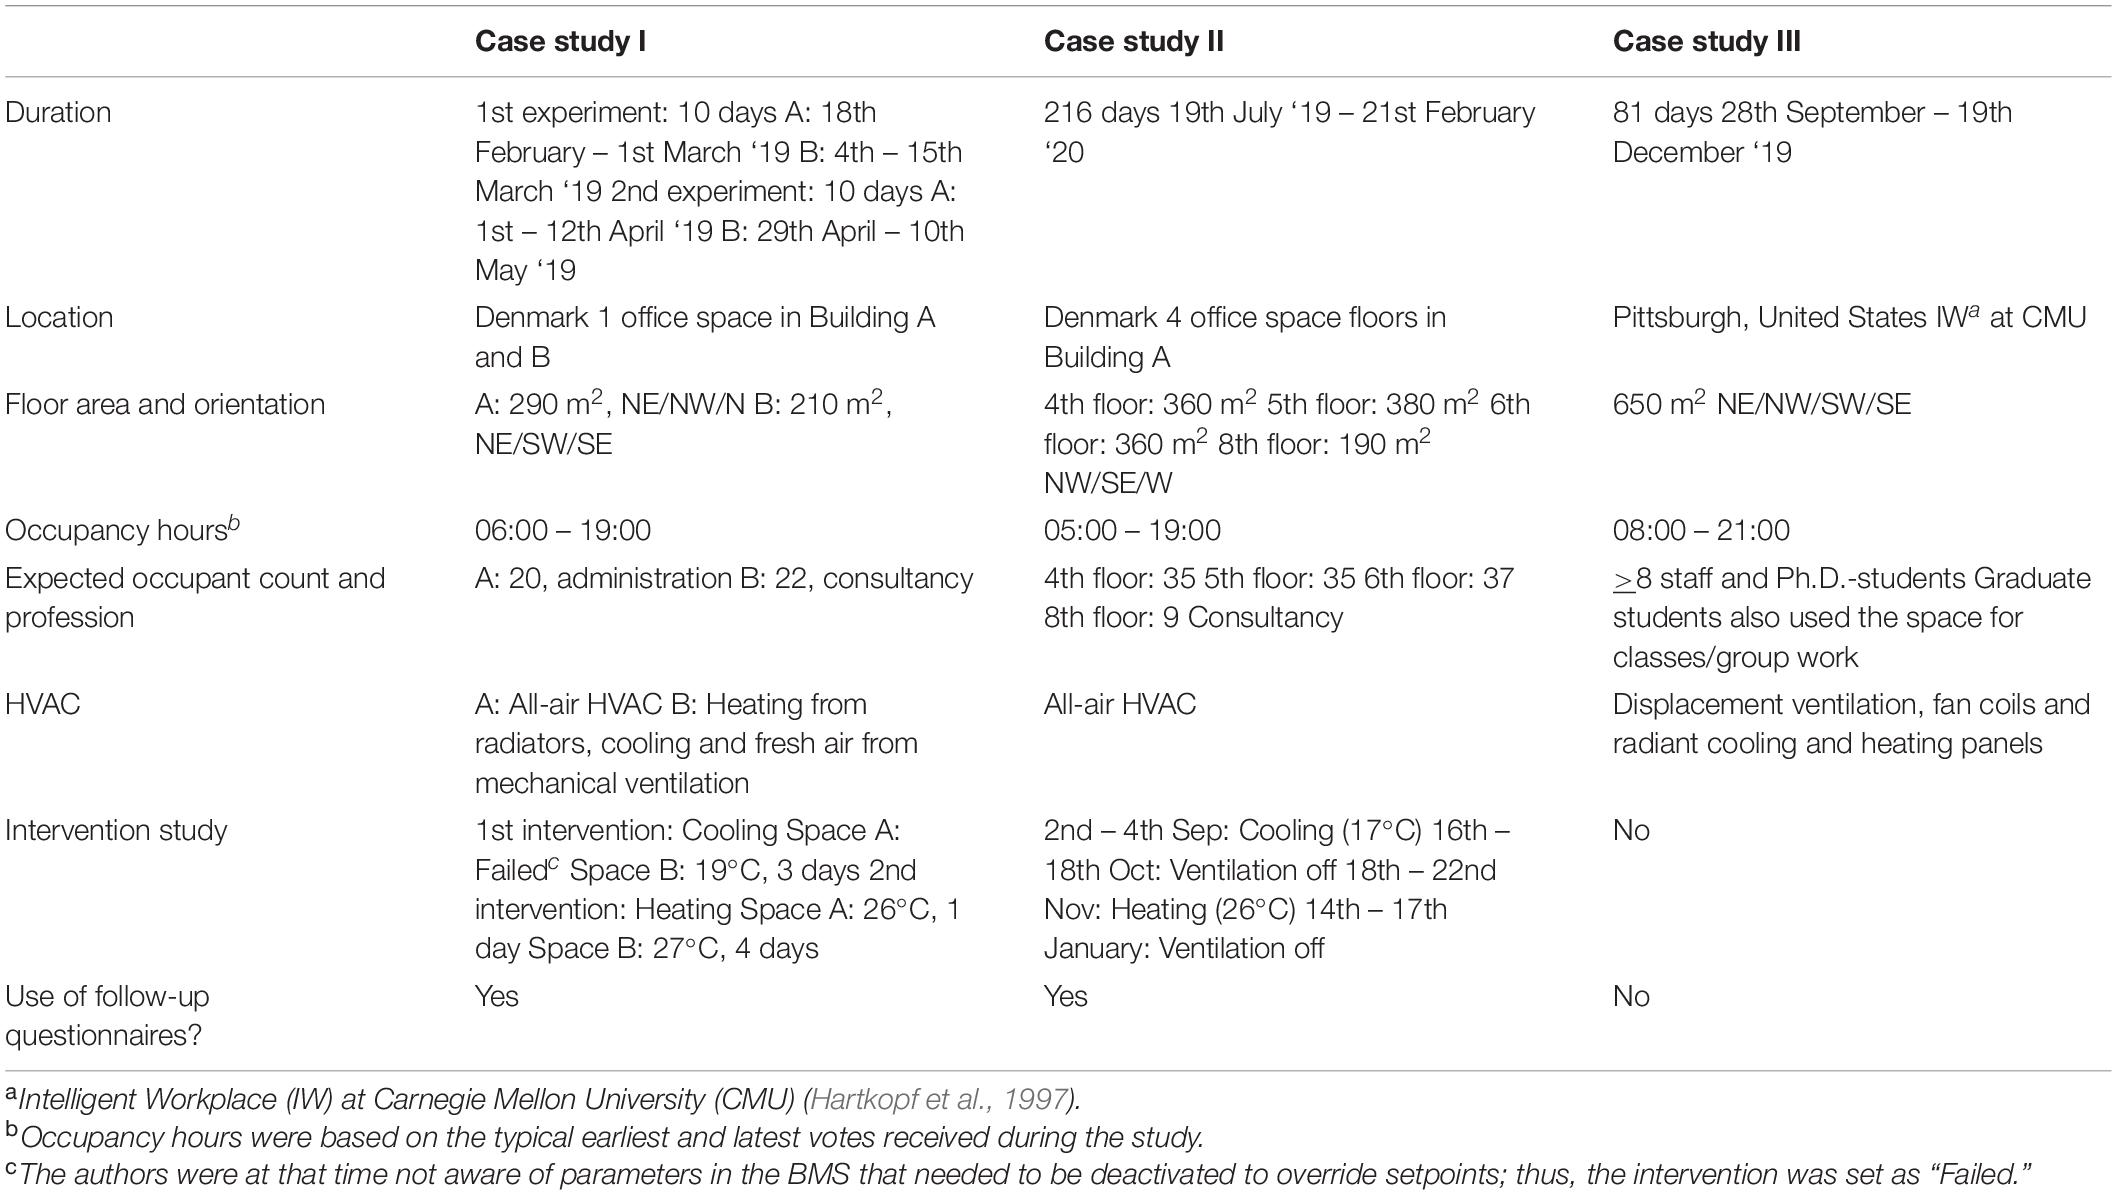
Table 1. Overview of study design and use of questionnaires.
Case study II was intended to address the long-term use of TiAQ and was carried out based on the results and experiences gathered during case study I. In case study I and II, multiple interventions (Table 1, e.g., heating and cooling of the office spaces) were conducted over several days to create variability in the indoor environment to induce responses from the occupants. The intervention days were coordinated with the building operation manager without informing occupants about the interventions. An intervention was immediately interrupted (note in Table 1 that the duration of the intervention varied) in the case occupants contacted the main author or the building operation manager about uncomfortable indoor environmental conditions.
The aim of case study III was to evaluate the long-term application of TiAQ in a different building than in case study II. The study did not include any official introduction or information to occupants. Furthermore, there were neither any interventions nor follow-up questionnaires (Table 1).
Case Study I
Case study I consisted of two in-field experiments that were conducted at office spaces in two different office buildings (Building A and B) in Denmark (Table 1). Figure 2 shows the occupants’ desks, the indoor environmental sensors and location of TiAQ for both experiments. Before the beginning of the study, the main author had e-mail correspondence and a physical introductory meeting about the study and TiAQ with the occupants in each building. Furthermore, an information sheet was placed at each desk about the sensor setup, application, study duration and data management according to the European General Data Protection Regulation (GDPR) (Proton Technologies, 2021). The first experiment (Exp. I) was conducted using only one TiAQ in the location shown in Figure 2. The second experiment (Exp. II) was conducted using seven TiAQ panels distributed around the office to determine whether there was a difference in the voting frequency (total number of votes divided by users and days) when having one or more panels in the space. Both experiments had a duration of 2 weeks, where the first week was carried out as a “baseline” week and second week as an “intervention” week, where the setpoint temperatures were either increased or decreased (Table 1). After each experiment, occupants were asked to complete a paper-based questionnaire about their satisfaction with the thermal environment, satisfaction with IAQ, their thermal sensation and the cause of dissatisfaction with IAQ for the last week of the experiment. The occupants had at least 2 weeks to respond to the questionnaires.
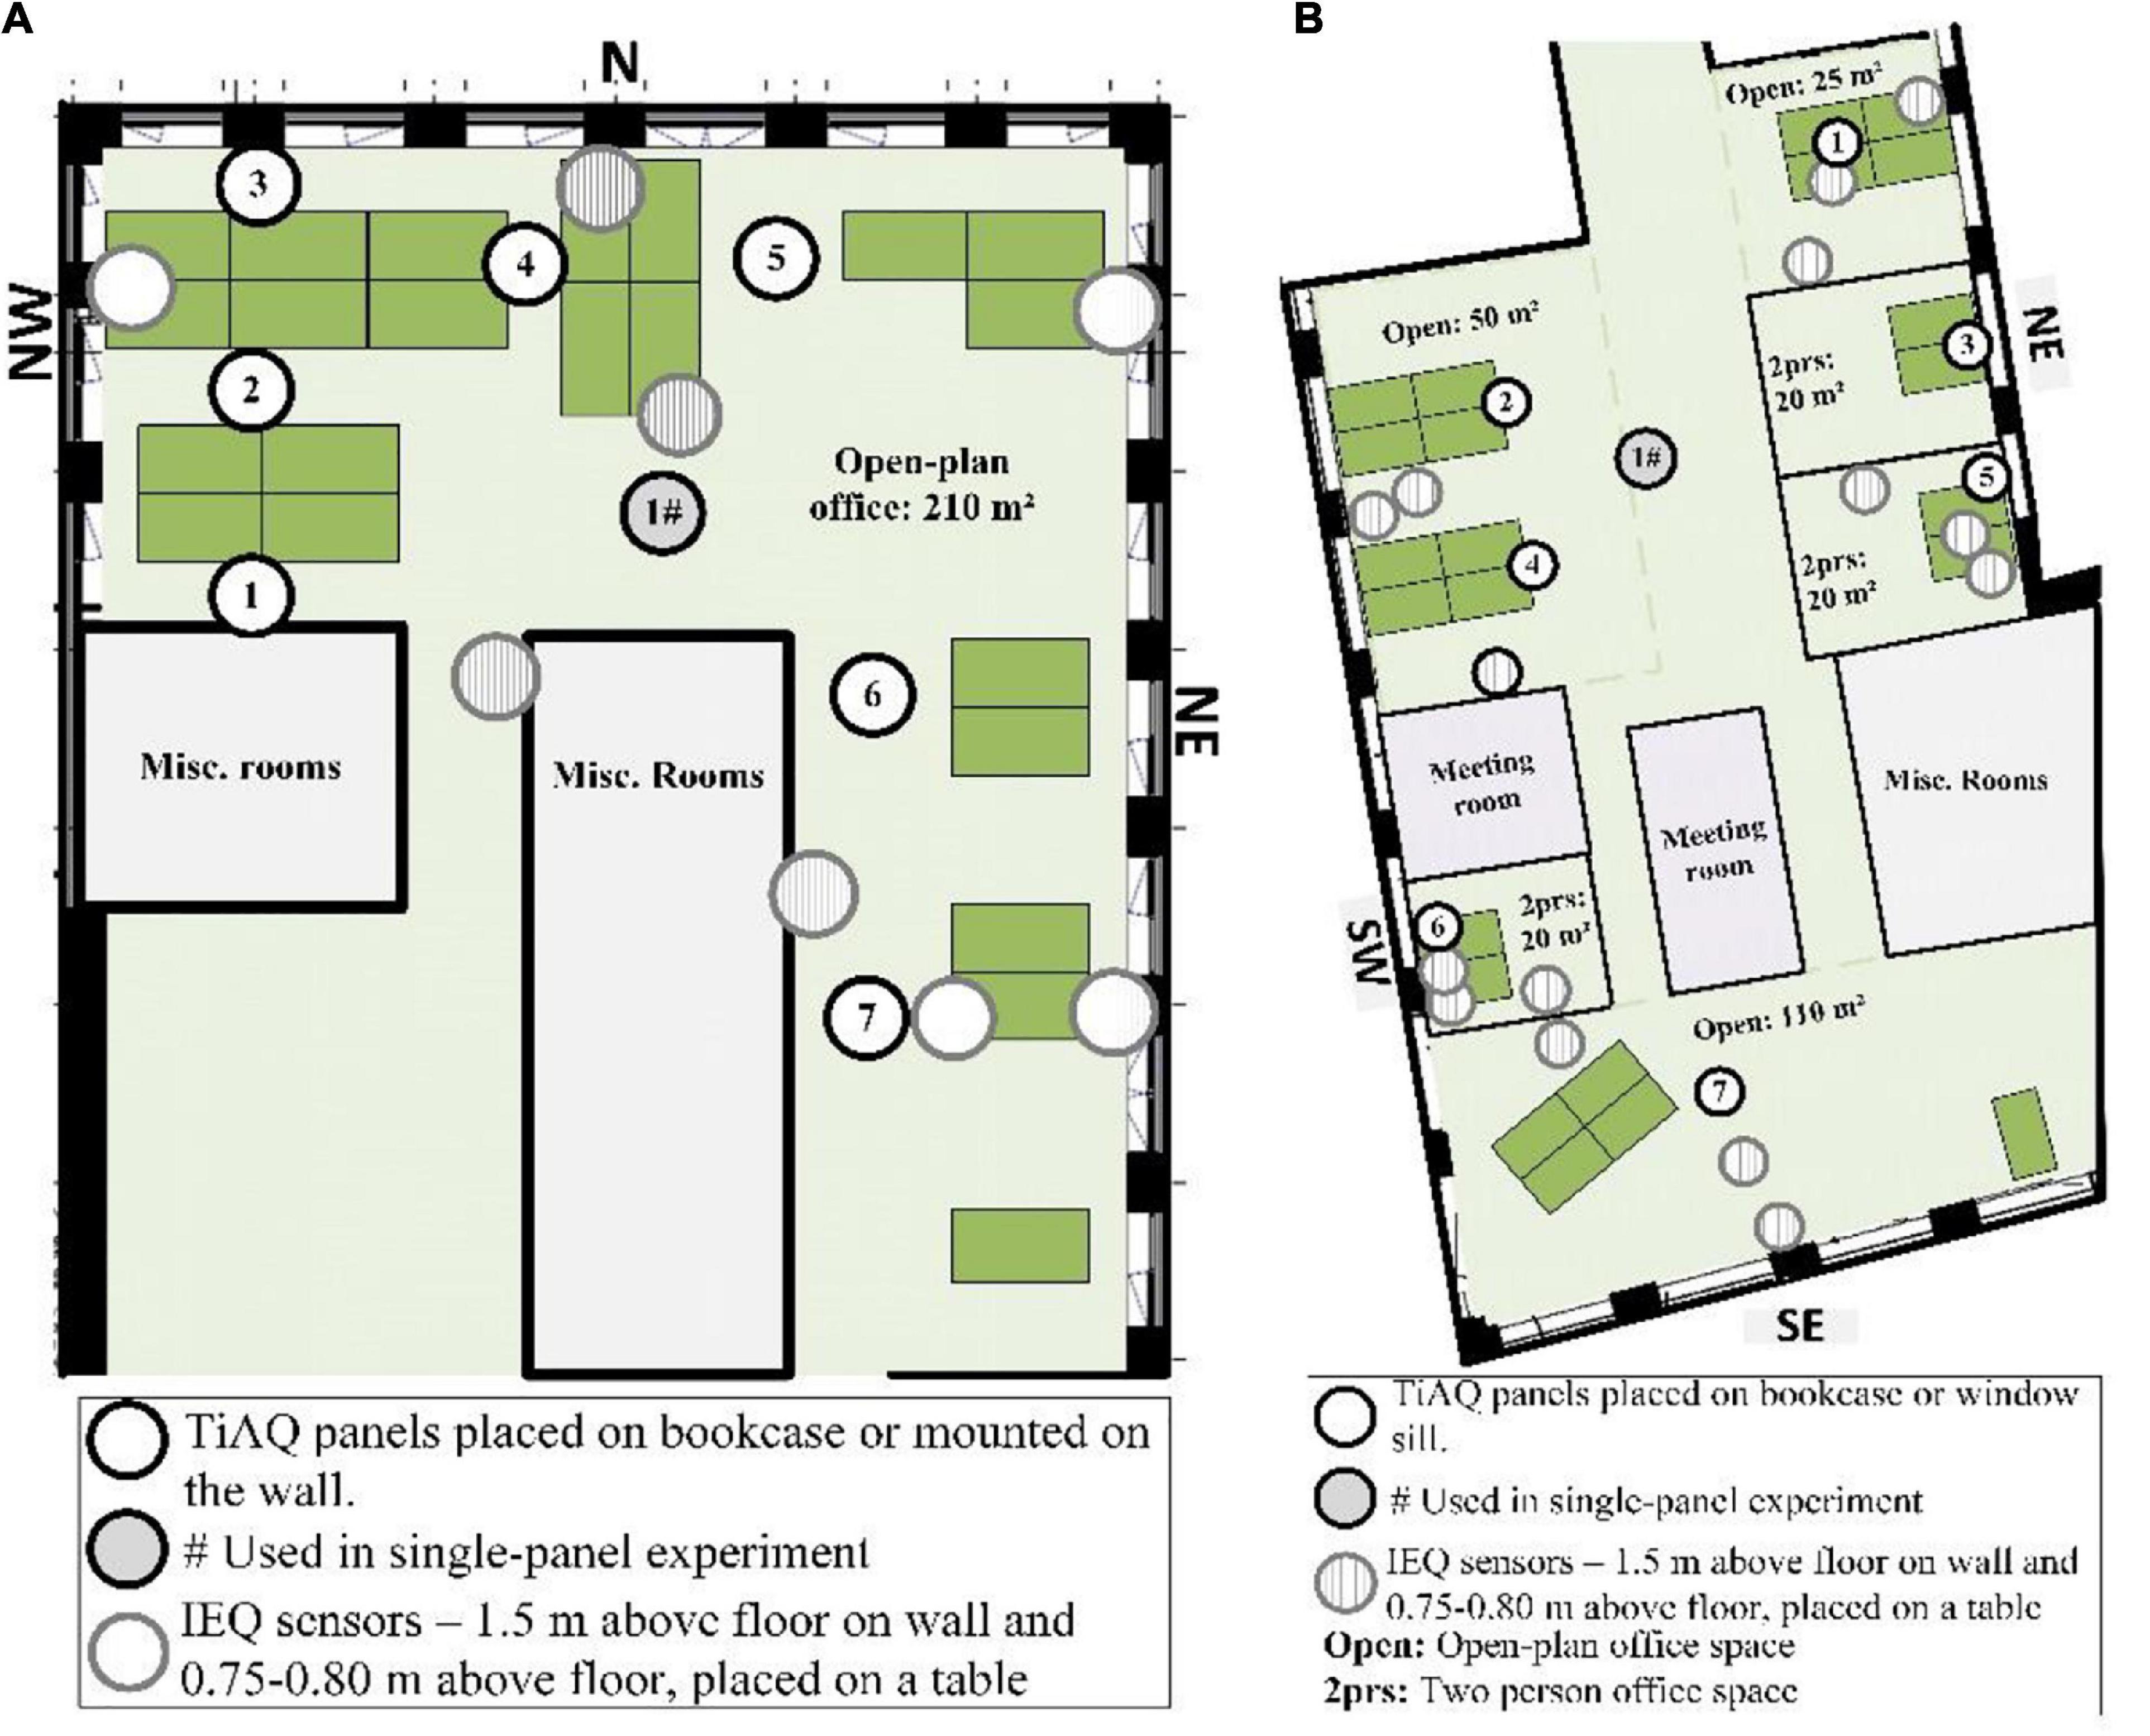
Figure 2. Location of TiAQ, deployed sensors and desks. The first experiment was conducted using only one TiAQ panel located at the spot marked with #. (A) Northern part of building A. (B) Southern part of building B.
Contribution of Case Study I to the Design of Case Study II
Case study I led to the following main observations used for designing case study II. (1) The authors evaluated that 3 days of intervention would be suitable to generate enough variability in the indoor environment without causing too many complaints, leading to the intervention’s interruption. (2) The dashboard shown in Figure 1B was designed and implemented to keep the occupants engaged over time. (3) The voting frequency was slightly higher for the period with multiple TiAQ panels (Exp. I: 0.93 and Exp. II: 1.47 votes per user per day for building A, and Exp. I: 0.76 and Exp. II: 1.0 votes per user per day for building B). Furthermore, the multiple panels provided insight into what groups of occupants in the office space voted. Therefore, by considering the cost of equipment to produce TiAQ, it was decided that at least two panels should be used in the office spaces studied in case study II, preferably placed near entrances so all occupants in the office space would pass it.
Case Study II
Case study II was carried out in building A (Table 1) but in the building’s west-facing section (Figure 3). The office spaces had two entrances (Figure 3) leading to a thermally conditioned atrium connecting each section (e.g., north Figure 2A) in the building. Before the beginning of the study, the main author sent an e-mail with information about the study to the occupants in the office spaces. At the beginning of the main study, a web-based questionnaire was distributed that asked occupants about their general satisfaction and experience of the indoor environment, their use and experience of control options in the building and about their communication with the building operation manager. Finally, the questionnaire asked occupants about their expectations of TiAQ. A short monthly web-based questionnaire was distributed that asked occupants about their use and motivation for using TiAQ. Finally, a questionnaire with a combination of the first and monthly questionnaires as well as occupants’ general experience of the functionality and design of TiAQ was distributed at the end of the study. Occupants completing the questionnaires were considered in a lottery for a gift card to a bakery shop. Intervention days were set to occur every month on random weekdays. The interventions lasted 3 days, except the heating intervention in October (Table 1) lasted longer because access to the BMS was disconnected due to a power outage. After each intervention, all adjusted parameters were reset to the previous settings.
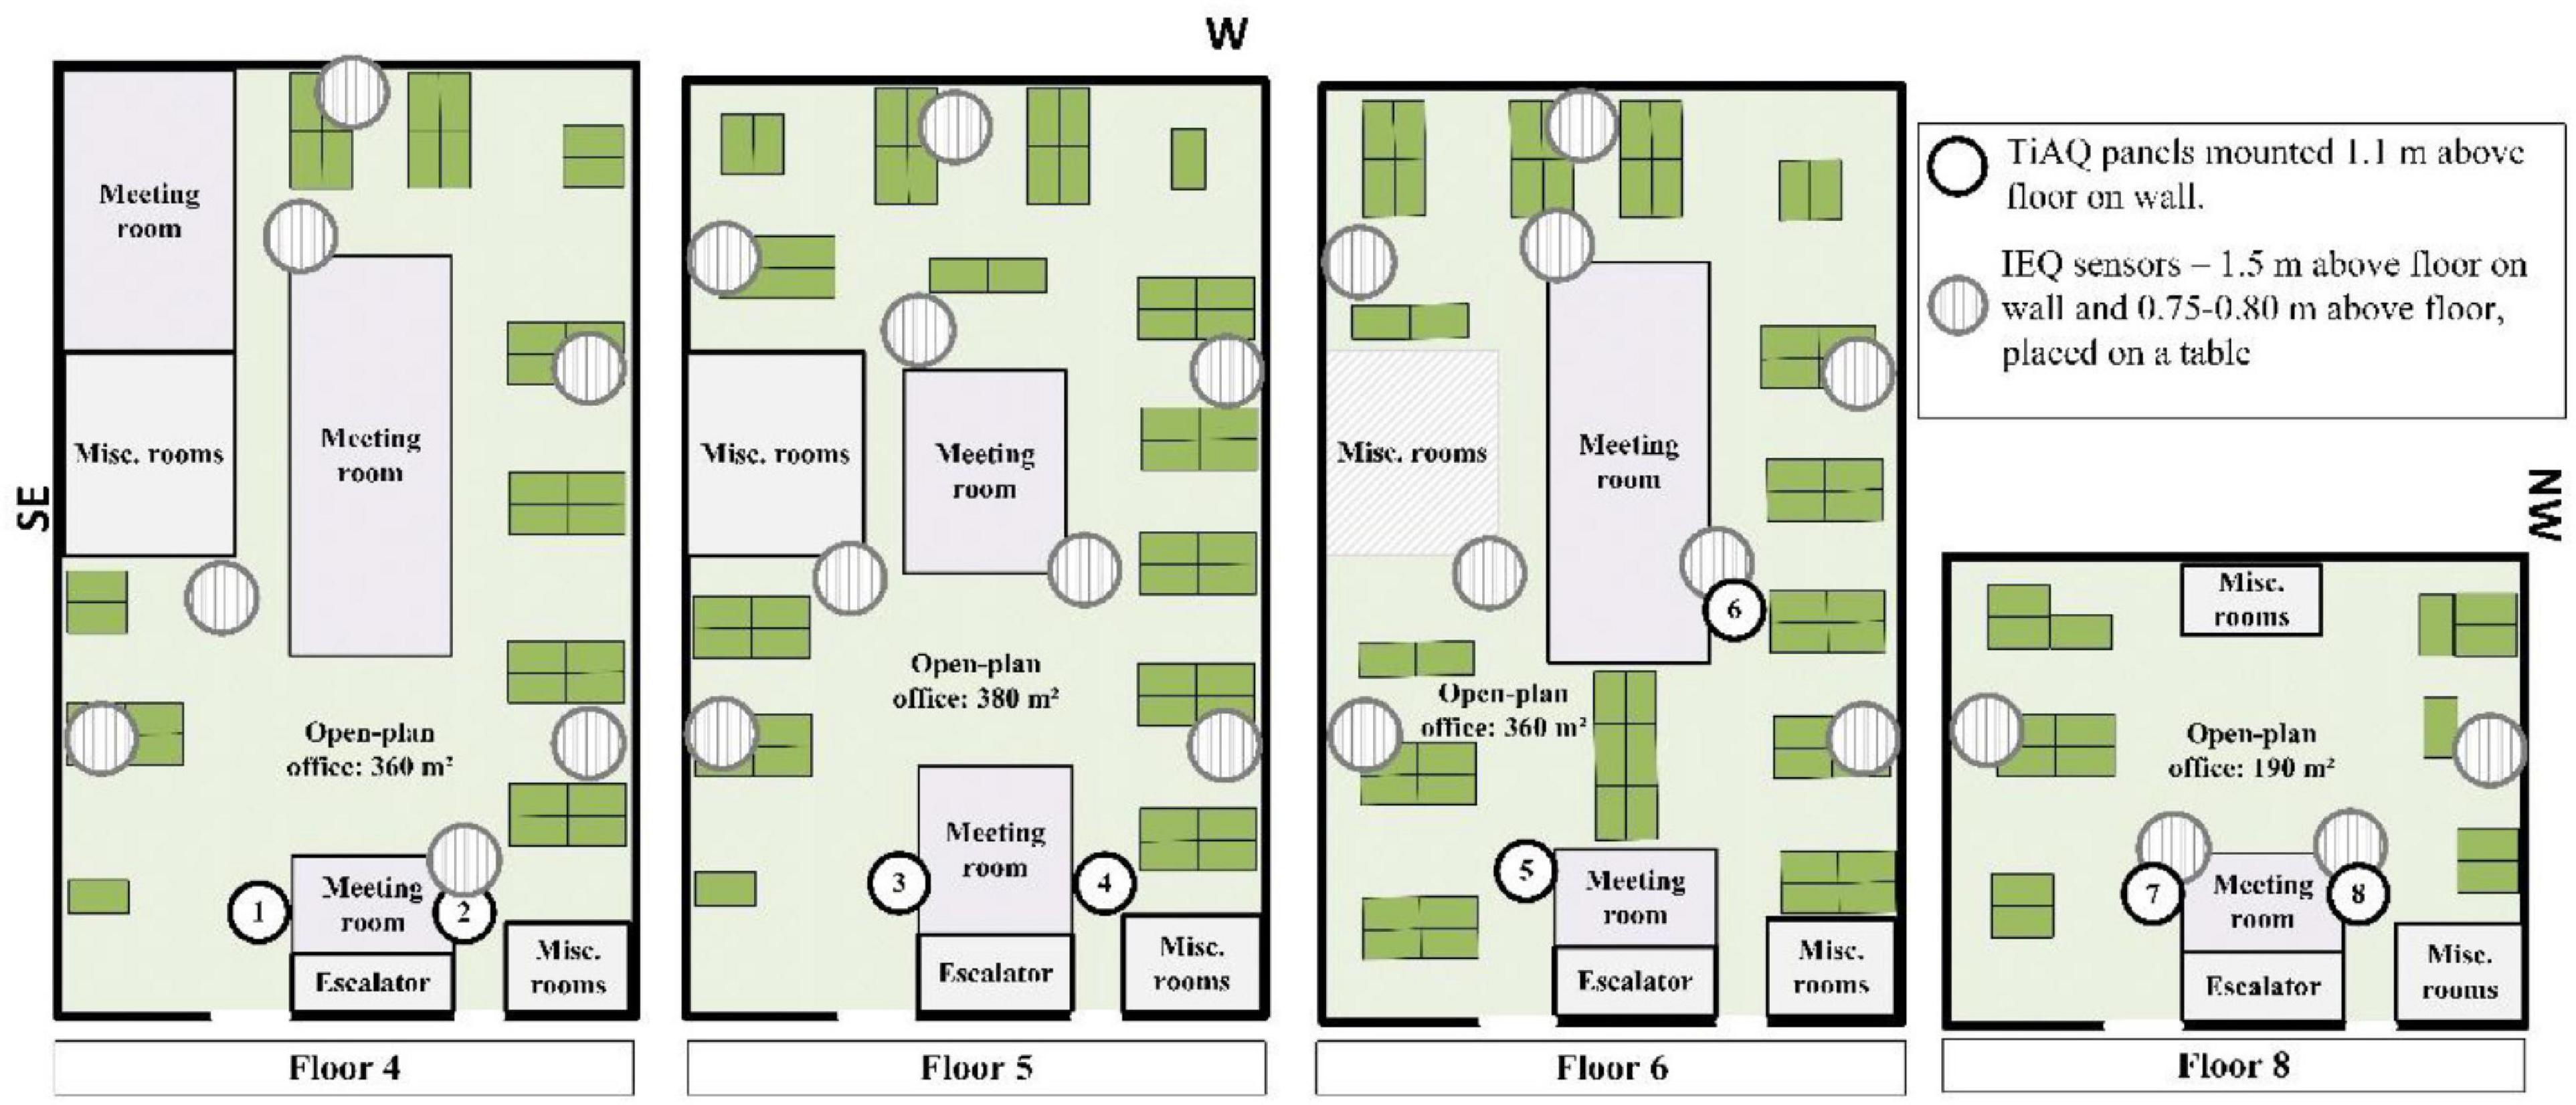
Figure 3. Location of TiAQ, desks and deployed sensors in the four office spaces in the western part of building A.
Case Study III
Case study III was conducted at the Intelligent Workplace (IW) (Hartkopf et al., 1997) at Carnegie Mellon University (CMU) in Pittsburgh, United States. Three TiAQ panels were distributed in the space, as shown in Figure 4. During the study, IW was typically used by eight persons comprising of PhD-students and professors (Table 1). During a typical week, classes were held for graduate students in “Conference 1” (Figure 4) and some of the offices and conference room 2 were mostly used for meetings and group work. Furthermore, as IW was an annexe to a larger building, occupants from other parts used the IW kitchen area. This transient occupancy at IW made it difficult to contact and inform occupants about TiAQ and the study. Therefore, the information flyers (Figure 1B), distributed in IW next to the panels and at each occupants’ desks, acted as the main source of information. Similarly, as in case study II, occupants at IW could scan a QR code on the information flyers to access a dashboard showing the measured indoor environmental conditions and occupant votes at IW.

Figure 4. Location of TiAQ, work areas and deployed sensors in the Intelligent Workplace at Carnegie Mellon University.
Data Processing and Analysis
Data Processing of Collected Votes and Questionnaires
The occupant votes were kept as collected, i.e., without any processing or cleaning. There was no need for processing the questionnaires for case study I except for removing missing answers. Questionnaires in case study II were designed so that occupants did not proceed with the questionnaires if they had answered that they neither used TiAQ nor had their office at the studied spaces. Thus, these respondents were removed from the dataset.
All questionnaires were anonymous, and participation in the study was voluntary. The responses from the questionnaires were collected using Likert scales and multiple-choice. Furthermore, respondents could also provide comments. Questionnaires are summarised in tables provided as Supplementary Material.
Analysis of Occupant Interaction, Vote Counts and Reiterated Votes
Occupants’ interaction and motivation for using TiAQ were analysed using the “raw” occupant votes and the questionnaire responses about TiAQ. The level of interaction occupants had with an OVS was described using the voting frequency. It was calculated as the total number of votes for the entire study period divided by the expected number of occupants and the number of days, which had at least one vote. Furthermore, linear regression analysis (Shumway and Stoffer, 2006) was used to determine whether there was any significant overall linear increase or decrease in occupant votes over time. The line’s slope was the overall mean of the total number of votes per day, and its significance was determined using the t-test with a significance level of 5%.
Occupants’ voting behaviour was determined by analysing the timespan between two votes and the occurrences of reiterated votes. In the present study, reiterated votes were defined as at least two votes cast by a single occupant on the same panel, not more than 1 s apart. By setting the threshold of the timespan to 1 s, it was ensured that the reiterated votes were cast by a single occupant, assuming that no groups of “ill-willed” occupants were alternately pressing the buttons less than 1 s apart.
Analysis of Questionnaire Responses and TiAQ Votes
Responses collected with TiAQ were compared to responses from the questionnaires for case study I and II to determine whether responses from TiAQ could represent occupants’ comfort and discomfort with the thermal environment and IAQ. A qualitative analysis was conducted as TiAQ and questionnaire responses could not be directly compared. This was due to difference in scale design (e.g., 3-point versus 7-point scale), the formulation of the questions (e.g., “how do you feel right now” versus “how do you generally feel”) and implementation (“real-time” versus retrospective).
Processing and Analysis of IEQ Measurements
Indoor temperature (Ti), relative humidity (RH), and CO2-concentration were measured using existing sensors connected to the building management system (BMS) as well as standalone devices placed in the office spaces. The measured IEQ parameters collected with the IEQ sensors were cleaned regarding missing values, interpolated and synchronised to 5-min time-steps. The mean value of each IEQ parameter for each space was used in the analysis. The IEQ parameters were only included to provide contextual information to the collected responses from TiAQ and the questionnaires.
Results
Occupant Votes Collected With TiAQ
An overview of the total number of votes and the voting frequency for each case study is shown in Table 2. As the occupant count varied for case study III, the voting frequency is shown as a range based on the minimum and the maximum number of occupants expected according to the main author’s observations. Figure 5 shows a time-series plot, including the overall trend line of the total number of votes, for case study II and III for each vote type.
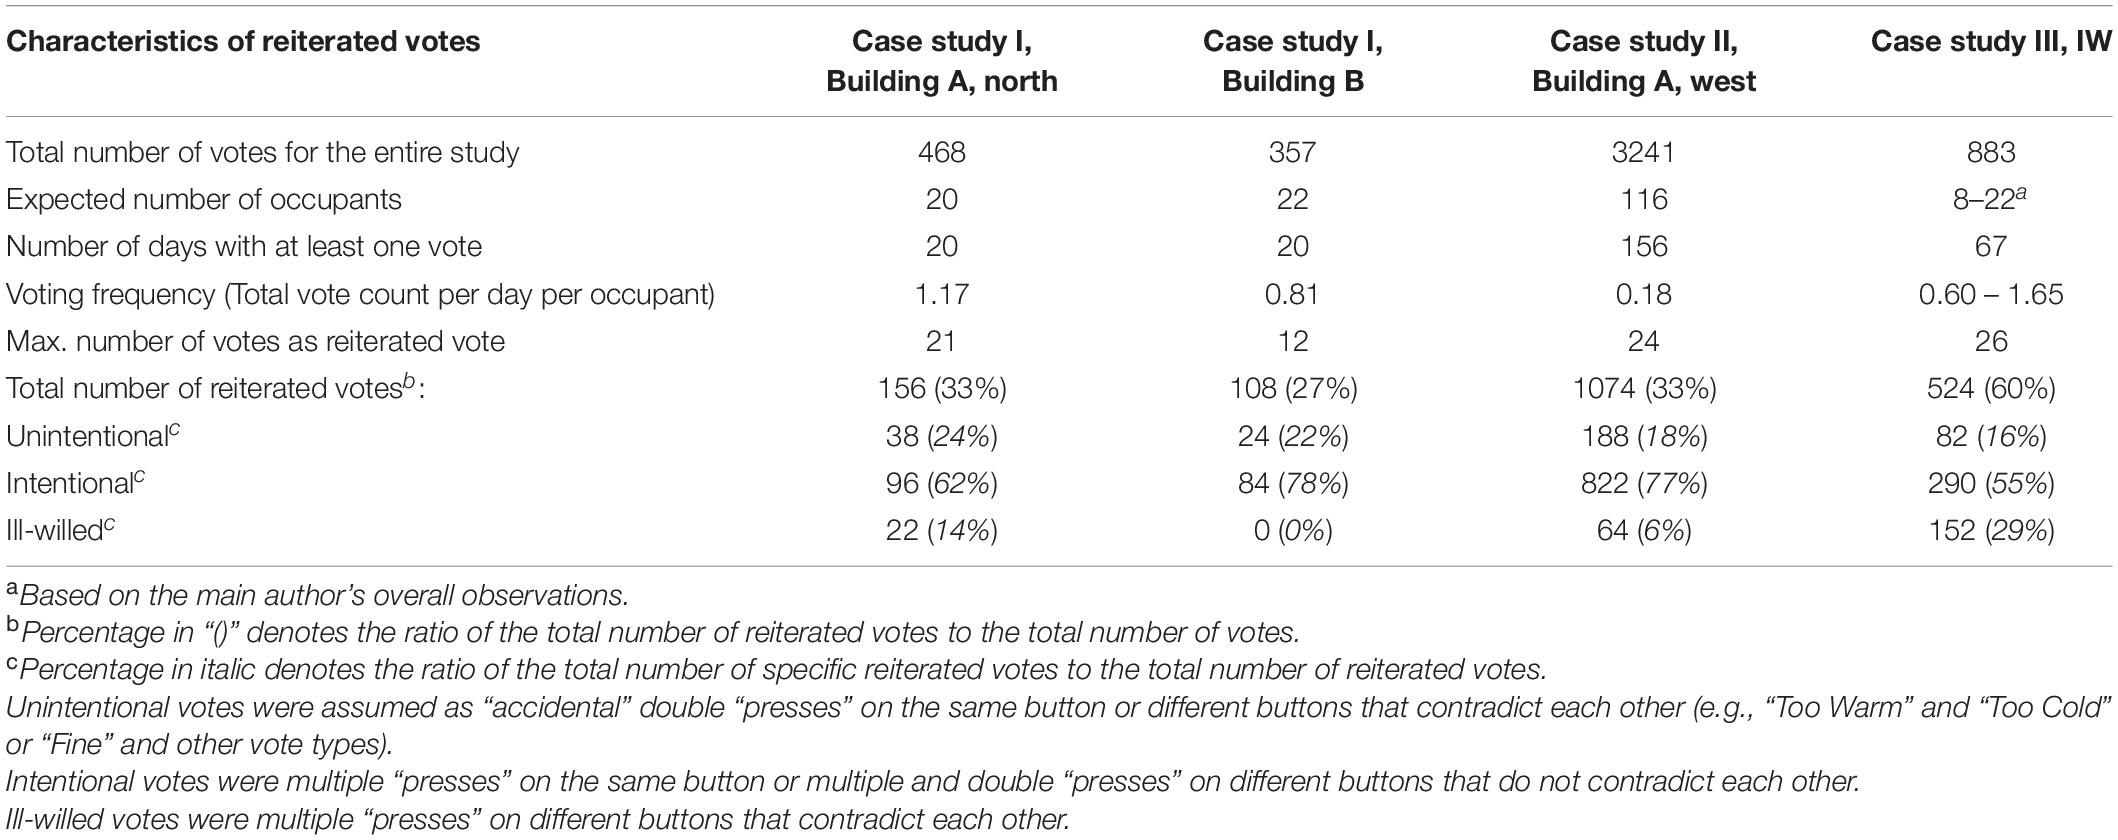
Table 2. Voting frequency and count of reiterated votes for each case study.
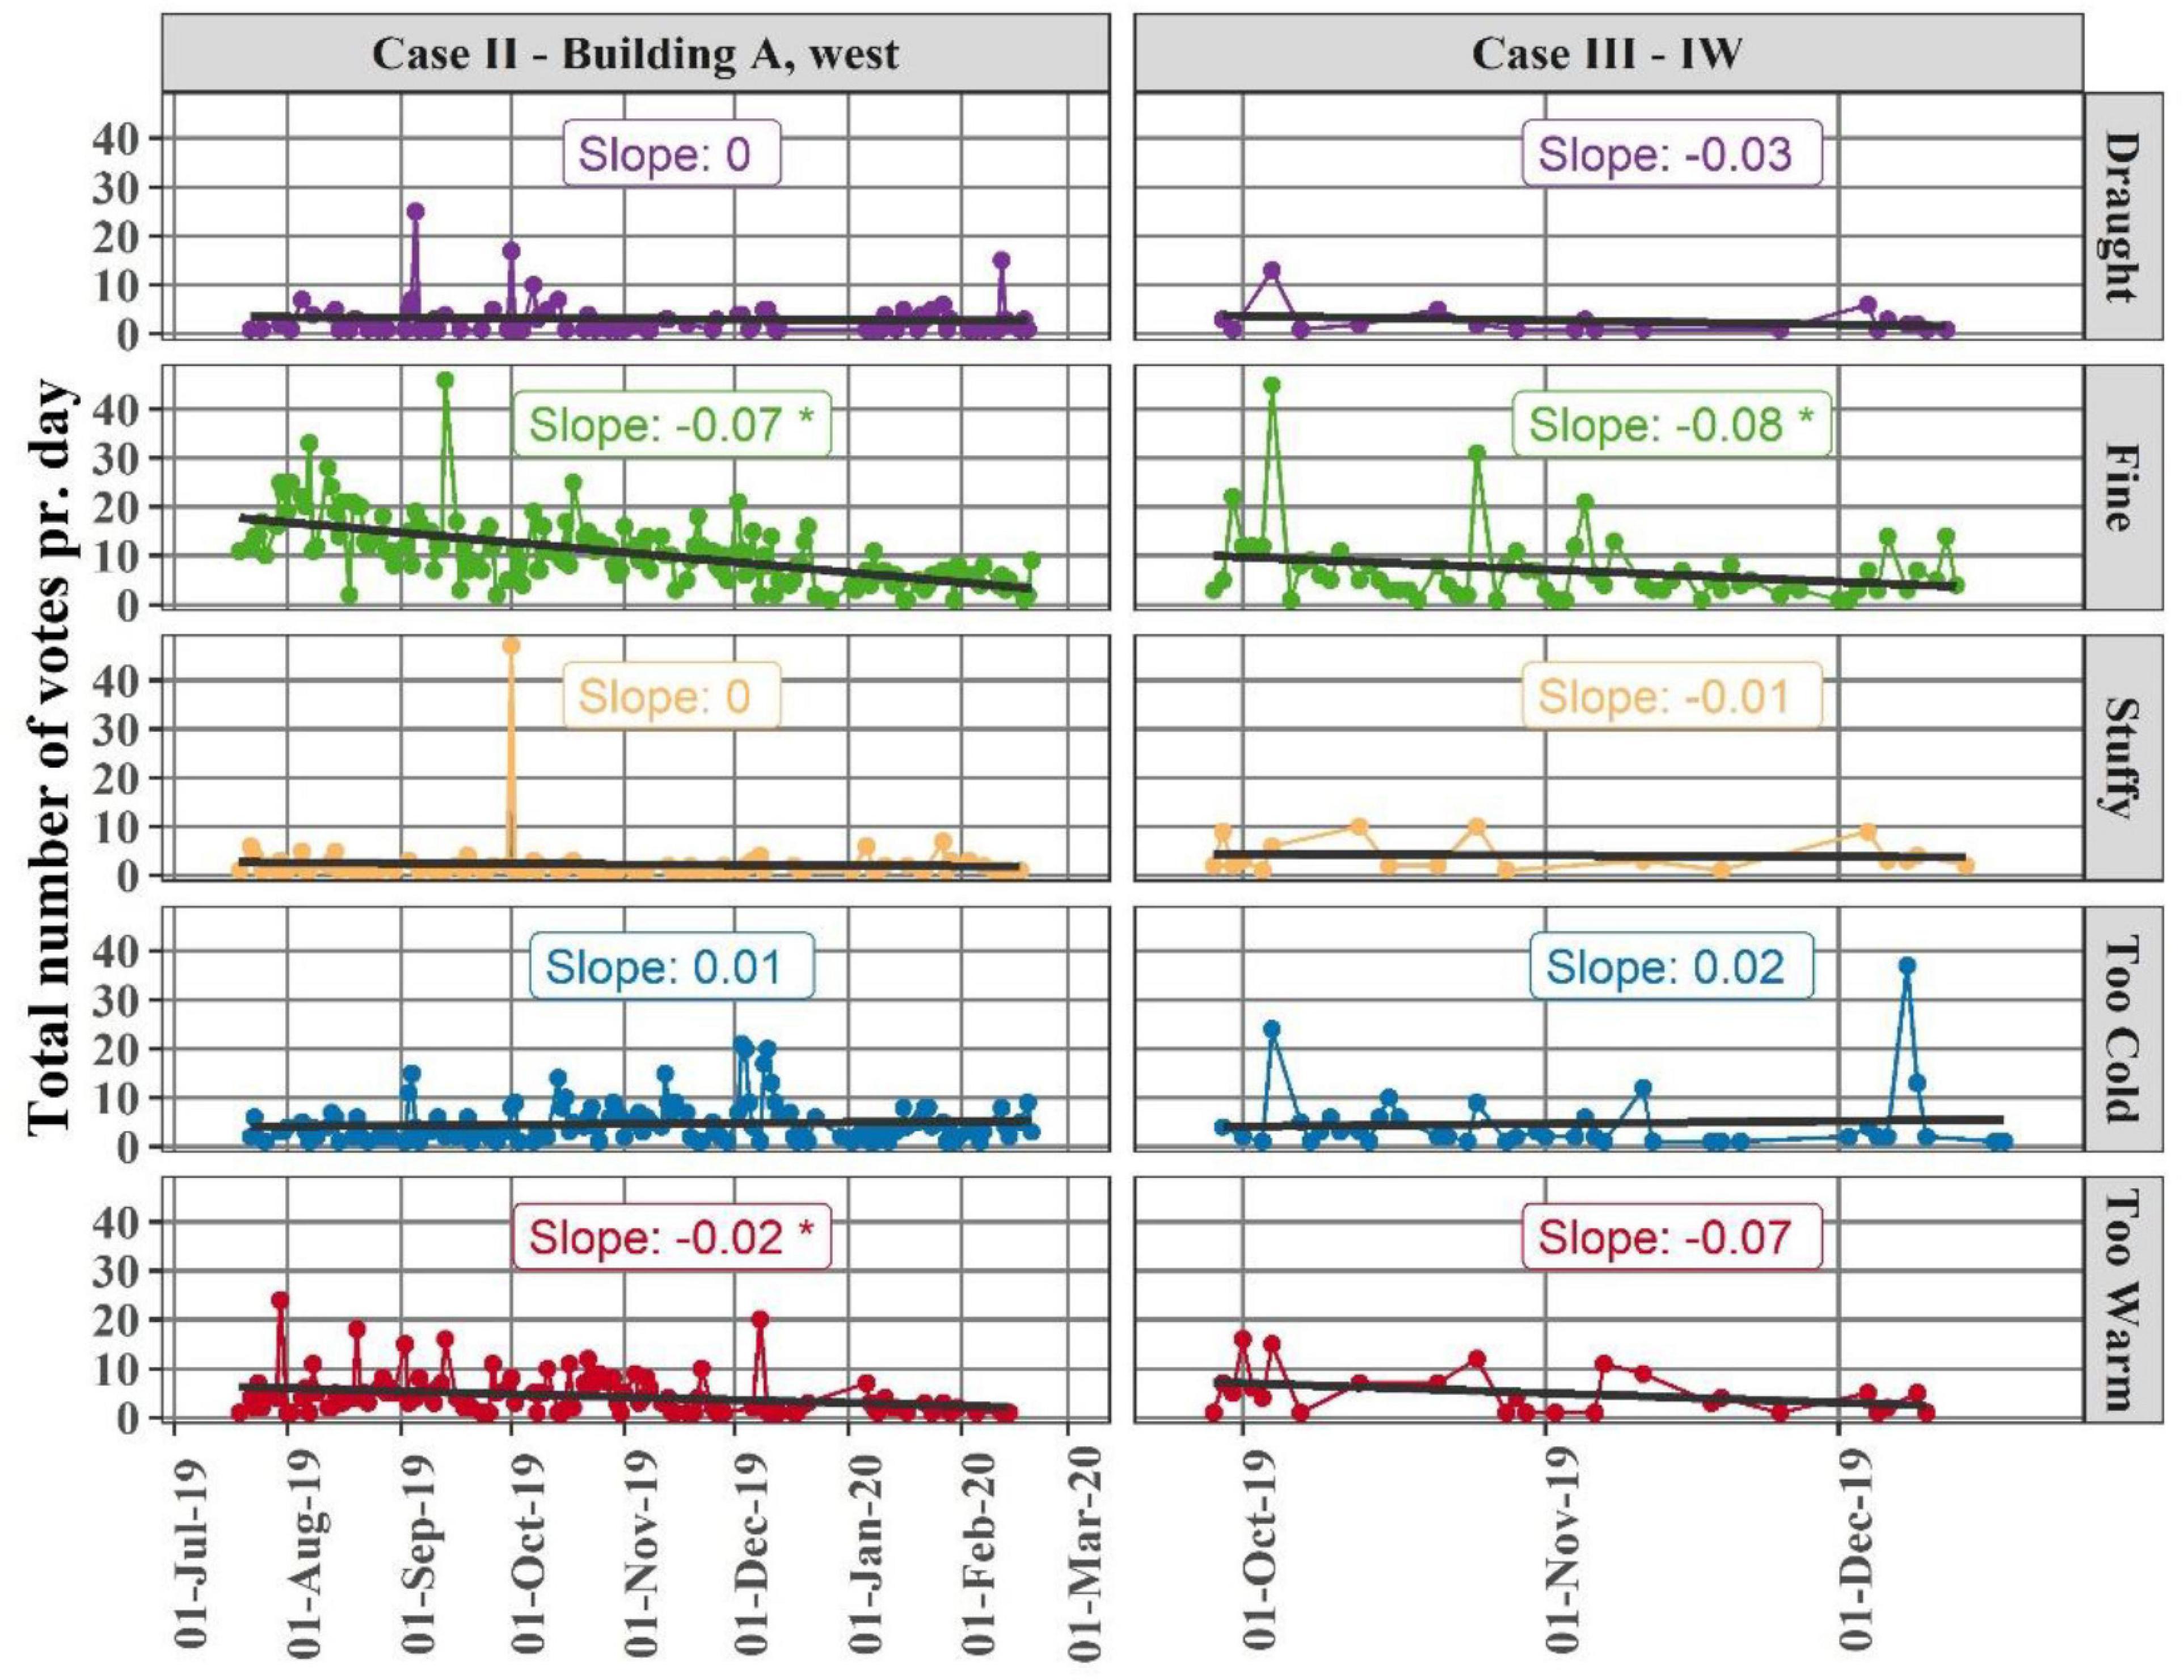
Figure 5. The total number of votes per day for case II and III for each vote type. The value and significance (denoted with * if p-value < 0.05) of the slope are displayed for the trend lines. The slope was characterised as the overall mean of the total number of votes per day.
The earliest and latest votes in case study II were received from 6:00 to 16:00 (relative frequency of up to 6%). Occupants voted overall consistently from 9:00 to 13:00 (relative frequency of each hour was about 10%) with slightly more votes cast at 11:00 (relative frequency of 15%) coinciding with lunch breaks. Votes were cast consistently from Monday to Friday (relative frequency of about 20%). In case study III, most votes were cast at 12:00 and 13:00 (relative frequency of up to 19%) also coinciding with lunch breaks. Furthermore, most votes were received on Fridays (relative frequency of 30%) and Mondays (relative frequency of 20%) in case study III. Votes were also cast on Sundays (relative frequency of about 10%). The earliest and latest votes in case study III were received from 8:00 and 19:00 (relative frequency of about 3%).
The relative frequency distribution of the common logarithm of the timespan between two votes for each study had two distinct peaks (Figure 6). One about 1 s and a second about 26 min to 1 h. The votes cast less than 1 s apart were, as previously described (see section “Data processing and analysis”), considered as reiterated votes. Table 2 shows the characteristics and number of reiterated votes identified in each study. For example, in case study II there was an instance of 24 consecutive votes (Table 2) considered as “intentional” reiterated votes as they were votes cast on “Too Warm” and “Stuffy.” The instance of 26 reiterated votes in case study III (Table 2) was an example of “ill-willed” votes that were cast on all buttons.
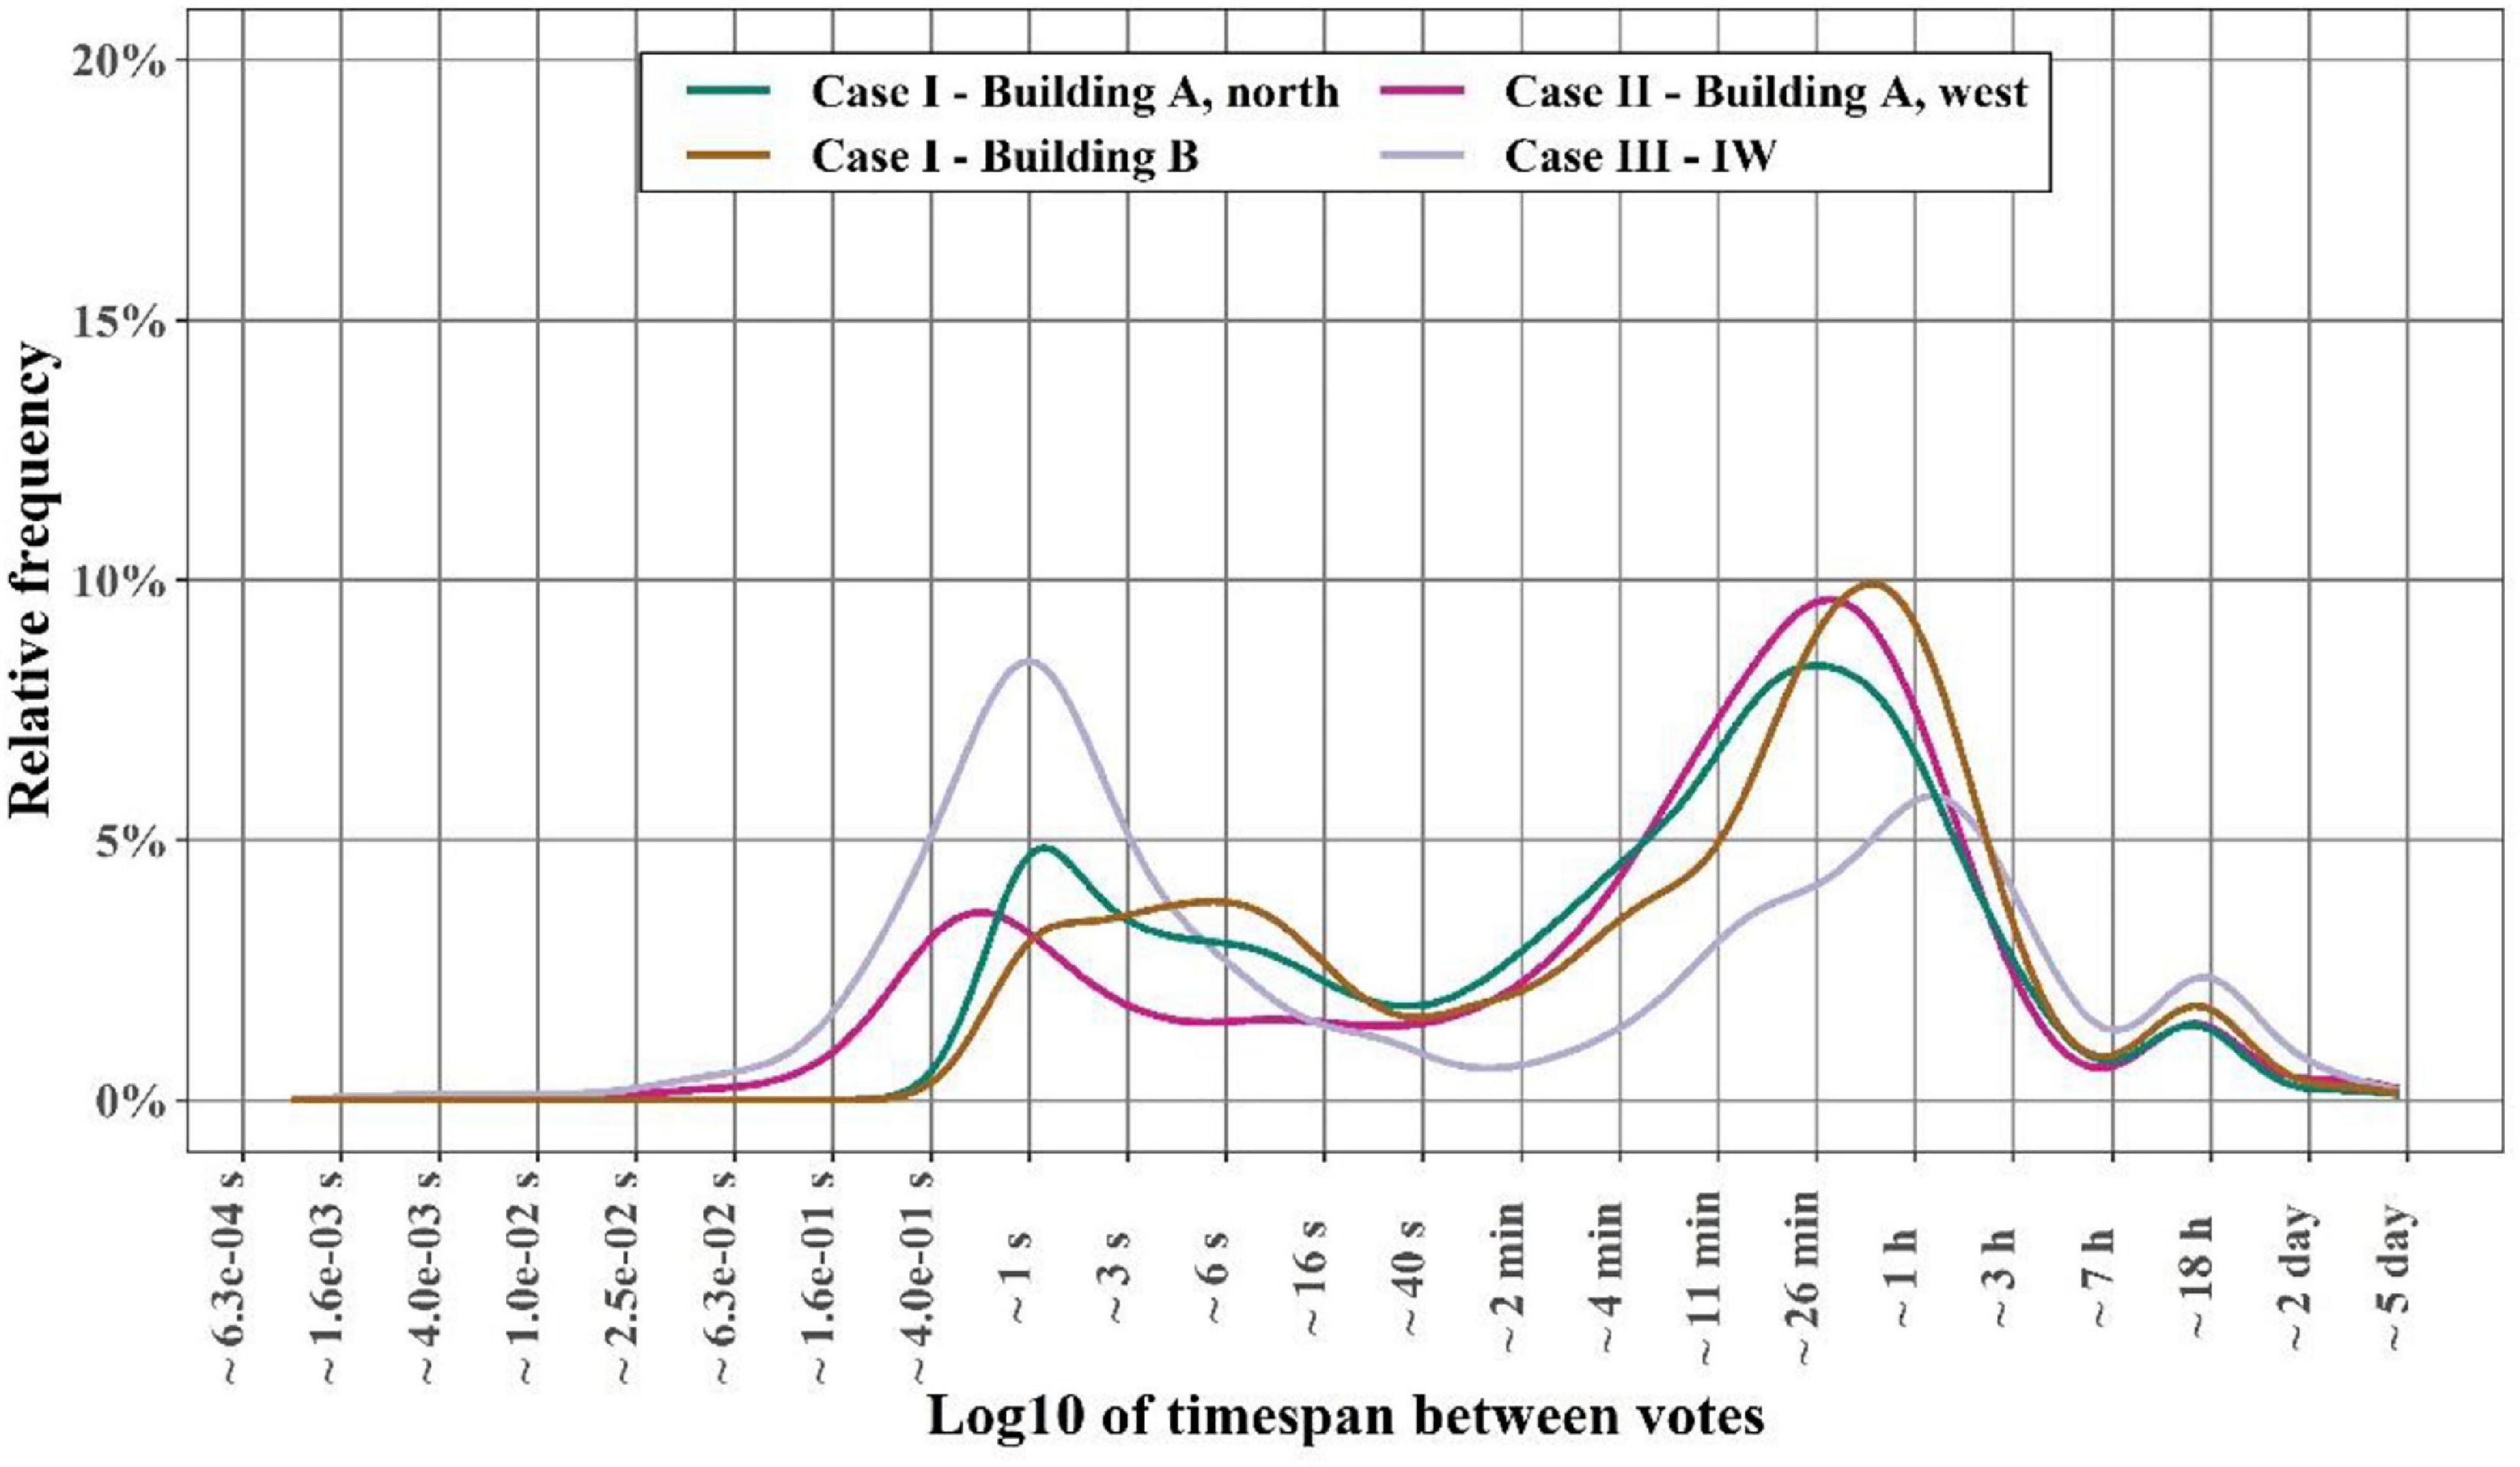
Figure 6. Relative frequency distribution of the common logarithm of the timespan between two votes for case I, II, and III. The bandwidth used for generating the plot was 0.20 s.
Questionnaires From Case Study II on Occupants’ Interaction With TiAQ and Their Motivation
Six questionnaires were submitted during case study II, including four monthly questionnaires with response rates from 27 to 35% and an initial and a final questionnaire with response rates of 47 and 28%, respectively. About 110 occupants received the questionnaires. Most respondents were within the age group of 40–50. 70% of the respondents were males at the beginning of the study. This dropped to about 50% at the end of the study. A consistent number of about 10 females completed all questionnaires. Information about questionnaires used in case study II is provided as Supplementary Material.
Figure 7 summarises the responses to the question, “In the last 30 days, how often did you use TiAQ at your office?” collected for each monthly and final questionnaire. Note that the questionnaires were retrospective, and they are denoted in Figure 7 by the period they meant to represent and not the time of the survey. At the beginning of the study, 25% of the occupants voted daily, while about 40% voted weekly. Occupants who voted daily dropped to about 6% at the end of the study, while more occupants started to vote weekly (Figure 7). The percentage of occupants who did not use the system was oscillating around 10% during the whole study.
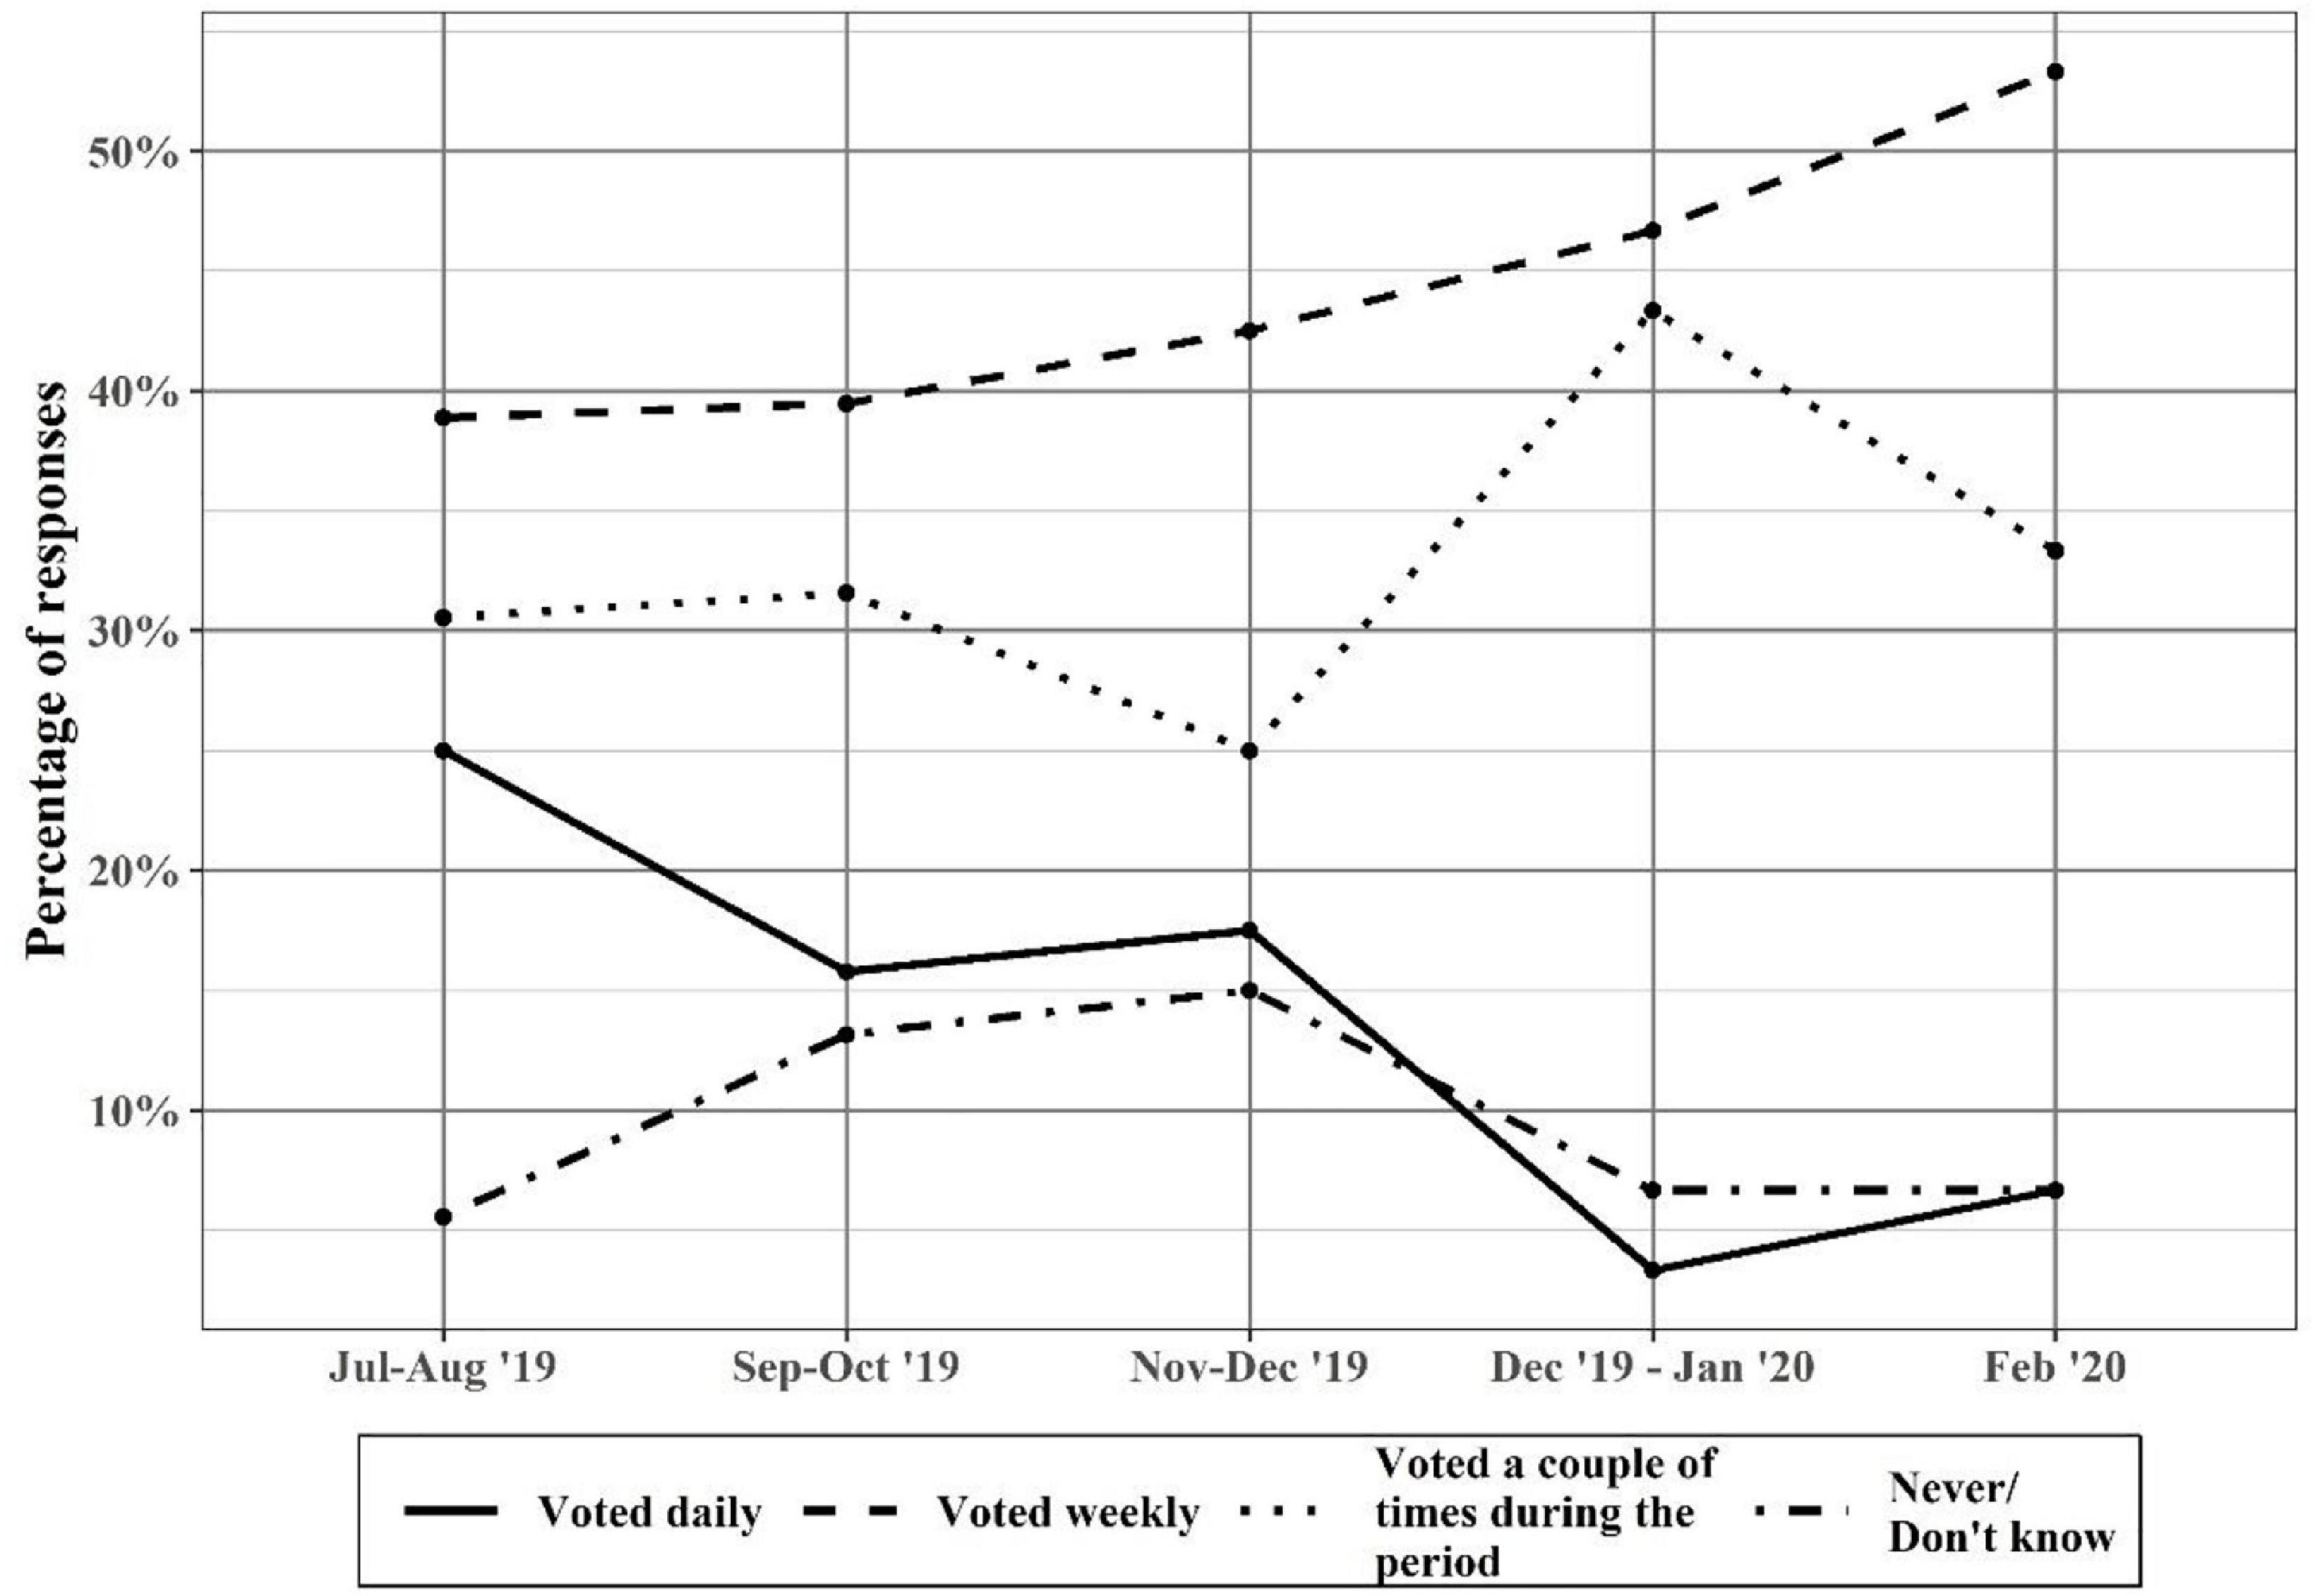
Figure 7. Percentage of responses for the monthly and final questionnaires in case II related to the question “In the last 30 days, how often did you use TiAQ at your office?”.
The responses from the monthly and final questionnaires about whether occupants agreed or disagreed with statements regarding their motivation for using TiAQ are presented in Figure 8. Occupants mostly agreed that passing by and seeing or noticing TiAQ, while conducting their everyday work routines, as well as being dissatisfied or noticing a change with the indoor environment were reasons for using TiAQ (Figure 8).
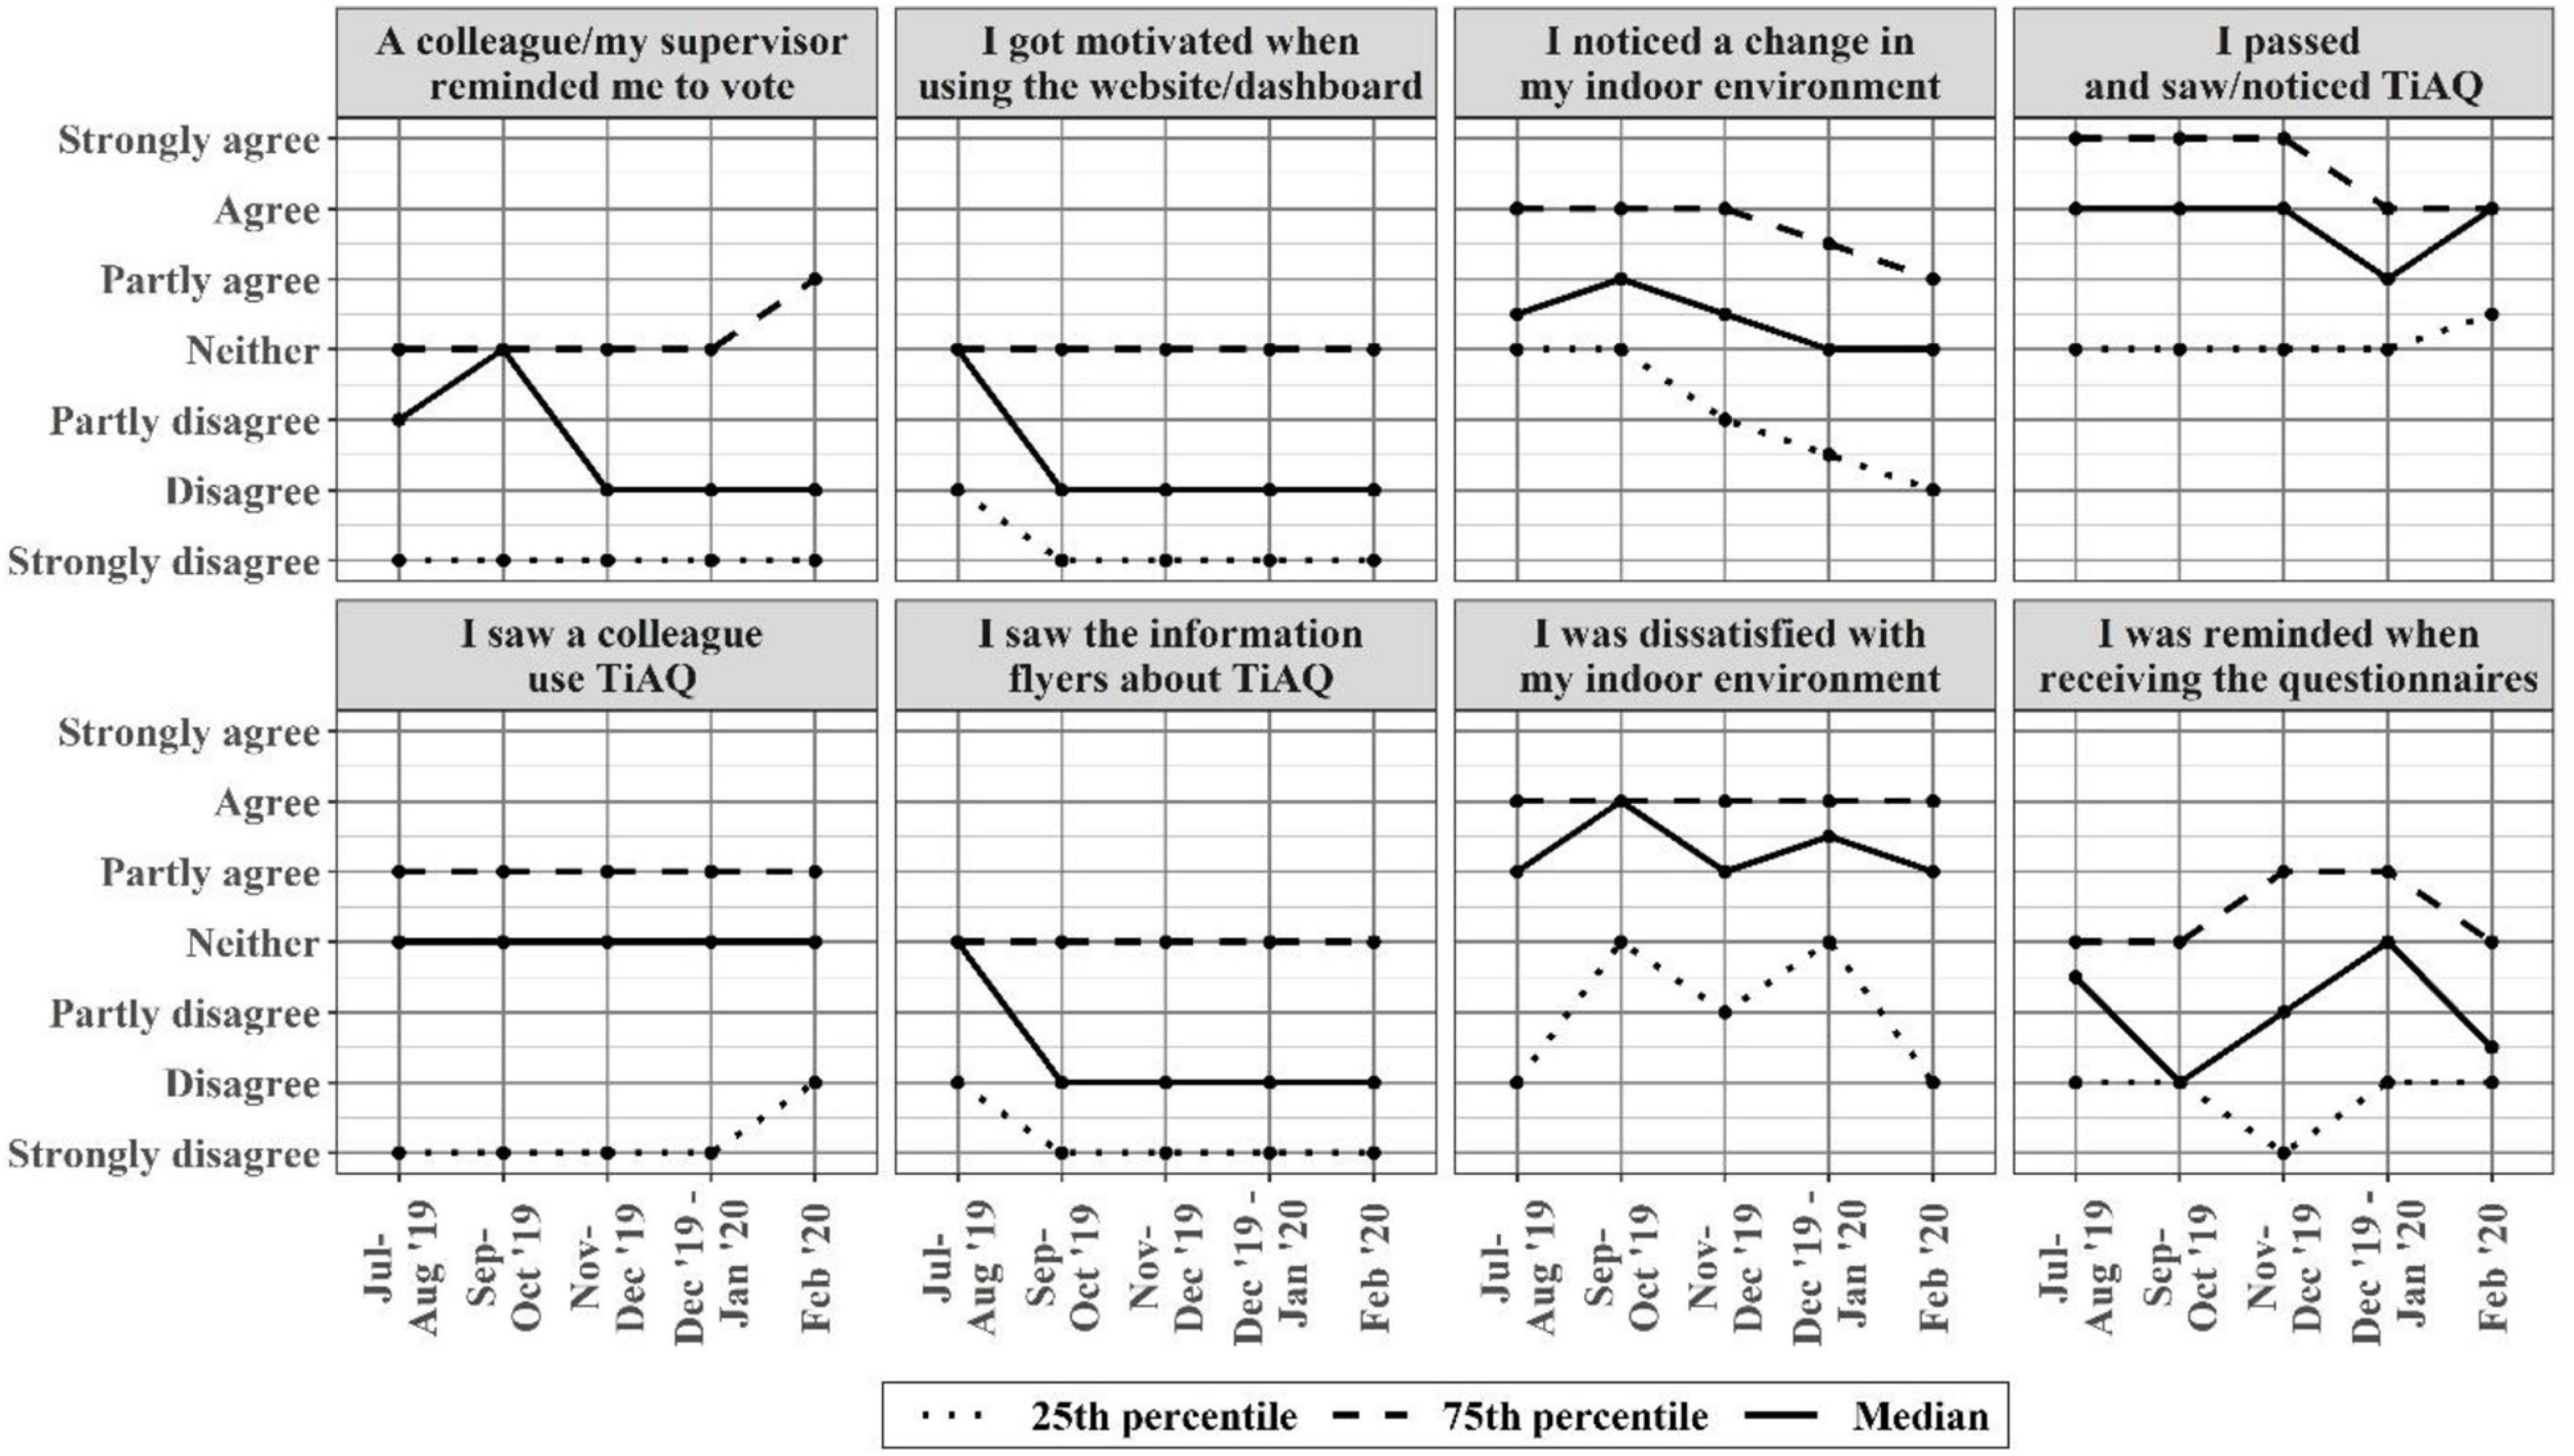
Figure 8. Median, 25th and 75th percentile score for each monthly questionnaire in case II related to how much respondents agreed or disagreed with following statements regarding their motivation for voting with TiAQ.
In the initial questionnaire, occupants in case study II were asked an open-ended question about what they expected to happen when they used TiAQ. Forty respondents answered the open-ended question. Fifteen of them expected the votes to be used to provide insight into the indoor environment and occupants’ satisfaction at their office space. Ten respondents expected the votes to be used for controlling or optimising HVAC control as well as for retrofitting building components.
In the final questionnaire, respondents were asked about their opinion and use of TiAQ. 90% of the respondents answered “yes, definitely” or “yes, maybe” to use TiAQ if it became a permanent device in the building. Only one answered “no” and commented that he/she would prefer to directly contact the building operation manager instead of using TiAQ if there was a problem. About 90% of the respondents stated to be satisfied with the use, design and accessibility of TiAQ. Furthermore, respondents were asked to comment on what, in their opinion, was missing about TiAQ or could be improved. Seven respondents requested more panels to be located in the space or that votes could be cast using the phone or computer. Eighteen respondents requested some kind of “feedback on feedback”: Six respondents requested that the votes from TiAQ were applied to make noticeable improvements to the indoor environment. Nine respondents requested the votes to be presented on a dashboard or that information was provided about how the building operation manager used the votes Three respondents requested frequent reminders, e.g., pop-up messages on the computer screen, or better signage at the office for reminding them to vote.
IEQ Questionnaires From Case Study I and II
IEQ Questionnaires From Case Study I
Figures 9, 10 summarise responses from the questionnaires about IEQ for the last week of Exp. I and II in building A and B in case study I. The response rates of the questionnaires were between 22 and 41%.
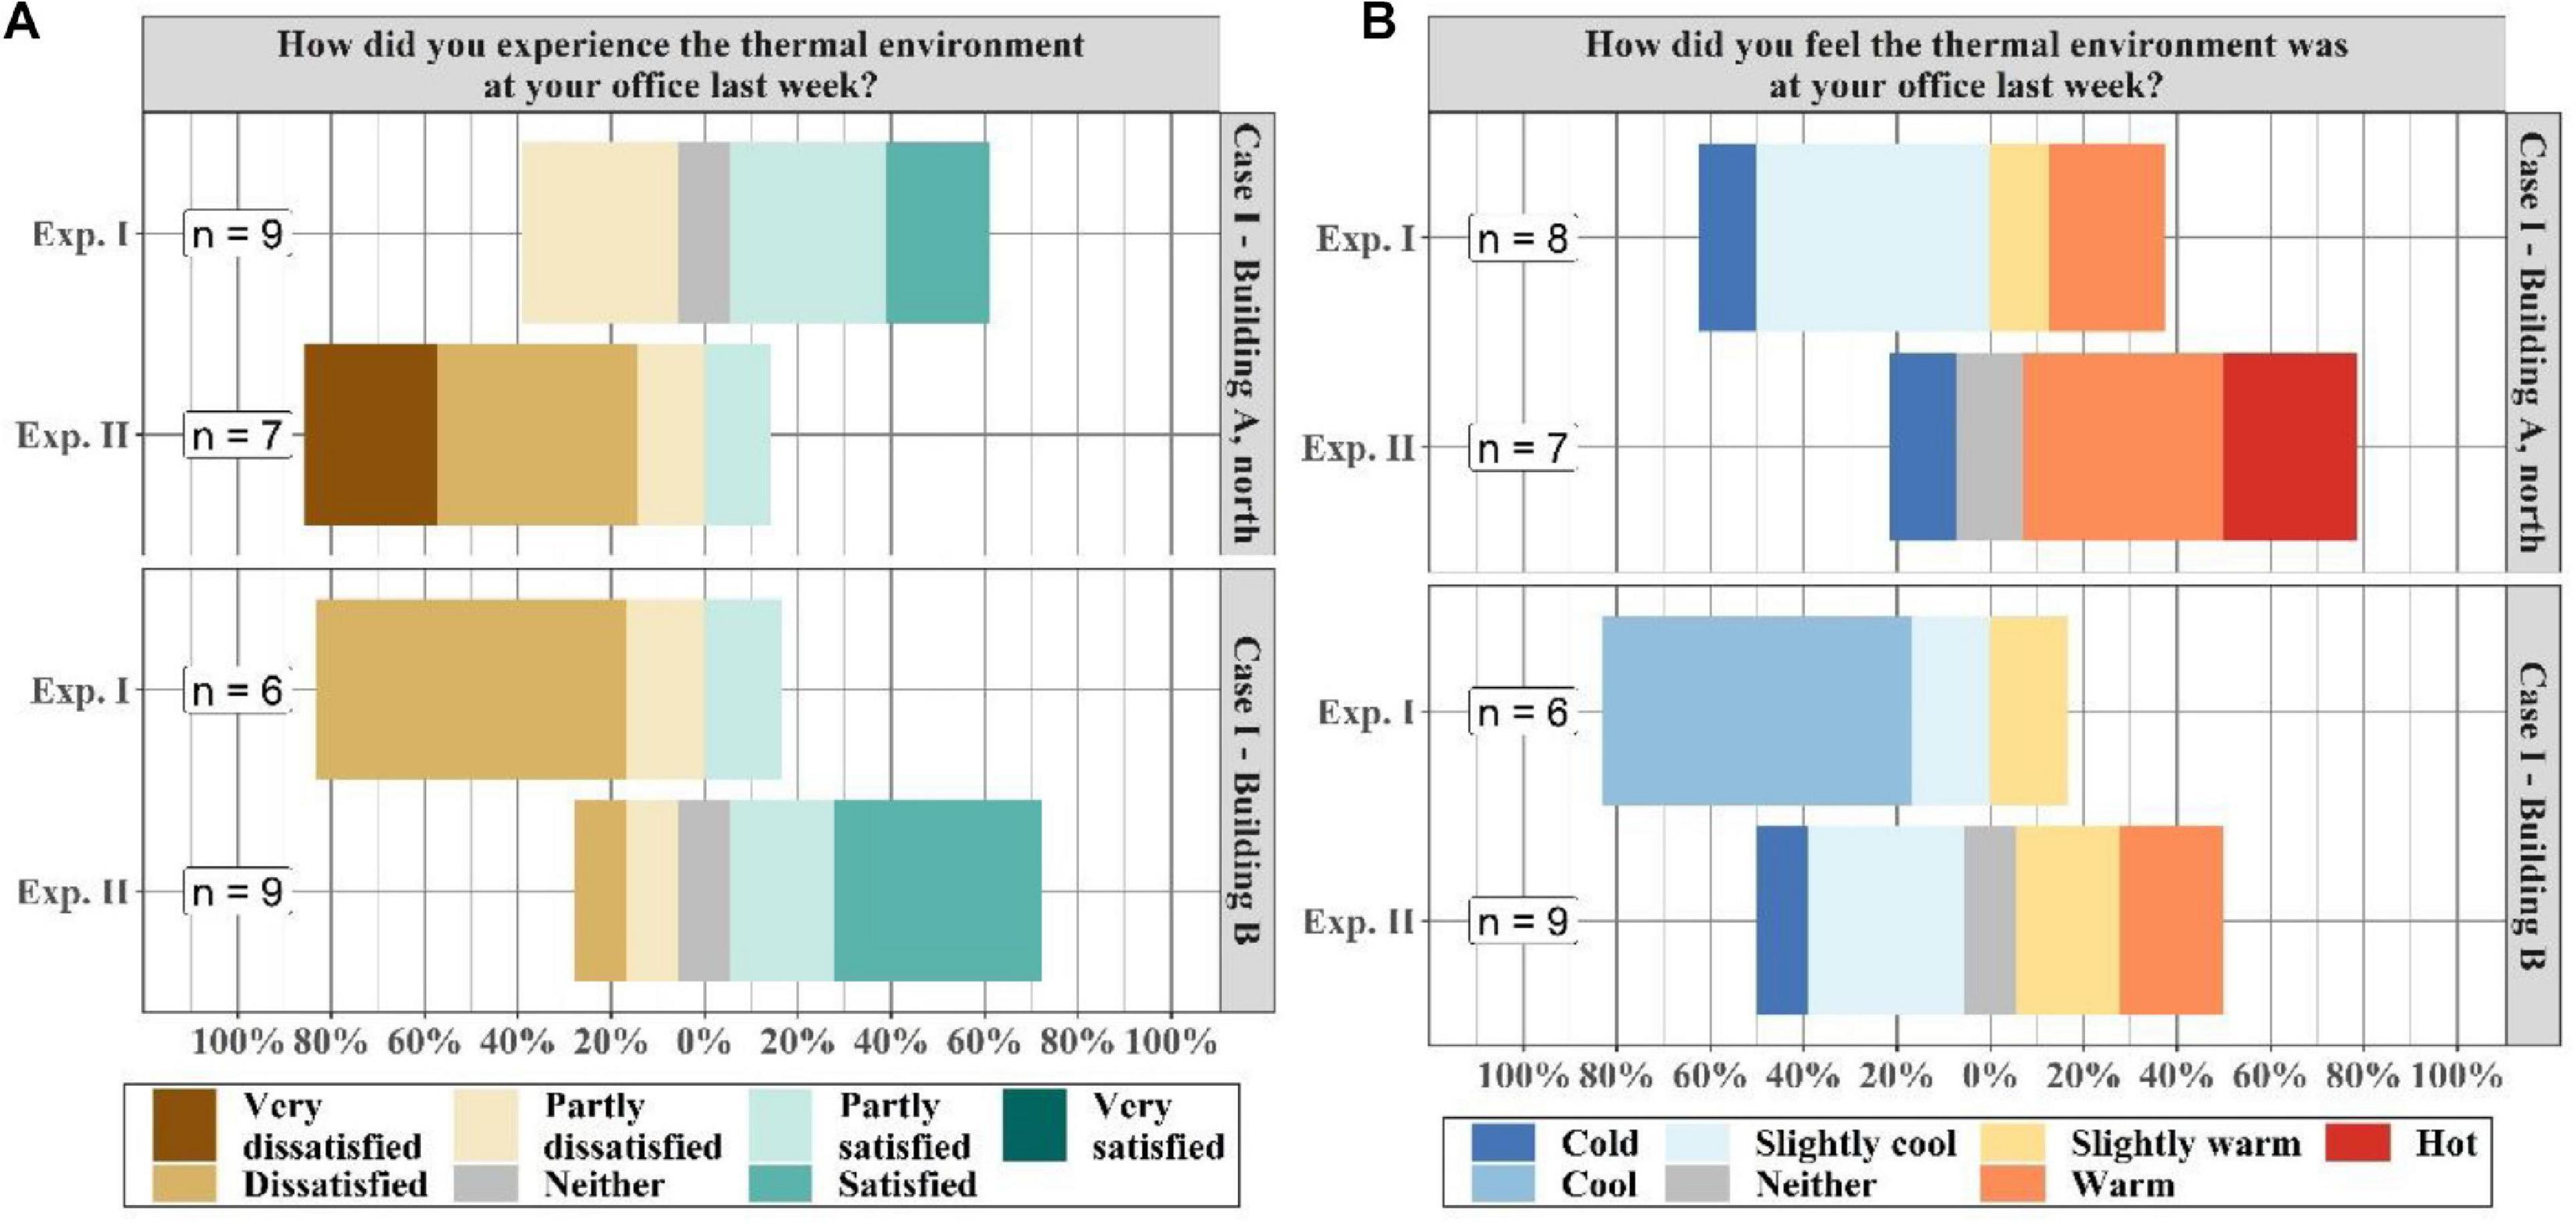
Figure 9. Divergent bar plots of responses for the last week in Exp. I and II in case I. (A) Satisfaction with the thermal environment. (B) Thermal sensation.
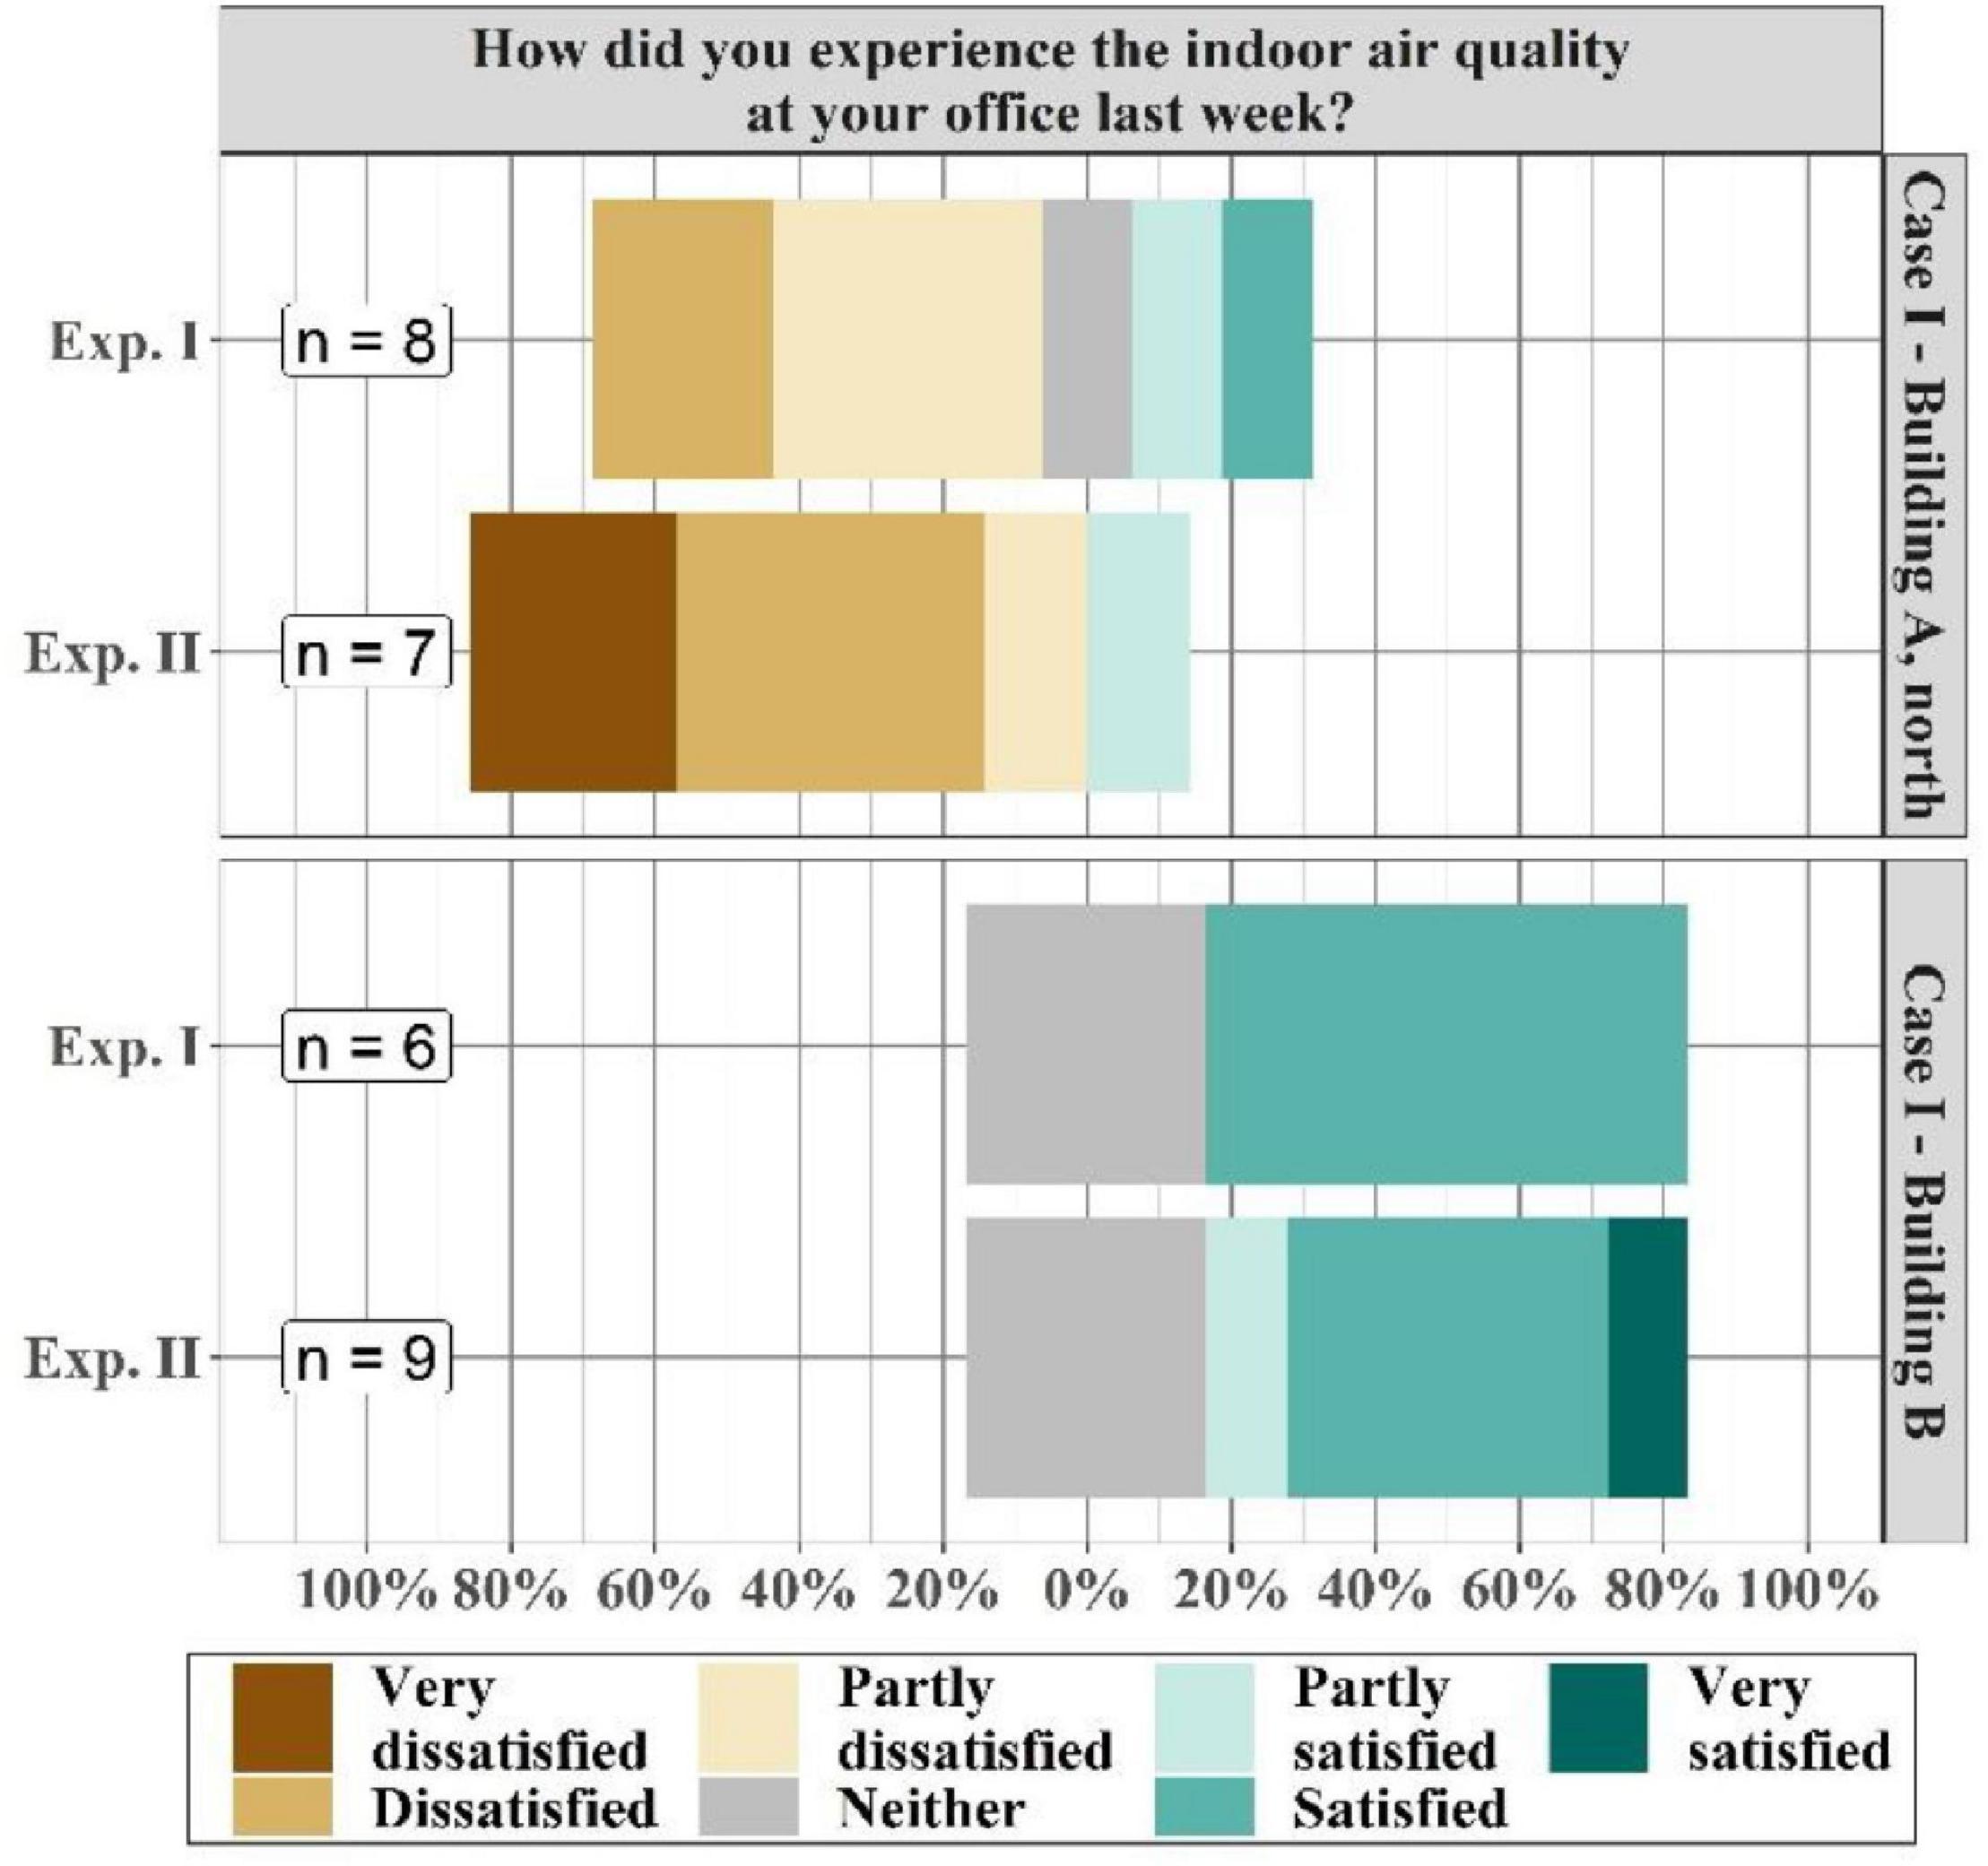
Figure 10. Divergent bar plots of responses for the last week in Exp. I and II in case I regarding satisfaction with IAQ.
Respondents from building A stated that they experienced draught for the last week of Exp. I (ratio of 5/9) and for Exp. II (ratio of 1/6). In building B, few respondents experienced draught for the last week of Exp. I (ratio of 2/6) and Exp. II (ratio of 2/9).
Respondents that were at least “partly dissatisfied” with IAQ in building A (Figure 10) during the last week stated that it was mostly due to bad odours (ratio of 5/6) and dry air (ratio of 3/5) for Exp. I, and dry air (ratio of 6/6) and bad odours (ratio of 4/5) for Exp. II. No respondents were dissatisfied with IAQ in building B (Figure 10).
Figure 11 summarises the measured IEQ parameters as well as the daily percentage of thermal votes (“Too Cold,” “Too Warm,” and “Fine”) from TiAQ for each week in case study I. Overall, the interventions led to a noticeable change in measured indoor temperature (Figure 11A) and changes related to votes on “Too Cold” or “Too Warm” (Figure 11B) and to responses from the questionnaires (Figure 9).
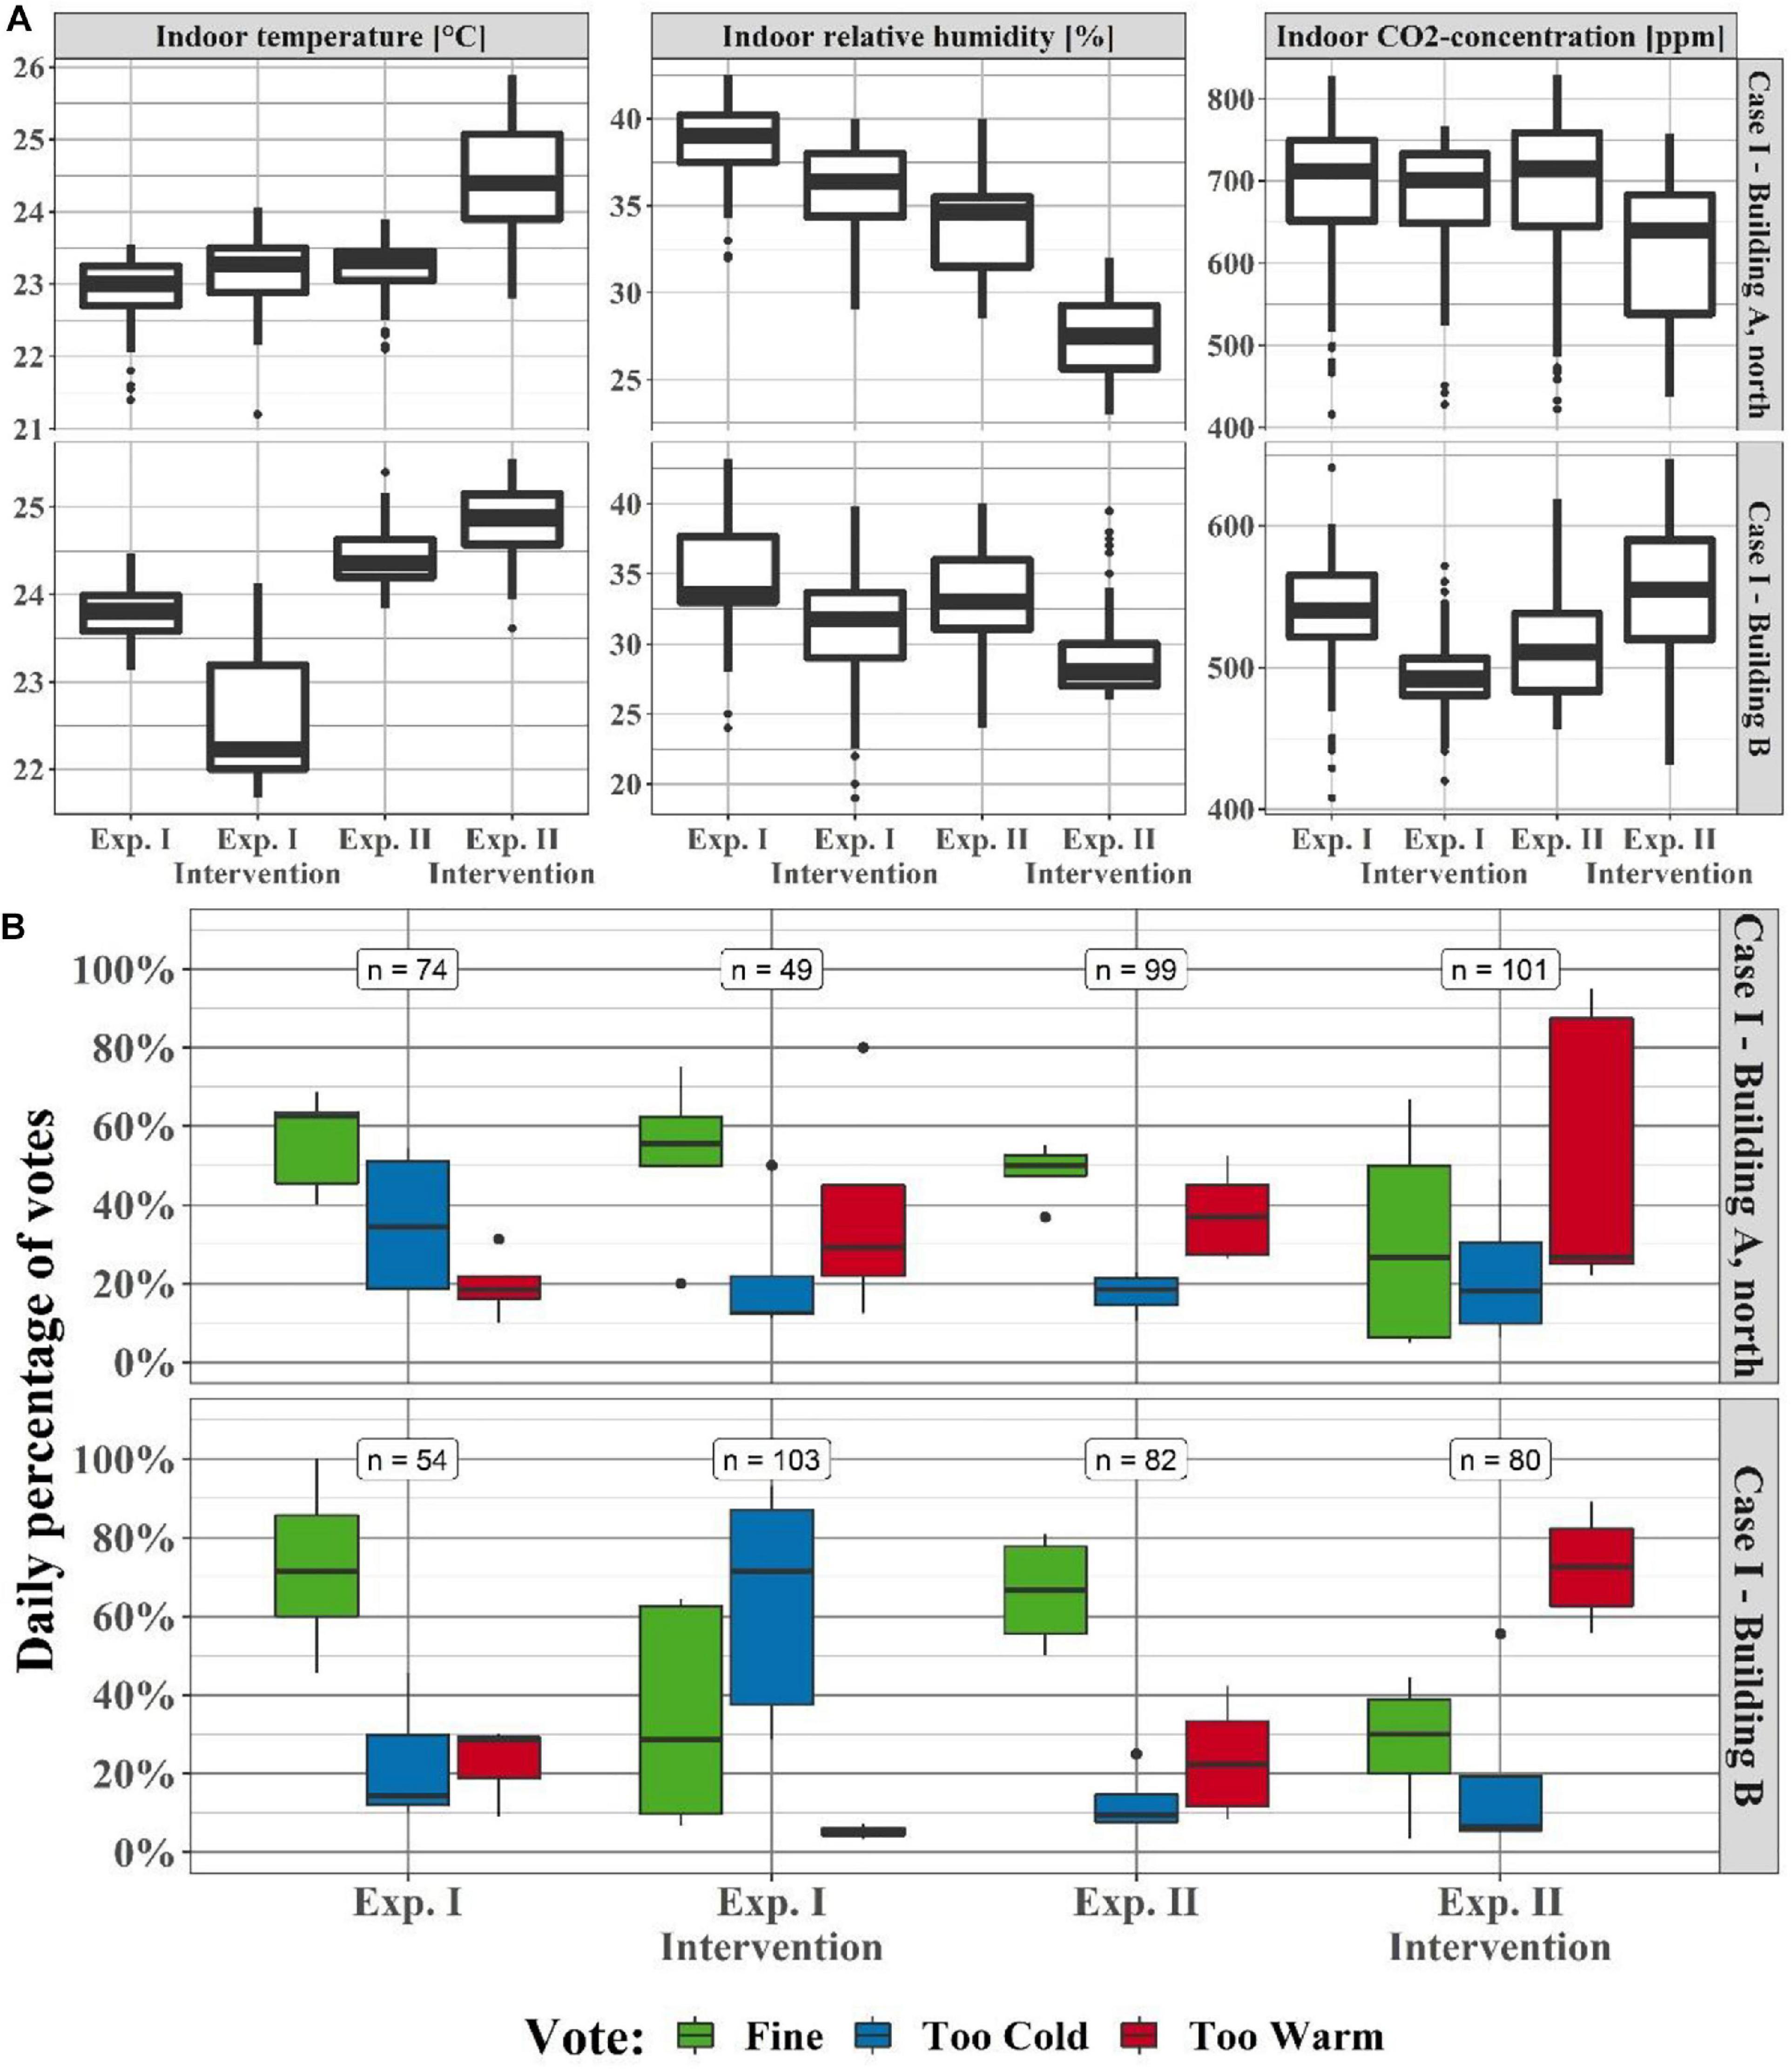
Figure 11. Case I. (A) Boxplot of indoor temperature, relative humidity and CO2-concentration during occupied hours. (B) Daily percentage of votes cast with TiAQ. “Ill-willed” votes were removed.
For building A, the votes cast on “Draught” (Exp I: n = 4, Exp. II: n = 5) and “Stuffy” (Exp I: n = 14, Exp. II: n = 20) with TiAQ in the intervention weeks accounted for less than 21% of the total number of votes (Exp I: n = 67, Exp. II: 126, without “ill-willed” votes). For building B, “Draught” (Exp I: n = 10, Exp. II: n = 3) and “Stuffy” (Exp I: n = 1, Exp. II: n = 14) accounted for less than 14% of the total number of votes in the intervention weeks (Exp I: n = 114, Exp. II: 97, without “ill-willed” votes).
IEQ Questionnaires From Case Study II
According to the initial and final questionnaires in case study II, about 85 and 95% of the respondents were generally satisfied with the thermal environment and IAQ, respectively.
The 5% of the respondents dissatisfied with IAQ stated that they often experienced stuffy (Ratio of 3/4) and dry air (Ratio of 2/4), e.g., primarily during mornings or in meeting rooms. According to the initial questionnaire, 20% of the respondents often experienced draught (Ratio of 11/54), whereas 37% reported having experienced draught according to the final questionnaire (Ratio of 11/30). Respondents reported that they experienced draught inter alia when sitting near the façade.
During case study II, the overall median daily percentage of votes on “Fine” from TiAQ was about 60% (Figure 12B). The indoor temperature was declining over time (Figure 12A), which explains the increase in the daily percentage of votes on “Too Cold” (Figure 12B). The CO2-concentration was generally between 400 and 500 ppm and never exceeded 1000 ppm during the study period.
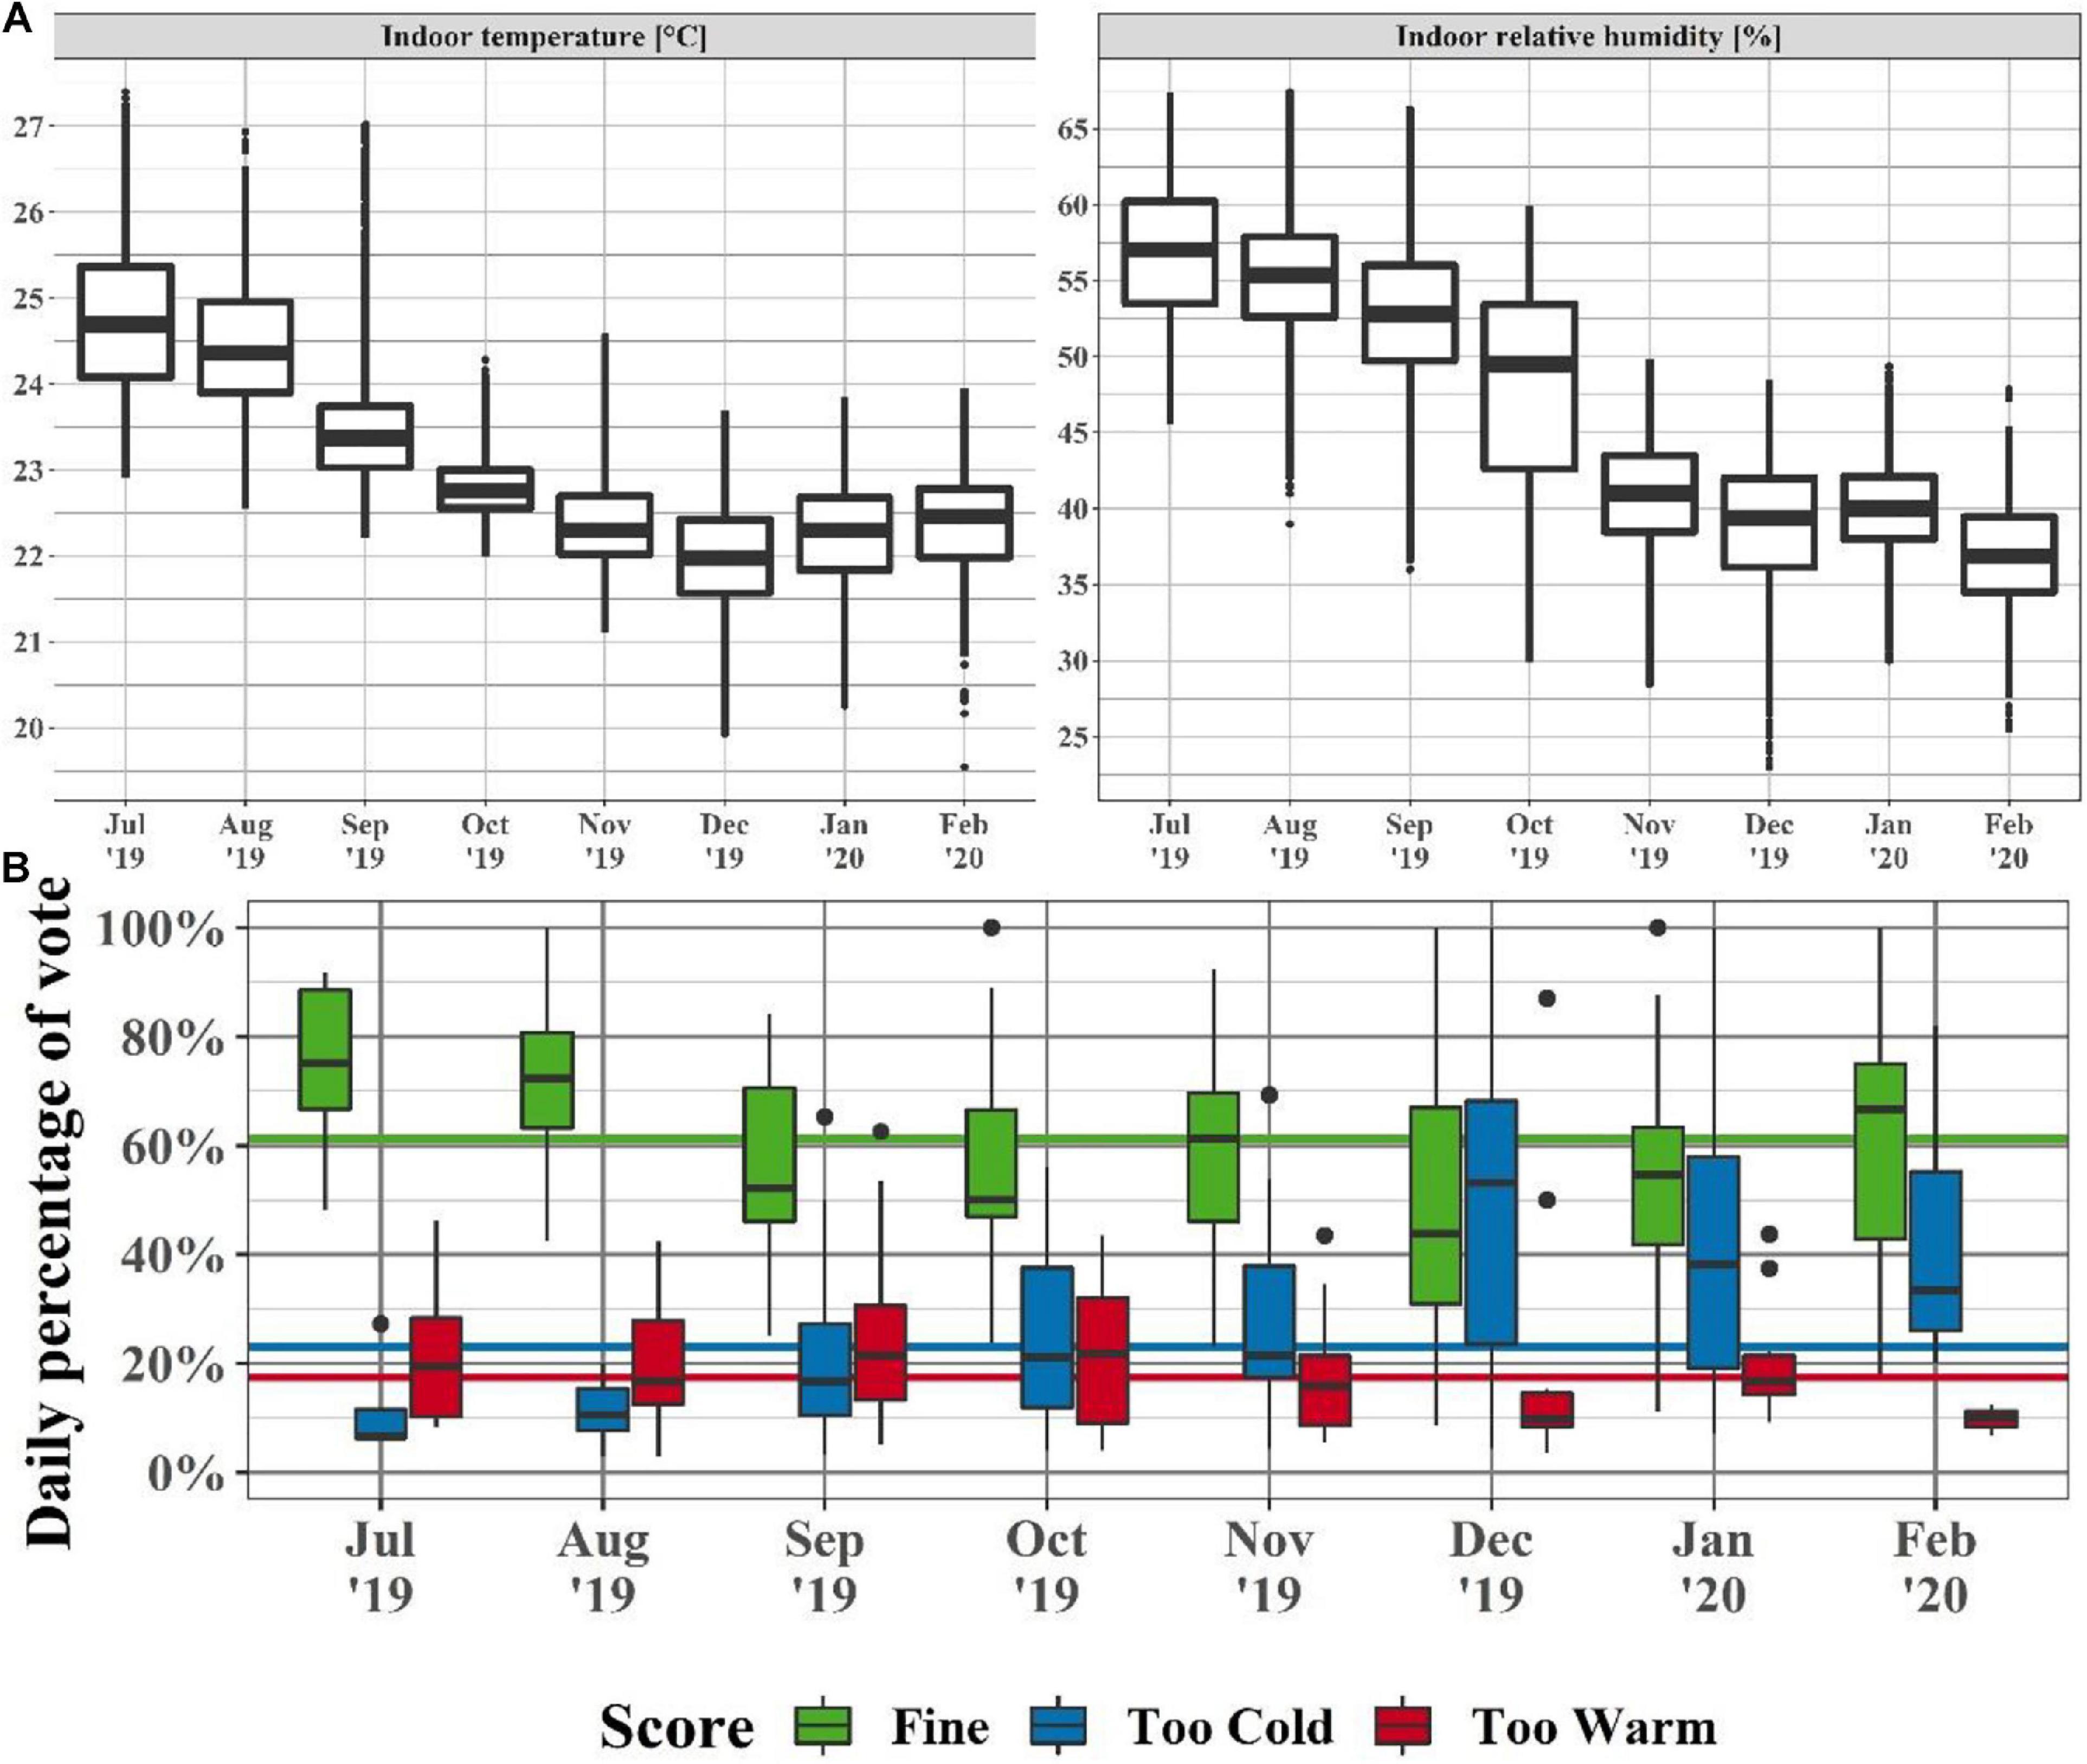
Figure 12. Case II. (A) Boxplot of indoor temperature and relative humidity during occupied hours. (B) Daily percentage of votes cast with TiAQ. Horizontal lines show the overall median of each vote type. “Ill-willed” votes were removed.
The votes on “Draught” (n = 264) and “Stuffy” (n = 195) accounted for less than 8% of the total number of votes (n = 3177, without “ill-willed” votes) and less than 17% of the total number of votes cast on “Fine” (n = 1591). An average of 25% of the respondents of the monthly questionnaires stated “Yes” for having voted on “Stuffy” during the last thirty days. Furthermore, the respondents were asked to state which symptoms they agreed/disagreed with that could describe their reason for voting on “Stuffy.” Dust in the air (Ratio of 1/26) was the least likely reason for voting on “Stuffy,” and humid air (Ratio of 8/26), bad odours (Ratio of 9/26) and dry air (Ratio of 6/26) were slightly agreed upon being the reason for voting.
Discussion
Occupants’ Interaction With TiAQ and Their Motivation
Occupants’ Interaction With TiAQ Over Time and the “Novelty Effect”
The objective of the present study was to investigate occupants’ interaction with TiAQ and their motivation. Occupants generally voted consistently throughout a day (10% for each hour) and week (20% for each weekday) during the long-term study. TiAQ was used to cast between 13 and 24 votes per day (Table 2). Based on the expected number of occupants in the buildings, this corresponded to a voting frequency of 0.18–1.65 votes per day per occupant (Table 2), depending on the case study. Identifying who or how many occupants voted with the device was not possible due to the design and setup of TiAQ. This was, on the one hand, a benefit as anonymity was preserved. But on the other hand, a limitation of TiAQ because one cannot ensure whether the voting poll represented the majority of occupants. Nevertheless, the questionnaires in case study II suggested that 60% of the occupants answering the questionnaire had used TiAQ daily or weekly (Figure 7).
As previously described, the voting frequency or vote count can be interpreted as the level of interaction occupants have with an OVS. The voting frequency was generally higher for the short-term studies (case study I) than the long-term studies (case study II and III) (Table 2). This was also observed during previous research studies on OVS. For example, long-term studies lasting over 100 days (e.g., Balaji et al., 2013; Winkler et al., 2016; Pritoni et al., 2017) and short-term studies lasting less than 30 days (e.g., Konis and Annavaram, 2017; Li et al., 2017; Aguilera et al., 2019) had a voting frequency less than about 0.1 votes per day per occupant and more than three votes per day per occupant, respectively. This suggests that occupants can have a higher level of interaction in short-term studies than the long-term studies. The number of votes on “Fine” was also higher at the beginning of the long-term studies than at the end (Figure 5). Since the vote count on “Fine” made up more than 50% of the total vote count for the long-term studies, it indicated that occupants interacted more frequently with TiAQ at the beginning of the study and with a significant drop in interaction over time (Figure 5, Trend lines for “Fine” votes). The decline in vote counts related to “Fine” might reflect a decrease in occupants’ comfort levels over time. However, the results from the questionnaires (Figure 7) also confirmed that occupants voted less frequently with TiAQ over time; however, without completely stopping using TiAQ. The high level of interaction at the beginning of a study has also been reported in previous studies (e.g., Baker and Hoyt, 2016; Winkler et al., 2016). For example, with the courtesy of Berquist et al. (2019), votes cast on OVS panels located at an entrance to a gymnastic centre in Ontario were analysed by the main author using the same approach as presented in the present paper. Figure 13A shows that the total vote count from Berquist et al. (2019) had a similar significant decline as the vote counts in case study II and III. The high interaction at the beginning of a study has also been observed in research studies on interactive displays (e.g., Huang et al., 2006; Hazlewood et al., 2011; Gallacher et al., 2015). This so-called “novelty effect” is described by Koch et al. (2018) in context of human–computer-interaction (HCI) research as: “An increased motivation of using something, or an increase in the perceived usability of something, on account of its newness.” In the present study, the “novelty effect,” depicted by the trend lines in Figure 5, was more prevalent for “Fine” votes. This was likely because “Fine” votes made up the majority of the voting poll, because occupants were generally satisfied with the indoor environment in case study II. Occupants voted mostly sporadic for the remaining votes throughout the entire study period. This is especially clear for “Draught” and “Stuffy” in case study II as they had non-significant trend lines (Figure 5). In contrary, a minor increase was observed for “Too Cold” votes (Figure 5), indicating that occupants’ level of interaction slightly increased due to their experience of colder thermal environment. This was likely induced by the noticeable decrease in indoor temperature in the case studies (e.g., Figure 12A for case study II). An increase of interaction after the “novelty effect” has also been observed in previous research (e.g., Erickson and Cerpa, 2012; Winkler et al., 2016). For example, Winkler et al. (2016) reported an increase in vote counts due to intermittent disconnection of the HVAC system leading to uncomfortable indoor conditions. For TiAQ to represent occupants’ comfort and discomfort with the indoor environment, occupants were required to continuously report on their state of comfort as well as when they had complaints (Sheikh Khan et al., 2020). As noticing a change or being uncomfortable with the indoor environment were reasons for occupants to vote with TiAQ (Figure 8), occupants experiencing comfort might not necessarily be as motivated to vote as occupants feeling discomfort (Lassen et al., 2020). The “novelty effect” might have been a good “motivator” for occupants to vote frequently, inter alia on “Fine,” and could be a good strategy to induce high vote counts to get reliable results (Wang et al., 2018) in the short-term studies. However, it was not possible to sustain this effect over time. Furthermore, it would be more realistic to motivate occupants to vote consistently over time rather than frequently. Therefore, occupants need to be motivated for voting by other means, which will be discussed in the following sections.
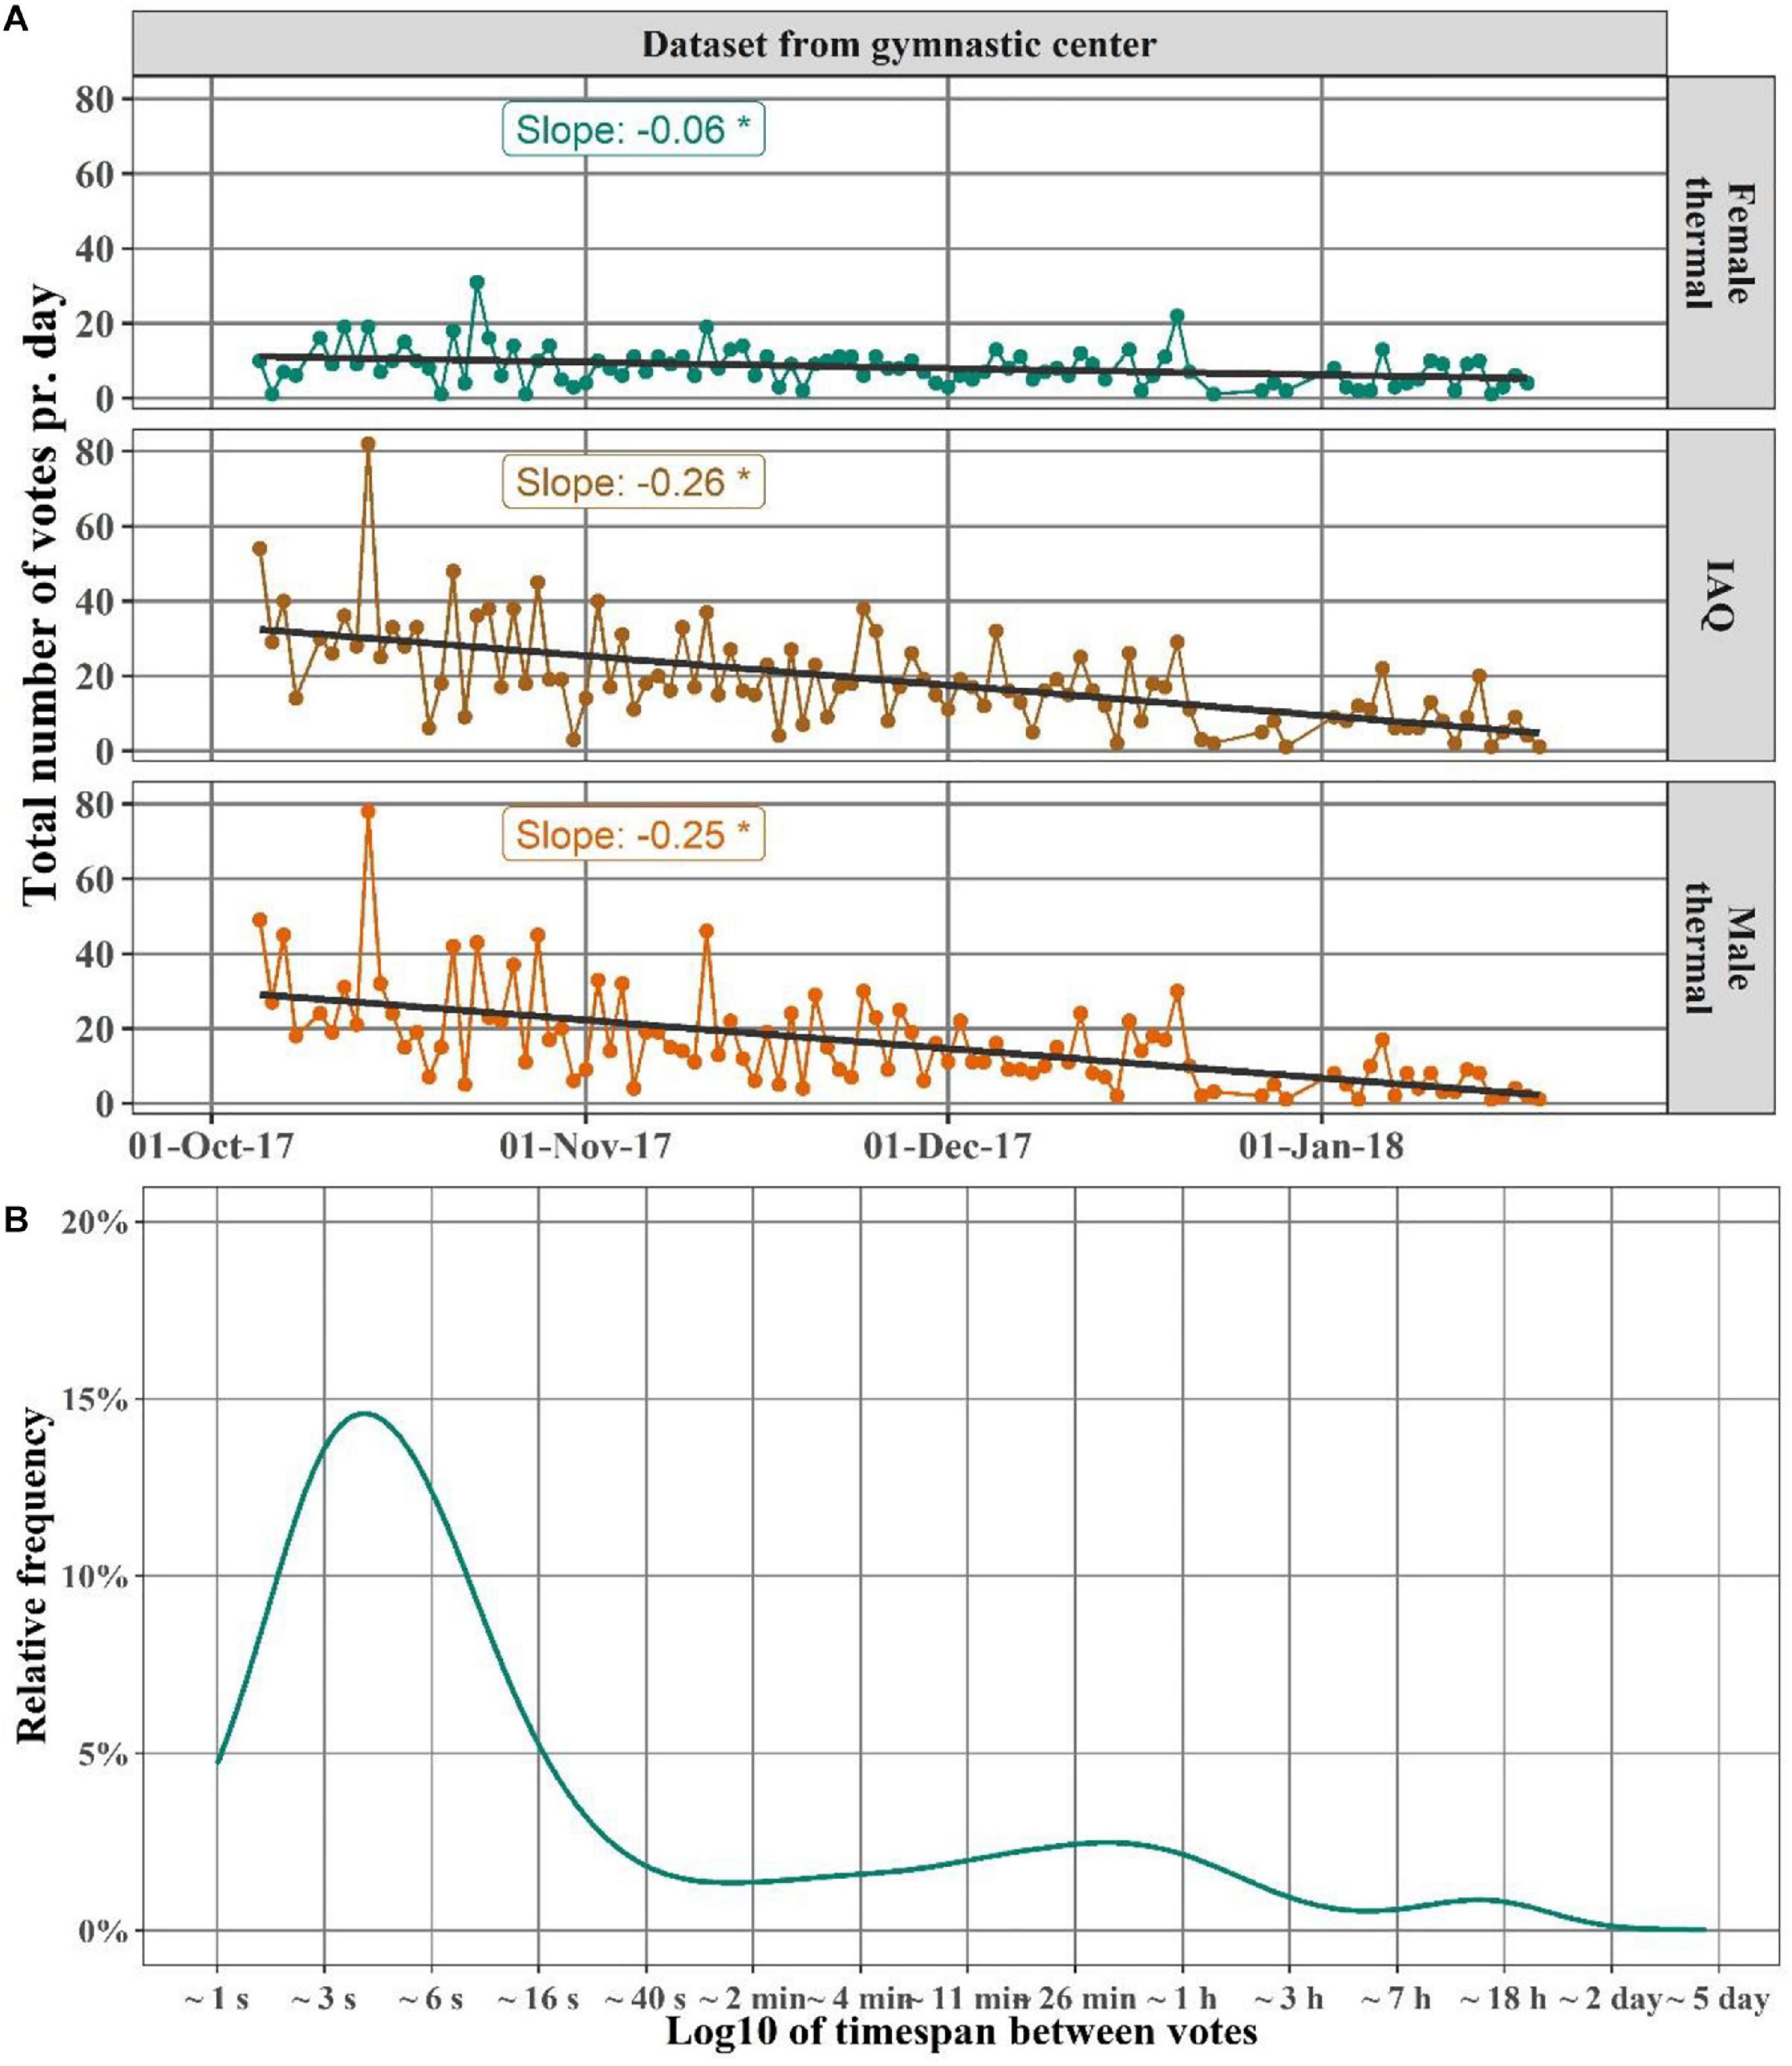
Figure 13. The dataset from Berquist et al. (2019) of votes from three panels located at an entrance to a gymnastic centre in Ontario. (A) The total number of votes per day. The value and significance (denoted with * if p-value < 0.05) of the slope are displayed for the trend lines. (B) Relative frequency of the common logarithm of timespan between two votes. The density plot had a bandwidth of 0.2 s.
Impact of Expectation on Occupants’ Interaction With TiAQ
Occupants’ interaction with TiAQ needs to be understood in the context of occupants’ expectations, social factors and the design of TiAQ (Venkatesh et al., 2003; Sheikh Khan et al., 2020). Occupants expressed at the beginning of the study that they expected the votes from TiAQ to be used to improve or provide insight into the indoor environment and occupant comfort. However, besides the dashboard (Figure 1B), it was never the intention of the present study to present continuous reports on occupant comfort or to either control or optimise existing HVAC. Furthermore, after the study had been conducted, occupants commented that they lacked a noticeable change in the indoor environment or a confirmation that their votes would be used. Contrarily to the authors’ initial assumption, the web dashboard accessed via QR codes on the information flyers did not motivate occupants to use TiAQ (Figure 8). Instead, few occupants requested a physical dashboard placed next to the TiAQ panel. One can speculate whether the lack of fulfilment of expectation was also likely the cause of the decline in vote counts. The relation between expectation and use of technology is well-known in research on information systems (Bhattacherjee, 2001; Venkatesh et al., 2003). Furthermore, Sanguinetti et al. (2017) observed that occupants interaction with OVS declined as occupants did not get an immediate reaction as they expected from the facility manager. However, the same causal relationship cannot be inferred for the present study.
Impact of Location and Design on Occupants’ Interaction With TiAQ
Occupants were generally satisfied with the use, design and accessibility of TiAQ. The occupants mostly voted on TiAQ as they passed by the device or noticed the device while conducting their everyday work routines (Figure 8). This was also confirmed by studying the time of day votes were cast. Generally, most votes were cast about lunch hours. Nevertheless, seven occupants requested that more panels should be placed in the office space and three even requested reminders as they forgot to use the device. Therefore, seeing the information flyers was not enough as a reminder to get occupants to vote (Figure 8). Rittenbruch et al. (2015) noticed similar behaviour in their study on a tangible OVS, which occupants used upon arrival/departure to/from their office desk. They also noted that occupants reported that the device was inconspicuous and “forgot” it was there after a while. Observations and rounds in the buildings in case study II and III also revealed that some occupants perceived TiAQ as inconspicuous because it did not emit any sound or light when occupants interacted. Moreover, its wireless design made some occupants doubt whether the device was working. This problem, denoted in HCI literature as “interaction blindness” (Hosio et al., 2016), is also observed in studies with interactive displays, i.e., users are unaware of the interactive ability of a display assuming it is only broadcasting information (Hosio et al., 2016). Rittenbruch et al. (2015) solved this problem by designing the OVS to emit a discrete sound which acted as a reminder to occupants to vote. This reminder was received positively by the occupants. Contrary, an adverse effect of receiving frequent reminders from a tangible OVS has also been reported (Petersen and Pedersen, 2016). Therefore, based on the present study, it is difficult to say whether implementing reminders as part of TiAQ would be positively perceived by the occupants. At the same time, occupants’ opinion about the accessibility, design and use of TiAQ was generally positive in the present study. The authors believe that “interaction blindness” did not contribute to the decline in occupant interaction. In fact, access and ease of use are believed to influence getting a high vote count from comfortable occupants (voting on “Fine”). It might have made it more convenient for some of the occupants to cast a vote when their motivation for voting was less prominent than when they were uncomfortable. The aforementioned factors might also explain why some studies on OVS (Sanguinetti et al., 2017; Snow et al., 2017; Lassen et al., 2020) reported that comfortable occupants tended to vote less frequently.
The simple design of TiAQ might have been the reason for a relatively large portion of reiterated votes (Table 2, 27–60%). “Intentional” reiterated votes accounted for up to 78% of reiterated votes (Table 2). They were considered useful votes as they could reflect a strong opinion about a problem (Taylor et al., 2012; Sheikh Khan et al., 2020) and identify whether an immediate response was necessary to address a complaint (Sheikh Khan et al., 2020). For example, in case study I, building B, occupants cast multiple reiterated votes on “Too Cold” during the last day of the cooling intervention (Table 1), at which temperatures dropped to 22°C (Figure 11A). The “unintentional” reiterated votes (Table 2, 16–24%) likely occurred when the main authors were changing batteries of the buttons, due to “change of mind” or less critical “ill-willed” votes or due to the lack of feedback, e.g., emitting a sound, to occupants indicating that their votes were registered. Winkler et al. (2016) demonstrated how a lack of immediate feedback after a vote was cast led to about 3 times higher number of reiterated votes than when immediate feedback was provided. However, “ill-willed” reiterated votes (Table 2) were problematic as they could greatly reduce the credibility of the collected data if they were not identified and removed (Taylor et al., 2012; Zhang et al., 2014; Sheikh Khan et al., 2020). The wireless design of TiAQ might have made occupants think that the device was not used for anything “serious,” as it was not connected to the BMS, and therefore led to occupants casting “ill-willed” reiterated votes. “Ill-willed” votes were less common in case study I and II (Table 2, 0–14%) than case study III. Likely because occupants were generally of a more mature audience and had more professional behaviour in the office spaces, as well as because the main author informed occupants through conversations and e-mails about the intention behind TiAQ. Information was not given to the same extent in case study III, especially because it was difficult as most occupants were students coming and going to the IW due to classes or to get some coffee in the kitchen (Figure 4). Thus, the occupant behaviour at IW was different from the one in the office spaces in case study I and II. In the study by Berquist et al. (2019) “ill-willed” reiterated votes accounted for 22% of the total number of reiterated votes (n = 651), which was also high compared to case study I and II. Consequently, this might suggest that OVS in spaces with transient occupancy had more reiterated votes as occupants are perhaps less “serious” about or unaware of the intention of the OVS. Several studies on voting stations or interactive displays located in spaces with transient occupancy (e.g., Schroeter, 2012; Taylor et al., 2012; Lassen and Josefsen, 2019) made similar observations. Taylor et al. (2012) observed some users at a shop, specifically children, casting multiple votes on a public voting station without considering the polling station’s questions. They suggested that “simple human intervention” such as having the shop owner monitor the device’s use might have mitigated this problem.
Impact of Social Factors on Occupants’ Interaction With TiAQ
Occupants answered that seeing a colleague or supervisor vote or getting a reminder from them was not a reason for interacting with TiAQ (Figure 8). Thus, this type of social factor was not of influence in occupants’ interaction with TiAQ. Mathur et al. (2015) observed that occupants used the OVS at the beginning of the study due to a feeling of being included in the voting poll. The present study did not investigate this aspect of using TiAQ, but there was likely some social aspect related to TiAQ. For example, in case study II the main author observed that an occupant asked a co-occupant to cast a specific vote on his/her behalf. Additionally, during a tour at IW, a group of kids from a daycare centre talked about and interacted with TiAQ. Furthermore, the peak about 1–6 s timespan between two votes (Figure 6) might suggest some kind of a variant of the so-called “honey-pot effect” (Brignull and Rogers, 2003), in which people’s presence round a device can draw more people to the device. As occupants voted when they passed by the device during lunch hours, they were likely walking in groups. Therefore, it was probable that if one of the occupants voted, others in the group also voted. This might have created the observed peak lasting about 1–6 s. A similar trend was observed for the dataset by Berquist et al. (2019). The prevalent hours of voting for the occupants at the gymnastic centre were identified to be 18:00 to 20:00 (relative frequency ranging from 13 to 24%) likely coinciding with arrival/departures to/from the gymnastic centre. Occupants’ arrival or departure likely happened in groups, thus resulting in the peak lasting 3–6 s (Figure 13B). Contrary to the studied office spaces, a second peak about 26 min to 1 h (Figure 6) was not observed for the gymnastic centre (Figure 13B). The second peak likely reflected the usual commute in an office space to and from meetings, bathroom breaks or getting coffee.
Representativeness of Responses Collected With TiAQ
Representativeness of Expressing Comfort and Discomfort With the Thermal Environment
As IEQ questionnaires are a common tool for collecting information about occupants’ perception of the indoor environment (Li et al., 2018), the responses from TiAQ were compared to an IEQ questionnaire to identify the similarity and differences in results from the two survey tools. The questionnaires acquired in case study I represented a short retrospective survey asking occupants about their perception of the thermal environment and IAQ in the last week of each experiment in building A and B. During the last week, interventions were conducted to increase or decrease the indoor temperature (Table 1). The median indoor temperature during intervention week in Exp. I in building B and Exp. II in building A was 1.5°C lower or higher, respectively than median indoor temperature for the non-intervention weeks (Figure 11A). The interventions in Exp. II in building B and Exp. I in building A did not lead to a highly significant change in indoor temperature compared to the non-intervention weeks (Figure 11A, <0.5°C). Note that the intervention in Exp. I for building A failed (Table 1). The implications of the prominent interventions were seen in the responses from the IEQ questionnaires (Figure 9), as about 80% of the occupants were thermally dissatisfied, either feeling cold (Exp. I, building B: ∼80%) or warm (Exp. II, building A: ∼70%). The responses from TiAQ during prominent intervention weeks reflected similar trends as the questionnaires. Up to 90% of the daily votes were on “Too Cold” for Exp. I in building B and “Too Warm” for Exp. II in building A (Figure 11B). According to the questionnaires for the less prominent intervention weeks, up to 70% of the occupants were thermally satisfied and almost equally cold and warm (Figure 9). The TiAQ responses for Exp. I in building A also showed a similar trend as the questionnaire: About 60% of the daily votes were cast on “Fine,” and about 35 and 20% were cast on cold and warm complaints, respectively (Figure 11B). However, the responses from TiAQ for Exp. II in building B reflected that more occupants felt too warm (Figure 11B) than indicated by the IEQ questionnaire. The removal of the “intentional” reiterated votes (n = 7) from the voting poll for Exp. II in building B did not change the results, and therefore could not explain the observed discrepancy. As seven out of nine of the respondents stated to have used TiAQ and nothing in the previous questionnaires in building B indicated that the group of occupants (based on age, sex, working hours and seating location) had drastically changed from the other experiments, non-response bias was least likely to have caused the observed discrepancy. Therefore, response bias might be a plausible explanation of this discrepancy. Response bias relates to occupants’ interpretation of the scales in the survey tools, their recollection of indoor condition or their physiological and psychological state at the time of using any of the survey tools (Schweiker et al., 2017). Occupants using TiAQ might have voted “Too Warm” either interpreting the vote not as strongly as the statement of being dissatisfied, or occupants recalled the indoor condition as less “severe” when responding to the questionnaires than at the time of voting. The comparison of the percentage of votes on “Too Warm” (Figure 11B) for Exp. II in the non-intervention (∼20%) and intervention week (∼70%) indicated that “Too Warm” was likely perceived as a strong statement of discomfort. This was also observed in the results based on the remaining weeks as well as building A, suggesting that the results based on the particular IEQ questionnaire might have been biased.
In summary, the previous discussion illustrated that both tools were appropriate for representing occupants’ comfort and discomfort with the thermal environment. But retrospective surveys might be more prone to response bias, likely because occupants would reinterpret past thermal conditions differently than at the specific moment they experienced it. Longitudinal survey tools such as TiAQ can address these problems. For example, in case study II the initial and final questionnaires were suitable for investigating occupants’ general perception of the indoor environment. They could be used as a benchmarking tool for evaluating occupants’ general satisfaction with IEQ (Karmann et al., 2018). TiAQ could provide a suitable representation of occupants’ experience of the thermal environment over time. The changes in the indoor temperature over the months in case study II (Figure 12A) were clearly reflected in the responses from TiAQ (Figure 12B): 60% of the occupants were generally satisfied with the thermal environment with a consistent level of about 20% occupants experiencing either too cold or too warm indoor environment. But more occupants started to vote too cold from December to February when indoor temperatures were generally lower than the previous months. Thus, whereas the overall questionnaires could provide a general indication of occupants’ experience, TiAQ could provide detailed information about occupants’ daily experience of the indoor environment. According to the questionnaires, about 80% of the occupants were satisfied with the thermal environment compared to the 60% expressed through votes on “Fine.” This discrepancy was likely related to the scale design and the way occupants were asked to provide feedback (Schweiker et al., 2020; Wang et al., 2020). Additionally, the discrepancy could also be related to the day-to-day uncertainty (Wang et al., 2018), e.g., illustrated in the large spread for each vote type per month in Figure 12B. This could be due to the inter-individual differences in thermal comfort induced by non-response bias (Lassen et al., 2020).
Representativeness of Draught Responses
According to the questionnaires, only two occupants during Exp. I and II in building B stated to have experienced draught. According to TiAQ, 9% of the total votes cast were on “Draught” during the intervention week in Exp. I and this was less than 3% for the remaining weeks in Exp. I and II. Therefore, vote counts on “Draught” in the intervention week of Exp. I would have been expected to be about the same level as the remaining weeks since the number of occupants experiencing draught had not changed according to the questionnaires. A plausible explanation to the reason occupants voted more on “Draught” during intervention week in Exp. I might be related to the fact that occupants who felt cold also complaint more about draught (Toftum and Nielsen, 1996; Melikov et al., 2005).
According to a questionnaire collected before the experiments in case study I in Building A, all eleven respondents generally experienced draught. According to TiAQ, 15% of the total vote count was on “Draught” during the first week in Exp. I and this dropped to below 6% for the remaining weeks in Exp. I and II. Occupants were likely more motivated to report on their experience of draught in the first week of Exp. I because the main author was conducting air velocity measurements. Furthermore, the decline in “Draught” votes was likely related to the decline in the “novelty effect.” Occupants might also have found it cumbersome to stand up from their desk and walk to TiAQ for reporting on draught every time they experienced slight discomfort. This can be supported by the observations made in case study II, in which noticing a change in the indoor environment was, in the beginning, a reason to vote, but this declined over time (Figure 7). It was believed occupants might have exaggerated their experience of draught in the questionnaire before the experiments and in the first week of Exp. I. This was because air velocity measurements did not indicate a generally high air velocity in the office space except near the fire escape windows (<0.13 m/s). The IEQ questionnaires from Exp. I and II also showed that all occupants, but one, had reported concurrently being cold and experiencing draught. This suggests that occupants could not distinguish between local cooling of the body by draught and a whole-body thermal sensation of “too cold.” Thus, occupants might have used the term draught interchangeably with feeling cold.
Representativeness of IAQ Responses
CO2-concentrations were generally below 800 ppm for both buildings (Figure 11A). Relative humidity in the last week in Exp. II in building A was up to 20% lower than the first week (Figure 11A). Questionnaire responses on IAQ satisfaction were not affected by the interventions. More than 60% of the occupants (Figure 10) were dissatisfied in building A and satisfied in building B for both intervention weeks. Responses from TiAQ reflected this to some extent. “Stuffy” votes accounted for 16–25% of votes in building A, depending on the week. “Stuffy” votes accounted only up to 6% for building B for all weeks except for the intervention week in Exp. II, where they accounted for 14%. But having a button representing “Stuffy” was likely not enough for representing occupants who experienced IAQ symptoms. In the questionnaires, occupants in building A also reported experiencing bad odours and dry air. Note that the IEQ questionnaires in case study I did not include a direct question about occupants’ experience of stuffy air. This might have biassed the responses toward other symptoms as being prevailing. However, according to the monthly questionnaires in case study II, about half of the respondents reporting to have voted on “Stuffy” did it due to humid air, bad odours or dry air. This indicated that occupants lacked a representative button to describe IAQ and consequently reported on “Stuffy” even though it was not necessarily representative of the problem.
Future Work and Study Limitations
The present study explored the various factors impacting occupants’ interaction with TiAQ and their motivation. As only three office buildings were studied in up to 7 months, the specific, quantitative results cannot be generalised to other buildings or OVS. Nevertheless, the generalisable findings of the present study were related to the identification of factors (e.g., “novelty effect,” “expectation,” and “accessibility”) that might impact the reliability of votes and occupants’ motivation and interaction with OVS devices such as TiAQ (simple, non-intrusive, accessible and tangible). The present study resulted in various suggestions and explanations that need to be investigated more thoroughly in future studies. Firstly, research studies within HCI usually use questionnaires designed according to a conceptual model denoted as Unified Theory of Acceptance and Use of Technology (UTAUT) (Venkatesh et al., 2003) for surveying users’ acceptance and use of technology. Thus, future work could implement this study approach to systematically identify the constructs (expectation, social factors, design, incentives etc.) that are important to sustain occupants’ long-term use of TiAQ and reduce response bias. Secondly, quantitative investigations between established longitudinal questionnaires and TiAQ could be conducted to identify the level of response bias caused by design (interface, assessment scale and the used incentive) and occupants’ interaction with TiAQ. Thirdly, reiterated votes were defined as votes cast less than 1 s apart to ensure that the reiterated vote was cast by a single occupant. However, observational studies and interviews are needed to understand the intention of reiterated votes better and to identify whether 1 s is an appropriate threshold for defining reiterated votes.
Conclusion
A simple, non-intrusive and accessible tangible OVS denoted TiAQ was developed for collecting occupant feedback on thermal and IAQ. Case studies in three office buildings were conducted in up to 7 months. On average, one vote was cast per day per occupant using TiAQ. In one of the offices, the location of TiAQ near entrances to office spaces likely led to 60% of the surveyed occupants voting daily or weekly with TiAQ, regardless of whether they perceived the thermal environment as comfortable or not. The study suggested that TiAQ could be just as reliable as a retrospective IEQ questionnaire for representing occupants’ comfort and discomfort with the thermal environment. However, TiAQ was not reliable for representing occupants’ perception of IAQ as it only had a button to indicate stuffy air. The ability of TiAQ to capture occupants’ perception over time and its simple design could make it suitable as a longitudinal “here and now” survey tool. More research is needed to study the validity of the responses collected with TiAQ and established IEQ questionnaires. Furthermore, the following factors were identified that might have impacted occupants’ interaction with TiAQ and the representativeness of the collected votes. Firstly, the “novelty effect” caused a higher level of interaction with TiAQ during short-term studies and at the beginning of long-term studies. This effect might have exaggerated the “severity” of IEQ problems related to e.g., draught in the first week of a short-term study. Secondly, occupants’ expectation, awareness and understanding of the intention of the device and getting “feedback on feedback” were identified as important factors for sustaining occupants’ long-term use of TiAQ as well as to reduce “unintentional” and “ill-willed” reiterated votes that, if not handled, could affect the representativeness of the collected votes.
Data Availability Statement
The datasets presented in this article are not readily available because of the General Data Protection Regulation (GDPR) restricting public sharing of personally identifiable data. Requests to access the datasets should be directed to ZHNraEBieWcuZHR1LmRr or amFrb2xAYnlnLmR0dS5kaw==.
Ethics Statement
Ethical review and approval was not required for the study on human participants in accordance with the local legislation and institutional requirements. Written informed consent for participation was not required for this study in accordance with the national legislation and the institutional requirements.
Author Contributions
DS: conceptualisation, methodology, software, validation, formal analysis, investigation, resources, data curation, writing – original draft, visualisation, and project administration. JK: conceptualisation, methodology, writing – review and editing, supervision, and funding acquisition. PW: supervision, resources, writing – review, and funding acquisition. All authors agreed to be accountable for the content of the work.
Funding
This work was a joint Ph.D. project between the Technical University of Denmark and the Scandinavian construction company NCC Denmark. This work was funded by the governmental institute Innovation Fund Denmark and the Danish philanthropic institute Realdania through the special grant “Smart buildings and Smart cities: Balancing technology and people” (7038-00179A, 2017). Innovation Fund Denmark and Realdania were not involved in the collection, analysis, and interpretation of data.
Conflict of Interest
The main author and one of the co-authors are affiliated with the commercial company in the construction industry, NCC Denmark, which might have a financial interest in the study method and outcomes. The authors declare that neither the university, the aforementioned company nor funding companies have had any influence nor attempted to gain influence on the experimental design, results and conclusions of this study in any way or at any time.
Acknowledgments
We are grateful for the access to the office buildings in Denmark and the support from the building operation manager and occupants who participated in the study. Furthermore, we would like to thank professor Vivian Loftness for allowing the main author to do a research stay at the Intelligent Workplace at Carnegie Mellon University. We would also like to thank professor Mohamed M. Ouf, professor William O’Brien, and Justin Berquist for supplementing our data analysis with their data collected from a case study in Canada, Ontario (Berquist et al., 2019).
Supplementary Material
The Supplementary Material for this article can be found online at: https://www.frontiersin.org/articles/10.3389/fbuil.2021.643630/full#supplementary-material
Footnotes
References
Aguilera, J. J., Kazanci, O. B., and Toftum, J. (2019). Thermal adaptation in occupant-driven HVAC control. J. Build. Eng. 25:100846. doi: 10.1016/j.jobe.2019.100846
Alessandra, G., Giuliana, L., Daniele, M., Salvatore, P., and Vincenzo, F. (2013). Indoor environmental quality survey: a brief comparison between different post occupancy evaluation methods. Adv. Mater. Res. 864–867, 1148–1152.
Altomonte, S., and Schiavon, S. (2013). Occupant satisfaction in LEED and non-LEED certified buildings. Build. Environ. 68, 66–76. doi: 10.1016/j.buildenv.2013.06.008
Baker, L., and Hoyt, T. (2016). “Control for the people: how machine learning enables efficient HVAC use across diverse thermal preferences,” in Proceedings of the ACEEE Summer Study on Energy Efficiency in Buildings, (Washington, DC: ACEEE), 1–10. doi: 10.1007/s10994-012-5297-4
Balaji, B., Teraoka, H., Gupta, R., and Agarwal, Y. (2013). “ZonePAC: zonal power estimation and control via HVAC metering and occupant feedback,” in Proceedings of the 5th ACM Workshop on Embedded Systems for Energy-Efficient Buildings, (New York, NY), 8. doi: 10.1145/2528282.2528304
Berquist, J., Ouf, M. M., and O’Brien, W. (2019). A method to conduct longitudinal studies on indoor environmental quality and perceived occupant comfort. Build. Environ. 150, 88–98. doi: 10.1016/j.buildenv.2018.12.064
Bhattacherjee, A. (2001). Understanding information systems continuance: an expectation-confirmation model. MIS Q. 25, 351–370. doi: 10.2307/3250921
Bluyssen, P. M., Roda, C., Mandin, C., Fossati, S., Carrer, P., de Kluizenaar, Y., et al. (2016). Self-reported health and comfort in ‘modern’ office buildings: first results from the European OFFICAIR study. Indoor Air 26, 298–317. doi: 10.1111/ina.12196
Brauer, C., Kolstad, H., Ørbæk, P., and Mikkelsen, S. (2006). No consistent risk factor pattern for symptoms related to the sick building syndrome: a prospective population based study. Int. Arch. Occup. Environ. Health 79, 453–464. doi: 10.1007/s00420-005-0074-3
Brignull, H., and Rogers, Y. (2003). “Enticing people to interact with large public displays in public spaces,” in Proceedings of the IFIP International Conference on Human-Computer Interaction, (New York, NY: INTERACT), 17–24.
Carre, A., and Williamson, T. (2018). Design and validation of a low cost indoor environment quality data logger. Energy Build. 158, 1751–1761. doi: 10.1016/j.enbuild.2017.11.051
Choi, J.-H., Loftness, V., and Aziz, A. (2012). Post-occupancy evaluation of 20 office buildings as basis for future IEQ standards and guidelines. Energy Build. 46, 167–175. doi: 10.1016/j.enbuild.2011.08.009
Dykes, C., and Baird, G. (2013). A review of questionnaire-based methods used for assessing and benchmarking indoor environmental quality. Intell. Build. Int. 5, 135–149. doi: 10.1080/17508975.2013.783457
Erickson, V. L., and Cerpa, A. E. (2012). “Thermovote: participatory sensing for efficient building hvac conditioning,” in Proceedings of the 4th ACM Workshop on Embedded Sensing Systems for Energy-Efficiency in Buildings, BuildSys, (Toronto, ON), 9–16. doi: 10.1145/2422531.2422534
Frontczak, M., Schiavon, S., Goins, J., Arens, E., Zhang, H., and Wargocki, P. (2012). Quantitative relationships between occupant satisfaction and satisfaction aspects of indoor environmental quality and building design. Indoor Air 22, 119–131. doi: 10.1111/j.1600-0668.2011.00745.x
Gallacher, S., O’Connor, J., Bird, J., Rogers, Y., Capra, L., Harrison, D., et al. (2015). “Mood squeezer: lightening up the workplace through playful and lightweight interactions,” in Proceedings of the ACM International Conference on Computer-Supported Cooperative Work and Social Computing, (Vancouver, BC), 891–902.
Geng, Y., Ji, W., Wang, Z., Lin, B., and Zhu, Y. (2019). A review of operating performance in green buildings: energy use, indoor environmental quality and occupant satisfaction. Energy Build. 183, 500–514. doi: 10.1016/j.enbuild.2018.11.017
Gilani, S., and O’brien, W. (2017). Review of current methods, opportunities, and challenges for in-situ monitoring to support occupant modelling in office spaces. J. Build. Perform. Simul. 10, 444–470. doi: 10.1080/19401493.2016.1255258
Guerra-Santin, O., and Tweed, C. A. (2015). In-use monitoring of buildings: an overview of data collection methods. Energy Build. 93, 189–207. doi: 10.1016/j.enbuild.2015.02.042
Hartkopf, V., Loftness, V., Mahdavi, A., Lee, S., and Shankavaram, J. (1997). An integrated approach to design and engineering of intelligent buildings – the intelligent workplace at Carnegie Mellon University. Autom. Constr. 6, 401–415. doi: 10.1016/S0926-5805(97)00019-8
Hazlewood, W. R., Stolterman, E., and Connelly, K. (2011). “Issues in evaluating ambient displays in the wild: two case studies,” in Proceedings of the Conference on Human Factors in Computing Systems, (Vancouver, BC), 877–886.
Hosio, S., Kukka, H., Goncalves, J., Kostakos, V., and Ojala, T. (2016). Toward meaningful engagement with pervasive displays. IEEE Pervasive Comput. 15, 24–31. doi: 10.1109/mprv.2016.58
Huang, E. M., Mynatt, E. D., Russell, D. M., and Sue, A. E. (2006). Secrets to success and fatal flaws: the design of large-display groupware. IEEE Comput. Graph. Appl. 26, 37–45. doi: 10.1109/MCG.2006.21
Jazizadeh, F., Ghahramani, A., Becerik-Gerber, B., Kichkaylo, T., and Orosz, M. (2014). User-led decentralised thermal comfort driven HVAC operations for improved efficiency in office buildings. Energy Build. 70, 398–410. doi: 10.1016/j.enbuild.2013.11.066
Jung, W., and Jazizadeh, F. (2019). Human-in-the-loop HVAC operations: a quantitative review on occupancy, comfort, and energy-efficiency dimensions. Appl. Energy 239, 1471–1508. doi: 10.1016/j.apenergy.2019.01.070
Karmann, C., Schiavon, S., and Arens, E. (2018). “Percentage of commercial buildings showing at least 80% occupant satisfied with their thermal comfort,” in Proceedings of the 10th Windsor Conference: Rethinking Comfort Cumberland Lodge, (Windsor, ON), 1–7. doi: 10.13052/rp-9788793237230
Koch, M., Von Luck, K., Schwarzer, J., and Draheim, S. (2018). “The novelty effect in large display deployments-experiences and lessons-learned for evaluating prototypes,” in Proceedings of the 16th European Conference on Computer-Supported Cooperative Work – Exploratory Papers, Reports of the European Society for Socially Embedded Technologies, (Nancy), 1–19. doi: 10.18420/ecscw2018_3
Konis, K. S. (2013). Leveraging ubiquitous computing as a platform for collecting real-time occupant feedback in buildings. Intell. Build. Int. 5, 150–161. doi: 10.1080/17508975.2013.781499
Konis, K., and Annavaram, M. (2017). The occupant mobile gateway: a participatory sensing and machine-learning approach for occupant-aware energy management. Build. Environ. 118, 1–13. doi: 10.1016/j.buildenv.2017.03.025
Lassen, N., and Josefsen, T. (2019). Experimental setup and testing of an in-field system for real-time occupant feedback. IOP Conf. Ser. Mater. Sci. Eng. 609:042045. doi: 10.1088/1757-899X/609/4/042045
Lassen, N., Goia, F., Schiavon, S., and Pantelic, J. (2020). Field investigations of a smiley-face polling station for recording occupant satisfaction with indoor climate. Build. Environ. 185, 1–13. doi: 10.1016/j.buildenv.2020.107266
Lee, S., and Karava, P. (2020). Towards smart buildings with self-tuned indoor thermal environments – a critical review. Energy Build. 224, 1–9. doi: 10.1016/j.enbuild.2020.110172
Levin, K. A. (2006). Study design III: cross-sectional studies. Evid. Based Dent. 7, 24–25. doi: 10.1038/sj.ebd.6400375
Li, D., Menassa, C. C., and Kamat, V. R. (2017). Personalised human comfort in indoor building environments under diverse conditioning modes. Build. Environ. 126, 304–317. doi: 10.1016/j.buildenv.2017.10.004
Li, P., Froese, T. M., and Brager, G. (2018). Post-occupancy evaluation: state-of-the-art analysis and state-of-the-practice review. Build. Environ. 133, 187–202. doi: 10.1016/j.buildenv.2018.02.024
Mathur, A., Van den Broeck, M., Vanderhulst, G., Mashhadi, A., and Kawsar, F. (2015). “Tiny habits in the giant enterprise: understanding the dynamics of a quantified workplace,” in Procceding of the ACM International Joint Conference on Pervasive and Ubiquitous Computing, (Osaka), 577–588. doi: 10.1145/2750858.2807528
Melikov, A., Pitchurov, G., Naydenov, K., and Langkilde, G. (2005). Field study on occupant comfort and the office thermal environment in rooms with displacement ventilation. Indoor Air 15, 205–214. doi: 10.1111/j.1600-0668.2005.00337.x
Parkinson, T., Parkinson, A., and de Dear, R. (2019). Continuous IEQ monitoring system: context and development. Build. Environ. 149, 15–25. doi: 10.1016/j.buildenv.2018.12.010
Peretti, C., and Schiavon, S. (2011). “Indoor environmental quality surveys. A brief literature review,” in Proceedings of the 12th International Conference on Indoor Air Quality and Climate, (Austin, TX), 1331–1336.
Petersen, S., and Pedersen, S. M. L. (2016). “Desktop polling station for real-time building occupant feedback,” in Proceedings of the 12th REHVA World Congress, Vol. 7, ed. P. K. vols Heiselberg (Aalborg: Aalborg Universitet), 609.
Pritoni, M., Salmon, K., Sanguinetti, A., Morejohn, J., and Modera, M. (2017). Occupant thermal feedback for improved efficiency in university buildings. Energy Build. 144, 241–250. doi: 10.1016/j.enbuild.2017.03.048
Proton Technologies A. G. (2021). Complete Guide to GDPR Compliance [online]. Available online at: https://gdpr.eu/
Raphael, K. (1987). Recall bias: a proposal for assessment and control article in. Int. J. Epidemiol. 16, 167–170. doi: 10.1093/ije/16.2.167
Rittenbruch, M., Donovan, J., and Santo, Y. (2015). “Mini-orb: a personal indoor climate preference feedback interface,” in Proceedings of the 15th Human-Computer Interaction (INTERACT). Lecture Notes in Computer Science, LNCS-9297 (Part II), (Bamberg), 134–149. doi: 10.1007/978-3-319-22668-2_12
Sanguinetti, A., Pritoni, M., Salmon, K., Meier, A., and Morejohn, J. (2017). Upscaling participatory thermal sensing: lessons from an interdisciplinary case study at University of California for improving campus efficiency and comfort. Energy Res. Soc. Sci. 32, 44–54. doi: 10.1016/j.erss.2017.05.026
Schroeter, R. (2012). “Engaging new digital locals with interactive urban screens to collaboratively improve the city,” in Proceedings of the ACM Conference on Computer Supported Cooperative Work, (New York, NY: Association for Computing Machinery), 227–236. doi: 10.1145/2145204.2145239
Schweiker, M., André, M., Al-Atrash, F., Al-Khatri, H., Alprianti, R. R., Alsaad, H., et al. (2020). Evaluating assumptions of scales for subjective assessment of thermal environments – do laypersons perceive them the way, we researchers believe? Energy Build. 211:109761. doi: 10.1016/j.enbuild.2020.109761
Schweiker, M., Fuchs, X., Becker, S., Shukuya, M., Dovjak, M., Hawighorst, M., et al. (2017). Challenging the assumptions for thermal sensation scales. Build. Res. Inf. 45, 572–589. doi: 10.1080/09613218.2016.1183185
Sheikh Khan, D., Kolarik, J., and Weitzmann, P. (2020). Design and application of occupant voting systems for collecting occupant feedback on indoor environmental quality of buildings – a review. Build. Environ. 183:107192. doi: 10.1016/j.buildenv.2020.107192
Shumway, R. H., and Stoffer, D. S. (2006). Time Series Analysis and Its Application: With R Examples, 2nd Edn. New York, NY: Springer.
Snow, S., Auffenberg, F., and Schraefel, M. C. (2017). “Log it while it’s hot: designing human interaction with smart thermostats for shared work environments,” in Proceedings of the Conference on Human Factors in Computing Systems, (Denver, CO: ACM), 1595–1606. doi: 10.1145/3025453.3025578
Taylor, N., Marshall, J., Blum-Ross, A., Mills, J., Rogers, J., Egglestone, P., et al. (2012). “Viewpoint: empowering communities with situated voting devices,” in Proceedings of the Conference on Human Factors in Computing Systems – Proceedings, (Austin, TX), 1361–1370. doi: 10.1145/2207676.2208594
Toftum, J., and Nielsen, R. (1996). Draught sensitivity is influenced by general thermal sensation. Int. J. Ind. Ergon. 18, 295–305. doi: 10.1016/0169-8141(95)00070-4
Venkatesh, V., Morris, M. G., Davis, G. B., and Davis, F. D. (2003). User acceptance of information technology: towards a unified view. MIS Q. 27, 425–478. doi: 10.1006/mvre.1994.1019
Wang, J., Wang, Z., de Dear, R., Luo, M., Ghahramani, A., and Lin, B. (2018). The uncertainty of subjective thermal comfort measurement. Energy Build. 181, 38–49. doi: 10.1016/j.enbuild.2018.09.041
Wang, Z., Wang, J., He, Y., Liu, Y., Lin, B., and Hong, T. (2020). Dimension analysis of subjective thermal comfort metrics based on ASHRAE global thermal comfort database using machine learning. J. Build. Eng. 29:101120. doi: 10.1016/j.jobe.2019.101120
Winkler, D. A., Beltran, A., Esfahani, N. P., Maglio, P. P., and Cerpa, A. E. (2016). “FORCES: feedback and control for occupants to refine comfort and energy savings,” in Proceedings of the ACM International Joint Conference on Pervasive and Ubiquitous Computing, (Heidelberg: ACM), 1188–1199. doi: 10.1145/2971648.2971700
Keywords: indoor air quality, occupant feedback, occupant voting system, participatory sensing, thermal comfort
Citation: Sheikh Khan D, Kolarik J and Weitzmann P (2021) Occupants’ Interaction With an Occupant Voting System for Thermal and Indoor Air Quality Feedback – Case Studies in Office Spaces. Front. Built Environ. 7:643630. doi: 10.3389/fbuil.2021.643630
Received: 18 December 2020; Accepted: 01 March 2021;
Published: 18 March 2021.
Edited by:
Clayton Miller, National University of Singapore, SingaporeReviewed by:
Zhe Wang, Lawrence Berkeley National Laboratory, United StatesLiam O’Brien, Carleton University, Canada
Copyright © 2021 Sheikh Khan, Kolarik and Weitzmann. This is an open-access article distributed under the terms of the Creative Commons Attribution License (CC BY). The use, distribution or reproduction in other forums is permitted, provided the original author(s) and the copyright owner(s) are credited and that the original publication in this journal is cited, in accordance with accepted academic practice. No use, distribution or reproduction is permitted which does not comply with these terms.
*Correspondence: Donya Sheikh Khan, ZHNraEBieWcuZHR1LmRr