 Ouassim Manout1,2*
 Francesco Ciari1,2*
- 1Polytechnique, Civil, Geological and Mining Engineering Department, Montreal, QC, Canada
- 2Interuniversity Research Centre on Enterprise Networks, Logistics and Transportation (CIRRELT), Montreal, QC, Canada
Daily activities and mobility dynamics play a central role in the spread of COVID-19. Close physical interactions involved by certain daily activities help transmit the virus. Travel required by the spatial distribution of activities contributes to the propagation of the virus. In order to control and limit this propagation, it is critical to understand the contribution of daily activities to the dynamics of COVID-19. This paper investigates the connection between daily activities, their distribution in space and time, the characteristics of the individuals performing them, and the transmission of the virus. A business-as-usual agent-based simulation scenario of Montreal, Canada is used. To address this research question, we use two agent-based models: MATSIM and EPISIM. MATSIM simulates daily activities and mobility dynamics of the population. EPISIM simulates the spread of the virus in the population using contact networks computed by MATSIM. A synthetic population of Montreal is defined to replicate the main observed sociodemographic characteristics of Montrealers as well as their activity and mobility patterns. The definition of the synthetic population relies on various data sources: household travel survey, census, real estate, car ownership, and housing data. In the business-as-usual scenario, findings underline the significant role of home, work, and school activities in community transmission of COVID-19. Secondary activities, including leisure and shopping, also help spread the virus, but to a lesser degree in comparison with primary activities. The risk of infection in the workplace depends on the economic sector. Healthcare workers are, by far, the most exposed workers to the virus. Workplace infections mirror the gender-biased job market of Montreal. Most infections in the healthcare and educational services are among women. Most infections in the manufacturing, construction, transportation, and warehousing industries are among men. In the business-as-usual scenario where community transmission is high, primary and secondary school-aged children are found to be a major transmission vector of the virus. Finally, simulation results suggest that the risk of infection in the public transportation system is low.
1 Introduction
Since its onset, the severe acute respiratory syndrome Coronavirus 2 (SARS-CoV-2), responsible for the COVID-19 disease1, has swept through the globe to ravage more than 200 countries. As of May 2021, the virus has infected more than 162 million persons and it has claimed nearly 3.4 million lives (WHO, 2021). This swift propagation is partly due to individual and global dynamics of activity and mobility (Chang et al., 2020; Xiong et al., 2020; Yilmazkuday, 2021). Close physical interactions involved by daily activities help transmit the virus from one infected individual to another (WHO, 2020a). The mobility of infected individuals undergirds the spatial propagation of the virus. These two factors: activities and mobility, are critically important for understanding and controlling the spread of the virus. This paper investigates the connection between daily activities, mobility, and the spread of the virus in Montreal, Canada using an agent-based simulation approach.
While the connection between travel and pandemic dynamics in general, and COVID-19 in particular, has largely been addressed (Grais et al., 2003; Epstein et al., 2007; Frias-Martinez et al., 2011; Smieszek et al., 2011; Badr et al., 2020; Chang et al., 2020; Xiong et al., 2020; Yilmazkuday, 2021), the investigation of the link between activities and virus transmission has received relatively less attention (Arthur et al., 2017; Almagor and Picascia, 2020; Institut Pasteur, 2020; Kerr et al., 2020; Müller et al., 2021). Yet, the role of daily activities like work, education, or shopping in virus transmission is crucial to examine, not only from a research perspective, but also from a policy viewpoint. In the absence of this information, governments and health authorities have no choice but to enact restrictive measures on everyday activities to limit the spread of the virus as what has been seen in the first wave of the current pandemic. In some critical situations, even harsh restrictions, like total lockdowns, with strict control of activities and mobility of individuals were imposed (Blavatnik School of Government, 2021).
Research on the contribution of travel to the spread of pandemics has been addressed at different spatial scales: continental, national, regional, and local. Several research papers underline the significant role played by long distance travel, be it by air, sea, or train in the spread of infectious diseases (Grais et al., 2003; Epstein et al., 2007; Chinazzi et al., 2020; Hu et al., 2020). Other studies have focused on urban mobility and its role in community transmission of infectious diseases (Wesolowski et al., 2015; Ruktanonchai et al., 2016; Huang et al., 2020; Xiong et al., 2020; Yilmazkuday, 2021).
Research on the contribution of daily activities, taken individually and in combination, to the transmission of COVID-19 is still limited. Often, research studies focus on the risk involved by specific activities like work, school, or home with little regard to their global, wider, and complementary contribution to community transmission. In these studies, home is found to be a major source of infection outbreaks (Bi et al., 2020; Leclerc et al., 2020; Li et al., 2020; Liu et al., 2020a; Liu et al., 2020b; Galmiche et al., 2021). Due to the high likelihood of close, repeated, and long interactions between household members, the introduction of the SARS-CoV-2 into homes bears a high risk of transmission to cohabitants. In the context of home-related infections, early research suggests that the quarantine status of the infected member, his/her age, and household status (spousal or not), influence the risk of virus transmission inside homes (Li et al., 2020; Madewell et al., 2020; Galmiche et al., 2021).
Infections in the workplace are also significant, especially among healthcare, salespersons, manufacturing, wholesale trade, warehouse workers, and transit and taxi drivers (Direction Régionale de la Santé Publique de Montréal, 2020; Heinzerling et al., 2020; Institut Pasteur, 2020; Lan et al., 2020). Health reports and research studies indicate that the risk of COVID-19 infection is higher in essential jobs than others. These jobs are often occupied by women, low-wage workers, immigrants, and visible minorities (Hawkins, 2020; St-Denis, 2020).
During the first wave of COVID-19, most countries have imposed school closures (Max Roser et al., 2020). After the reopening of schools, several COVID-19 outbreaks have been reported (Direction Régionale de la Santé Publique de Montréal, 2020; European Center for Disease Prevention and Control (ECDC), 2020; Liu et al., 2020a; Stein-Zamir et al., 2020). Research on the role of schools and school-aged children in community transmission of COVID-19 is burgeoning, and consensus on this question is yet to be reached (Davies et al., 2020; Hyde, 2020; Munro and Faust, 2020b; Puntis, 2020). Many studies stress that schools have limited contribution to community transmission of SARS-CoV-2 (European Center for Disease Prevention and Control (ECDC), 2020; Ludvigsson, 2020; Munro and Faust, 2020b; Ontario Public Health, 2020; Falk et al., 2021; Zimmerman et al., 2021). Conversely, other studies suggest that schools and school-aged children may play an active role in community transmission of the virus (Lee et al., 2020; Puntis, 2020).
As regards secondary activities, like leisure, social gatherings, and shopping, the lack of appropriate data limits the investigation of their specific contribution to community transmission, especially in contexts where non-essential activities are restricted (Baicker et al., 2020; Chang et al., 2020). In this context, general recommendations have been issued to limit social activities that involve close interactions (within 2 m, for example) for periods of time longer than a reference threshold (15 min daily, for example), especially in enclosed places (Centers for Disease Control and Prevention (CDC), 2020; Government of Canada, 2020).
This brief literature review brings to light the need for a comprehensive understanding of the connection between daily activities, urban mobility, population sociodemographics, and virus transmission. To fill this research gap, we investigate the following research question: how do daily activities, taken individually and in combination, their distribution in space and time, and the characteristics of the individuals involved in them contribute to the COVID-19 pandemic? We investigate this connection in the case of Montreal, Canada using an agent-based approach. Findings of this research can help improve our understanding of the current pandemic, and ultimately help design efficient policy mitigation measures.
2 Methods and Materials
We adopt an integrated modeling framework of two agent-based models (Figure 1): MATSIM (Horni et al., 2016) and EPISIM (Müller et al., 2021). MATSIM simulates daily activity and mobility dynamics of the population. EPISIM uses these dynamics to simulate the spread of the virus in the population. The coupling of these two microsimulation models gives birth to emerging infection phenomena at the macroscopic level (Figure 1).
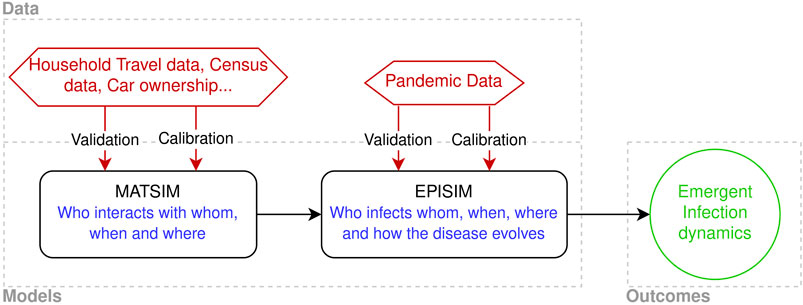
FIGURE 1. Integrated simulation framework.
To examine the link between daily activities, urban mobility, and COVID-19 infections, the above integrated agent-based approach is appropriate. This approach provides the possibility to track infected and susceptible agents in space and time, and to relate infections to specific agents, their characteristics, and their activities.
2.1 MATSIM
MATSIM (Multi-Agent Transport Simulation) is a state-of-the-art transportation agent-based model (ABM), developed for more than 2 decades, and put into practice in different case studies from various cities around the world (Horni et al., 2016). As any ABM, MATSIM relies on a synthetic population and individual daily activity plans. In a MATSIM simulation, agents carry out their plans and compete for network capacity to minimize unproductive travel and activity times. During the simulation, agents learn how to adapt their daily plans based on their experience over a series of repeated simulations of the same day (iterations). At the system level, this mechanism can be thought of as a co-evolutionary algorithm. After a sufficient number of iterations, MATSIM outcomes reach an equilibrium state where each agent has an optimal daily plan given the global state of the system.
Observations on the mobility of the population are used to calibrate MATSIM parameters and validate its outcomes (Figure 1).
MATSIM outcomes on individual daily activity plans are rich input data for modeling epidemics (Smieszek et al., 2011). These plans offer an insight into the distribution, in space and time, of potential interactions of agents and their durations. These outcomes are used by EPISIM to reconstruct contact networks, i.e., who interacts with whom, when, where, and for how long (Figure 1).
2.2 EPISIM
EPISIM, for Epidemic Simulation, is an agent-based epidemiological model that has recently been introduced to study the spread of infectious diseases (Müller et al., 2021). Epidemic models can roughly be grouped in two categories:
• Non-mechanistic: statistical models
• Mechanistic: epidemiological models
Statistical models rely on extrapolation to predict future trends of infection cases, hospitalizations, or the number of deaths. These models have no epidemiological foundation in that they do not model the mechanics at work in the transmission of infections (Li et al., 2021). Epidemiological models, in contrast, include these mechanics to explain the spread and evolution of infectious diseases. These models offer more possibilities to study epidemics and mitigation measures than statistical ones (Perez and Dragicevic, 2009; Ajelli et al., 2010; Frias-Martinez et al., 2011; Hoertel et al., 2020; Kerr et al., 2020). They are also an interesting decision-support tool for their ability to assess different policy interventions and mitigation measures to control pandemic situations.
In addition to its epidemiological foundation, the agent-based approach of EPISIM opens up new opportunities to study individual behaviors, complex systemic interactions, and emerging phenomena (Ajelli et al., 2010; Frias-Martinez et al., 2011; Smieszek et al., 2011; Gaudou et al., 2020; Hoertel et al., 2020; Koo et al., 2020). The premise of the EPISIM modeling framework has already been demonstrated in the case of the 2003/2004 H3N2 influenza epidemic in Switzerland (Smieszek et al., 2011). EPISIM has been applied to Berlin in Germany, to model the spread of SARS-CoV-2 with different policy scenarios (TU-Berlin, 2020).
EPISIM uses MATSIM outcomes to reconstruct contact networks and computes the risk of infection for each interaction, as well as the evolution of the disease in infected agents (Figure 1). This model can be roughly broken down into two sub-models:
1. Infection Model
2. Disease Progression Model
2.2.1 Infection Model
The infection model is based on the work of Smieszek (2009). This model links the risk of infection to the intensity and duration of interaction. It computes for each susceptible, i.e., not infected, agent the probability of contracting the virus following an interaction with an infected agent as:
The contact intensity during leisure activities is assumed greater than that of other activities (
For agents working in the health and social assistance sector, half of their work time is assumed in close interaction with patients (not necessarily of COVID-19) and other colleagues. During these interactions, the contact intensity is set to 2.
θ is a calibration parameter that fits EPISIM outcomes to observed infection data, i.e., number of infections or hospitalizations.
Since the precise social networks of agents is, to some degree, unknown (except for household and family interactions), we assume that an agent, in a given facility at a given time, interacts with a pre-defined number of randomly chosen agents. In this research, each agent is assumed to interact with a maximum of eight other agents present at the same moment and in the same facility or vehicle.
In the case of Montreal, we consider the influence of weather on leisure activities. The proportion of outdoor leisure activities is assumed to evolve with seasons. From November to January, 90% of leisure activities are assumed indoor. In August, 70% of leisure activities are assumed outdoor. In between, the share of outdoor activities is linearly interpolated. The indoor/outdoor ratio has a direct impact on the contact intensity parameter.
2.2.2 Progression Model
The progression or transition model is responsible for simulating the evolution of the state of COVID-19 in infected agents. This model is inspired by the conventional compartment model: Susceptible Infected Recovered (SIR) (Kermack and McKendrick, 1927; Wangping et al., 2020; Rubin et al., 2021). The progression model includes eight compartments and three types of transition rules (Figure 2). Transition rules are: time-dependent, probability-dependent, or both.
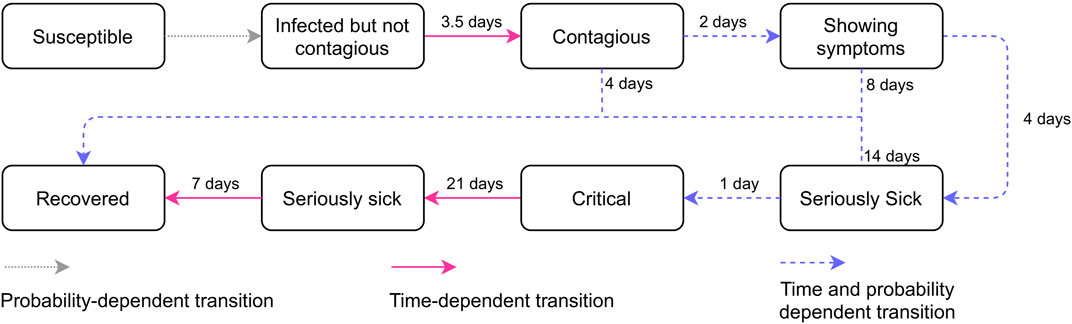
FIGURE 2. EPISIM progression model of COVID-19.
Time-dependent progressions are deterministic and move all agents in a given compartment to the next stage using transition durations. These durations are assumed to follow a log-normal distribution whose parameters μ and σ are derived from pandemic observations. These values are shown in Figure 2 and more details can be found in Müller et al. (2021).
Probability-dependent transitions embody the uncertainty involved in the evolution of the disease. Probability transitions affect only some agents, uniformly or conditional on their characteristics. Time-probability transitions are probability progression rules that affect certain agents after a certain pre-defined duration spent in the corresponding compartment. In this research, we use an age-dependent probability progression model that assigns different disease states depending on the age of the agent. The age-dependent probabilities in Table 1 are computed using COVID-19 pandemic data of Quebec, Canada (Institut national de santé publique du Québec (INSPQ), 2020a).
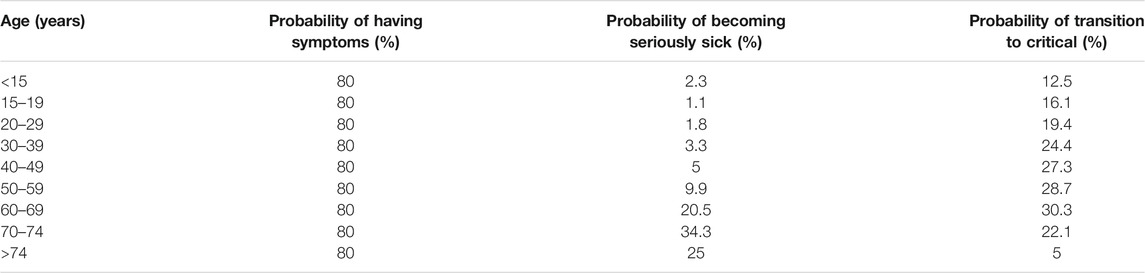
TABLE 1. Age-dependent disease progression probabilities (Institut national de santé publique du Québec (INSPQ), 2020a).
At each disease stage that involves a time-probability transition, the infected agent can directly recover after a certain period of time (Figure 2).
2.3 Materials
2.3.1 Synthetic Population
The Census Metropolitan Area (CMA) of Montreal, hereafter referred to as Montreal, has a population of nearly four million persons (Statistics Canada, 2016). 47% of this population lives in the island of Montreal, i.e., the census division (CD) of Montreal (Figure 3).
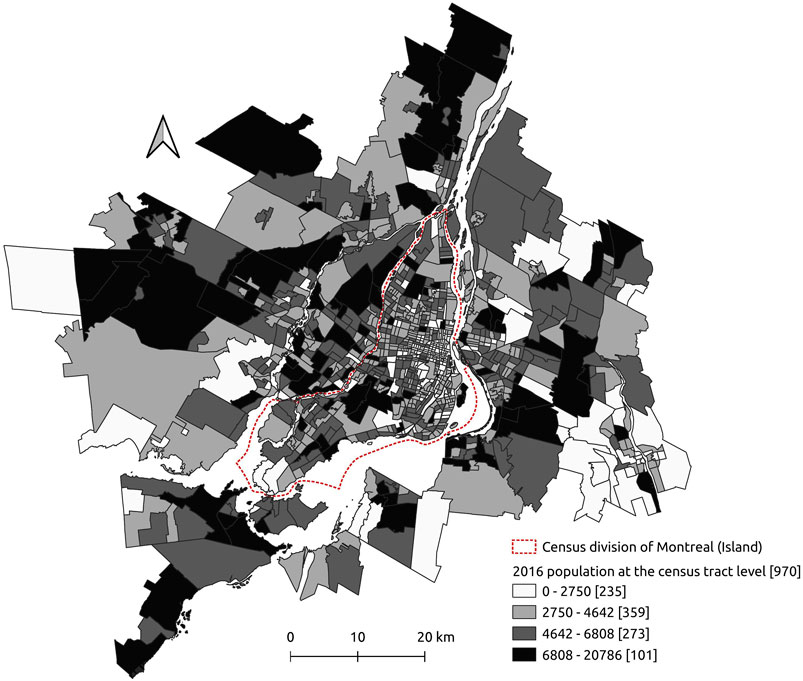
FIGURE 3. The census metropolitan area of Montreal and its 2016 population.
For the agent-based approach to be implemented, a detailed description of the main sociodemographic, activity, and mobility characteristics of all individuals in the population is needed. For confidentiality and cost reasons, this information is only available for a limited portion of the total population. To overcome this data limitation, our research, as most agent-based models do, relies on a synthetic population that replicates main observed characteristics of the population of Montreal.
2.3.2 Data
Different data sources are used to prepare the synthetic population: census data (Statistics Canada, 2016), Household Travel Survey (HTS) (Ministére des Transports du Québec (MTQ), 2013), car ownership data (Société de l’Assurance Automobile du Québec (SAAQ), 2016), and housing data (Ministére des Affaires Municipales et de l’Occupation du Territoire (MAMO), 2014). Census (Statistics Canada, 2016) provides aggregate sociodemographic information on households (number, size, presence of children, etc.) and persons (number, gender, age, working status, etc.) at different spatial resolutions. In this paper, we use the smallest spatial resolution, i.e., the dissemination area. Data on car ownership and driving license (Société de l’Assurance Automobile du Québec (SAAQ), 2016) are used to enrich census data. The HTS provides detailed information on mobility, daily activities, and population sociodemographics for a small sample of the total population (less than 5% in Montreal).
Basically, population synthesis uses census data to compute expansion factors of observations in the HTS and to clone individuals and households according to their corresponding weights. The resulting population has the advantage of: 1) being comprehensive, i.e., it characterizes all individuals in the population, and 2) of replicating observed data. Housing data (Ministére des Affaires Municipales et de l’Occupation du Territoire (MAMO), 2014) are used to spatially locate activities of synthetic agents.
The synthetic population is prepared using the hierarchical Iterative Proportional Updating method, with two spatial resolutions: dissemination area and census tract (Ye et al., 2009; Konduri et al., 2016). The EQASIM pipeline is used to enrich the population with daily activities and prepare MATSIM input data (Hörl and Balać, 2020). To keep computation times reasonable, a random sample of 25% of the synthetic population is retained, resulting in 1,011,295 agents and 431,580 households included in our simulation.
Census data is open-access. HTS, car ownership, and housing data have been made available on request.
2.3.3 Simulation Scenario
The focus of this research is to unravel the connection between daily activities, population characteristics, and the spread of COVID-19. To ensure behavioral consistency in the model, we use a business-as-usual (BAU) scenario where no pandemic policy intervention is imposed. Agents are assumed to maintain their travel and activity habits. Such a scenario is more plausible during the first weeks or months of the pandemic (from January to March 2020 for example), or when activities have resumed after the summer break of 2020. Despite its unrealistic assumptions during the peak of the pandemic, the BAU scenario is still useful to gain insight on the role of daily activities in the spread of the virus in the absence of policy restrictions. This information can help policy makers design efficient interventions.
In this context, the EPISIM infection parameter θ is set to
3 Results
In this section, we explore the connection between the number of infections and daily activities. First, we examine the link between individual activities and the risk of infection. The second part takes a more global approach by considering daily plans (combination of activities) in connection with the risk of infection.
Findings of the following section pertain to a business-as-usual (BAU) scenario with no policy restriction or behavioral change following the surge of the pandemic. The results do not relate to the current pandemic situation in Montreal, Canada.
3.1 Do Activities Contribute Equally to the Spread of COVID-19?
Daily activities contribute unequally to the spread of COVID-19 (Figure 4). In the BAU scenario, simulation outcomes reveal that 91% of infection cases in the CMA of Montreal are due to three activity types. Home, work, and education activities are responsible for 41%, 30%, and 20% of total infections, respectively. Secondary activities, namely: leisures, shopping and other activities, account for less than 6% of infections. The remaining infections, 3%, are attributable to the public transportation system.
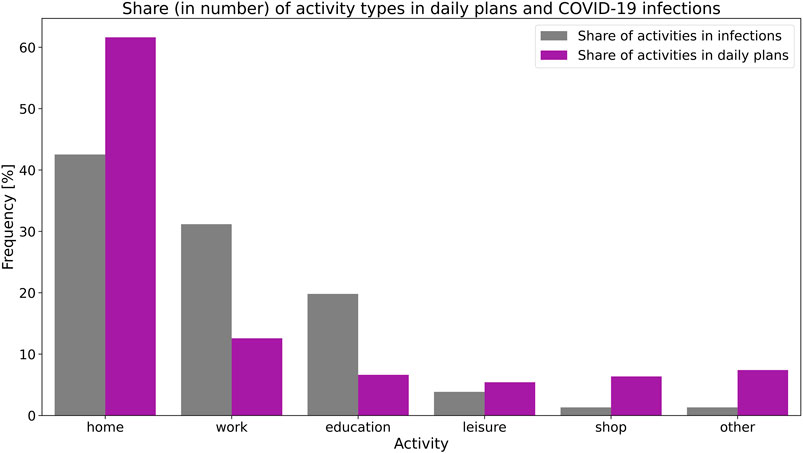
FIGURE 4. Comparison between the share of daily activities in COVID-19 infections and in daily plans (frequency in terms of number/occurence).
There is an imbalance between the share of activities in the daily plans of Montrealers and their contribution to COVID-19 infections. With 20% of daily activities spent, on average, at work and educational activities, these occupations are responsible for 50% of infections. Home and secondary activities are, in contrast, under-represented in infections regarding their shares in daily plans.
3.1.1 Infections During Home Activities
Simulation outcomes show that homes are the primary site of infection (Figure 4). 41% of infections take place at homes. Close and repeated interactions between household members for long hours increase the risk of virus transmission. This is especially true in family households that represent 63% of all households in the CMA of Montreal (Statistics Canada, 2016).
In all home-related infections, the virus is imported from an out-of-home activity, with the exception of the first 10 infected persons used to seed the infection process. The analysis of the first two levels of the infection graph (Figure 5) reveals that in 45% (35% + 10%) of home infections, the virus is introduced by a household member infected in school. In 41% (34% + 7%) of cases, the virus is imported from the workplace. 3% of home infections can be traced back to other cohabitants. Secondary activities are responsible for less than 11% of virus introduction into households (Figure 5).
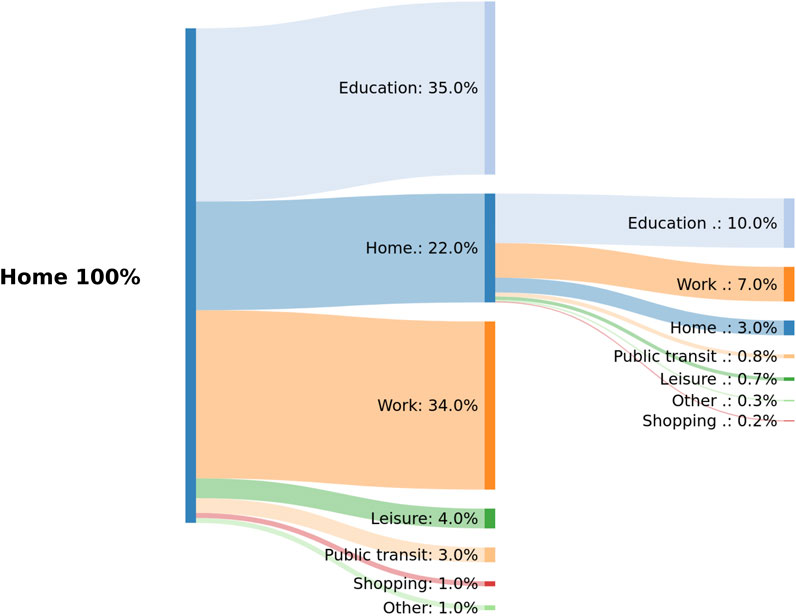
FIGURE 5. Activities responsible for introducing SARS-CoV-2 into homes traced back to two levels.
These findings suggest that the presence of school-aged children, workers, and the size of the household are key factors in the introduction and transmission of the virus in homes. To confirm this assumption, we compute the attack rate, i.e., empirical probability of infection, in households conditional on their number of children, workers, and size
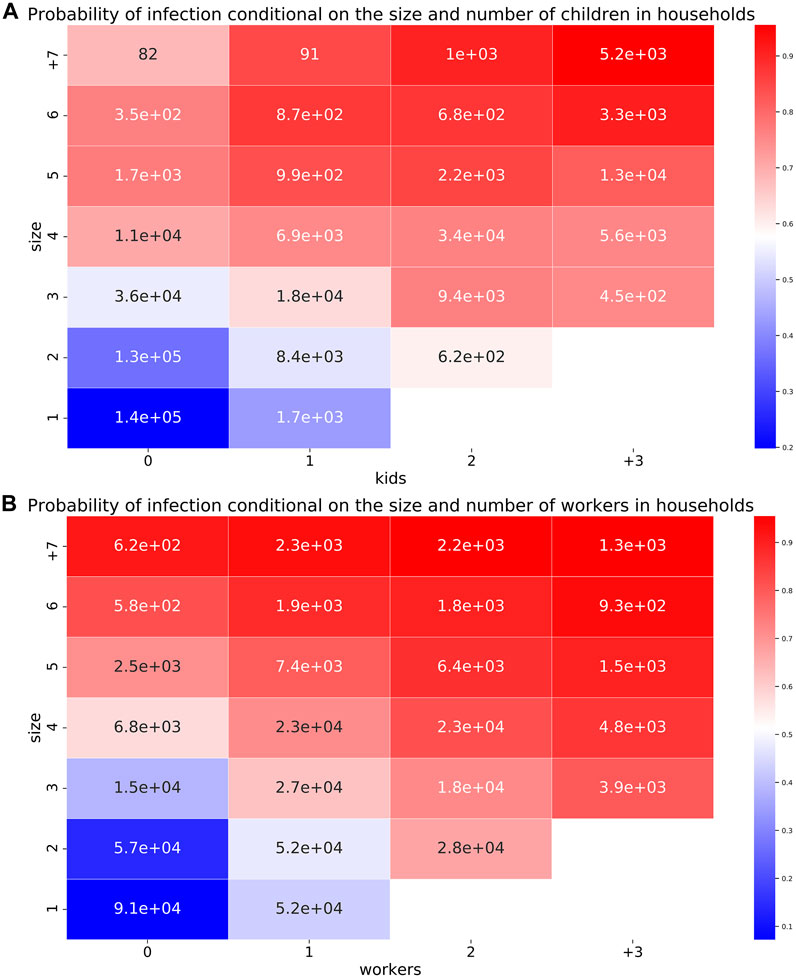
FIGURE 6. Empirical infection probability in households, conditional on their size, number of children (A), and workers (B). The size of the population is displayed inside each cell.
As expected, the probability of infection in households increases with the number of children under the age of 19 years old, workers, and the size of the household. The odds of infection, i.e., the ratio of the probabilities of getting infected to being susceptible, in households of size 5 with three children are 18 times the odds of infection in a one-person household. In households of size 5 with two workers and three children, the odds of infection are 87 times the odds of infection of a non-worker one-person household.
3.1.2 Infections in the Workplace
The workplace is the second major infection site after homes (Figure 4). Work activities often involve repeated interactions with colleagues or customers for long periods of time. This bears the risk of virus transmission and cluster formation. To better understand this risk, infections in the workplace are investigated using the North American Industry Classification System (NAICS) of infected agents.
Findings reveal that the Health care and social assistance sector (NAICS 62) is, by far, the most affected sector (Figure 7). It employs 12% of the workforce in the CMA of Montreal, and it is responsible for 17% of work-related infections. In the second position, the Retail trade economic sector (NAICS 44 and 45) with its 12% of workforce contributes to 11% of infections. 10% of work-related infections are due to Manufacturing (NAICS 31–33) and Professional, scientific and technical services (NAICS 54). These two sectors employ 10% and 9% of the workforce, respectively. Educational services (NAICS 61) are responsible for 7% of work infections, and provide 8% of jobs. Activities relating to Accommodation and food services (NAICS 72), Construction (NAICS 23), and Public administration (NAICS 91) contribute by 5% to infections and to the workforce. Other economic sectors like: Agriculture and farming, Utilities, and Mining offer few jobs, and hardly contribute to work-related infections in Montreal.
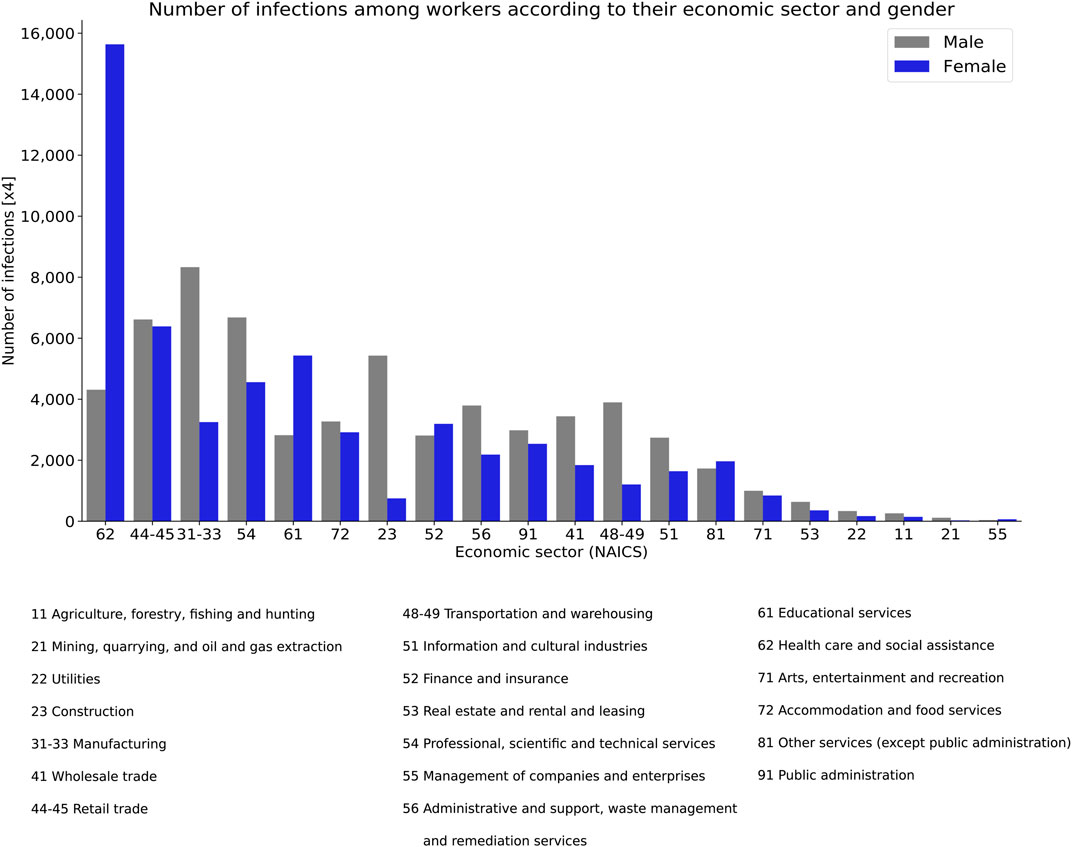
FIGURE 7. Total infections in the workplace by gender and NAICS classification (North American Industry Classification System).
The distribution of workplace infections among men and women follows the distribution of both genders in the job market of Montreal (Figure 7). In the Health care and social assistance sector, the share of women in the workforce and infections is 80% and 78%, respectively. In Educational services, the share of women in the workforce and infections is 68% and 66%, respectively. 88% of workers and infections in the Construction sector are among men. In the Manufacturing sector, the share of men in the workforce and infections is 70% and 72%, respectively.
As regards the incidence rate, i.e., infection probability, in the workplace, three groups of economic sectors can be defined (Figure 8):
1. Health care and social assistance (NAICS 62): with the most highest incidence rate of infection
2. Economic sectors with an incidence rate between 20% and 40%
3. Real estate, rental, and leasing (NAICS 53) with the lowest incidence rate
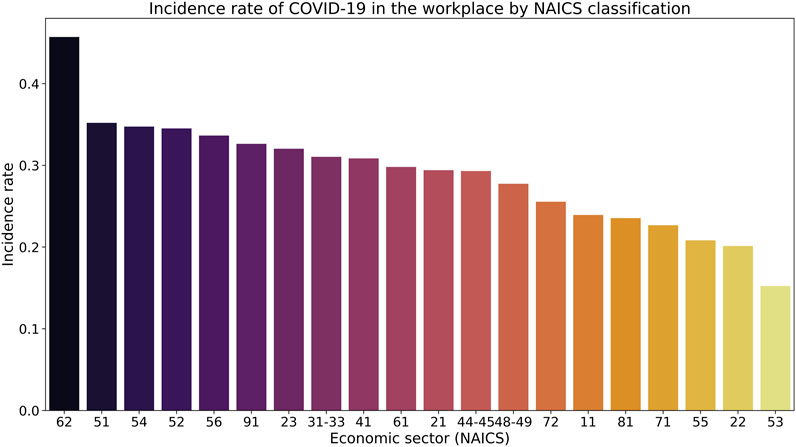
FIGURE 8. Incidence rate of COVID-19 in the workplace by NAICS classification.
These disparities have serious social and economic consequences. For instance, the odds of infection of a health and social worker relative to a worker of finance and insurance, or real estate, rental and leasing are 1.6 and 4.7, respectively.
3.1.3 Infections During Educational Activities
We assume that children and adults have equal infectivity, i.e., capacity to infect others, and susceptibility, i.e., capacity to contract the SARS-CoV-2. Given this assumption, simulation outcomes show that 20% of infections occur during educational activities. 75% of these infections concern students under the age of 19 years old. Given this age distribution, the majority of these infections are mild. However, findings stress that educational facilities are important infection clusters that contribute actively to community transmission (Figure 5).
3.1.4 Infections in Secondary Activities
In comparison with their share in daily plans, the contribution of secondary activities to COVID-19 infections is underrepresented. On average, these activities account for 19% of daily occupations (in number) and 6% of infections. When compared with susceptible agents, infected ones are found to perform more late-ending secondary activities, i.e., ending after 8PM, than the former. 40% of infections in these activities occur during activities ending after 8PM Figure 9.
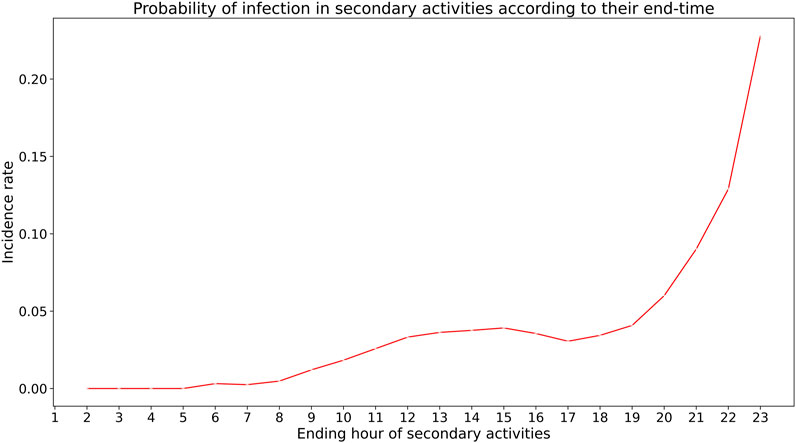
FIGURE 9. Empirical probability of infection in secondary activities according to their end-time.
The examination of the ending time of secondary activities responsible for infections suggests that the probability of infection in secondary activities is higher for late-ending activities than for early ending ones, i.e., ending before 8PM (Figure 9). In other words, late-ending activities are more riskier in terms of infection than early-ending ones.
3.1.5 Infections in the Public Transportation System
In addition to infections occurring during activities, a relatively limited part of infections is directly attributable to trips joining these activities. We only consider infections taking place in the public transportation system. 3% of infections can be traced back to the transit system. Half of these infections occur during the morning (6–9AM) and evening (4–6PM) rush periods.
Regarding the safety of using public transportation, simulation results indicate that, in the BAU scenario, the probability of getting infected in public transit is 4.2%, meaning 42 infected agents for every 1,000 transit users.
3.2 Daily Plans and the Risk of Infection
In the previous section, we highlight the link between individual activities and COVID-19 infections. This section broadens the scope to explore the connection between daily plans (combination of activities) and the risk of infection. For this purpose, we retain three dimensions to describe daily plans:
1. Number of out-of-home activities
2. Total duration of out-of-home activities
3. Spatial distribution of out-of-home activities.
The focus on out-of-home activities is motivated by their direct or indirect responsibility for almost all virus introductions and transmissions as shown in the previous section.
3.2.1 Number of Activities
In the CMA of Montreal, simulation results show that 59% of infections occur during out-of-home activities, and all virus transmission can be traced back to out-of-home activities (Figures 4, 5). In this regard, one can assume that the risk of infection of an agent is positively correlated with its number of out-of-home activities. The more activities the agent performs outside of home, the higher the risk of contracting the virus.
Findings show that the average number of out-of-home activities of susceptible and infected agents is 1.15, 1.77 activity per day, respectively. However, when agents not performing any out-of-home activity during the simulation are excluded from the analysis, the probability of infection seems not to depend on the number of out-of-home activities. Instead, the risk of infection slightly decreases with this number among agents performing at least one out-of-home activity per day (Figure 10).
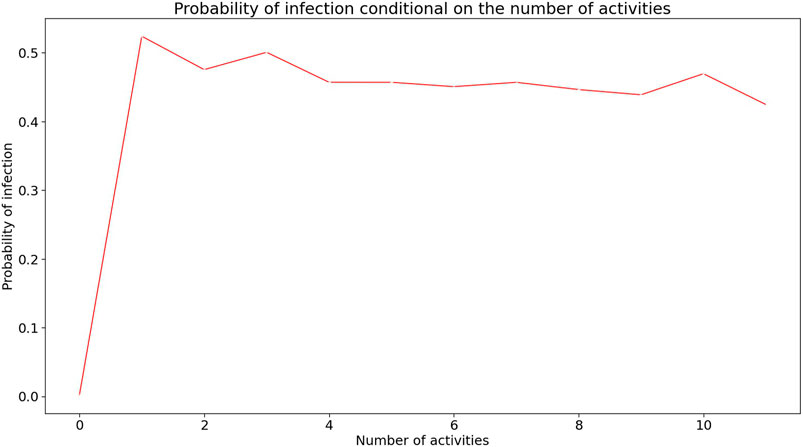
FIGURE 10. Risk of infection conditional on the number of out-of-home activities in daily plans. Observations with less than 100 records are not included in the analysis.
3.2.2 Duration of Activities
By design, the risk of infection during an activity is exponentially dependent on its duration (Eq. 1). Longer activities bear more risk of infection to an agent than shorter activities, everything else being equal. In the case study of Montreal, simulation outcomes indicate that infected agents spend more time in out-of-home activities than non infected agents (Figure 11). The median daily duration of out-of-home activities among infected and susceptible agents is 8 h 25 min and 6 h 40 min, respectively. Figure 11 shows that the duration of 7 h 30 min is a tipping point in the infection probability distribution. More than 50% of susceptible agents spend less than 7.5 h outside home. In contrast, only 25% of infected agents spend less than 7.5 h outside home.
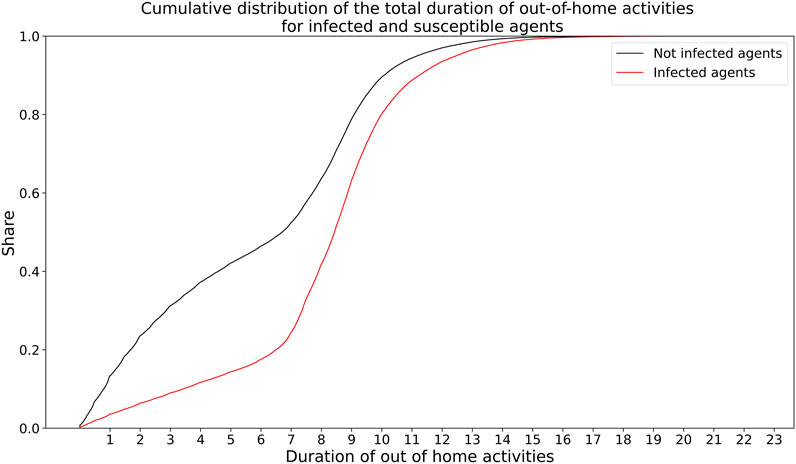
FIGURE 11. Cumulative distribution of the total duration of out-of-home activities for infected and susceptible agents.
3.3 Spatial Clusters of Infections
To examine the spatial distribution of infections in Montreal, we use the rate of infection computed at the census tract level using the home location of infected agents. The infection rate is the ratio of the number of infections to population. In the CMA of Montreal, the spatial distribution of this rate is found to be non random. The Moran’s index of spatial autocorrelation test rejects (

FIGURE 12. Spatial clusters of the infection rate at the census tract level in Montreal. Panel (A): local Moran’s statistic at
The investigation of the location of infection clusters, using the local Moran’s statistic (LISA) (Anselin, 1995), reveals that the Central Business District (CBD) of Montreal is a cold cluster with a low rate of infection [graphic (A) in Figure 12]. This means that the census tracts (CT) in the CBD have a low rate of infection and have neighbors with also a low infection rate. On the contrary, the north-east and south-ouest areas are hot clusters with a high infection rate [graphic (A) in Figure 12].
4 Discussion and Policy Implications
4.1 Role of Home, Work, and School in COVID-19 Transmission
Findings on the prevalence of home-related infections are concordant with conclusions from Bi et al. (2020); Leclerc et al. (2020); Li et al. (2020); Liu et al. (2020a); Liu et al. (2020b); Scientific Advisory Group for Emergencies (2020); Shen et al. (2020); WHO (2020b); Galmiche et al. (2021). These studies suggest that households are an important contributor to virus transmission. This is especially true in large households with school-aged children (Scientific Advisory Group for Emergencies, 2020; Martin et al., 2020; Bravata et al., 2021; Galmiche et al., 2021; Vlachos et al., 2021).
Simulation results show that the workplace is the second major source of infection. This finding is confirmed by different studies and observations that highlight the significance of work-related infections (Direction Régionale de la Santé Publique de Montréal, 2020; Institut national de santé publique du Québec (INSPQ), 2020b; Lan et al., 2020; Galmiche et al., 2021; Nash et al., 2021). As of the first of December 2020, 48% and 22% of all active COVID-19 outbreaks in the census division (CD) of Montreal took place in the healthcare system and other workplaces, respectively (Direction Régionale de la Santé Publique de Montréal, 2020).
At the time of writing this paper, the role played by schools and school-aged children in community transmission is still controversial [see European Center for Disease Prevention and Control (ECDC) (2020) for an exhaustive review on the subject]. Studies suggest that where transmission levels are low, school openings do not significantly increase the risk of community transmission (Falk et al., 2021; Zimmerman et al., 2021), and where transmission levels are high, schools can significantly contribute to community transmission (European Center for Disease Prevention and Control (ECDC), 2020; Keeling et al., 2021). Furthermore, empirical data shows that the presence of school-aged children increases the risk of infection in households (Bravata et al., 2021; Gold et al., 2021). This is in line with our findings related to the BAU scenario where community transmission is high. In this case, our research emphasizes the role of schools, especially primary and secondary institutions, in community transmission.
4.2 COVID-19, Work, Gender, and Social Inequities
Findings indicate that the incidence rate of infections in the workplace differs according to the economic sector. This is in line with previous research and observations (Institut Pasteur, 2020; Institut national de santé publique du Québec (INSPQ), 2020b; Contreras et al., 2021). Health and social assistance workers are the most vulnerable toward COVID-19. All studies and infection records acknowledge the prevalence of COVID-19 among healthcare workers (HCW) (Canadian Institute for Health Information (CIHI), 2020; Chen et al., 2020; Direction Régionale de la Santé Publique de Montréal, 2020; Nguyen et al., 2020). As of July 2020, the incidence rate among HCW and the total population, in Canada, was 19% and 3%, respectively (Canadian Institute for Health Information (CIHI), 2020; Public Health Agency of Canada, 2020). Data also support the varying prevalence of COVID-19 infections according to the economic sector. Manufacturing, retail, wholesale, and warehouse industries are often found to have higher numbers of COVID-19 outbreaks than the rest of economic sectors (Institut Pasteur, 2020; Lan et al., 2020; Institut national de santé publique du Québec (INSPQ), 2020b; Contreras et al., 2021). Real estate, rental, leasing, finance and insurance are often found to have low incidence rates (Contreras et al., 2021). These discrepancies are likely to worsen with the enforcement of restrictive policy measures. Actually, in most affected countries, work activities have been limited to essential businesses, including health and social assistance and educational services.
In addition to the unequal COVID-19 exposure of workers from different economic sectors, their sociodemographic characteristics are also at play in determining their risk of infection by SARS-CoV-2. In Montreal, as well as in Canada and other countries, women are overrepresented among health and social assistance workers (Statistics Canada, 2016; Boniol et al., 2019). As a consequence, most infections in this sector are among women. This result is supported by several studies and pandemic reports (Bandyopadhyay et al., 2020; Mutambudzi et al., 2020; Zheng et al., 2020). Outside of work, simulation results indicate that the number of infections among women is higher than that of men in shopping activities (58% of infections), other activities like escorting kids (54% of infections), and public transit (53% of infections). This is due to the overrepresentation of women in these activities.
4.3 Why Is There an Imbalance in the Relative Contribution of Activities to Infections?
Findings from the BAU scenario support that most infection cases are attributable to primary activities: home, work, and education. In contrast, secondary activities are only responsible for a limited part of infections, despite their non-marginal average share in daily activity plans of Montrealers. This is due to the non-uniform distribution of activity durations. By design, the risk of infection during an activity depends on its duration (Eq. 1). In the CMA of Montreal, and most likely in other metropolitan areas, individuals spend more time in primary activities than in secondary ones during an ordinary working day. Consequently, primary activities bear more risk of infection than secondary ones, everything else being equal. In the case of Montreal, 77% of the cumulative activity time is spent at home, 13% at work, 6% at school, 2% in leisure activities, and the remaining at shopping and other activities. Given this duration distribution, it is expected for primary activities to outweigh secondary ones as a source of infection.
This research demonstrates that in the absence of policy interventions and behavioral change, primary activities and particularly work and educational occupations play a critical role in community transmission of the virus. These two activities are responsible for most COVID-19 infections, either directly (infections during the activity), or indirectly (virus introduction into households).
From a policy perspective, these two activities require careful attention and monitoring, especially where community transmission is high. With the enactment of policy restrictions on non-essential activities, massive teleworking, and school reopening, it is likely that the relative share of daily activities in infections will change. In this context, an increase in the relative share of home and school infections and a decrease in work-related infections are expected.
4.4 What Is More Riskier: Many Out-Of-Home Daily Activities or Longer Ones?
Findings reveal that the infection risk depends more on the duration of out-of-home activities than on their number. Simulation outcomes reject the assumption of a positive correlation between the risk of infection and the number of out-of-home activities in the daily plans of agents performing at least one out-of-home activity. As the number of these activities increases, the risk of infection slightly decreases. Given the 24 h constraint on daily activities, an increase in their number reduces, inevitably, their average duration (Figure 13). In daily plans with one out-of-home activity, the average duration of this activity is 6 h and 45 min. In daily plans with five out-of-home activities, the average duration of these activities is 1 h and 20 min. An increase in the number of out-of-home activities induces a decrease in their corresponding infection risk.
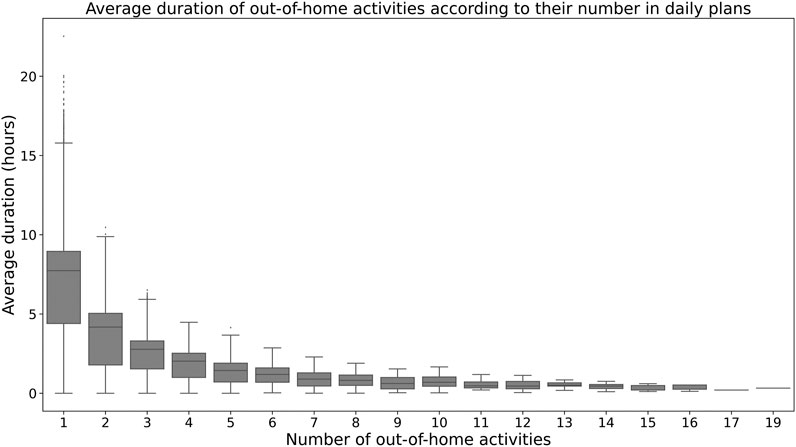
FIGURE 13. Distribution of the average duration of out-of-home activities according to their number in daily plans in the population of Montreal.
The above conclusion does not hold for agents who do not perform any out-of-home activity. For these agents, the probability of infection is nearly zero. With the introduction of at least one out-of-home activity in their daily plan (a work-related activity, for example), the probability of infection escalates to nearly 50%.
From a policy perspective, this finding suggests that more emphasis should be put on the reduction of the duration of out-of-home activities than their number. In practice, such a policy is difficult to implement. Instead, several governments and local authorities have resorted to extensive activity restrictions or total lockdowns to indiscriminately control the number and the duration of all out-of-home activities.
4.5 Why do Most Infections in Secondary Activities Occur Late in the Day?
Results suggest that the probability of infection in secondary activities is higher for late ending activities, i.e., ending after 8PM, than for early ending ones (Figure 9). This is mainly due to the distribution of the duration of secondary activities over the day. On average, late-ending secondary activities last longer than early-ending ones (Figure 14).
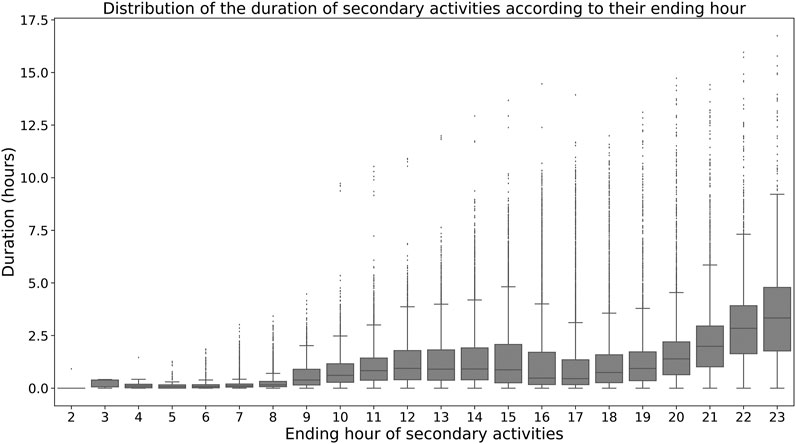
FIGURE 14. Duration of secondary activities according to their ending hour.
This result is of interest to the enactment of nighttime activity restrictions. In many countries, nighttime curfews were imposed to limit the spread of the virus through non-essential activities. Data on how individuals engage in activities and for how long can help policy and health authorities set appropriate curfew hours.
4.6 Business Closures
Policy interventions should adapt to the reality of the job market and to the distribution of infections across economic sectors. In absolute and relative terms, the infection risk is more prevalent in some economic sectors than others. This calls for different control policies for different economic sectors (Figure 8). If the aim of health authorities is to limit the burden on hospitals, then maintaining open economic sectors with low infection risk would be less problematic and more manageable by the health system than for other sectors. In the case of the CMA of Montreal, an example of these businesses can be identified in the right side of Figure 8 (NAICS 51 and forth). For these sectors, a total shutdown, as what has been observed here and there, might be unjustifiable from a health perspective with dire economic and social consequences on workers.
4.7 Infection in Public Transit
Simulation outcomes highlight the low risk of infection in the transit system. This finding is in agreement with other studies from China, France, Japan, and the United States (Hu et al., 2020; Institut Pasteur, 2020; Galmiche et al., 2021; Nash et al., 2021). Nevertheless, tracing back infections to transit is difficult (Institut Pasteur, 2020; Galmiche et al., 2021). This may understate the contribution of transit to the transmission of the virus.
When prevention and control measures are adopted by transit agencies, the risk of infection in transit should be lower than our estimate (4.2%). Despite this fact, data from various metropolitan areas show a sharp decline and a slow recovery in transit ridership between March and December 2020 (Google, 2020). Besides the economic slowdown and massive teleworking, this decline is also due to a persistent fear of contagion in public transportation systems (Tan and Ma, 2021). In this regard, transit agencies need to address this psychological barrier to regain their users and ensure their financial viability.
4.8 How Census Data Can Help Limit Infections?
This research underlines the positive correlation between the risk of infection in households, their size, their number of children, and workers. This finding is confirmed by different observations and studies that also add to this finding by highlighting the prevalence of the virus among low-income communities and immigrants (Figueroa et al., 2020; Institut Pasteur, 2020; Stefanelli et al., 2020; Toronto Public Health, 2020; Martin et al., 2020). Given this pattern and with the support of basic census data, this information can help identify, in advance, vulnerable communities and neighborhoods to closely monitor their health and prevent uncontrollable outbreaks.
5 Conclusion
Daily activities and mobility dynamics are key factors to the surge of COVID-19. Close interactions involved by certain daily activities play a central role in the transmission of the virus. The travel required by the spatial distribution of activities helps spread the virus from one place to another. Aware of their critical role, governments supported by health authorities have controlled, restricted, and even banned activities and travel in critical circumstances. However, the connection between everyday activities, the travel they require, and the dynamics of virus transmission is not yet clear. This research contributes to answering the question of how daily activities, their distribution in space and time, and the characteristics of the individuals involved in them contribute to the current pandemic.
To address this question we rely on an agent-based approach and two models: MATSIM and EPISIM. MATSIM provides rich data on daily activity and mobility events of each agent in the population. EPISIM exploits these data to reconstruct the spatial and dynamic social contact networks and simulates the spread of the virus in these networks. This approach has already been proven operational and informative. The case study of Montreal in Canada and a business-as-usual (BAU) scenario with no policy intervention or behavioral change are used to address the research question.
Findings from this research contribute to our understanding of the current pandemic and provide useful policy implications. In the BAU scenario, home, work, and educational activities are responsible for the majority of infection cases. Secondary activities, like leisure or shopping have a lesser role in the spread of the virus than primary activities. This is in line with the total time spent at each of these activity types on a daily basis. The introduction of the virus into homes is mainly due to school-aged and working household members. This finding has interesting policy implications both for the control of risky activities and the monitoring of highly exposed and vulnerable communities.
The risk of infection in the workplace depends on the economic sector. Some workers are more exposed to SARS-CoV-2 than others. Healthcare workers are, by far, the most vulnerable toward this disease. The distribution of workplace infections among men and women depicts the distribution of both genders in the job market. In sectors like health and social assistance or education, women are overrepresented than men, and consequently most infections in these sectors are among women. In other sectors, like manufacturing, construction, transportation, or warehouse, the number of male workers outweighs that of women and so does the number of infections among men. These disparities persist even outside of the workplace to the detriment of women. This situation is likely to be exacerbated with the enactment of uniform or blanket policy interventions as what has been observed in different countries. This calls for scrutiny and comprehensiveness in the enactment of mitigation measures.
The varying risk of infection in different economic sectors requires policy interventions to adapt to this reality. The shutdown and opening of businesses should take into account the infection risk involved by each specific industry. With the exception of essential businesses, closures and openings have often been imposed without distinction. Yet, it is more efficient, if not just, to adapt these policies in order to limit their social and economic consequences.
Secondary activities contribute to the transmission of the SARS-CoV-2, but to a lesser degree when compared with primary activities. Late-ending secondary activities are riskier than early-ending ones for that they last longer. In critical situations, the limitation or even the restriction of certain risky long secondary activities can be effective in limiting the spread of the virus and less harsh than a restriction of all secondary activities.
6 Limitations and Future Work
This research has several limitations. The most critical one relates to the exclusive use of weekday activity and mobility data. The activity and mobility dynamics of the synthetic population of Montreal replicate weekday observations. For this research, data on weekend activities and travel were unavailable. This shortcoming has noteworthy implications on our findings. Weekend activities and mobility patterns are likely to be different from weekday patterns. Often, more time is spent at secondary and home-based activities on weekends than on weekdays. Conversely, work and school activities are less conducted on weekends than weekdays. Consequently, the use of weekday activity data is likely to overestimate the contribution of work and school activities in infections and underestimate that of secondary activities. To address this shortcoming, future work will include data on weekend activity and travel habits.
The yearlong invariance of daily activity plans is also a limitation of this research. For lack of data on the seasonal variability of activities, we assume that agents carry out the same activity program all year round. Changes in daily activities involved by seasons or holidays (winter or summer breaks, for example) are not included. In particular, we do not consider school or work holidays. This limitation is likely to overestimate the share of primary activities relative to secondary ones in infection cases. To overcome this limitation, panel or longitudinal data describing the variability over months of travel and activity behaviors are needed.
Another limitation of our work is the use of a synthetic population. For confidentiality reasons, exhaustive and representative data on the population are unavailable. This limitation is common to almost all agent-based models. Moreover, the synthetic population of Montreal is prepared using 2013 household travel survey (HTS) data. We implicitly assume that the 2013 activity and mobility behaviors of Montrealers are representative of those of 2020. Early results from the latest 2018 HTS suggest that this assumption is unlikely to have important implications on our conclusions (Transport Métropolitain (ARTM), 2020).
To limit the computational burden of simulation, a random sample of the total synthetic population is used. In this paper, our findings are based on a random sample of 25%. Findings on the total number of infections are weighed by a coefficient of 4 to match the total population. Future research is needed to assess the sensitivity of the outcomes toward the size of the sample and the random sampling procedure.
For lack of data on contact intensity between agents, i.e., interaction closeness, we assume the same intensity for all interactions, except those involved by leisure activities and among healthcare workers. Yet, it is expected that friends interact more closely than work colleagues do, for example. For workers, this intensity varies also according to the economic sector and even within the same sector. To address this limitation, passive data, like COVID-19 contact tracing phone application data, can help quantify the interaction intensity between people.
In the infection model, we assume that agents have a constant and equal maximum number of contacts. This assumption is questionable as the number of daily contacts varies among agents according to their sociodemographic characteristics, time of day, interaction location type, season, etc. If available, more accurate data can be integrated within the EPISIM framework to model the maximum number of contacts.
For lack of data on patient(s)-zero, the detailed process of disease import is not included in our research. We randomly draw 10 agents from the population to initiate the infection process. However, the number of patients-zero, their interactions with other agents, and the date of their introduction in the population can play an important role in the dynamics of the pandemic (Manout et al., 2020).
Our findings are based on a hypothetical scenario where no policy mitigation measure is introduced and where agents do not adapt their travel and activity behaviors. This scenario does not depict the ongoing pandemic situation of Montreal. Future work is needed to understand how individuals and households have adapted their travel and activities during the pandemic and in response to varying and evolving policy measures.
At the time of writing this paper, there was no consensus on the role of school-aged children in virus transmission (Davies et al., 2020; Hyde, 2020; Puntis, 2020; Munro and Faust, 2020b; Flasche and Edmunds, 2021). In this paper, we assume that children and adults have the same infectivity and susceptibility to COVID-19. However, recent studies suggest that children have lower infectivity, susceptibility, and probability of showing COVID-19 symptoms than adults (Munro and Faust, 2020a; Munro and Faust, 2020b; Dattner et al., 2021; Zimmerman et al., 2021). In light of this new evidence, future work will include an update of the parameters of the infection and progression models used in this research.
Finally, we could not perform the external validation of some of our findings for lack of convenient observations or previous studies. For example, the external validation of the link between the number of out-of-home activities, their duration, and the risk of infection needs disaggregated data on individual infection cases and their circumstances. To date, these data are unavailable. These findings can serve as starting assumptions of future work.
Data Availability Statement
The synthetic population of Montreal and all the input data of EPISIM can be made available upon request. Requests to access these datasets should be directly addressed to: - HTS: Transportation agency of Montreal (ARTM,cmVjZXB0aW9uQGFydG0ucXVlYmVj) - Car ownership: Quebec Car insurance Company (SAAQ,ZG9ubmVlcy5vdXZlcnRlc0BzYWFxLmdvdXYucWMuY2E=) - Housing data: the Ministry of Housing (MAMO,ZG9ubmVlc291dmVydGVzQG1vbnRyZWFsLmNh).
Author Contributions
Both authors contributed to the definition of the research question. OM was responsible for data collection, computer simulations and the writing and revision of the manuscript. FC contributed to the discussion of the assumptions and the results and to the writing and revision of the manuscript.
Funding
Both authors benefit from an IVADO grant. OM benefits also from a grant from the Région Auvergne Rhône-Alpes (AURA), France (Pack Ambition International 19008027 01-157130). IVADO and AURA had no role or responsibility in this research.
Conflict of Interest
The authors declare that the research was conducted in the absence of any commercial or financial relationships that could be construed as a potential conflict of interest.
Acknowledgments
The authors are grateful to the two reviewers of the paper. Their comments and suggestions improved this research. The authors would like to thank the development teams of MATSIM, EPISIM, and EQASIM.
Footnotes
1In the following, SARS-CoV-2 and COVID-19 are used interchangeably.
References
Ajelli, M., Gonçalves, B., Balcan, D., Colizza, V., Hu, H., Ramasco, J. J., et al. (2010). Comparing Large-Scale Computational Approaches to Epidemic Modeling: Agent-Based versus Structured Metapopulation Models. BMC Infect. Dis. 10. doi:10.1186/1471-2334-10-190
Almagor, J., and Picascia, S. (2020). Exploring the Effectiveness of a COVID-19 Contact Tracing App Using an Agent-Based Model. Sci. Rep. 10, 1–11. doi:10.1038/s41598-020-79000-y
Arthur, R. F., Gurley, E. S., Salje, H., Bloomfield, L. S. P., and Jones, J. H. (2017). Contact Structure, Mobility, Environmental Impact and Behaviour: The Importance of Social Forces to Infectious Disease Dynamics and Disease Ecology. Phil. Trans. R. Soc. B 372, 20160454. doi:10.1098/rstb.2016.0454
Badr, H. S., Du, H., Marshall, M., Dong, E., Squire, M. M., and Gardner, L. M. (2020). Association between Mobility Patterns and COVID-19 Transmission in the USA: A Mathematical Modelling studyThe Lancet. Lancet Infect. Dis. 20, 1247–1254. doi:10.1016/S1473-3099(20)30553-3
Baicker, K., Dube, O., Mullainathan, S., Pope, D., and Wezerek, G. (2020). Is it Safer to Visit a Coffee Shop or a Gym? the New York Times. Available at: https://www.nytimes.com/interactive/2020/05/06/opinion/coronavirus-us-reopen.html (Accessed January 10, 2021).
Bandyopadhyay, S., Baticulon, R. E., Kadhum, M., Alser, M., Ojuka, D. K., Badereddin, Y., et al. (2020). Infection and Mortality of Healthcare Workers Worldwide from COVID-19: A Systematic Review. BMJ Glob. Health 5, e003097. doi:10.1136/bmjgh-2020-003097
Bi, Q., Wu, Y., Mei, S., Ye, C., Zou, X., Zhang, Z., et al. (2020). Epidemiology and Transmission of COVID-19 in 391 Cases and 1286 of Their Close Contacts in Shenzhen, China: a Retrospective Cohort Study. Lancet Infect. Dis. 20, 911–919. doi:10.1016/S1473-3099(20)30287-5
Blavatnik School of Government (2021). Coronavirus Government Response Tracker. Available at: https://www.bsg.ox.ac.uk/research/research-projects/coronavirus-government-response-tracker (Accessed January 10, 2021).
Boniol, M., McIsaac, M., Xu, L., Wuliji, T., Diallo, K., and Campbell, J. (2019). Gender Equity in the Health Workforce: Analysis of 104 Countries. World Health Organization WHO/HIS/HWF/Gender/WP1/2019.1.
Bravata, D., Cantor, J., Sood, N., and Whaley, C. (2021). Back to School: The Effect of School Visits during COVID-19 on COVID-19 Transmission. National Bureau of Economic Research. doi:10.3386/w28645
Canadian Institute for Health Information (CIHI) (2020). COVID-19 Cases and Deaths Among Health Care Workers in Canada CIHI. Available at: https://www.cihi.ca/en/covid-19-cases-and-deaths-among-health-care-workers-in-canada (Accessed January 12, 2021).
Centers for Disease Control and Prevention (Cdc), (2020). Personal and Social Activities. Available at: https://www.cdc.gov/coronavirus/2019-ncov/daily-life-coping/personal-social-activities.html (Accessed January 11, 2021).
Chang, S., Pierson, E., Koh, P. W., Gerardin, J., Redbird, B., Grusky, D., et al. (2020). Mobility Network Models of COVID-19 Explain Inequities and Inform Reopening. Nature 589, 82–87. doi:10.1038/s41586-020-2923-3
Chen, Y., Tong, X., Wang, J., Huang, W., Yin, S., Huang, R., et al. (2020). High SARS-CoV-2 Antibody Prevalence Among Healthcare Workers Exposed to COVID-19 Patients. J. Infect. 81, 420–426. doi:10.1016/j.jinf.2020.05.067
Chinazzi, M., Davis, J. T., Ajelli, M., Gioannini, C., Litvinova, M., Merler, S., et al. (2020). The Effect of Travel Restrictions on the Spread of the 2019 Novel Coronavirus (COVID-19) Outbreak. Science 368, 395–400. doi:10.1126/science.aba9757
Contreras, Z., Ngo, V., Pulido, M., Washburn, F., Meschyan, G., Gluck, F., et al. (2021). Industry Sectors Highly Affected by Worksite Outbreaks of Coronavirus Disease, Los Angeles County, California, USA, March 19-September 30, 2020. Emerg. Infect. Dis. 27, 1769–1775. doi:10.3201/eid2707.210425
Dattner, I., Goldberg, Y., Katriel, G., Yaari, R., Gal, N., Miron, Y., et al. (2021). The Role of Children in the Spread of COVID-19: Using Household Data from Bnei Brak, israel, to Estimate the Relative Susceptibility and Infectivity of Children. Plos Comput. Biol. 17, e1008559. doi:10.1371/journal.pcbi.1008559
Davies, N. G., Klepac, P., Liu, Y., Prem, K., Jit, M., Pearson, C. A. B., et al. (2020). Age-dependent Effects in the Transmission and Control of COVID-19 Epidemics. Nat. Med. 26, 1205–1211. doi:10.1038/s41591-020-0962-9
Direction Régionale de la Santé Publique de Montréal, (2020). Rapport hebdomadaire des éclosions actives sur l’Île de montréal : 15 décembre 2020. Available at: https://santemontreal.qc.ca/population/coronavirus-covid-19/situation-du-coronavirus-covid-19-a-montreal/#c49292. (Accessed June 29, 2021).
Epstein, J. M., Goedecke, D. M., Yu, F., Morris, R. J., Wagener, D. K., and Bobashev, G. V. (2007). Controlling Pandemic Flu: The Value of International Air Travel Restrictions. PLOS ONE 2, e401. doi:10.1371/journal.pone.0000401
European Centre for Disease Prevention and Control (ECDC) (2020). COVID-19 in Children and the Role of School Settings in Transmission - First Update. Available at: https://www.ecdc.europa.eu/en/publications-data/children-and-school-settings-covid-19-transmission (Accessed June 29, 2021).
Falk, A., Benda, A., Falk, P., Steffen, S., Wallace, Z., and Høeg, T. B. (2021). COVID-19 Cases and Transmission in 17 K-12 Schools - Wood County, Wisconsin, August 31-November 29, 2020. MMWR Morb. Mortal. Wkly. Rep. 70. doi:10.15585/mmwr.mm7004e3
Figueroa, J. F., Wadhera, R. K., Lee, D., Yeh, R. W., and Sommers, B. D. (2020). Community-level Factors Associated with Racial and Ethnic Disparities in COVID-19 Rates in massachusetts. Health Aff. 39, 1984–1992. doi:10.1377/hlthaff.2020.01040
Flasche, S., and Edmunds, W. J. (2021). The Role of Schools and School-Aged Children in SARS-CoV-2 Transmission. Lancet Infect. Dis. 21, 298–299. doi:10.1016/s1473-3099(20)30927-0
Frias-Martinez, E., Williamson, G., and Frias-Martinez, V. (2011). “An Agent-Based Model of Epidemic Spread Using Human Mobility and Social Network Information,” in 2011 ieee third international conference on privacy, security, risk and trust and 2011 ieee third international conference on social computing, October 9–11, 2011, (Boston, MA: IEEE), 57–64. doi:10.1109/PASSAT/SocialCom.2011.142
Galmiche, S., Charmet, T., Schaeffer, L., Grant, R., Fontanet, A., Paireau, J., et al. (2021). Etude des facteurs sociodémographiques, comportements et pratiques associés à l’infection par le SARS-CoV-2 (ComCor). Institut Pasteur ; Caisse Nationale d’Assurance Maladie ; IPSOS ; Institut Pierre Louis d’Epidémiologie et de Santé Publique (IPLESP) ; Santé Publique France. Available at: https://hal-pasteur.archives-ouvertes.fr/pasteur-03155847 (Accessed June 29, 2021).
Gaudou, B., Huynh, N. Q., Philippon, D., Brugière, A., Chapuis, K., Taillandier, P., et al. (2020). COMOKIT: A Modeling Kit to Understand, Analyze, and Compare the Impacts of Mitigation Policies against the COVID-19 Epidemic at the Scale of a City. Front. Public Health 8. doi:10.3389/fpubh.2020.563247
Gold, J. A. W., Gettings, J. R., Kimball, A., Franklin, R., Rivera, G., Morris, E., et al. (2021). Clusters of SARS-CoV-2 Infection Among Elementary School Educators and Students in One School District - Georgia, December 2020-January 2021. MMWR Morb. Mortal. Wkly. Rep. 70, 289–292. doi:10.15585/mmwr.mm7008e4
Google (2020). COVID-19 Community Mobility Report. COVID-19 Community Mobility Report. Available at: https://www.google.com/covid19/mobility?hl=en (Accessed December 13, 2020).
Government of Canada, (2020). Risk Mitigation Tool for Outdoor Recreation Spaces and Activities Operating during the COVID-19 Pandemic. Available at: https://www.canada.ca/en/public-health/services/diseases/2019-novel-coronavirus-infection/guidance-documents/risk-mitigation-tool-outdoor-recreation-spaces-activities-operating-covid-19.html (Accessed January 11, 2021).
Grais, R. F., Hugh Ellis, J., and Glass, G. E. (2003). Assessing the Impact of Airline Travel on the Geographic Spread of Pandemic Influenza. Eur. J. Epidemiol. 18, 1065–1072. doi:10.1023/a:1026140019146
Hawkins, D. (2020). Differential Occupational Risk for COVID‐19 and Other Infection Exposure According to Race and Ethnicity. Am. J. Ind. Med. 63, 817–820. doi:10.1002/ajim.23145
Heinzerling, A., Stuckey, M. J., Scheuer, T., Xu, K., Perkins, K. M., Resseger, H., et al. (2020). Transmission of COVID-19 to Health Care Personnel during Exposures to a Hospitalized Patient - Solano County, California, February 2020. MMWR Morb. Mortal. Wkly. Rep. 69, 472–476. doi:10.15585/mmwr.mm6915e5
Hörl, S., and Balać, M. (2020). Open Data Travel Demand Synthesis for Agent-Based Transport Simulation: A Case Study of paris and Île-De-france. Preprint. doi:10.3929/ETHZ-B-000412979
Hoertel, N., Blachier, M., Blanco, C., Olfson, M., Massetti, M., Rico, M. S., et al. (2020). A Stochastic Agent-Based Model of the SARS-CoV-2 Epidemic in france. Nat. Med. 26, 1417–1421. doi:10.1038/s41591-020-1001-6
Horni, A., Nagel, K., and Axhausen, K. (2016). Multi-agent Transport Simulation Matsim (London: Ubiquity Press). doi:10.5334/baw
Hu, M., Lin, H., Wang, J., Xu, C., Tatem, A. J., Meng, B., et al. (2020). Risk of Coronavirus Disease 2019 Transmission in Train Passengers: an Epidemiological and Modeling Study. Clin. Infect. Dis. 72, 604–610. doi:10.1093/cid/ciaa1057
Huang, X., Li, Z., Jiang, Y., Li, X., and Porter, D. (2020). Twitter Reveals Human Mobility Dynamics during the COVID-19 Pandemic. PLOS ONE 15, e0241957. doi:10.1371/journal.pone.0241957
Hyde, Z. (2020). COVID ‐19, Children and Schools: Overlooked and at Risk. Med. J. Aust. 213, 444–446. doi:10.5694/mja2.50823
Institut national de santé publique du Québec (INSPQ) (2020a). Rapport épidémiologique descriptif de la COVID-19 au Québec du 23 février au 11 juillet 2020. Available at: https://www.inspq.qc.ca/publications/3080-rapport-epidemiologique-covid19 (Accessed December 2, 2020).
Institut national de santé publique du Québec (INSPQ) (2020b). Vigie des situations d’éclosion de COVID-19 dans les milieux de travail. INSPQ. Available at: https://www.inspq.qc.ca/covid-19/sante-au-travail/eclosions-travail (Accessed January 12, 2021).
Institut Pasteur, (2020). Study of Socio-Demographic Factors, Behaviors and Practices Associated with Infection with SARS-CoV-2. clinicaltrials.Gov. Available at: https://clinicaltrials.gov/ct2/show/NCT04607941 (Accessed January 7, 2021).
Keeling, M. J., Tildesley, M. J., Atkins, B. D., Penman, B., Southall, E., Guyver-Fletcher, G., et al. (2021). The Impact of School Reopening on the Spread of COVID-19 in england. Phil. Trans. R. Soc. B 376, 20200261. doi:10.1098/rstb.2020.0261
Kermack, W. O., and McKendrick, A. G. (1927). A Contribution to the Mathematical Theory of Epidemics. Proc. R. Soc. Lond. A. 115, 700–721. doi:10.1098/rspa.1927.0118
Kerr, C. C., Stuart, R. M., Mistry, D., Abeysuriya, R. G., Rosenfeld, K., Hart, G. R., et al. (2020). Covasim: An Agent-Based Model of COVID-19 Dynamics and Interventions. Cold Spring Harbor Laboratory Press, MedRxiv. doi:10.1101/2020.05.10.20097469
Konduri, K. C., You, D., Garikapati, V. M., and Pendyala, R. (2016). “Application of an Enhanced Population Synthesis Model that Accommodates Controls at Multiple Geographic Resolutions,” in Proceedings of the 95th annual meeting of the transportation research board, washington, dc, usa, 10–14.
Koo, J. R., Cook, A. R., Park, M., Sun, Y., Sun, H., Lim, J. T., et al. (2020). Interventions to Mitigate Early Spread of SARS-CoV-2 in singapore: A Modelling Study. Lancet Infect. Dis. 20, 678–688. doi:10.1016/s1473-3099(20)30162-6
Lan, F.-Y., Wei, C.-F., Hsu, Y.-T., Christiani, D. C., and Kales, S. N. (2020). Work-related COVID-19 Transmission in Six Asian Countries/areas: A Follow-Up Study. PLOS ONE 15, e0233588. doi:10.1371/journal.pone.0233588
Leclerc, Q. J., Fuller, N. M., Knight, L. E., Funk, S., and Knight, G. M. (2020). What Settings Have Been Linked to SARS-CoV-2 Transmission Clusters? Wellcome Open Res. 5, 83. doi:10.12688/wellcomeopenres.15889.2
Lee, B., Hanley, J. P., Nowak, S., Bates, J. H. T., and Hébert-Dufresne, L. (2020). Modeling the Impact of School Reopening on SARS-CoV-2 Transmission Using Contact Structure Data from Shanghai. BMC Public Health 20, 1–9. doi:10.1186/s12889-020-09799-8
Li, W., Zhang, B., Lu, J., Liu, S., Chang, Z., Peng, C., et al. (2020). Characteristics of Household Transmission of COVID-19. Clin. Infect. Dis. 71, 1943–1946. doi:10.1093/cid/ciaa450
Li, J., Xiang, T., and He, L. (2021). Modeling Epidemic Spread in Transportation Networks: A Review. J. Traffic Transportation Eng. (English Edition) 8, 139–152. doi:10.1016/j.jtte.2020.10.003
Liu, T., Gong, D., Xiao, J., Hu, J., He, G., Rong, Z., et al. (2020a). Cluster Infections Play Important Roles in the Rapid Evolution of Covid-19 Transmission: A Systematic Review. Int. J. Infect. Dis. 99, 374–380. doi:10.1016/j.ijid.2020.07.073
Liu, T., Liang, W., Zhong, H., He, J., Chen, Z., He, G., et al. (2020b). Risk Factors Associated with Covid-19 Infection: A Retrospective Cohort Study Based on Contacts Tracing. Emerging Microbes & Infections 9, 1546–1553. doi:10.1080/22221751.2020.1787799
Ludvigsson, J. F. (2020). Children Are Unlikely to Be the Main Drivers of the COVID‐19 Pandemic - A Systematic Review. Acta Paediatr. 109, 1525–1530. doi:10.1111/apa.15371
Madewell, Z. J., Yang, Y., Longini, I. M., Halloran, M. E., and Dean, N. E. (2020). Household Transmission of SARS-CoV-2. JAMA Netw. Open 3, e2031756. doi:10.1001/jamanetworkopen.2020.31756
Manout, O., El-Megzari, I., and Ciari, F. (2020). Modeling the Covid-19 Pandemic: A Sensitivity Analysis on Input Data Using Agent-Based Transportation Simulation. preprint. doi:10.13140/RG.2.2.10900.94085
Martin, C. A., Jenkins, D. R., Minhas, J. S., Gray, L. J., Tang, J., Williams, C., et al. (2020). Socio-demographic Heterogeneity in the Prevalence of COVID-19 during Lockdown Is Associated with Ethnicity and Household Size: Results from an Observational Cohort Study. EClinicalMedicine 25, 100466. doi:10.1016/j.eclinm.2020.100466
Ministére des Affaires Municipales et de l’Occupation du Territoire (MAMO) (2014). Le rôle d’évaluation fonciére et son contenu: Document à l’intention des citoyens. Available at: http://collections.banq.qc.ca/ark:/52327/2436837 (Accessed December 15, 2020).
Müller, S. A., Balmer, M., Charlton, W., Ewert, R., Neumann, A., Rakow, C., et al. (2021). Predicting the Effects of COVID-19 Related Interventions in Urban Settings by Combining Activity-Based Modelling, Agent-Based Simulation, and mobile Phone Data. doi:10.1101/2021.02.27.21252583
Munro, A. P. S., and Faust, S. N. (2020a). Addendum to: Children Are Not COVID-19 Super Spreaders: Time to Go Back to School. Arch. Dis. Child. 106, e9. doi:10.1136/archdischild-2020-319908
Munro, A. P. S., and Faust, S. N. (2020b). Children Are Not COVID-19 Super Spreaders: Time to Go Back to School. Arch. Dis. Child. 105, 618–619. doi:10.1136/archdischild-2020-319474
Mutambudzi, M., Niedzwiedz, C., Macdonald, E. B., Leyland, A., Mair, F., Anderson, J., et al. (2020). Occupation and Risk of Severe COVID-19: Prospective Cohort Study of 120 075 UK Biobank Participants. Occup. Environ. Med. 78, 307–314. doi:10.1136/oemed-2020-106731
Nash, D., Rane, M., Chang, M., Kulkarni, S. G., Zimba, R., You, W., et al. (2021). Recent SARS-CoV-2 Seroconversion in a National, Community-Based Prospective Cohort of U.S. Adults. u.s. Adults. doi:10.1101/2021.02.12.21251659
Nguyen, L. H., Drew, D. A., Graham, M. S., Joshi, A. D., Guo, C.-G., Ma, W., et al. (2020). Risk of COVID-19 Among Front-Line Health-Care Workers and the General Community: A Prospective Cohort Study. The Lancet Public Health 5, e475–e483. doi:10.1016/s2468-2667(20)30164-x
Ontario Public Health (2020). COVID-19 in ontario: Elementary and Secondary School Outbreaks and Related Cases. august 30, 2020 to november 7, 2020. Available at: https://www.publichealthontario.ca/-/media/documents/ncov/epi/2020/12/covid-19-school-outbreaks-cases-epi-summary.pdf?la=en (Accessed June 29, 2021).
Perez, L., and Dragicevic, S. (2009). An Agent-Based Approach for Modeling Dynamics of Contagious Disease Spread. Int. J. Health geographics 8, 50–17. doi:10.1186/1476-072X-8-50
Public Health Agency of Canada (2020). COVID-19 Daily Epidemiology Update. Aem. Available at: https://health-infobase.canada.ca/covid-19/epidemiological-summary-covid-19-cases.html (Accessed June 7, 2021).
Puntis, J. W. (2020). Is it Really Time to Go Back to School? Arch. Dis. Child. 106, e7. doi:10.1136/archdischild-2020-319911
Rubin, D. M., Achari, S., Carlson, C. S., Letts, R. F. R., Pantanowitz, A., Postema, M., et al. (2021). Facilitating Understanding, Modeling and Simulation of Infectious Disease Epidemics in the Age of COVID-19. Front. Public Health 9. doi:10.3389/fpubh.2021.593417
Ruktanonchai, N. W., DeLeenheer, P., Tatem, A. J., Alegana, V. A., Caughlin, T. T., zu Erbach-Schoenberg, E., et al. (2016). Identifying Malaria Transmission Foci for Elimination Using Human Mobility Data. Plos Comput. Biol. 12, e1004846. doi:10.1371/journal.pcbi.1004846
Scientific Advisory Group for Emergencies (2020). Housing, Household Transmission and Ethnicity. 26 November 2020. GOV.UK. Available at: https://www.gov.uk/government/publications/housing-household-transmission-and-ethnicity-26-november-2020 (Accessed June 29, 2021).
Shen, M., Peng, Z., Guo, Y., Rong, L., Li, Y., Xiao, Y., et al. (2020). Assessing the Effects of Metropolitan-wide Quarantine on the Spread of COVID-19 in Public Space and Households. Int. J. Infect. Dis. 96, 503–505. doi:10.1016/j.ijid.2020.05.019
Smieszek, T., Balmer, M., Hattendorf, J., Axhausen, K. W., Zinsstag, J., and Scholz, R. W. (2011). Reconstructing the 2003/2004 H3n2 Influenza Epidemic in switzerland with a Spatially Explicit, Individual-Based Model. BMC Infect. Dis. 11. doi:10.1186/1471-2334-11-115
Smieszek, T. (2009). A Mechanistic Model of Infection: Why Duration and Intensity of Contacts Should Be Included in Models of Disease Spread. Theor. Biol. Med. Model. 6. doi:10.1186/1742-4682-6-25
Société de l’Assurance Automobile du Québec (Saaq), (2016). Données d’immatriculation et de d’tention de permis à conduire.
Statistics Canada, (2016). Montréal [census Metropolitan Area], Quebec and canada [country] (Table). Census Profile. 2016 Census. Statistics canada Catalogue No. 98-316-x2016001. Ottawa. Released november 29, 2017. Available at: https://www12.statcan.gc.ca/census-recensement/2016/dp-pd/prof/index.cfm?Lang=E (Accessed June 29, 2021).
St‐Denis, X. (2020). Sociodemographic Determinants of Occupational Risks of Exposure to COVID‐19 in Canada. Can. Rev. Sociology/Revue canadienne de sociologie 57, 399–452. doi:10.1111/cars.12288
Stefanelli, P., Bella, A., Fedele, G., Pancheri, S., Leone, P., Vacca, P., et al. (2021). Prevalence of SARS-CoV-2 IgG Antibodies in an Area of Northeastern Italy with a High Incidence of COVID-19 Cases: a Population-Based Study. Clin. Microbiol. Infect. 27, e1–633. doi:10.1016/j.cmi.2020.11.013
Stein-Zamir, C., Abramson, N., Shoob, H., Libal, E., Bitan, M., Cardash, T., et al. (20202020). A Large COVID-19 Outbreak in a High School 10 Days after Schools' Reopening, Israel, May 2020. Eurosurveillance 25, 2001352. doi:10.2807/1560-7917.ES.2020.25.29.2001352
Tan, L., and Ma, C. (2021). Choice Behavior of Commuters' Rail Transit Mode during the COVID-19 Pandemic Based on Logistic Model. J. Traffic Transportation Eng. (English Edition) 8, 186–195. doi:10.1016/j.jtte.2020.07.002
Toronto Public Health (2020). Toronto Public Health Releases New Socio-Demographic COVID-19 Data. Available at: https://www.toronto.ca/news/toronto-public-health-releases-new-socio-demographic-covid-19-data/(Accessed January 8, 2021).
Transport Métropolitain (Artm), , and de, A. R. (2020). Enquéte origine-destination 2018 : Faits saillants de l’état de la mobilité des personnes dans la région métropolitaine de montréal.
Tu-Berlin, V. (2020). Mobility Traces and the Spreading of COVID-19. Available at: https://covid-sim.info/v1/(Accessed January 12, 2021).
Vlachos, J., Hertegård, E., and B. Svaleryd, H. (2021). The Effects of School Closures on SARS-CoV-2 Among Parents and Teachers. Proc. Natl. Acad. Sci. USA 118, e2020834118. doi:10.1073/pnas.2020834118
Wangping, J., Ke, H., Yang, S., Wenzhe, C., Shengshu, W., Shanshan, Y., et al. (2020). Extended SIR Prediction of the Epidemics Trend of COVID-19 in italy and Compared with Hunan, china. Front. Med. 7, 169. doi:10.3389/fmed.2020.00169
Wesolowski, A., Qureshi, T., Boni, M. F., Sundsøy, P. R., Johansson, M. A., Rasheed, S. B., et al. (2015). Impact of Human Mobility on the Emergence of Dengue Epidemics in pakistan. Proc. Natl. Acad. Sci. USA 112, 11887–11892. doi:10.1073/pnas.1504964112
WHO (2020a). Coronavirus Disease (Covid-19): How Is it Transmitted? Available at: https://www.who.int/news-room/q-a-detail/coronavirus-disease-covid-19-how-is-it-transmitted (Accessed June 29, 2021).
WHO (2020b). Report of the Who-china Joint mission on Coronavirus Disease 2019 (Covid-19). Available at: https://www.who.int/docs/default-source/coronaviruse/who-china-joint-mission-on-covid-19-final-report.pdf (Accessed January 11, 2021).
WHO (2021). Weekly Epidemiological Update - 18 May 2021. Available at: https://www.who.int/publications/m/item/weekly-epidemiological-update-on-covid-19---18-may-2021 (Accessed June 29, 2021).
Xiong, C., Hu, S., Yang, M., Luo, W., and Zhang, L. (2020). Mobile Device Data Reveal the Dynamics in a Positive Relationship between Human Mobility and COVID-19 Infections. Proc. Natl. Acad. Sci. USA 117, 27087–27089. doi:10.1073/pnas.2010836117
Ye, X., Konduri, K., Pendyala, R. M., Sana, B., and Waddell, P. (2009). “A Methodology to Match Distributions of Both Household and Person Attributes in the Generation of Synthetic Populations,” in 88th annual meeting of the transportation research board, Washington, DC, January 11–15, 2009.
Yilmazkuday, H. (2021). Stay-at-home Works to Fight against COVID-19: International Evidence from Google Mobility Data. J. Hum. Behav. Soc. Environ. 31, 210–220. doi:10.1080/10911359.2020.1845903
Zheng, L., Wang, X., Zhou, C., Liu, Q., Li, S., Sun, Q., et al. (2020). Analysis of the Infection Status of Healthcare Workers in Wuhan during the COVID-19 Outbreak: A Cross-Sectional Study. Clin. Infect. Dis. 71, 2109–2113. doi:10.1093/cid/ciaa588
Keywords: COVID-19, daily activities and habits, mobility, agent-based model, epidemic model, multi-agent transport simulation, urban modeling and simulation, infections—epidemiology
Citation: Manout O and Ciari F (2021) Assessing the Role of Daily Activities and Mobility in the Spread of COVID-19 in Montreal With an Agent-Based Approach. Front. Built Environ. 7:654279. doi: 10.3389/fbuil.2021.654279
Received: 15 January 2021; Accepted: 17 June 2021;
Published: 14 July 2021.
Edited by:
Samiul Hasan, University of Central Florida, United StatesReviewed by:
Samuel Labi, Purdue University, United StatesChao Fan, Texas A&M University, United States
Copyright © 2021 Manout and Ciari. This is an open-access article distributed under the terms of the Creative Commons Attribution License (CC BY). The use, distribution or reproduction in other forums is permitted, provided the original author(s) and the copyright owner(s) are credited and that the original publication in this journal is cited, in accordance with accepted academic practice. No use, distribution or reproduction is permitted which does not comply with these terms.
*Correspondence: Ouassim Manout, b3Vhc3NpbS5tYW5vdXRAcG9seW10bC5jYQ==; Francesco Ciari, ZnJhbmNlc2NvLmNpYXJpQHBvbHltdGwuY2E=