 André Paixão
 José Nuno Varandas
 Eduardo Fortunato
- 1Transportation Department, National Laboratory for Civil Engineering (LNEC), Lisbon, Portugal
- 2CONSTRUCT, Faculdade de Engenharia, Universidade do Porto, Portugal
- 3CERIS, Department of Civil Engineering, NOVA School of Science and Technology, Lisbon, Portugal
Transition zones between embankments and bridges or tunnels are examples of critical assets of the railway infrastructure. These locations often exhibit higher degradations rates, mostly due to the development of differential settlements, which amplify the dynamic train-track interaction, thus further accelerating the development of settlements and deteriorating track components and vehicles. Despite the technical and scientific interest in predicting the long-term behavior of transition zones, few studies have been able to develop a robust approach that could accurately simulate this complex structural response. To address this topic, this work presents a three-dimensional finite element (3D FEM) approach to simulate the long-term behavior of railway tracks at transition zones. The approach considers both plastic deformation of the ballast layer using a high-cycle strain accumulation model and the non-linearity of the dynamic vehicle-track interaction that results from the evolution of the deformed states of the track itself. The results shed some light into the behavior of transition zones and evidence the complex long-term response of this structures and its interdependency with the transient response of the train-track interaction. Aspects that are critical when assessing the performance of these systems are analyzed in detail, which might be of relevance for researchers and practitioners in the design, construction, and maintenance processes.
Introduction
Railway tracks are known to show higher degradation rates at transition zones between sections with different characteristics and support conditions, i.e., between embankment and bridges, tunnels, or other structures (ERRI, 1999; Banimahd et al., 2012; Varandas et al., 2014a; Paixão et al., 2013; Boler et al., 2018). These locations often exhibit differential settlements that develop during the life cycle of the track due to multiple structural and geo-mechanical reasons. Because the permanent deformation accumulation at transition zone differs significantly from the adjacent locations, differential settlements develop, leading to deteriorated longitudinal level profiles of the track, manifested as a subsidence spanning over a length of a few meters (typically identified in the wavelength range of 3 m < λ < 70 m (CEN, 2017) in the track geometry data obtained by track inspection vehicles). In the long-term, the aggravation of such differential settlements significantly contributes to the deterioration of the track geometric quality and to the amplification of the dynamic vehicle-track interaction, which further increases the deterioration process itself. Eventually, track maintenance interventions are required to reestablish adequate track geometry and safety levels, which is costly, time-consuming, reduces track availability and disturbs normal train operation.
Although many numerical studies have focused on the influence of the vertical stiffness variation to this problem (Banimahd et al., 2012; Costa et al., 2014; Paixão et al., 2018), few have addressed a more critical aspect: the impact and long-term development of differential settlements (Paixão et al., 2016c; Stark and Wilk, 2016). This is probably because it has been far easier to simulate the transient response of a vehicle crossing a transition zone, using adequate numerical tools, than to simulate the long-term behavior of this system, not only because it involves more computational effort, but also because it requires more robust models and mathematical formulations.
Most studies addressing track settlements at transition zones considering the train-track interaction have used simplified 1D Winkler type models coupled with empirical settlement formulas, as in (Mauer, 1995; Hunt, 1997; Kempfert and Hu, 1999; Varandas et al., 2014a). However, because 1D Winkler models require extensive calibration of material parameters and other modeling aspects, such as equivalent springs and dampers (Punetha et al., 2020), its application to real scenarios or to perform parametric studies has been somewhat limited.
While many authors have studied the transient train-track interaction at transition zones using tri-dimensional numerical approaches (Wang et al., 2017; Paixão et al., 2018; Ngamkhanong et al., 2020), others have proposed 3D FEM models with true tri-dimensional plastic deformation formulations to simulate the development of settlements, but mostly focusing on aspects other than transition zones. For example, Li et al. (2016) and Shih et al. (2019) presented implementations in commercial FEM software, but limited the analysis to very short sections of track and considered the static loading only (no vehicle-track interaction). Shan et al. (2017) developed a more robust framework to study slab track transition zones to bridges that considered the vehicle-track dynamic interaction to study the impact of the differential settlements at the approach to the structures. Despite the advances, the study only accounted for the plastic deformation of the subgrade, consequently, not applicable to ballasted tracks, where the ballast layer frequently plays a major role in the development of settlements (Selig and Waters, 1994). Moreover, the study adopted an empirical plastic model that was updated at regular load cycle increments, thus, not necessarily considering the amplitude of the plastic strains to update the deformed shape of the track and its impact on the vehicle-track interaction.
Although very robust numerical approaches have been proposed to simulate railway tracks and the complex degradation behavior of the particulate media of the ballast layer, such as the Discrete Element Modeling (Dahal and Mishra, 2020), its application is still limited to very small stretches of track (models with only a few sleepers long) (Chen and McDowell, 2016) because of the extreme computational effort that is required to simulate structures such as transition zones.
To obtain more insight into the long-term behavior of transition zones in ballasted tracks and considering the available tools and the computational challenging task, the authors adopted a full tri-dimensional FEM approach (Varandas et al., 2020) that has the following main features: 1) it incorporates a robust high-cycle strain accumulation model of the ballast layer based on the classical plasticity theory that considers both the frictional and volumetric degradation mechanisms (Suiker and de Borst, 2003); 2) it considers the dynamic vehicle-track interaction using a non-linear hertzian contact formulation, the sleeper-ballast interaction using a bi-linear formulation and the consequent non-linearity that results from the vehicles running on uneven longitudinal track profiles; 3) it accounts for the non-linear resilient behavior of the ballast layer, which is critical to adequately evaluate the stress levels that, in turn, are required as inputs for the strain accumulation model.
Numerical Modeling Approach
Dynamic 3D Train-Track System Modeling in FEM
The numerical approach that the authors used in this work resorts to a three-dimensional FEM analysis program to calculate the dynamic train-track interaction, designated Pegasus (Varandas, 2013). It is fully coded in MATLAB® and has been developed over the past years with the aim to build a FEM code capable to compute, in admissible time with reasonable computational power, the response of a general non-homogeneous railway track system, to obtain more insight into the behavior of such systems. For this reason, it has often been used to study railway transition zones with irregular track longitudinal profiles (Paixão et al., 2018; Varandas et al., 2017; Varandas et al., 2016b; Paixão et al., 2016d; Varandas et al., 2014b). One of the main advantages of the program is that it can consider both the train-track interaction and the non-linear constitutive behavior of the granular layers supporting the track superstructure (Varandas et al., 2016a; Paixão et al., 2016a).
The program establishes three distinct systems that interact via contact forces (Figure 1): 1) the vehicle model; 2) the track superstructure (rails, sleepers and fastening system); 3) and the ballast-substructure system (the ballast and underlaying soil layers). The vehicle system is represented by rigid masses connected by spring-damper elements. The rails and sleepers of the track superstructure system are represented by Euler-Bernoulli beam elements and the rail pads as spring-damper elements. Given the frequencies under analysis in this work, up to about 80 Hz, and the focus of the paper in settlements predictions, the authors considered that the representation of the rails with the Euler-Bernoulli beam formulation was an adequate approach (Knothe and Grassie, 1993), and that the consideration of a more complex and computationally demanding beam formulation would not yield different long-term results. The ballast-substructure system comprises low-order fully integrated eight-node solid hexahedral elements.
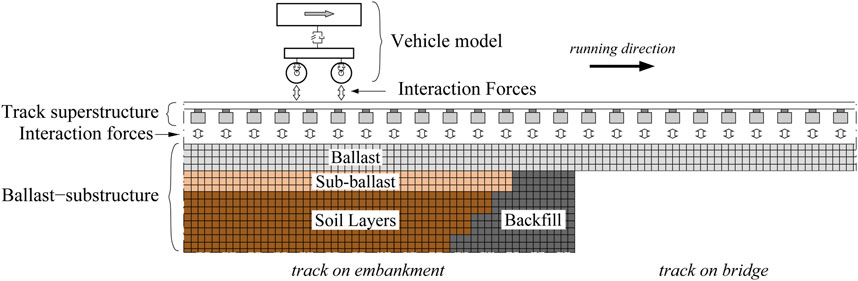
FIGURE 1. Schematic representation of the 3D FEM model in longitudinal view (after (Varandas et al., 2014a)).
The sleeper-ballast interaction forces in the vertical direction follow a bi-linear formulation to account for the eventual development of unsupported sleepers, or also known as “hanging sleepers” (Varandas et al., 2016b). The wheel-rail interaction forces follow a non-linear hertzian contact formulation given by
Typical analyses with the program comprise a sequence of static and dynamic calculation stages. The Conjugate Gradient Method (Bathe, 1996) is used in the static analyses. A mixed implicit-explicit integration scheme is used in the dynamic analyses to perform the time integration, aiming at reducing the required computational time, as explained in (Varandas et al., 2017): the track superstructure is integrated with the implicit Newmark constant acceleration method, and the ballast-substructure system is integrated with the explicit scheme presented by Zhai (1996).
Regarding the material behavior, linear elasticity is assumed for all materials. An exception is made for the ballast layer which follows a nonlinear elastic behavior for a more accurate simulation. This accounts for the typical change in material stiffness with the stress level, when loaded in elastic or quasi-elastic regime (Lekarp et al., 2000). This aspect is more relevant in the ballast layer because it undergoes higher stress amplitudes in the cyclic loading than the layers below. The non-linear elastic formulation considered in Pegasus is the pressure dependent hypo-elastic material law commonly known as
leaving the Poisson’s ratio constant. The reference stress,
The vehicle is modeled as a single bogie, resting on the primary suspension of two wheelsets, and a half carbody mounted on the secondary suspension, as depicted in Figure 2. The vehicle model comprises eight degrees-of-freedom (dofs): four translations and four rotations.
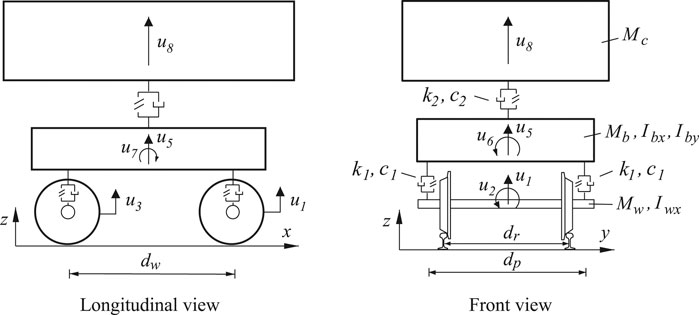
FIGURE 2. Model of the vehicle representing a bogie and half carbody.
Ballast High-Cycle Strain Accumulation Model
The approach adopted in this study incorporates a high-cycle strain accumulation model to estimate the deformation accumulation process caused by many load cycles imposed by passing vehicles. To avoid calculating the complete (eventually non-elastic) stress/strain path caused by every single axle pass, which would be impractical and prone to errors (Niemunis et al., 2005), the process adopted by the authors consists of calculating the envelope of the maximum residual deformations generated over individual load cycles, allowing for the calculation of the total accumulated settlement over a relatively large number of load cycles, following the formulation of the high-cycle strain accumulation model presented by (Suiker and de Borst, 2003). This model was parameterized with triaxial tests on ballast and sub-ballast aggregates (Suiker, 2002) and was developed for the application to railway track simulations. It was selected for this study because it is suited to account for the significant force non-linearity that results from the variable vehicle-track interaction caused by deformed states of the track itself. An aspect worthy of notice is that the accumulation of strain (densification due to cyclic loading) is split in two mechanisms, which may develop simultaneously and independently: 1) volumetric compaction of the material; 2) and frictional sliding of the particles.
The approach describes only the accumulation of the average permanent deformation per load cycle. The short-term (dynamic) event is decoupled from the long-term (deformation) event, in which the application of load cycles is implicitly accounted for by the constitutive model. It is described in mechanical stress definition (compression is negative), although the mean normal stress invariant
The stress due only to gravitational loads is denoted by the subscript “geo”, and the stress due solely to the train loading itself, therefore excluding the gravitational component, is denoted by the subscript “cyc”:
The development of the model is based on the classical plasticity theory (yield surfaces, flow rule, hardening, associated plasticity), in that the yield (or shakedown) surface corresponds to the Drucker-Prager cone, with a compression cap.
The permanent strain increment,
where
The amplitude of deviatoric strain increment is obtained by:
where
The amplitude of volumetric strain incremental due to the compaction mechanism only is obtained by:
where
Finally, the incremental amplitude of the volumetric strain is calculated by:
In that
Following previous calibration works by the research team (Varandas et al., 2020), the parameters of the ballast high-cycle strain accumulation model that were considered for this study are the following:
Transition Zone Long-Term Simulations
Description of the Model
A model of a transition zone built with Pegasus is shown in Figure 3, which only depicts the ballast-substructure system, composed of brick elements, in a hexahedral mesh. The three-dimensional visualization was generated with the open-source software ParaView (Ayachit, 2015). The width of the model is 7.5 m and its length comprises 37 sleepers, spaced 0.60 m, therefore measuring approximately 22.5 m long. The section of the track on embankment is about 12.8 m long and includes a 30 cm ballast layer, a 30 cm sub-ballast layer, resting on top of the subgrade. The section of the track on the bridge deck is about 9.7 m long and only includes the track elements down to the ballast layer. The embankment-bridge interface is located at
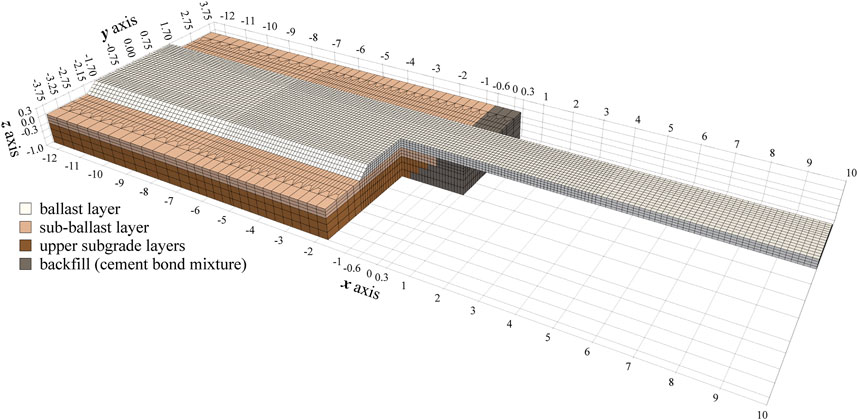
FIGURE 3. Tridimensional view of the transition zone model showing finite element mesh and the axis grid (dimensions in m).
The mesh is not uniform along the longitudinal axis,
The geometrical and material properties of the track model are based on data presented in (Paixão et al., 2018), but considering the European standard gauge (1.435 m). The track superstructure is composed of continuously welded UIC60E1 rails, monoblock concrete sleepers (with simplified dimensions
The subgrade is assumed to be a homogeneous, isotropic, well compacted, and reasonably stiff soil layer with a depth of 3.7 m. The upper 0.75 m of the subgrade are represented in the model with brick elements, and the bottom 3 m are represented using an equivalent bi-dimensional viscoelastic Kelvin-Voigt foundation (Varandas, 2013). The lateral walls at the extremities of the model have local dampers to absorb impinging waves (Lysmer and Kuhlemeyer, 1969). The abutment back wall (at
Table 1 summarizes the main properties selected for the track components and the ballast-substructure system. The elastic parameters of the ballast
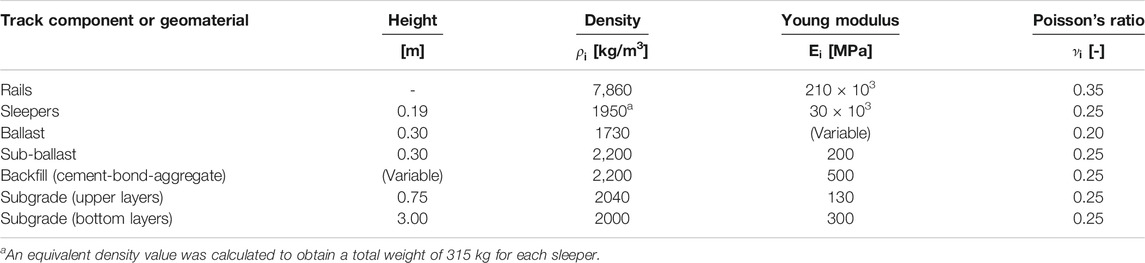
TABLE 1. Properties of the materials of the track and its substructure (Bowles, 1997; Fortunato et al., 2012; Paixão 2014).
The dynamic simulations in this paper were performed considering the passing of single bogies from the Portuguese tilting passenger vehicle with integrated traction, the Alfa Pendular. The parameters of this bogie model are provided as supplementary material, following the notation presented in Figure 2. The axle load of the Alfa Pendular vehicle is roughly 132 kN. The bogies cross the central region of the model at a speed of 40 m/s (corresponding to 144 km/h), traveling from the embankment to the structure. Considering the track properties, this traveling velocity stays well below the critical speed of the track, and thus the stationary response is quasi-static. Given the high computational effort required to perform the calculations presented herein, the effect of the train speed and the running direction will not be studied in this paper.
Each iteration of the adopted methodology encompasses the gravitational weight calculations, the placing of the vehicle model and the passage of the vehicle. These necessary steps are computationally intensive, mostly because of the consideration of the nonlinear resilient model for the ballast material. Each iteration takes about 50–120 min. to compute, depending on the necessary time step of the integration scheme. It is noted that in every time step of the simulation (in the order of
Long-Term Simulation Methodology
The methodology considered in this study to simulate the long-term behavior of the transition zone consists of a pseudo-time loop approach (Varandas et al., 2014a). The application of such approach to 3D FEM is challenging and a validation of this long-term simulation methodology was presented by the authors in an earlier study (Varandas et al., 2020), focusing on an homogenous foundation scenario. This approach assumes that the effect of the transient response of the train-track system, when trains pass by, can be separated from the long-term plastic deformation behavior of the track bed aggregates and subsequent settlement development, caused by the accumulation of cyclic loads from traffic. Because the plastic deformation of the track bed aggregates is generally several orders of magnitude lower than the resilient deformation, it is an acceptable simplification to perform full elastic train-track dynamic analyses. The methodology also assumes that, in the initial state of the simulation, the track bed layers under the ballast have been heavily compacted during construction and continuously loaded with traffic.
As described in detail by Varandas et al. (2020), this iterative approach comprises up to seven steps in each iteration (iter), as depicted in Figure 4. The process starts with a static calculation of an initial state (A) to determine the initial stress field caused by the geostatic load,
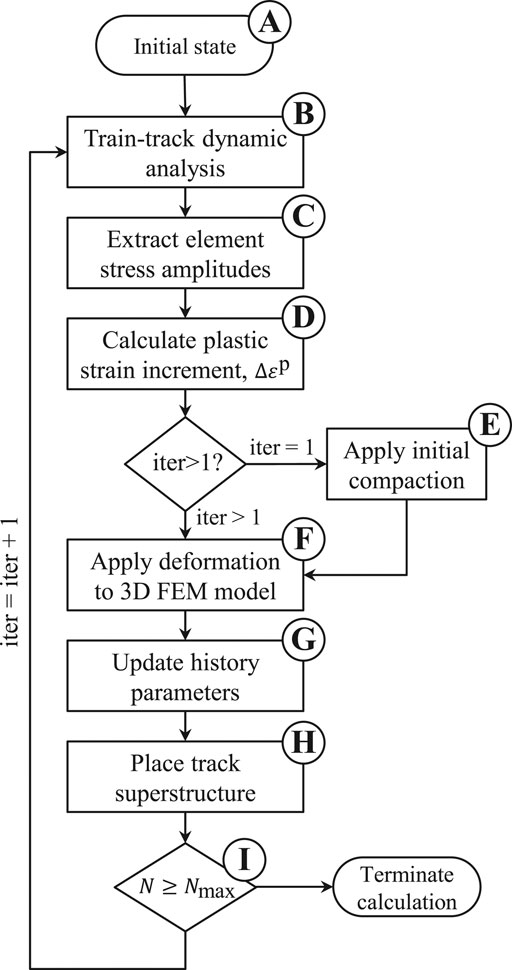
FIGURE 4. Main steps implemented in Pegasus for the calculation of the track settlements. Each complete iteration (iter) is separated in six or seven steps (Varandas et al., 2020).
With that, the corresponding plastic strain increment,
Results and Discussions
In this study the authors present the results of the application of the above methodology to the hypothetical transition zone model presented in Description of the model. It is worth noting that the simulation of this scenario does not correspond to any specific transition zone design. In addition, the authors were only focusing on the impact of the plastic deformation of the ballast layer in the long-term behavior of this system and assumed that the backfill and foundation layers were stabilized. For that reason, the plastic deformation of the subgrade is not accounted for in this study. Although this aspect could be included in this study, it was not the focus of this work. Moreover, this aspect has been addressed in studies by other authors (Shan et al., 2017).
In this simulation, the plastic deformation of the ballast layer caused by successive passages of the vehicle Alfa Pendular, from the embankment to the bridge, developed at different rates along the transition zone. This nonhomogeneous behavior caused the growth of differential settlements and the resulting evolution of the longitudinal rail level as depicted in Figure 5. It is visible that the development of the ballast settlements was faster on the structure than on the embankment, where it also stabilized faster - on the embankment, the rail level at N = 10E3 is practically identical to that at N = 100E3. Due to this, the total settlement in the bridge section is about three times the total settlement attained in the embankment section, although the amplitude of the developed differential settlements at the end of the simulated period is still very limited (less than 0.9 mm) and compatible with normal railway operation. For example, in Europe, the EN 13848–5 (CEN, 2017) establishes that the immediate action limit of isolated defects of the longitudinal level is 23 mm and the recommended alert limit range is 10–17 mm, for speeds between 120 km/h and 160 km/h. In a more realistic scenario, e.g., with even greater number of load cycles, higher amplitudes would eventually been reached, which would require maintenance actions such as tamping and leveling to reestablish adequate track position.
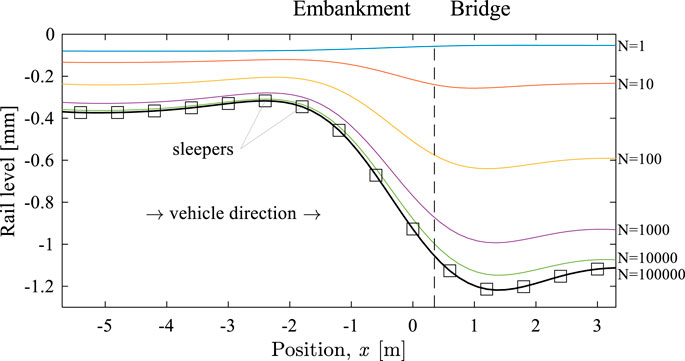
FIGURE 5. Change in longitudinal rail level with the number of load cycles (N).
Figure 6 shows tri-dimensional views of the deformed shape of the ballast-substructure system obtained at N = 100 and at N = 100E3, which evidence the concentration of plastic deformation under the sleepers’ positions, being more pronounced on the bridge section.
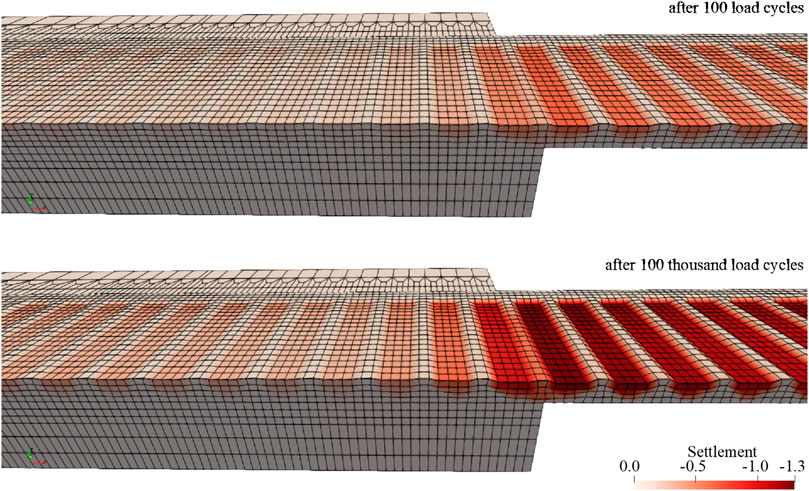
FIGURE 6. 3D view of the deformed ballast-substructure system at
The authors are aware that, in reality, significant settlements may occur in the backfill (caused by the consolidation and densification of the subgrade layers and its foundation) which also contribute to the long-term evolution of the longitudinal rail profile, hence also affecting the dynamic vehicle-track interaction. In fact, the amplitude of the backfill settlements is often greater than that of the scenario simulated here, although this was not the focus of the study presented here, as mentioned earlier.
To elucidate on the variability of the evolution of the deformation of the ballast layer, Figure 7 presents examples of settlement accumulation at two positions under two sleepers (
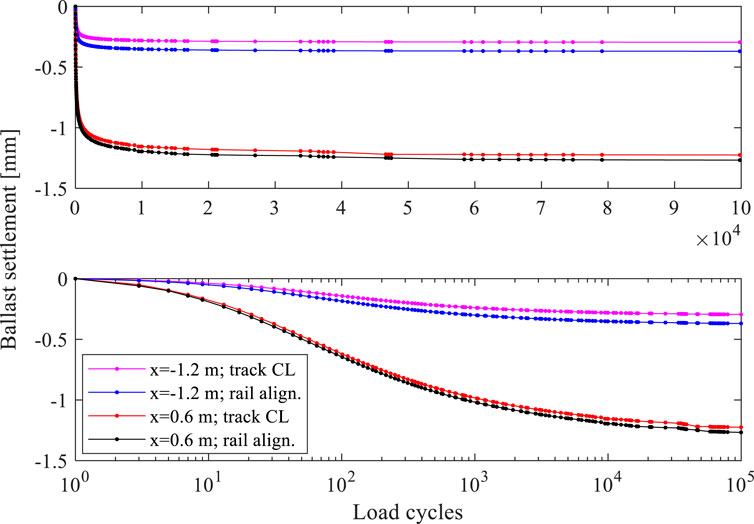
FIGURE 7. Evolution of the ballast settlement with N, under the sleepers at positions
Figure 8 presents another aspect of the ballast vertical deformation evolution, assessed in terms of longitudinal settlement profiles of the ballast surface right under the sleepers (at
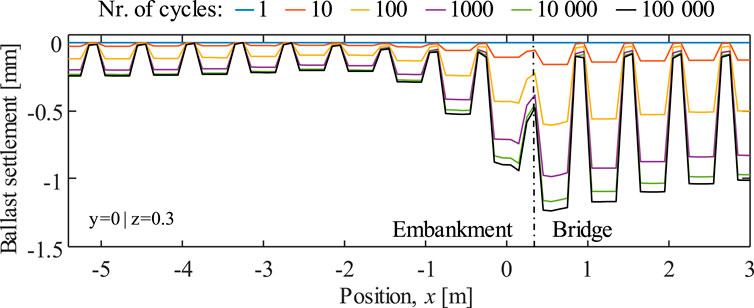
FIGURE 8. Evolution of the ballast settlement (longitudinal profiles) with N, assessed at
Irregularities in the rail longitudinal level have strong impact on the dynamic wheel-rail interaction. In fact, this aspect may be considered a key factor to assess the performance of transition zones or other critical locations in railway tracks (Paixão et al., 2016a; Mauer, 1995). In view of this, Figure 9 shows the wheel-rail interaction forces of both leading and trailing axles, after applying a low pass filter (LPF) with a cut-off frequency of 80 Hz (Paixão et al., 2014). Apart from a notable force amplitude increase when the vehicle enters the stiffer structure, it is visible, for both axles of the bogie, slight changes in forces with the number of load cycles. For example: 1) there is a slight reduction trend of the forces at the approach to the bridge, between
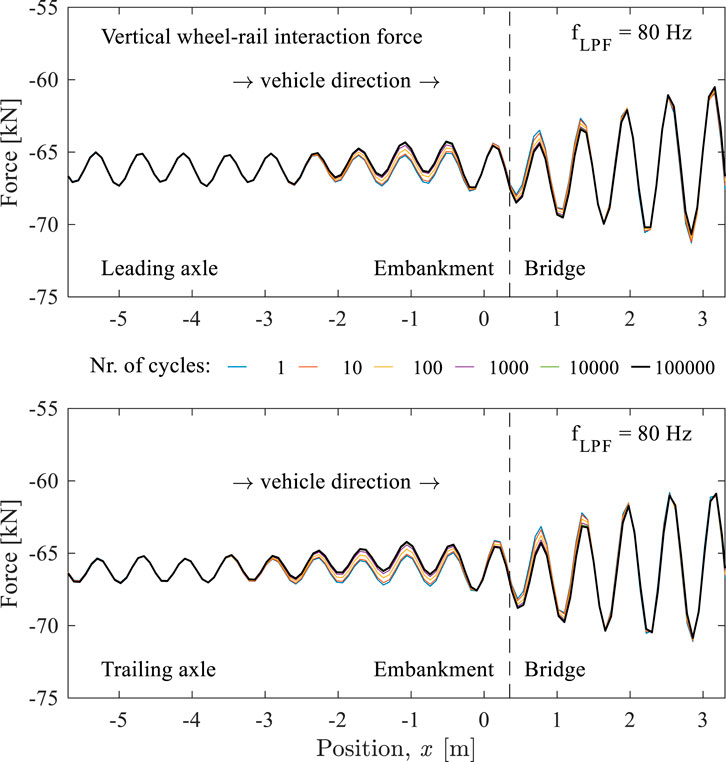
FIGURE 9. Evolution of the wheel-rail interaction forces with N of the leading and trailing axles.
For example, when analyzing the sleeper-ballast interaction forces, it becomes apparent that something more complex is taking place at this level. Figure 10 shows that the resulting sleeper-ballast interaction forces at each sleeper are evolving at different rates along the transition zone: increasing at the approach to the bridge; decreasing around the embankment-bridge interface; and increasing again on the bridge. It is noted that the sleeper-ballast interaction forces were calculated as the sum of all vertical nodal contact forces under each sleeper. The fact that sleeper-ballast interaction forces are decreasing near the interface suggests that hanging sleepers might be developing at that location and that the adjacent sleepers that are not hanging are receiving the additional load that the hanging sleepers are not able to transfer to the ballast layer.
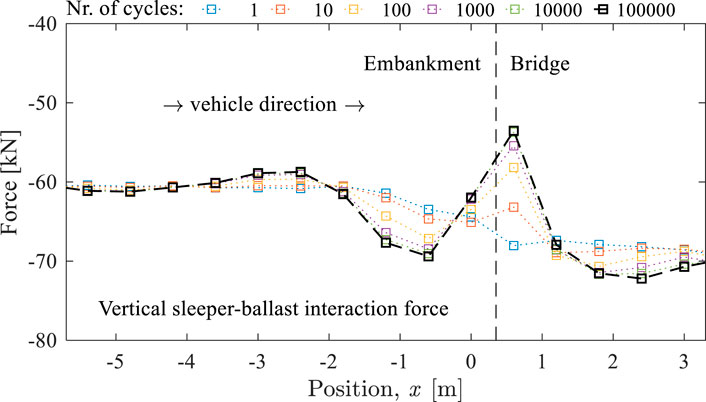
FIGURE 10. Evolution of peak vertical sleeper-ballast interaction forces with N.
To investigate the development of hanging sleepers, Figure 11 shows the transient displacement undergone by the ballast at different positions, x, along the transition zone, evaluated right under the sleepers, aligned with and below the rail (at
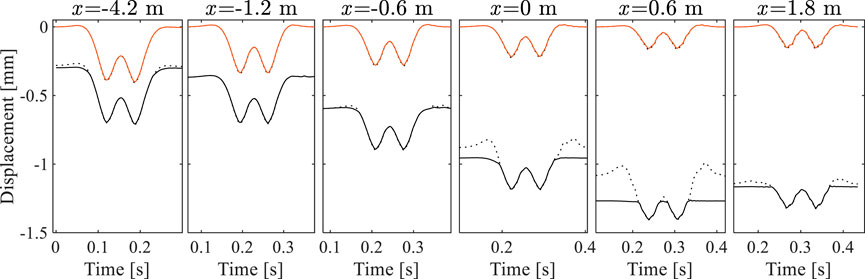
FIGURE 11. Comparison between the deflections of the sleepers (doted lines) and of the ballast layer (full lines) as the vehicles passes by at load cycle N = 1 (red) and N = 100E3 (black).
Another aspect that helps to assess the performance of transition zones and the structural consequences of the development of differential settlements and unsupported sleepers is to analyze the change in track vertical stiffness along the transition zone. Here, the authors calculated the track vertical stiffness as perceived by the axles of the vehicle by calculating the ratio between the wheel-rail dynamic interaction force (presented in Figure 9) and the maximum resilient vertical displacement of the rail due to that axle load (i.e., the amplitudes of the rail displacement depicted in Figure 11). Figure 12 presents the obtained vertical stiffness profiles along the transition zone at different load cycle numbers, where it is visible the typical increase in vertical stiffness as the track approaches the bridge. In this case, the track stiffness increases about 60% when entering the bridge. It is also clear in Figure 12 the relevant change in the profiles with the number of load cycles, especially around the embankment-bridge interface. There is a significant reduction trend in stiffness at this location and it appears that the length in which the stiffness variation takes place increases with N: at N = 1, the length of the variation is about 2.5 m and at N = 100E3 increases to about 4 m. A slight reduction in stiffness is also apparent on the embankment section, which might be a consequence of the sleepers’ central biding phenomenon mentioned earlier.
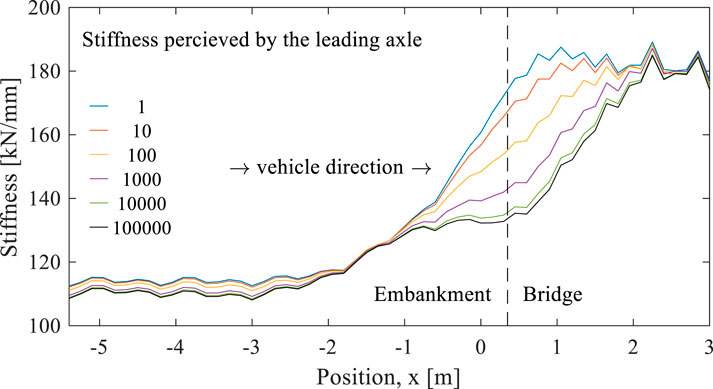
FIGURE 12. Evolution of the track vertical stiffness perceived by the vehicle with N.
One of the reasons to develop 3D FEM models to assess the performance of transition zone is that not only it allows for a more accurate reproduction of the load distribution and wave propagation in the structure, but also enables a proper stress analysis inside the ballast and subgrade layers, which is crucial to understand in greater depth the structural and geomechanical phenomena that might be taking place. Herein, the authors will analyze the stress levels in the ballast layer at the relative locations A to D identified in Figure 13, for a given track cross section. Figure 13 also depicts the transient variation of the mean,
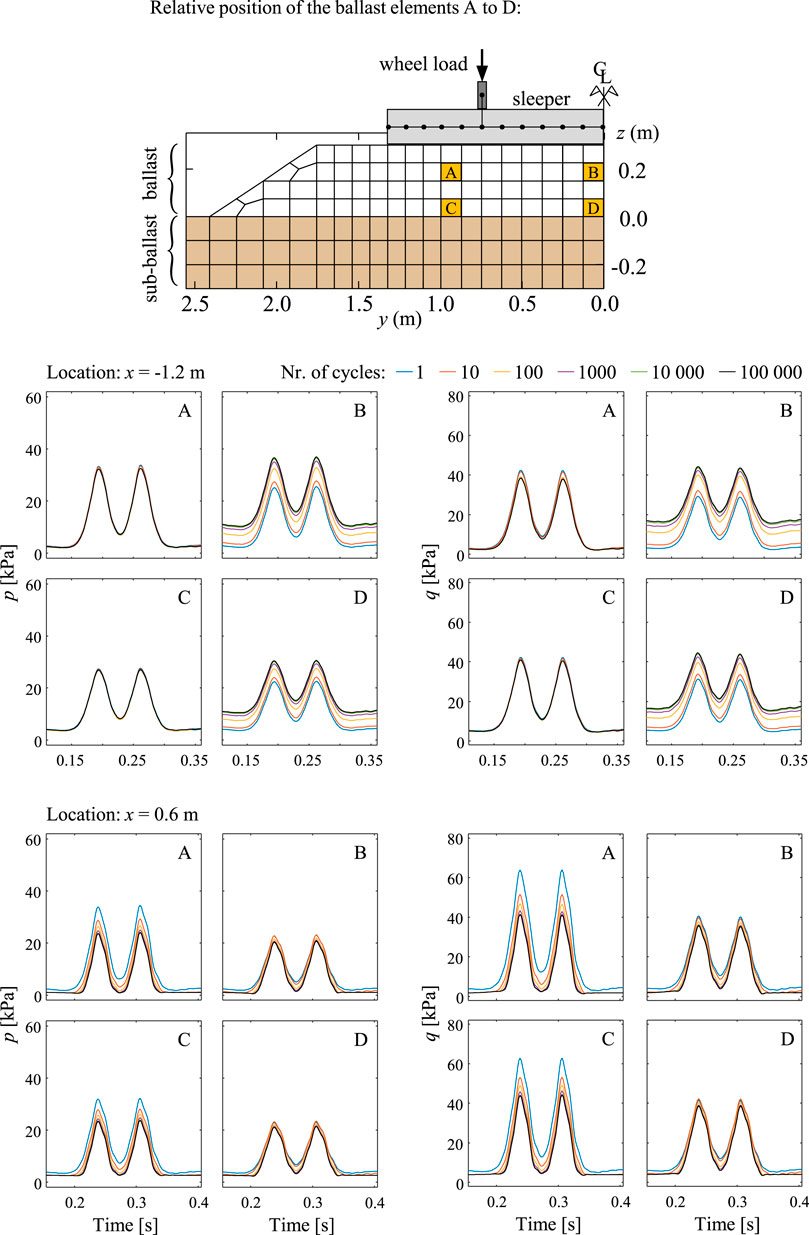
FIGURE 13. Transient variation of p (left) and q (right) at positions (A–D) in the ballast layer, under the sleepers at positions
The results regarding the elements at positions B and D under the sleeper at
Despite the above observation that some locations in the ballast layer seem to be experiencing an increase in the stress level with the evolution in loading cycles, such as under the sleepers located between
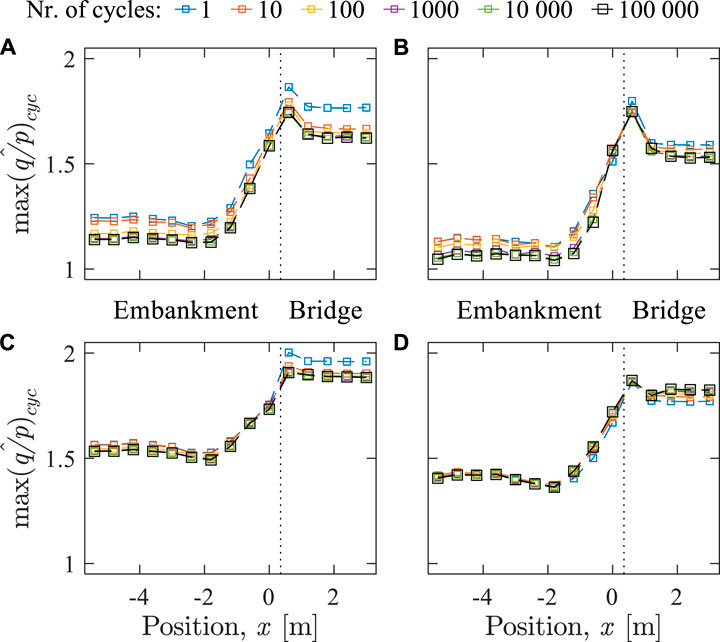
FIGURE 14. Change in maximum ratios
A few observations are worth noting. Firstly, it is visible that the elements located lower in the ballast layer (C and D) undergo higher peak
Final Remarks
In this work, the authors presented the application of a methodology to simulate the long-term behavior of a hypothetical railway track transition zone scenario aiming at shedding some light into the complex behavior of these structures. In particular, the study focused on the plastic deformation growth of the ballast layer, considering the dynamic train-track interaction, and its interdependent impact on the long-term behavior. The adopted methodology considers a robust high-cycle strain accumulation model to estimate the plastic deformation of the ballast layer and uses a pseudo-time loop approach in combination with a 3D FEM train-track-substructure model for dynamic analyses. It was demonstrated the suitability of the tool Pegasus to analyze the evolution of important aspects regarding the performance of transition zones with the number of load cycles, including: the wheel-rail and sleeper-ballast interaction forces; track vertical stiffness; deformation profiles and 3D configurations; transient responses of the system; and in-depth stress analyses.
The case study considered herein corresponds to an approach to a bridge with a relatively sharp increase in stiffness (the stiffness increases by about 60% in about 3 m length) and where it is considered that, hypothetically, the subgrade layers in the embankment are fully stabilized, showing no plastic behavior. Only the plastic deformation of the ballast layer is considered. In these conditions, the long-term calculations showed a gradual development of differential settlements in the transition zone, in the sense of greater settlements on the structure than on the embankment, but without an extension that indicates any imminent need for a maintenance intervention. Furthermore, the development of differential settlements in this direction is somewhat contrary to the expected effect in problematic transition zones of railway bridges, which are associated with a lower leveling in the approach sections. This finding points to the conclusion that the transition zones that are typically problematic are mainly due to deficient compaction and stabilization of the soil layers that form the embankment next to the abutment.
The implemented methodology allowed to evaluate the interdependence between dynamic effects, such as the wheel-rail interaction, and long-term effects, such as the evolution of the vertical stiffness at the rail level, of the transition zone. The results evidence that the long-term response of these structures is quite complex and is greatly influenced by the transient response of the train-track-substructure interaction, with a clear feedback loop between these two processes.
In particular, it is shown that the development of hanging sleepers is a natural consequence of the expected development of differential settlements and that variations in stress levels in the ballast layer are strongly influenced by changes in the support conditions of the sleepers. The presented results also show that the increase in ballast support stiffness causes a moderate increase in the forces transmitted by the sleepers, and a very significant increase in the
Data Availability Statement
The raw data supporting the conclusions of this article will be made available by the authors, without undue reservation.
Author Contributions
AP: Conceptualization, Methodology, Software, Validation, Formal analysis, Investigation, Writing - Original Draft, Writing - Review and; Editing, Visualization; JV: Conceptualization, Methodology, Software, Validation, Investigation, Writing - Review and; Editing, Project administration, Funding acquisition; EF: Conceptualization, Methodology, Validation, Project administration, Funding acquisition.
Funding
Part of this work was financially supported by: Base Funding–UIDB/04708/2020 of the CONSTRUCT–Instituto de I&D em Estruturas e Construções–funded by national funds through the FCT/MCTES (PIDDAC).
Conflict of Interest
The authors declare that the research was conducted in the absence of any commercial or financial relationships that could be construed as a potential conflict of interest.
Acknowledgments
This work was conducted in the framework of the TC202 national committee of the Portuguese Geotechnical Society (SPG) Transportation Geotechnics, in association with the International Society for Soil Mechanics and Geotechnical Engineering (ISSMGETC202).
References
Aursudkij, B., McDowell, G. R., and Collop, A. C. (2009). Cyclic loading of railway ballast under triaxial conditions and in a railway test facility. Granular Matter 11 (6), 391–401. doi:10.1007/s10035-009-0144-4
Ayachit, U. (2015). The ParaView guide: a parallel visualization application. New York, NY: Kitware.
Banimahd, M., Woodward, P. K., Kennedy, J., and Medero, G. (2012). Behaviour of train-track interaction in stiffness transitions. Proc. Inst. Civil Eng. Transport 165, 205–214. doi:10.1680/tran.10.00030
Boler, H., Mishra, D., Hou, W., and Tutumluer, E. (2018). Understanding track substructure behavior: field instrumentation data analysis and development of numerical models. Trans. Geotech. 17, 109–121. doi:10.1016/j.trgeo.2018.10.001
Brown, S., and Pell, P. (1967). “An experimental investigation of the stresses, strains and deflections in layered pavement structure subjected to dynamic loads,” in 2nd int. conf. on structural design of asphalt pavements, Michigan, Ann Arbor, January 1997.
CEN (2017). European Standard EN 13848-5:2017 Railway applications–track–Track geometry quality–Part 5: geometric quality levels - plain line, switches and crossings 93.100–Construction of railways. Brussels: CEN/TC 256 - railway applications, Comité Européen de Normalisation.
Chen, C., and McDowell, G. R. (2016). An investigation of the dynamic behaviour of track transition zones using discrete element modelling. Proc. Inst. Mech. Eng. F J. Rail. Rapid Transit. 230 (1), 117–128. doi:10.1177/0954409714528892
Costa, D. A., Sofia, E. A., Potvin, R., Laurans, E., and Funfschillling, C. (2014). Railway transitional zones: a case history from ballasted to ballastless track. Int. J. Railway Tech. 3 (1), 37–61. doi:10.4203/ijrt.3.1.2
Dahal, B., and Mishra, D. (2020). Discrete element modeling of permanent deformation accumulation in railroad ballast considering particle breakage. Front. Built Environ. [Epub ahead of print]. doi:10.3389/fbuil.2019.00145
ERRI (1999). Bridge ends–embankment structure transition, state of art report, D230.1 committee. Utrecht: European Rail Research Institute.
Fortunato, E., Paixão, A., and Fontul, S. (2012). “Improving the use of unbound granular materials in railway sub-ballast layer,” in Advances in transportation geotechnics II (Japan: Hokkaido University), September 10–12.
Hughes, T. J. R. (2012). The finite element method: linear static and dynamic finite element analysis. United States: Dover Publications.
Hunt, H. E. M. (1997). Settlement of railway track near bridge abutments. (Third paper in young railway engineer of the year (1996) award). Proc. Inst. Civil Eng. Transport 123 (1), 68–73. doi:10.1680/itran.1997.29182
Kempfert, H. G., and Hu, Y. (1999). Prediction on the long-term behavior of subsoils under high-speed railways Amsterdam: Geotechnical Engineering for Transportation Infrastructure.
Knothe, K., and Grassie, S. L. (1993). Modelling of railway track and vehicle/track interaction at high frequencies. Vehicle Syst. Dyn. 22 (3-4), 209–262. doi:10.1080/00423119308969027
Lekarp, F., Isacsson, U., and Dawson, A. (2000). State of the art. I: resilient response of unbound aggregates. J. Transp. Eng. 126 (1), 66–75. doi:10.1061/(asce)0733-947x(2000)126:1(66)
Li, X., Ekh, M., Nielsen, J. C. O., and Nielsen, O. (2016). Three-dimensional modelling of differential railway track settlement using a cycle domain constitutive model. Int. J. Numer. Anal. Meth. Geomech. 40 (12), 1758–1770. doi:10.1002/nag.2515
Lundqvist, A., and Dahlberg, T. (2005). Load impact on railway track due to unsupported sleepers. Proc. Inst. Mech. Eng. Part F J. Rail. Rapid Transit. 219 (2), 67–77. doi:10.1243/095440905x8790
Lysmer, J., and Kuhlemeyer, R. L. (1969). Finite dynamic model for infinite media. J. Engrg. Mech. Div. 95 (4), 859–877. doi:10.1061/jmcea3.0001144
Mauer, L. (1995). An interactive track-train dynamic model for calculation of track error growth. Int. J. Vehicle Mech. Mobility 24, 209–221. doi:10.1201/2F9780203750490-17
Newton, S. G., and Clark, R. A. (1979). An investigation into the dynamic effects on the track of wheelflats on railway vehicles. J. Mech. Eng. Sci. 21 (4), 287–297. doi:10.1080/00423119508969626
Ngamkhanong, C., Ming, Q. Y., Li, T., and Kaewunruen, S. (2020). Dynamic train-track interactions over railway track stiffness transition zones using baseplate fastening systems. Eng. Fail. Anal. 118, 104866. doi:10.1016/j.engfailanal.2020.104866
Niemunis, A., Wichtmann, T., and Triantafyllidis, T. (2005). A high-cycle accumulation model for sand. Comput. Geotechnics 32 (4), 245–263. doi:10.1016/j.compgeo.2005.03.002
Paixão, A., Fortunato, E., and Calçada, R. (2013). Design and construction of backfills for railway track transition zones. Proc. Inst. Mech. Eng. Part F J. Rail. Rapid Transit. 229, 58–70. doi:10.1177/0954409713499016
Paixão, A. (2014). Transition zones in railway tracks: an experimental and numerical study on the structural behaviour. PhD thesis. Porto (Portugal): Department of Civil Engineering, University of Porto, Faculty of Engineering.
Paixão, A., Fortunato, E., and Calçada, R. (2014). Transition zones to railway bridges: track measurements and numerical modelling. Eng. Structures 80, 435–443. doi:10.1016/j.engstruct.2014.09.024
Paixão, A., Fortunato, E., and Calçada, R. (2015). Design and construction of backfills for railway track transition zones. Proc. Inst. Mech. Eng. Part F J. Rail. Rapid Transit. 229 (1), 58–70. doi:10.1177/0954409713499016
Paixão, A., Varandas, J. N., Fortunato, E., and Calçada, R. (2016a). “Non-linear behaviour of geomaterials in railway tracks under different loading conditions,” in 3rd international conference on transportation Geotechnics (CTG 2016), Guimarães, Portugal, September 04–07, 2016.
Paixão, A., Fortunato, E., and Calçada, R. (2016b). A contribution for integrated analysis of railway track performance at transition zones and other discontinuities. Construction Building Mater. 111 (C), 699–709. doi:10.1016/j.conbuildmat.2016.02.126
Paixão, A., Fortunato, E., and Calçada, R. (2016c). A numerical study on the influence of backfill settlements in the train/track interaction at transition zones to railway bridges. Proc. Inst. Mech. Eng. Part F J. Rail. Rapid Transit. 230 (3), 866–878. doi:10.1177/0954409715573289
Paixão, A., Varandas, J. N., Fortunato, E., and Calçada, R. (2016d). Non-linear behaviour of geomaterials in railway tracks under different loading conditions. Proced. Eng. 143, 1128–1135. doi:10.1016/j.proeng.2016.06.147
Paixão, A., Varandas, J. N., Fortunato, E., and Calçada, R. (2018). Numerical simulations to improve the use of under sleeper pads at transition zones to railway bridges. Eng. Structures 164, 169–182. doi:10.1016/j.engstruct.2018.03.005
Pita, A. L., Teixeira, P. F., Robuste, F., and Robusté, F. (2004). High speed and track deterioration: the role of vertical stiffness of the track. Proc. Inst. Mech. Eng. Part F J. Rail. Rapid Transit. 218 (1), 31–40. doi:10.1243/095440904322804411
Powrie, W., and Le Pen, L. (2016). A guide to track stiffness. Southampton, UK: University of Southampton.
Punetha, P., Nimbalkar, S., and Khabbaz, H. (2020). Analytical evaluation of ballasted track substructure response under repeated train loads. Int. J. Geomechanics 20 (7), 04020093. doi:10.1061/(ASCE)GM.1943-5622.0001729
Quibel, A., Hosseingholian, M., and Guillevic, G. (2010). The role of stiffness in railway infrastructures and its measurement. IV Jornadas Internacionales: Ingeniería para Alta Velocidad. Córdoba, June 16–18.
Selig, E. T., and Waters, J. M. (1994). Track geotechnology and substructure management. London: Thomas Telford.
Shan, Y., Zhou, S., Zhou, H., Wang, B., Zhao, Z., Shu, Y., et al. (2017). Iterative method for predicting uneven settlement caused by high-speed train loads in transition-zone subgrade. Transportation Res. Rec. 2607 (1), 7–14. doi:10.3141/2607-02
Shih, J. Y., Grossoni, I., and Bezin, Y. (2019). Settlement analysis using a generic ballasted track simulation package. Transportation Geotechnics 20, 100249. doi:10.1016/j.trgeo.2019.100249
Stark, T. D., and Wilk, S. T. (2016). Root cause of differential movement at bridge transition zones. Proc. Inst. Mech. Eng. Part F J. Rail. Rapid Transit. 230 (4), 1257–1269. doi:10.1177/0954409715589620
Suiker, A. S. J. (2002). The mechanical behaviour of ballasted railway tracks. Delft, Nether land: Delft University of Technology.
Suiker, A. S. J., and de Borst, R. (2003). A numerical model for the cyclic deterioration of railway tracks. Int. J. Numer. Meth. Engng. 57 (4), 441–470. doi:10.1002/nme.683
Varandas, J. N. (2013). Long-term behaviour of railway transitions under dynamic loading. PhD thesis. Lisbon (Portugal): Faculdade de Ciências e Tecnologia da Universidade Nova de Lisboa.
Varandas, J. N., Hölscher, P., and Silva, M. A. (2014a). Settlement of ballasted track under traffic loading: application to transition zones. Proc. Inst. Mech. Eng. Part F J. Rail. Rapid Transit. 228 (3), 242–259. doi:10.1177/0954409712471610
Varandas, J. N., Paixão, A., Fortunato, E., Hölscher, P., and Calçada, R. (2014b). Numerical modelling of railway bridge approaches: influence of soil non-linearity. Int. J. Railw Tech. 3 (4), 73–95. doi:10.4203/ijrt.3.4.4
Varandas, J. N., Paixão, A., Fortunato, E., and Paul, H. (2016a). “A numerical study on the stress changes in the ballast due to train passages,” in 3rd international conference on transportation Geotechnics (CTG 2016), Guimarães, Portugal, September 04–07, 2016.
Varandas, J. N., Hölscher, P., and Silva, M. A. G. (2016b). Three-dimensional track-ballast interaction model for the study of a culvert transition. Soil Dyn. Earthquake Eng. 89, 116–127. doi:10.1016/j.soildyn.2016.07.013
Varandas, J. N., Paixão, A., and Fortunato., E. (2017). A study on the dynamic train-track interaction over cut-fill transitions on buried culverts. Comput. Structures 189, 49–61. doi:10.1016/j.compstruc.2017.04.017
Varandas, J. N., Paixão, A., Fortunato, E., Zuada Coelho, B., and Hölscher, P. (2020). Long-term deformation of railway tracks considering train-track interaction and non-linear resilient behaviour of aggregates - a 3D FEM implementation. Comput. Geotechnics 126, 103712. doi:10.1016/j.compgeo.2020.103712
Wang, H., Silvast, M., Markine, V., and Wiljanen, B. (2017). Analysis of the dynamic wheel loads in railway transition zones considering the moisture condition of the ballast and subballast. Appl. Sci. 7 (12), 1208. doi:10.3390/app7121208
Werkmeister, S., Dawson, A., and Wellner, F. (2001). Permanent deformation behavior of granular materials and the shakedown concept. Transp. Res. Rec., 1757 (1), 75–81. January 1, 2001. doi:10.3141/1757-09
Zhai, W. M. (1996). Two simple fast integration methods for large-scale dynamic problems in engineering. Int. J. Numer. Meth. Engng. 39 (24), 4199–4214. doi:10.1002/(sici)1097-0207(19961230)39:24<4199::aid-nme39>3.0.co;2-y
Keywords: train-track interaction, permanent deformation, high-cycle strain accumulation model, three-dimensional numerical modeling, non-linear resilient behavior, transition zones, railway tracks
Citation: Paixão A, Varandas JN and Fortunato E (2021) Dynamic Behavior in Transition Zones and Long-Term Railway Track Performance. Front. Built Environ. 7:658909. doi: 10.3389/fbuil.2021.658909
Received: 26 January 2021; Accepted: 17 February 2021;
Published: 31 March 2021.
Edited by:
Sanjay Shrawan Nimbalkar, University of Technology Sydney, AustraliaReviewed by:
Yifei Sun, Ruhr University Bochum, GermanyChayut Ngamkhanong, University of Birmingham, Birmingham, United Kingdom
Ilaria Grossoni, University of Huddersfield, United Kingdom
Copyright © 2021 Paixão, Varandas and Fortunato. This is an open-access article distributed under the terms of the Creative Commons Attribution License (CC BY). The use, distribution or reproduction in other forums is permitted, provided the original author(s) and the copyright owner(s) are credited and that the original publication in this journal is cited, in accordance with accepted academic practice. No use, distribution or reproduction is permitted which does not comply with these terms.
*Correspondence: André Paixão, YXBhaXhhb0BsbmVjLnB0