 Vasiliki Terzi
 Asimina Athanatopoulou
- Laboratory of Structural Analysis and Dynamics of Structures, Department of Civil Engineering, Aristotle University of Thessaloniki, Thessaloniki, Greece
The present study aims to investigate the effects of the seismic vertical component on the pathology of Xana monument which is a typical caravanserai, constructed circa 1375–1385 and is located in the archeological site of the municipality of Trainapoulis, Greece. The monument’s plan is rectangular and the three-leaf masonry circumferential walls support a hemicylindrical dome constructed by bricks and mortar. The structure consisted of two consecutive parts: one for the travelers and one for the animals. Nowadays, the triangular roof, that covered the structure, and the first part of the monument do not exist. Xana suffers tensile cracks along the interior surface of the dome, a vertical fracture located on the northern wall and vertical tensile cracks located at the openings. A three-dimensional finite element model of the initial state of Xana is constructed. Non-linear material behavior is taken into account as well as soil-structure interaction effects. An adequate number of near-field earthquake events has been used, taking into account that they are related to significant vertical components. The structural seismic analysis is conducted for two cases. The first case refers to the action of the two horizontal-component of ground motions while the second one takes into account the three translational seismic components. The pathology estimation reveals important information concerning the structural effects due to vertical accelerations.
Introduction
The vertical component consists an integral part of the seismic action and is defined by design codes [EC8]. It is described in the forms of: (i) spectrum, elastic, or design; (ii) time-history, artificial, or recorded/simulated accelerogram. The effect of the vertical ground motion component on masonry structures or structures, in general, has been investigated by various researchers. Papazoglou and Elnashai (1996) studied the effects of the vertical earthquake ground motion on buildings and bridges, based on field evidence and analytical results. They concluded that certain failure modes are attributed to the high vertical forces induced during an earthquake event and stressed the importance of the vertical component during the design phase. Casolo (1998, 2001) reached the conclusion that the vertical component can induce serious additional damage and, therefore, must be taken into account during the seismic risk assessment of slender masonry towers. Furthermore, Casolo et al. (2017) studied the influence of soil deformability, taking into account two different extreme cases of soft (E = 280 MPa) and stiff (E = 1400 MPa) soil assumptions, in combination with the vertical ground component. Moosavi et al. (2016) highlighted the increase in the axial forces observed during the vertical ground motion action on the dynamic response of Goltzschtal masonry arch bridge. Bayraktar et al. (2018) investigated the seismic damage propagation of historical masonry minarets due to the vertical seismic action. Rinaldin et al. (2019) concluded that the vertical component is responsible for a general increase on demand/capacity ratios of masonry buildings, which are characterized by boxing behavior. Liberatore et al. (2019) have investigated the effects of the vertical component on the damage of masonry constructions during the 2016 Amatrice-Norcia earthquake events. They reached the conclusion that the vertical component is responsible for extensive failures regarding structures with small cohesion, while its effects are limited in structures with medium cohesion. Angelides (2011) and Breccolotti and Materazzi (2016) verified the crucial effects of the vertical component on the seismic response of masonry chimneys. Mosoarca et al. (2020) proposed a seismic vulnerability assessment methodology of historic masonry buildings located in near-field areas, also highlighting the vertical ground motion component.
The vertical ground motion has different characteristics than the horizontal ground motion (Di Michele et al., 2019). In particular, it is characterized by higher frequency content than the horizontal earthquake components. Therefore, its effects on massive masonry structures, which behave in the high frequency range, must be thoroughly investigated. Furthermore, it is usually noticed that the peak vertical acceleration occurs earlier than the peak horizontal acceleration. Therefore, the failure mechanism attributed to the vertical ground motion leads to a more abrupt overall structural failure. However, the vertical ground motion attenuates more rapidly than the horizontal one. Therefore, its effects are more intensive in small source-to-site distances, which can be characterized as near-field earthquakes (Abrahamson and Litehiser, 1989; Silva, 1997; Diotallevi and Landi, 2000; Chioccarelli and Iervolino, 2009). The first signals recorded during an earthquake event are the volume waves, which consist of the primary, P waves, and secondary waves, S. The primary waves, which are characterized by a greater value of velocity of propagation than the secondary waves, are longitudinal waves that generate an oscillation of soil particles along the direction of the wave propagation. The secondary waves generate an oscillation of soil particles perpendicular to the direction of the wave propagation and can be divided into two shear wave components, SV and SH. Therefore, primary and SV waves contribute to the vertical ground component. As the earthquake phenomenon continues, the second type of recorded waves are the surface waves, which consist of Rayleigh waves, R and Love waves, L. Rayleigh waves are the resultant of P and SV waves, while Love waves are generated by the SH waves trapped near the surface. Therefore, Rayleigh waves also contribute to the vertical seismic component as well.
The present study focuses on a masonry building type that does not belong to the architectural typologies of the structures in the aforementioned studies. The historical masonry case study refers to a khan, which consists of two elongated walls, connected by three lateral walls and covered by a barrel roof. The main target is the investigation of the effects of the vertical ground component on the pathology of the structure. In particular, the question that arises is the following: Can the present state of the monument be attributed to the action of the vertical ground component? For this purpose, two different analyses are conducted. The first one refers to the action of the two horizontal ground motion components while the second one refers to the three ground motion components, that is the vertical component is applied simultaneously with the horizontal ones. The masonry material is considered non-linear while the contribution of soil flexibility is also taken into account.
Historical Structure Under Study: Xana
The historical structure under study is named Xana, a caravanserai, constructed by Ghazi Evrenos Bey circa 1375-1385 (Kiel, 1990). It is situated at an important geographical point, close to via Egnatia, the Roman city of Traianoupolis, the thermal springs of Loutra village and is located 13 km far from the city of Alexandroupolis, prefecture of Evros in Greece. In 1964 the broader area where Xana belongs was characterized as an archeological area by the Hellenic Ministry of Culture and Tourism.
The structure’s plan is rectangular (Figure 1A). The circumferential walls consist of three-leaf masonry with a thickness of 1.4 m and rise up to 4.97 m from the ground surface Figure 1B. The inner leaf is constructed by rumble stones and mortar, while the two exteriors by cloisonné masonry. The monument is covered by a hemicylindrical vault of bricks and mortar which rises to 7.26 m. The dome was initially protected by a wooden roof with red tiles (Kalafatzis, 2008), which does not exist nowadays. An inner wall with a thickness of 1.4 m divides the structure into two parts (Figure 1A). The first part, which is completely destroyed nowadays, fulfilled the needs of the lodging of travelers. It had six fireplaces, F1–F6 (Figure 1C) for cooking and heating. In the early 1900s, the dome collapsed due to its heavy self-weight (Kiel, 1990). Furthermore, in 1939, the main gate and the highest parts of the circumferential walls collapsed as well, during the construction of a military road passing in front of the structure (Minopoulos, 2001). A wooden tendon, WT4 of dimensions 0.15 m × 0.15 m, connected the eastern and western circumferential walls (Figure 1A). The second part is divided almost equally by two stone arches (Ar3-Ar4) and was used as a stable for the animals (Figure 1D). Two additional stone arches (Ar1-Ar2) were constructed in contact with the inner and northern exterior wall (Figure 1D). Three wooden tendons, WT1-3, of dimensions 0.15 m × 0.15 m were situated at a height of 4.30 m and connected the eastern and western circumferential walls while two others, WT5-WT6, of the same dimensions were situated at a height of 2.60 m and connected the two sides of stone arches Ar3 and Ar4. The presence of two square holes (0.15 m × 0.15 m) justifies the existence of wooden beams (Figure 1E) running along the exterior walls at the height of 2.60 m. Three windows on the northern wall and three more on the western wall fulfilled the needs of physical lighting and ventilation as well (Figures 1F,G).
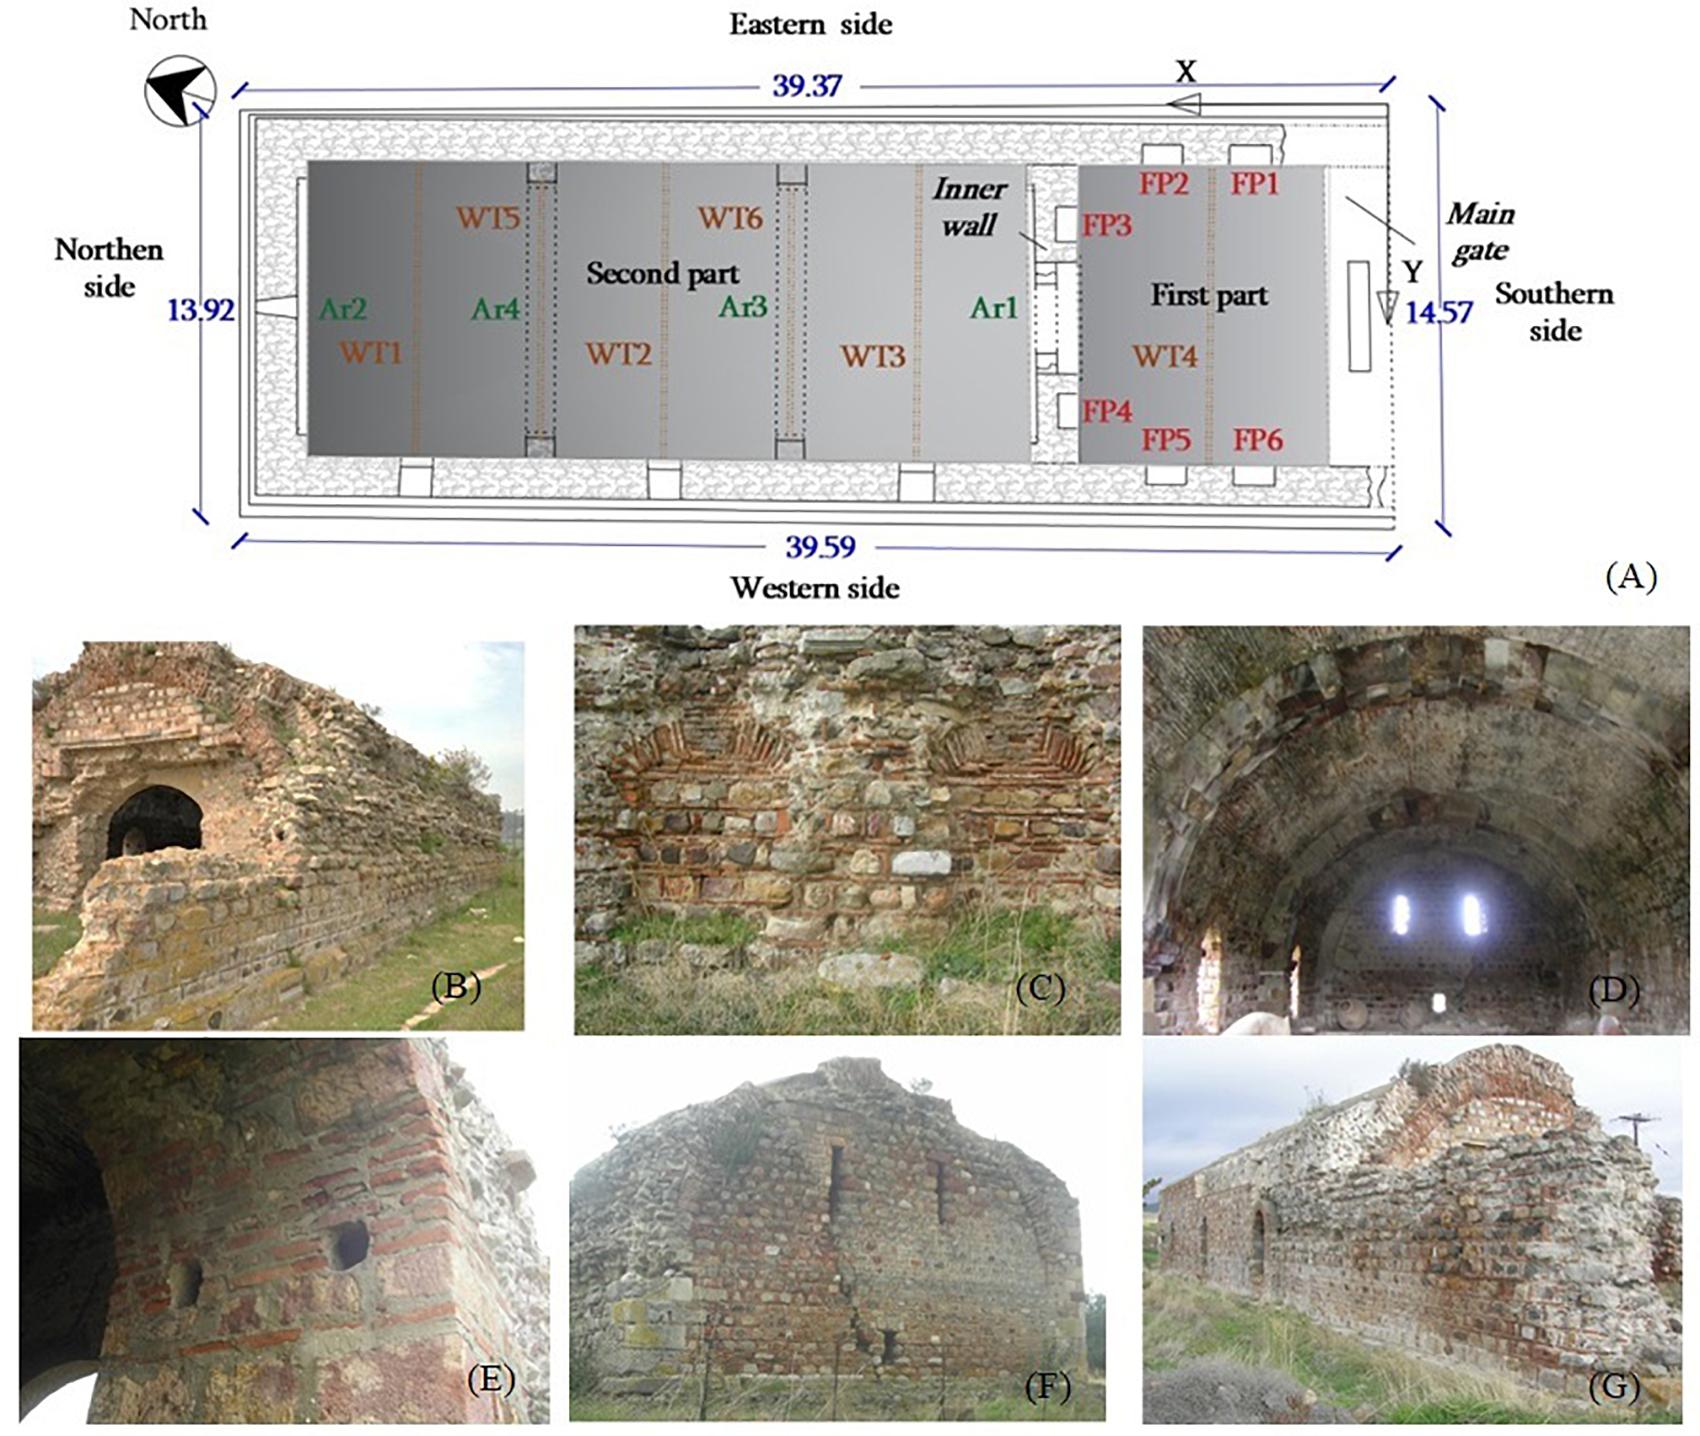
Figure 1. (A) Monument’s plan. (B) Eastern side and inner wall. (C) Fire places. (D) Stone arches. (E) Square holes for wooden tendons. (F) Northen side. (G) Western side.
The behavior of an existing structure as well as the selection of the most suitable restoration methods must be based not only on the construction scheme but on the identification and monitoring of its pathology as well [Taliercio and Binda, 2007; Sanchez-Aparicio et al., 2014].
Two extreme tensile cracks can be detected in the structure: (i) a vertical fracture on the northern wall, which is possibly attributed to soil subsidence due to the combination of the high water level of the nearby thermal baths and the clayey soil foundation (Figure 1F; Terzi and Ignatakis, 2018; Terzi, 2020); (ii) a horizontal fracture along the key line of the interior surface of the barrel vault and vertical fractures at the locations of the windows of the western side, which are possibly attributed to the combination of the large self-weight of the roof and the destruction of the wooden tendons (Figure 2A; Terzi and Ignatakis, 2018; Terzi, 2020). The pathology picture is also characterized by: blistering and efflorescence due to the action of marine aerosols since Xana is located only 6 km far from the Aegena sea (Figure 2B); loss of stone material; hair cracks; mortar pulverization; biological colonization (Figure 2C); drainage problems.
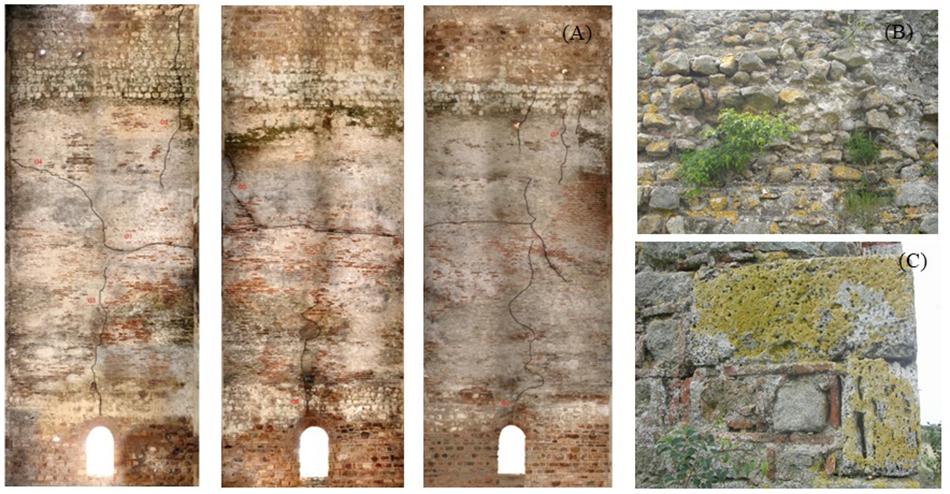
Figure 2. (A) Tensile cracks along the roof key line and over the windows. (B) Efflorescence. (C) Biological colonization.
In Vavritsas (1968) and Pentazos (1969) restoration works took place which mainly aimed at the healing of cracks and the monument’s protection from rain waters. In 1998, the western side was partly reconstructed (Terzi, 2010). The public is not allowed to visit the interior of the monument.
Finite Element Modeling
Historical masonry buildings are usually irregular, massive, and complex, so their structural behavior is not easy to estimate under seismic action (Giordano et al., 2019; Mosoarca et al., 2020). The finite element method is applied in order to effectively investigate the structural behavior of masonry structures. The development of the finite element model of an existing structure usually consists of the following steps: geometrical surveying; construction of the 3D geometry in the numerical code; investigation and selection of the most appropriate finite element types; discretization of the numerical model; identification of material properties through in situ or laboratory investigation; investigation and implementation of the most appropriate material models; definition and application of loading conditions; investigation and application of boundary conditions; analysis performance; thorough interpretation of the analyses results (Ramirez et al., 2012). The representation of the overall structural spatial configuration in terms of self-weight; stiffness; openings; wall thickness; and relevant architectural elements by the finite element model, defines the outcomes of the analyses performed (Betti and Vingoli, 2011; Bartoli et al., 2020; Kita et al., 2020). The finite element model of the case study refers to the initial configuration of the masonry structure. Therefore, vital information was derived by a detailed historical survey referring to bibliography investigation; old time photographs; existing initial drawings; public records; and extensive in situ surveys (Terzi and Ignatakis, 2018).
Finite Element Model of Case Study
The finite element model consists of 18,310 finite elements (Figure 3). In particular, 16,722 3D 8noded solid finite elements are used for the simulation of the non-linear masonry; 474 Hermitian beam elements are used for the simulation of the wooden tendons; and 1,114 spring elements attached to the ground are used for the simulation of the soil flexibility in the vertical direction. Rotations around the three orthogonal axes (XYZ) are prohibited to the common nodes of the Hermitian beam and 3D solid elements.
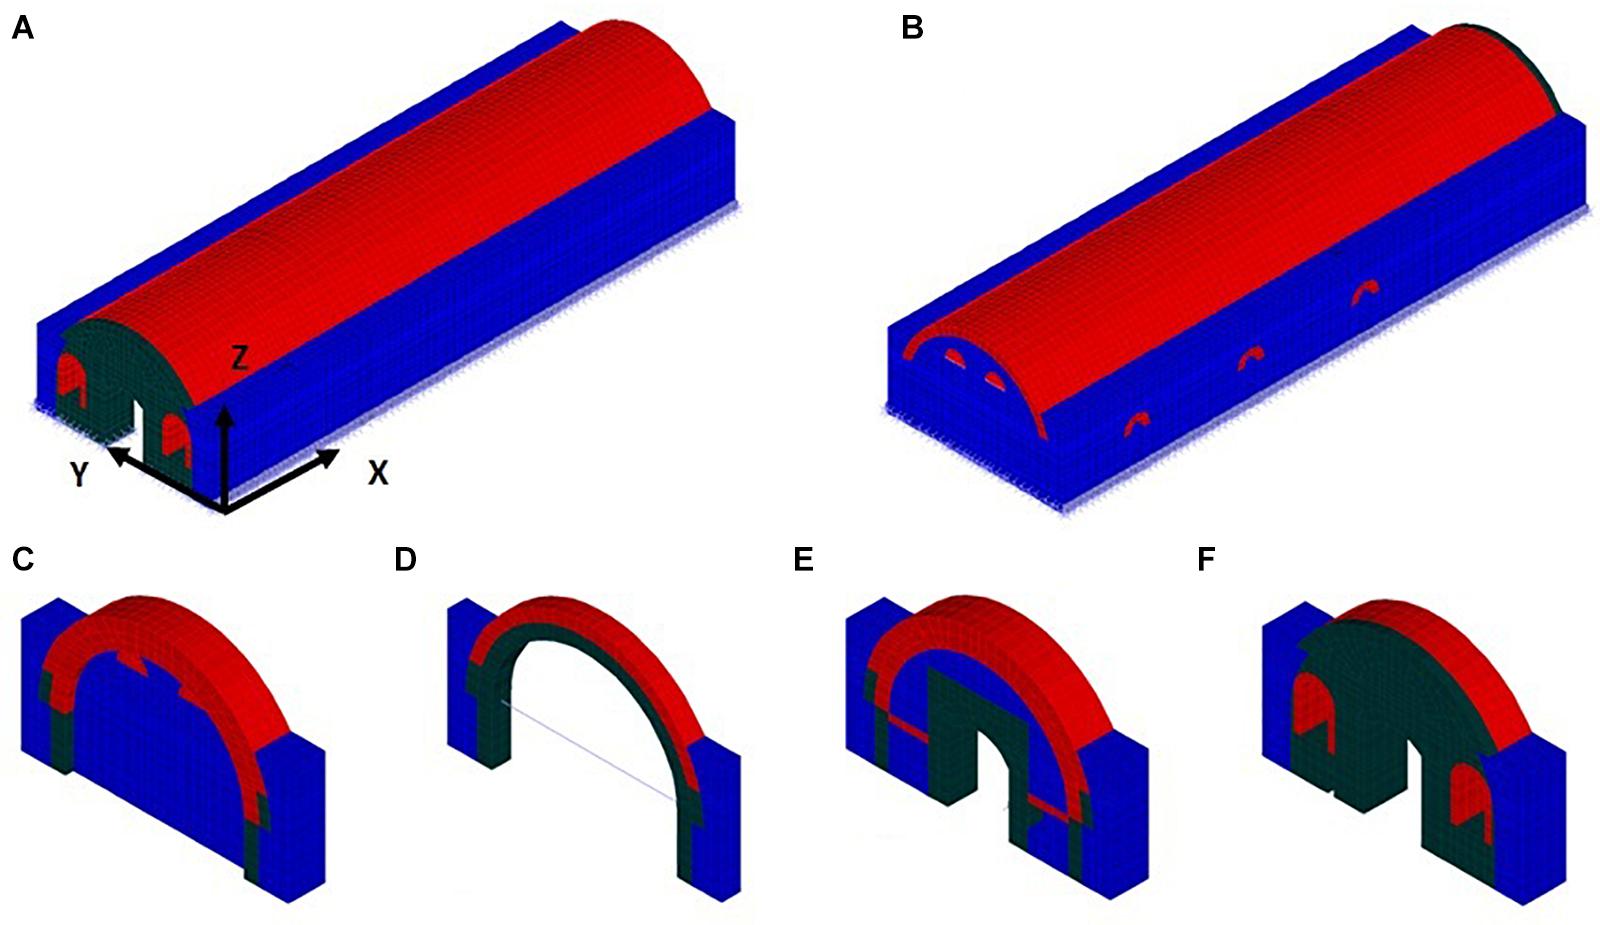
Figure 3. (A) Eastern side. (B) Western side. (C) Northern side. (D) Typical ston arch. (E) Inner wall. (F) Main gate.
The wooden roof of the monument is not simulated in the finite element model but its self-weight and variable loadings, such as wind and snow, are taken into account as an individual loading case.
Soil-structure interaction is taken into account by the use of vertical spring elements. The foundation of the monument has a depth of 1.3 m. In particular, two rectangular embedded foundations are considered in the longitudinal direction of the structure and three in the lateral direction. The values of the vertical stiffness of each foundation are defined according to Gazetas (1991) and for each foundation are distributed at base nodes according to the corresponding areas of influence. Furthermore, the translations at the horizontal directions are prohibited in order to simulate its embedment.
Materials
The analyses results are sensitive to the material properties of the structural elements. Therefore, experimental data based on in situ or laboratory tests are mandatory. During the investigation phase, six samples of bricks and four samples of stones were taken from the debris and submitted to laboratory compression and density tests (Terzi, 2010). The masonry material is considered to be isotropic, homogeneous, and non-linear. The characteristic compressive strength is determined according to EC6 (European Committee for Standardization En 1996-1, 2005) in parallel to a homogenization method which is usually applied in masonry analyses (Genna et al., 1998; Cardoso et al., 2005; Mallardo et al., 2008; Betti and Vingoli, 2011).
Non-linear analysis is necessary in order to highlight the collapse mechanisms that are close to reality (Rinaldin et al., 2019). Therefore, the non-linear nature of masonry sections, which are three-leaf circumferential masonry, stone masonry, and roof, is simulated by the use of the concrete material model. Concrete behavior is characterized by the following features: tensile failure due to cracking,ft; compression crushing failure,fk; strain softening after crushing until an ultimate strain, at which the total failure of the material takes place. The use of the concrete material model in the simulation of the non-linear behavior of masonry structures has been extensively applied (Mallardo et al., 2008; Acito et al., 2014; Moosavi et al., 2016; Bayraktar et al., 2018; Valente and Milani, 2018; Ombres and Verre, 2019). Tensile strength of masonry is usually not defined by design codes. However, in many non-linear studies of masonry behavior, the tensile strength is usually defined as a percentage of shear strength (Tomazevic, 2009) or a percentage of compressive strength (Bayraktar et al., 2018; Valente and Milani, 2018). In the present study, the characteristic tensional strength,ft was considered equal to 1/20 of the characteristic compressive strength,fk of all masonry materials.
The most important characteristics of the non-linear masonry material are the following: (i) three-leaf masonry -Etangent = 5531.263 MPa,fk = 6.146 MPa,ft = 0.307 MPa; (ii) stone arch -Etangent = 11756.332 MPa,fk = 13.063 MPa,ft = 0.653 MPa; (iii) brick roof -Etangent = 4520.766 MPa,fk = 5.023 MPa,ft = 0.251 MPa.
Loading
The loading of the structure refers to its self-weight and variable functional actions in combination with ground motion. Firstly, a static non-linear analysis is performed which takes into account the self-weight of the masonry structure; the self-weight of the roof; and variable actions such as snow or wind. Secondly, dynamic non-linear analyses are carried out based on ground motion acceleration records while the actions of the first loading are still present. The first step of each dynamic analysis corresponds to the last step of the static non-linear analysis. In order to clarify the effects of the vertical seismic component on the structural behavior, two dynamic analyses are performed for each ground motion: (i) in the first analysis case, the two horizontal components (H2) are applied; (ii) in the second analysis case, the two horizontal components and the vertical one (H2V) are applied simultaneously.
In total, ten unscaled natural ground motions were selected from the PEER Ground Motion Database (2015). The selection of the ground motions was based on the following characteristics: (i) shear wave velocity of the upper 30 meters range between 180 m/sec and 360 m/sec; (ii) normal and reverse fault type; (iii) magnitude greater than 4.5; (iv) Joyner and Boore distance smaller than 30 km; (v) rupture distance smaller than 30 km. The first variable corresponds to ground type C according to EC8 (European Committee for Standardization En 1998-1, 2004) which is assumed to characterize the location of the monument under study. In particular, the monument’s area is characterized by loose soil deposits (Dimosthenous et al., 2006). Furthermore, according to drilling results, the stratigraphic column of the nearby area corresponds to clayey sediments at a depth of 55m (Karmis et al., 2004). Finally, the value of Joyner and Boore distance corresponds to near field events, based on the definition given by Di Sarno et al. (2011).
Table 1 summarizes the characteristics of the ground motion records. In the strong motion direction which is perpendicular to the longitudinal axis of the historical structure, the predominant frequencies range between 3.571 Hz and 12.500 Hz. Furthermore, in the weak motion direction, which coincides with the longitudinal axis of the case under study, the predominant frequencies range between 1.515 Hz and 8.333 Hz. Finally, in the vertical direction, the predominant frequencies range between 5.556 Hz and 25.000 Hz.
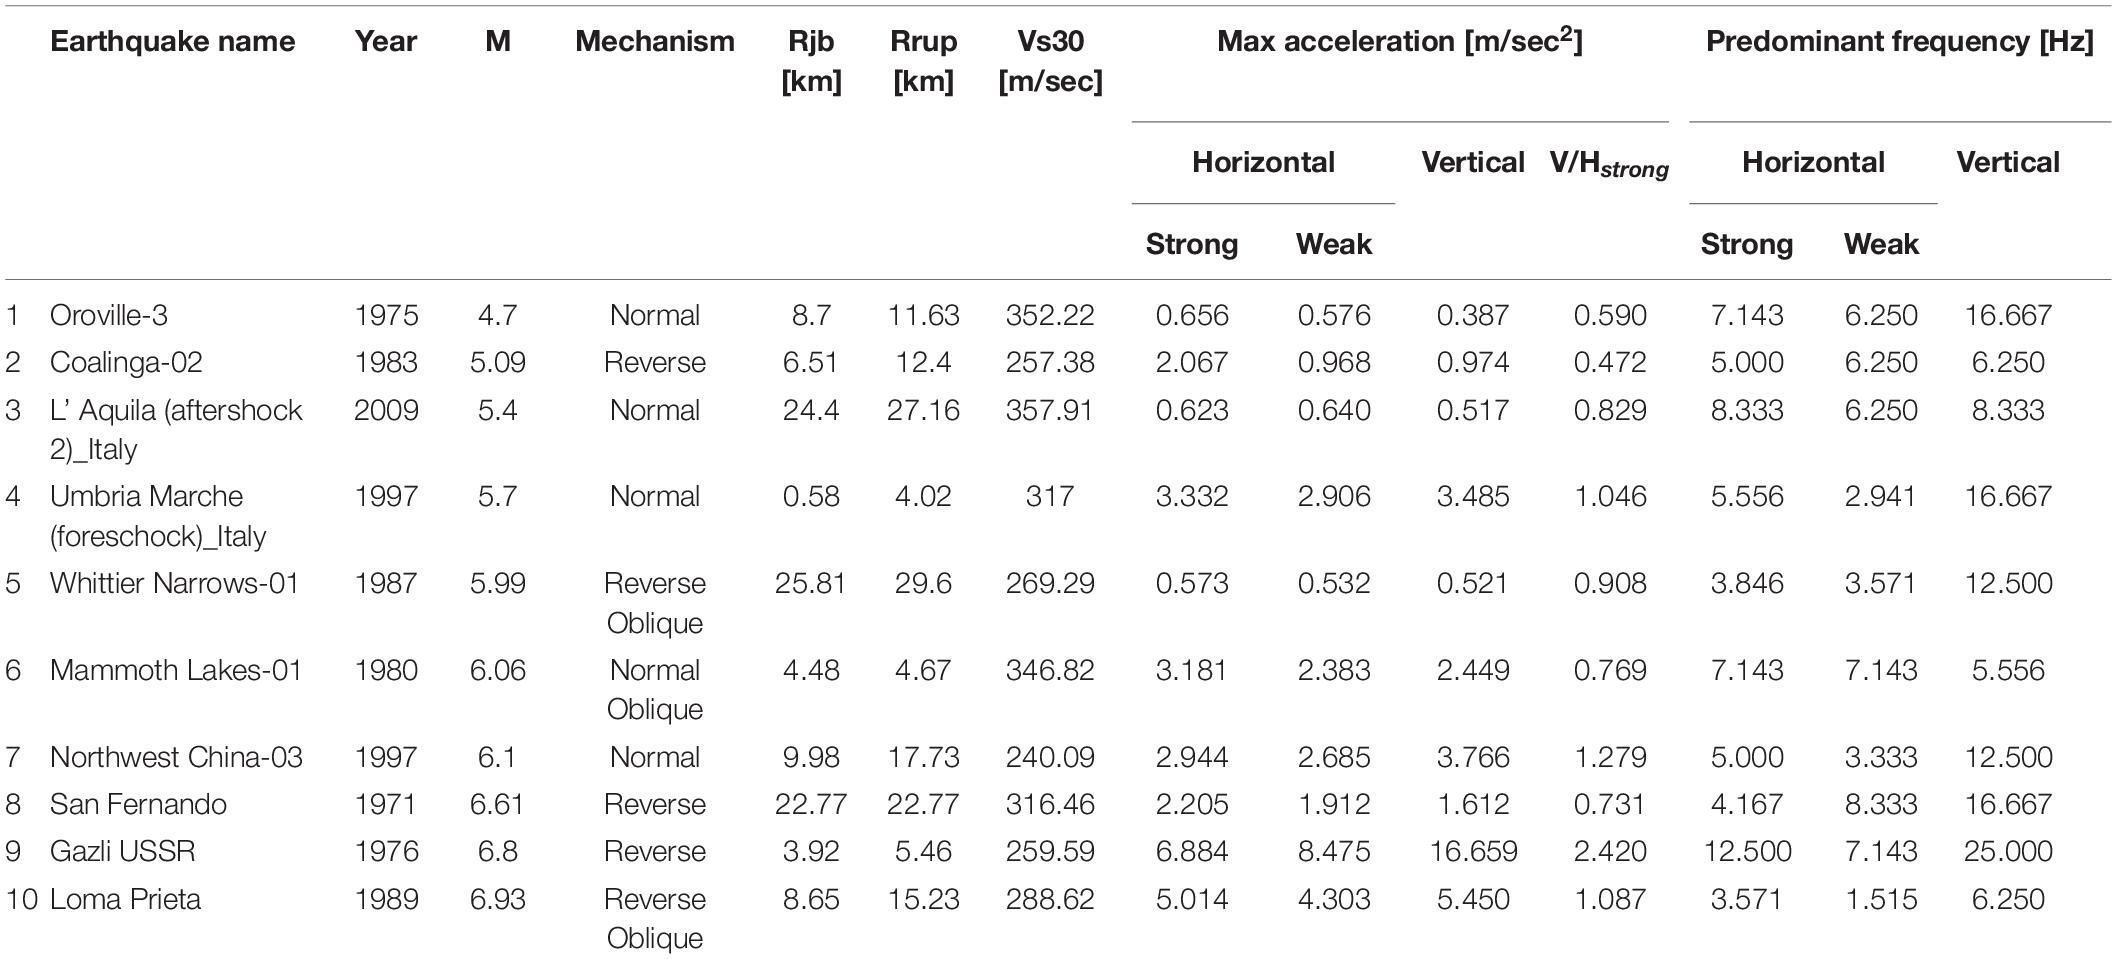
Table 1. Ground motion records characteristics.
Numerical Analyses
Static Non-linear Analysis
Firstly, non-linear static analysis is performed for gravity loads and snow loads as well. The main outcomes of the non-linear static analysis refer to the maximum displacements and the generated cracks. Figure 4A depicts the maximum displacements of the monument. The most characteristic displacement is the vertical one, with a value of 0.2973 mm, which is located at the second part of the structure between the inner wall and Ar3 and is attributed to the heavy roof. The horizontal displacements at the longitudinal axis follow the vertical displacements. The deformation at the transverse axis is characterized by the out-of-plane displacement of the longitudinal walls. Figure 4B depicts with red color the areas of crack generation. Tensile open cracks are observed at the key stones of arches Ar3 and Ar4 (Figure 1A), which are attributed solely to the large self-weight of the roof.
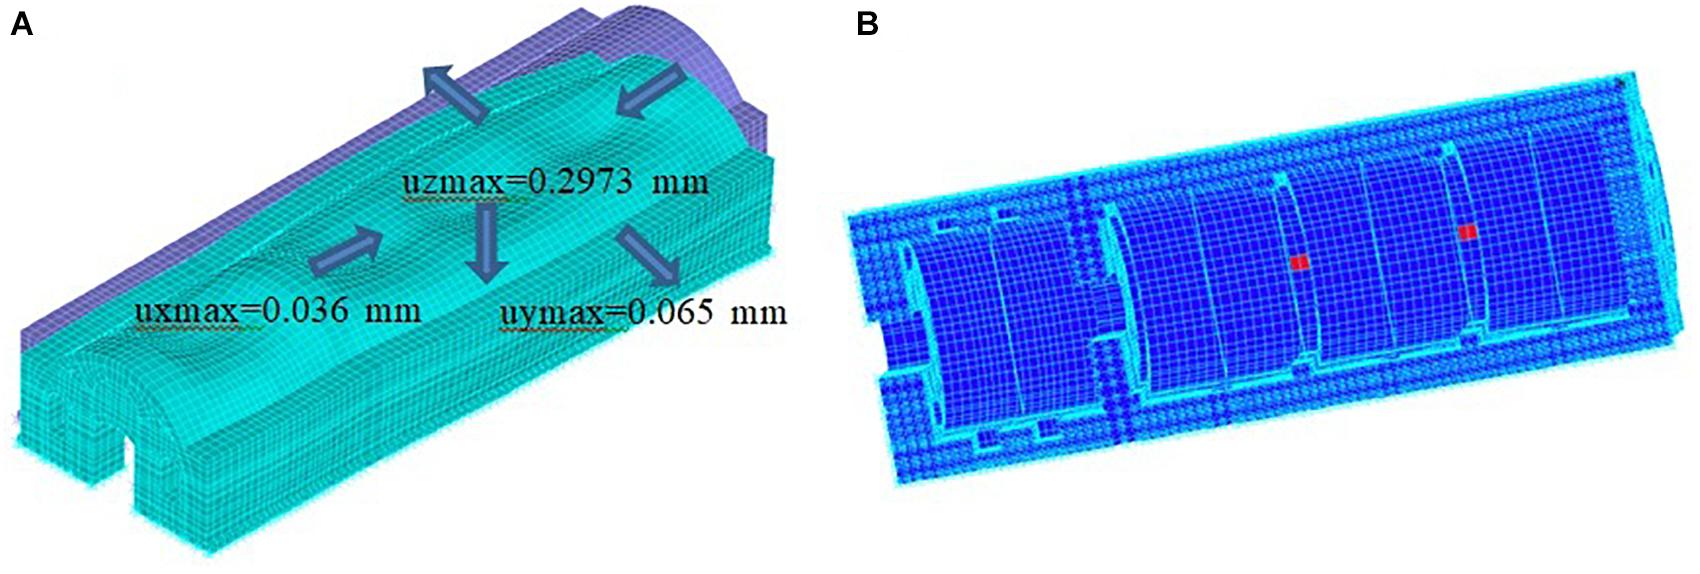
Figure 4. (A) Maximum displacements. (B) Generated cracks.
Modal Analysis
Modal analyses are conducted in order to define a preliminary insight into the dynamic behavior of the structure (Valente and Milani, 2018; Salonikios et al., 2020). The analysis in the frequency domain under the selected ground motions, corresponds to the tangent stiffness matrix and the mass matrix of the structure starting from the end of the static non-linear analysis. The main outcomes refer to the depiction of the vibration modes; the corresponding frequencies and periods; and the mass participation ratios. The modal analysis is performed as a consequent step of the non-linear static analysis. Figure 5 summarizes the main results for the first 20 natural modes of vibration.
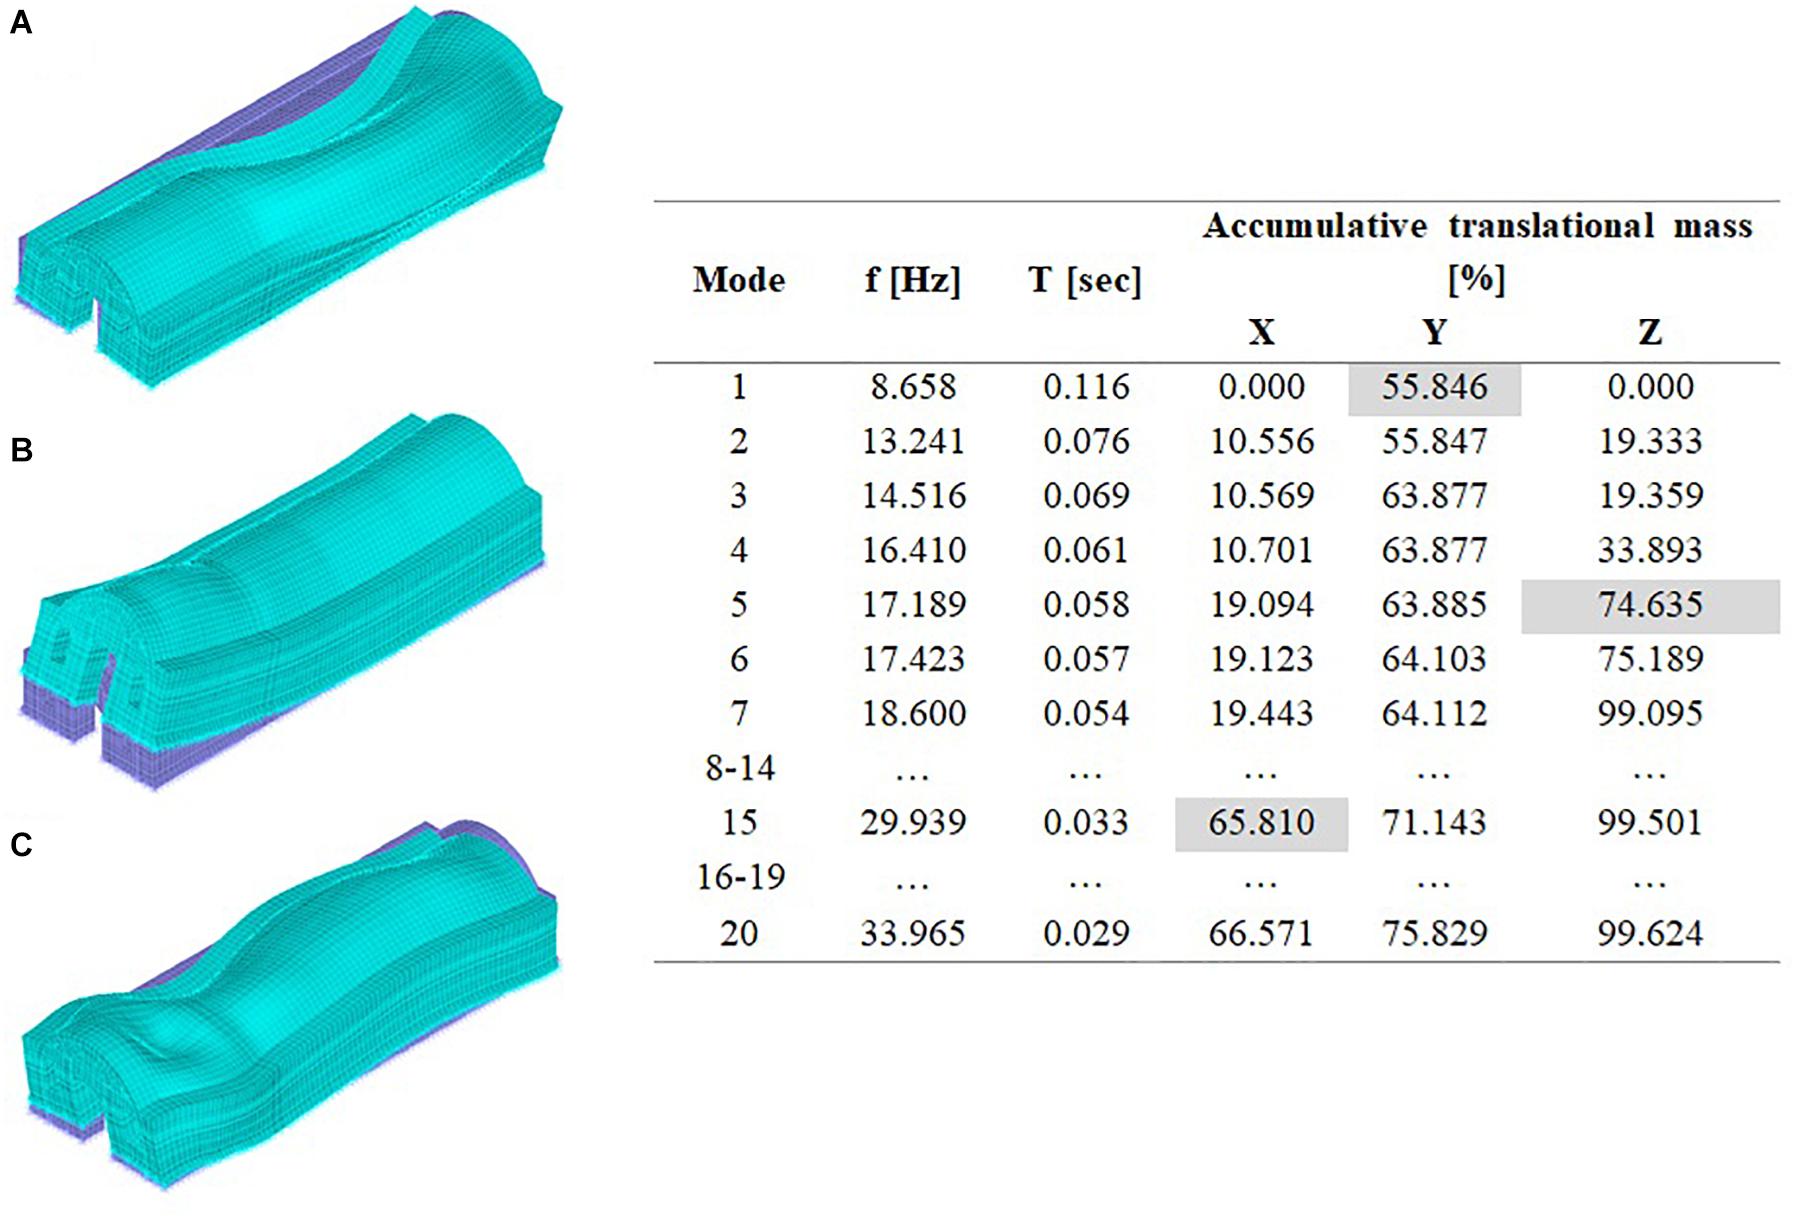
Figure 5. (A) Y translation. (B) Z translation. (C) X translation.
The first natural mode of vibration is characterized by translation along Y axis, which is perpendicular to the longitudinal axis of the monument (Figure 5A). The accumulative translational mass reaches 55.846% of the total mass. The vertical natural mode of vibration is activated the most in the fifth natural mode and corresponds to 40.742% of the total mass. The sum of activated mass equals 74.635% of the total (Figure 5B) along Z axis. It can be noticed that five modes activate 74.635% of the total mass for seismic excitation along Z axis. The corresponding percentages for excitation along X and Y axis are 19.04% and 63.88%, respectively. From Figure 5 we can see that 15 modes activate 65.81, 71.74, and 99.501% of the total mass for seismic excitation along X, Y, and Z directions, respectively (Figure 5C). Furthermore, it must be noticed that the mass which is activated for seismic excitation along the X axis does not increase significantly if more than 15 modes are taken into account. In conclusion, the vertical translation of the monument plays a significant role in the dynamic behavior of the structure.
According to Figure 5, possible resonance phenomena are expected in the strong motion direction for the earthquake events L’ Aquila 2009 and Gazli USSR 1976. In particular, the predominant frequency of the first event is 8.333 Hz and of the second event is 12.5 Hz, both in the proximity of the first and second eigenfrequency values (8.658 Hz and 13.241 Hz). Furthermore, in the vertical direction possible resonance phenomena are expected for the seismic events of Oroville-3 1975, Umbria Marche 1997, and San Fernando 1976. In particular, their predominant frequencies are equal to 16.666 Hz, which is in the proximity of the fifth eigenfrequency of the structure (17.189 Hz). The predominant eigenfrequencies of the earthquake events in the weak motion direction are less than the fifteenth eigenfrequency (29.939 Hz), where the 65.810% of the total horizontal translational mass is effective.
Dynamic Non-linear Analyses
Twenty in total dynamic non-linear analyses were conducted. The first analysis group corresponds to the action of the horizontal components of ground motion (H2) while the second includes the vertical component as well (H2V). The first analysis outcome refers to the type and spatial distribution of the generated cracks. Taking into account the concrete material behavior, the generated cracks can be divided into three category types: open; closed; and crushed. Figure 6 depicts the spatial division of the monument into nine basic structural units.
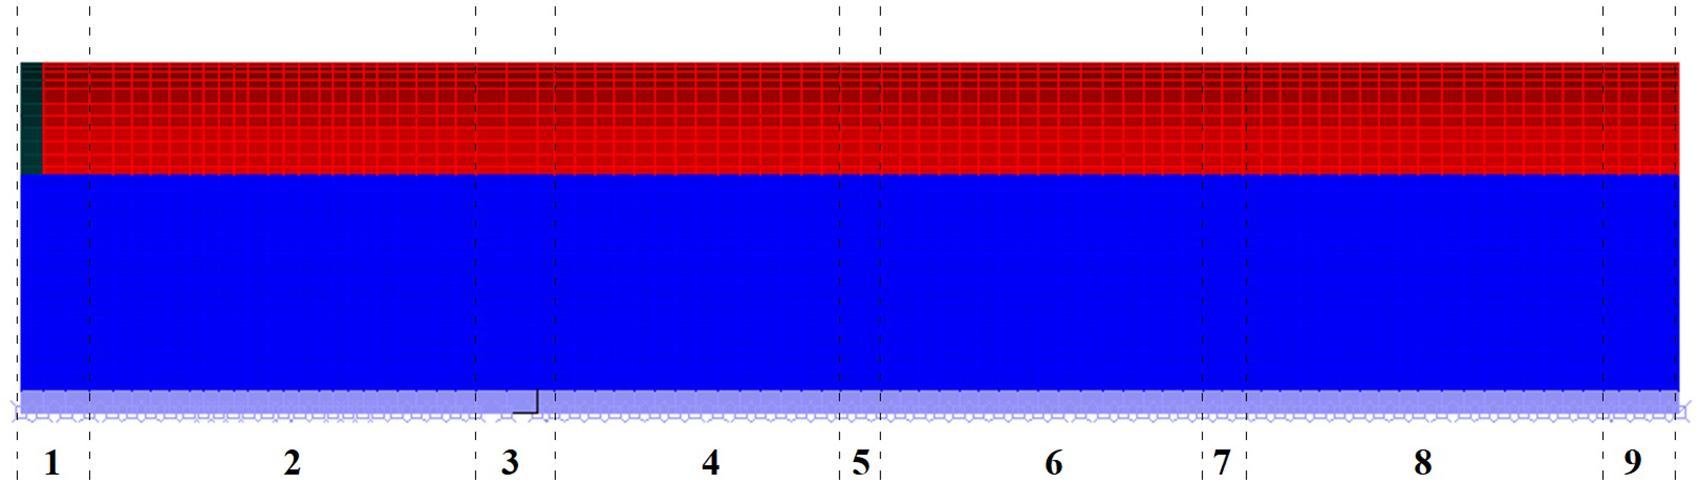
Figure 6. Spatial division into nine basic structural units: 1, main gate; 2, second part; 3, inner wall+Ar1; 4, second part A; 5, Ar3; 6, second part B; 7, Ar4; 8, second part C; 9, western wall+Ar2.
Figure 7 depicts the spatial distribution of the different types of cracks for each earthquake event. The red color corresponds to H2V analyses while the blue one to H2 analyses. The failure mechanism is pronounced at the second part of the structure, while the first part and the main gate do not present any crushed type cracks even under strong magnitude events. For the seismic event of Oroville-3 only open cracks are present for both analysis categories. The aforementioned can be attributed to the small values of horizontal and vertical accelerations (Table 1). Furthermore, the generated cracks due to the simultaneous action of the vertical components are more than the action of two horizontal components. For all the other seismic events, all types of cracks are generated. Open and closed cracks are distributed at all structural units, while crushed cracks are located in the second part of the monument (units 4 to 9). For the majority of the seismic events, except Umbria Marche 1997 and San Fernando 1971, the number of generated open cracks is larger under the additional action of the vertical seismic component. The same also issues for the case of closed cracks except for the two aforementioned seismic events and the North West China 1997 event. For the case of crushed cracks the following observations can be made: (i) for some seismic events and in particular for Coalinga-2 1983, Umbria Marche 1997, North West China 1997, and Gazli USSR 1976, the crushed cracks that are generated under the additional action of the vertical seismic component are distributed in more structural units than the ones generated under the action of horizontal components; (ii) for the seismic events of L’ Aquila 2009, Mammoth Lakes 1980, and San Fernando 1971, the number of crushed cracks under the sole action of horizontal components is larger than under the action of three components; (iii) for the seismic events of Whittier Narrows 1987, North West China 1997, and Loma Prieta 1989, the crushed cracks attributed to the additional action of the vertical component exceed the number of the ones attributed solely to the horizontal ground motion components.
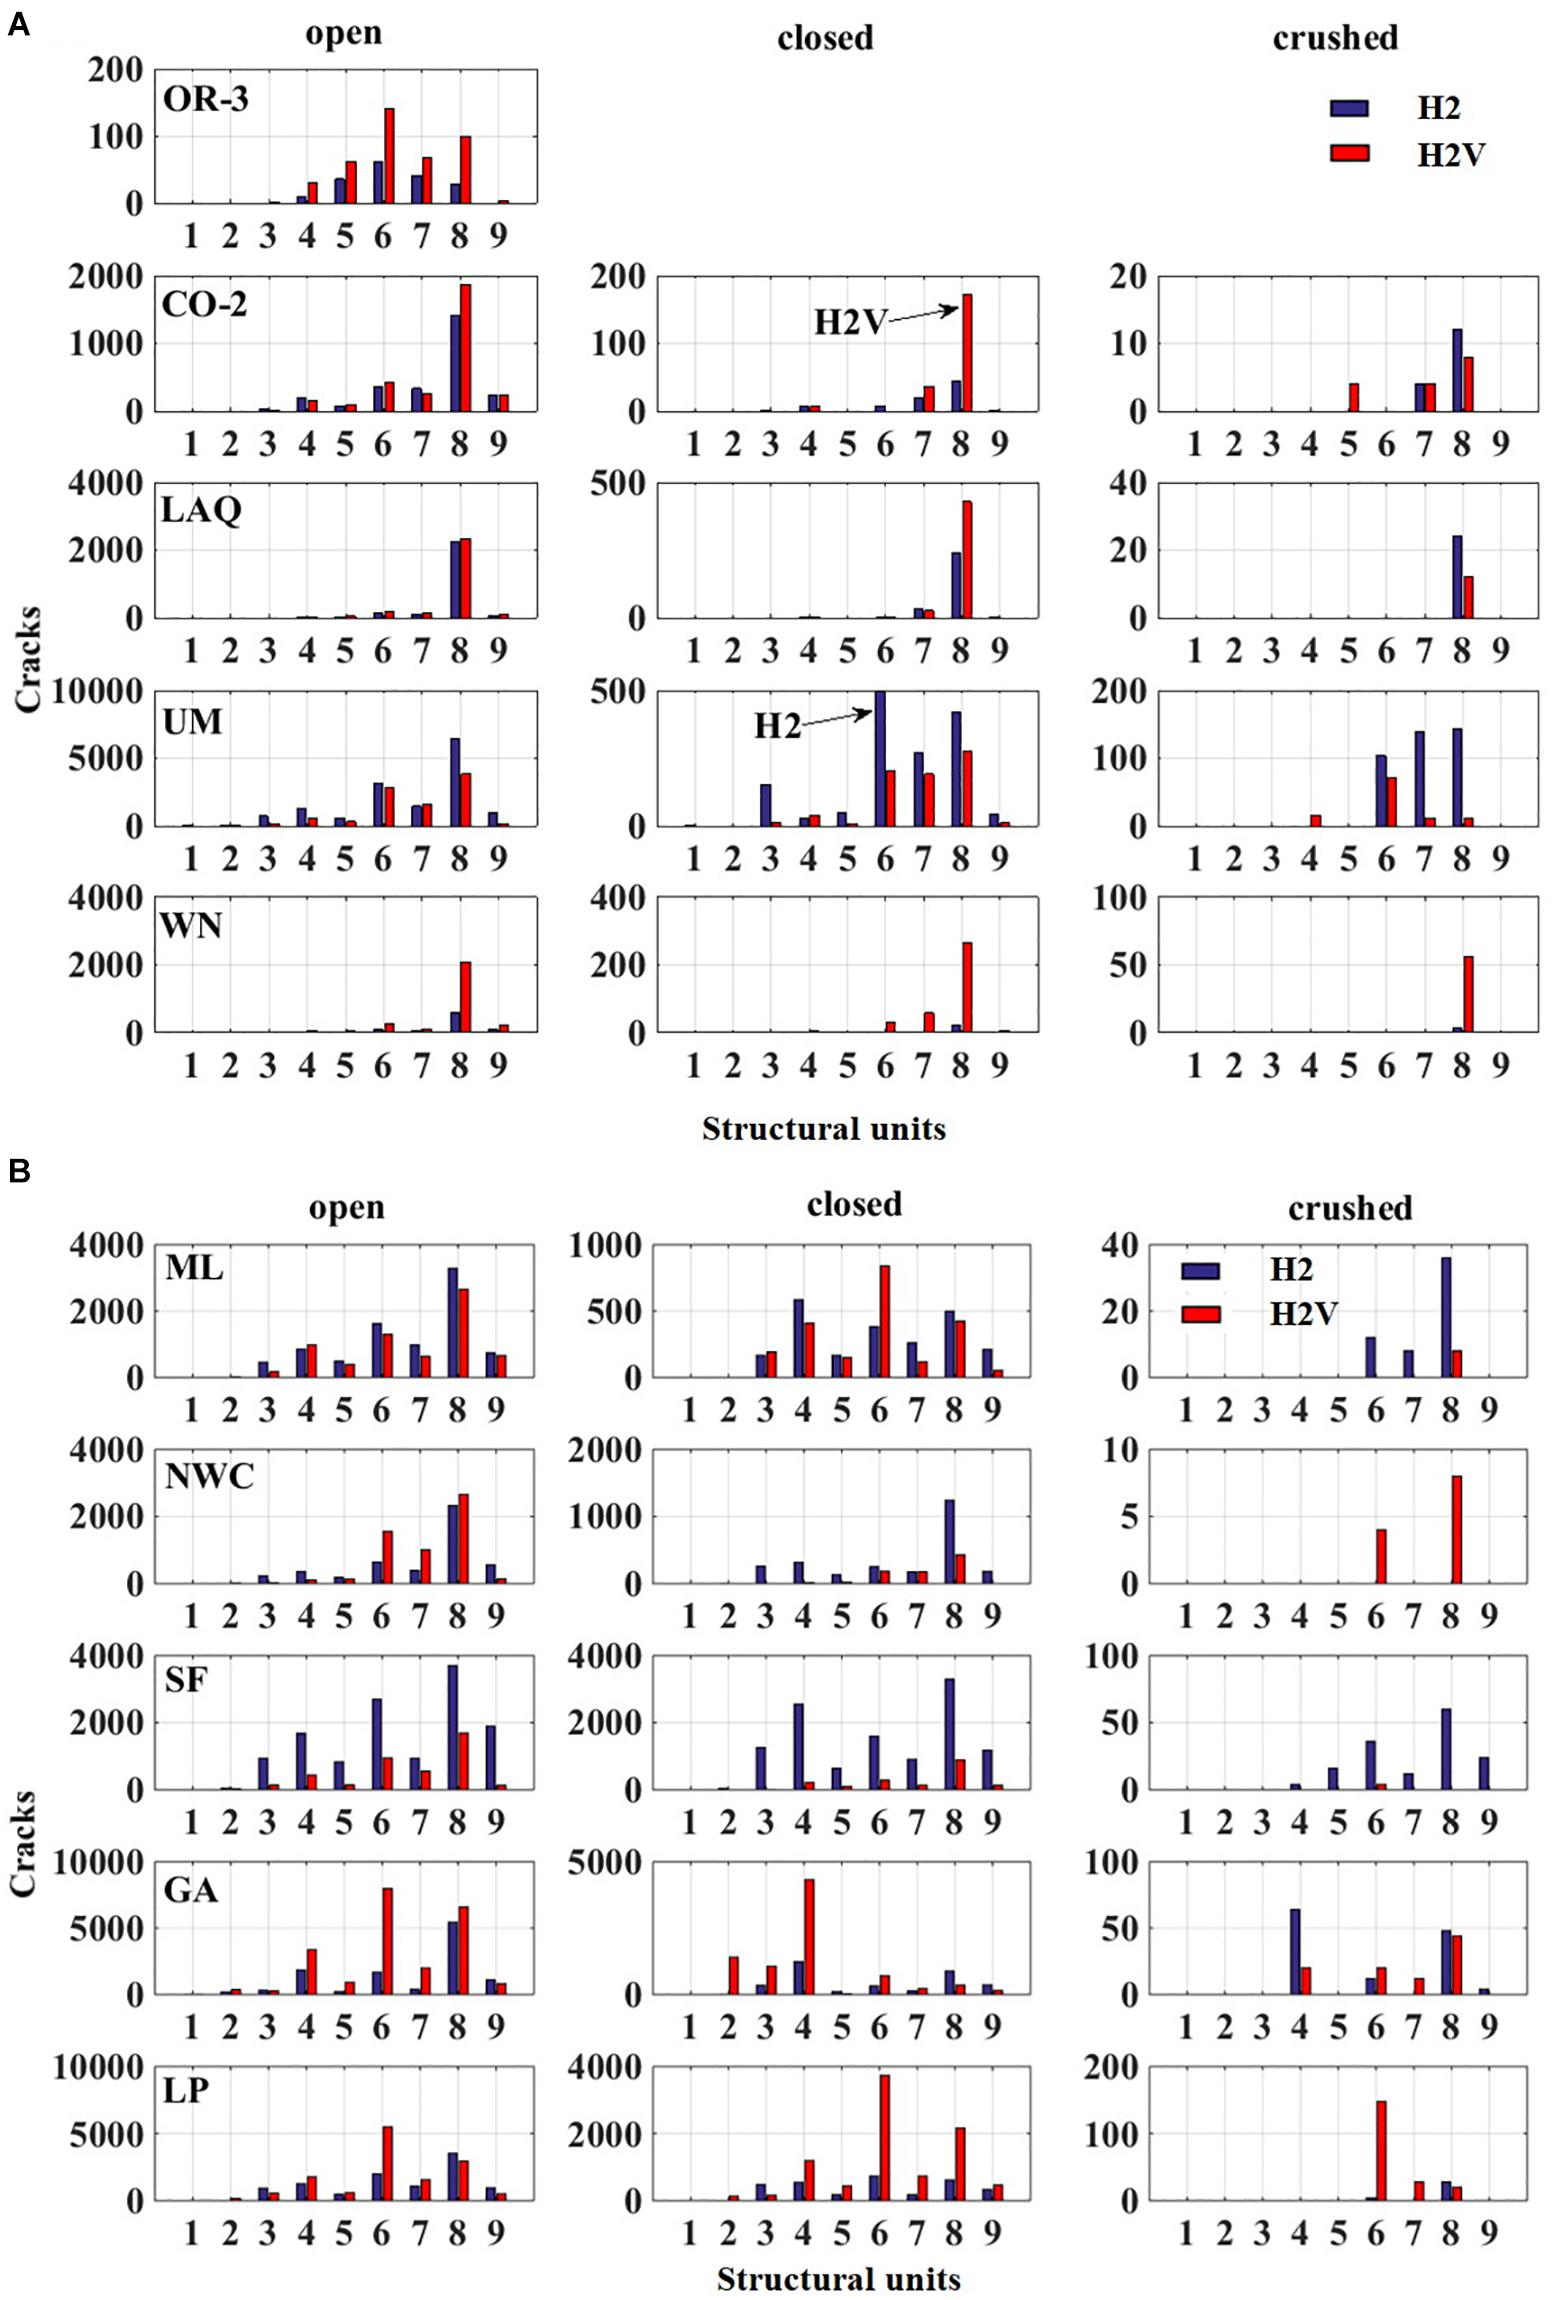
Figure 7. (A) Spatial distribution of different crack types, events 1–5. (B) Spatial distribution of different crack types, events 6–10.
Figure 8 depicts a 3D plot of the ratio of the sum of effective cracks under the action of the three seismic components to the action of the horizontal ones. The definition of the effective cracks corresponds to the total sum of open and crushed cracks at the end of each non-linear dynamic analysis. The X-axis corresponds to the magnitude of the seismic event; the Y-axis corresponds to the ratio of the maximum vertical acceleration to the horizontal one. The red dots correspond to a value of a ratio greater than one. Therefore, only for three earthquake events, the effective cracks generated under the two horizontal components’ action are more than under the action of the three seismic components. The aforementioned seismic events are Umbria Marche 1997, Mammoth Lakes 1980, and San Fernando 1971. Furthermore, there seems to be no correlation between the ratio of cracks and the seismic magnitude. In particular, even small magnitude events, such as Oroville-3 with M = 4.7 may correspond to a ratio larger than 1 (2.301). In addition to this, neither the ratio of maximum vertical to horizontal acceleration may be characterized as a criterion for the severity of the vertical component. In particular the Umbria Marche 1997 corresponds to a ratio of 1.046 maximum accelerations. However, the ratio of cracks receives the value of 0.642.
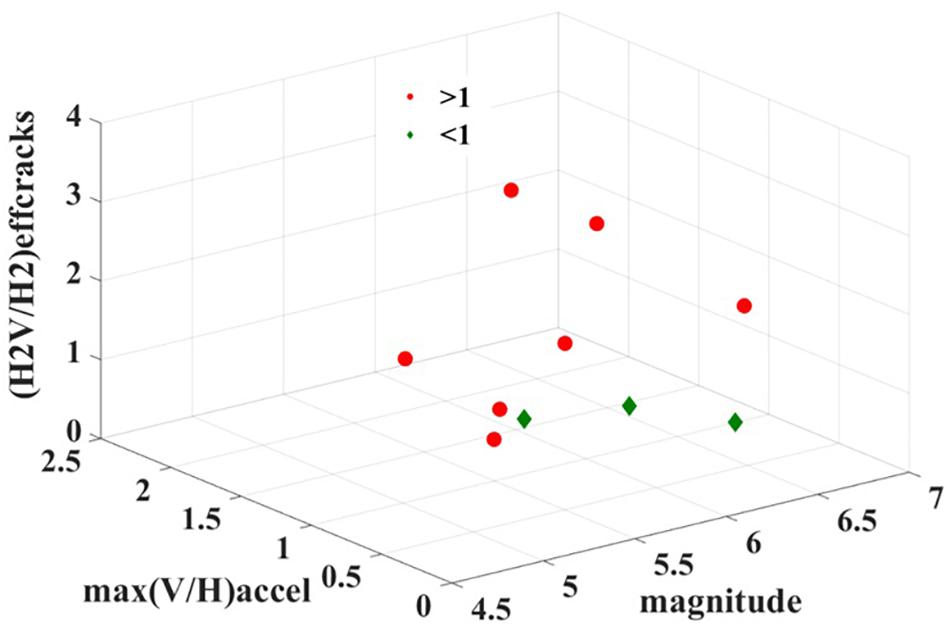
Figure 8. Ratio of cracks generated under the H2V analyses and H2 analyses.
The failure mechanism during the simultaneous action of the three ground motion components for the seismic event of Umbria Marche 1997 is characterized by the crushing of masonry material at the roof between the two stone arches Ar3 and Ar4 (Figure 9A). Furthermore, according to Table 1, the predominant frequency of the vertical seismic component equals 16.667 Hz which is close to the predominant frequency of the structure at the vertical direction (17.189 Hz, Figure 5). During the H2V analysis of the Mammoth Lakes 1980 event, a local crushing develops between Ar4 and the eastern wall and in particular on the connection line between the roof and the eastern wall (Figure 9B). Therefore, the failure mechanism is characterized as local. Furthermore, during the H2V analysis of the San Fernando 1971 event, a local crushing develops between Ar3 and Ar4, on the connection line between the roof and the eastern wall (Figure 9C). It is worth mentioning that the predominant frequency of the vertical seismic component equals 16.667 Hz, which is close to the predominant frequency of the structure at the vertical direction (17.189 Hz, Figure 5). The aforementioned two local mechanisms are probably attributed to the numerical model itself. In particular, in both cases, the failure is located in the proximity of wooden tendons WT1 and WT2 (Figure 1A).
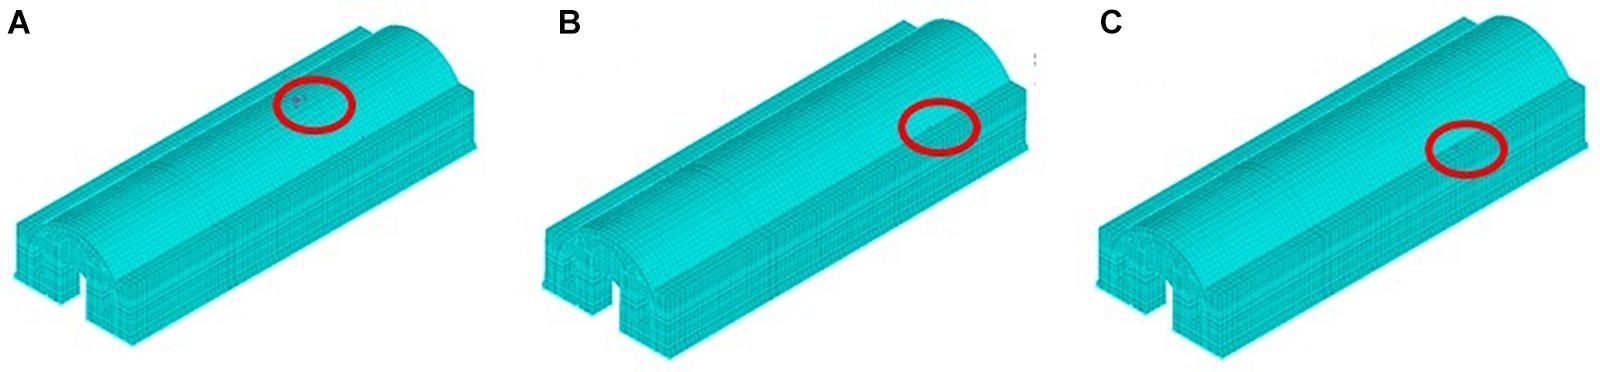
Figure 9. (A) Crushed cracks Umbria Marche 1997. (B) Crushed cracks Mammoth Lakes 1980. (C) Crushed cracks San Fernando 1971.
The third analysis outcome refers to the failure mechanism attributed only to the crushed points observed on the masonry body. Table 2 summarizes the locations of the crushed points. The key factors that define the severity of the action of the vertical seismic component are the following: (i) concentration of crushed points; (ii) areas of the concentration. In particular, the concentration of crushed points may be observed in the upper and lower part of the windows during H2 analyses. However, the concentration of crushed points during the H2V is more severe for the overall structural behavior. The most vulnerable areas are the following: connection line between the roof and the longitudinal walls; extrados and intrados of the roof, external leaf of the longitudinal walls; and key stone of the arches.
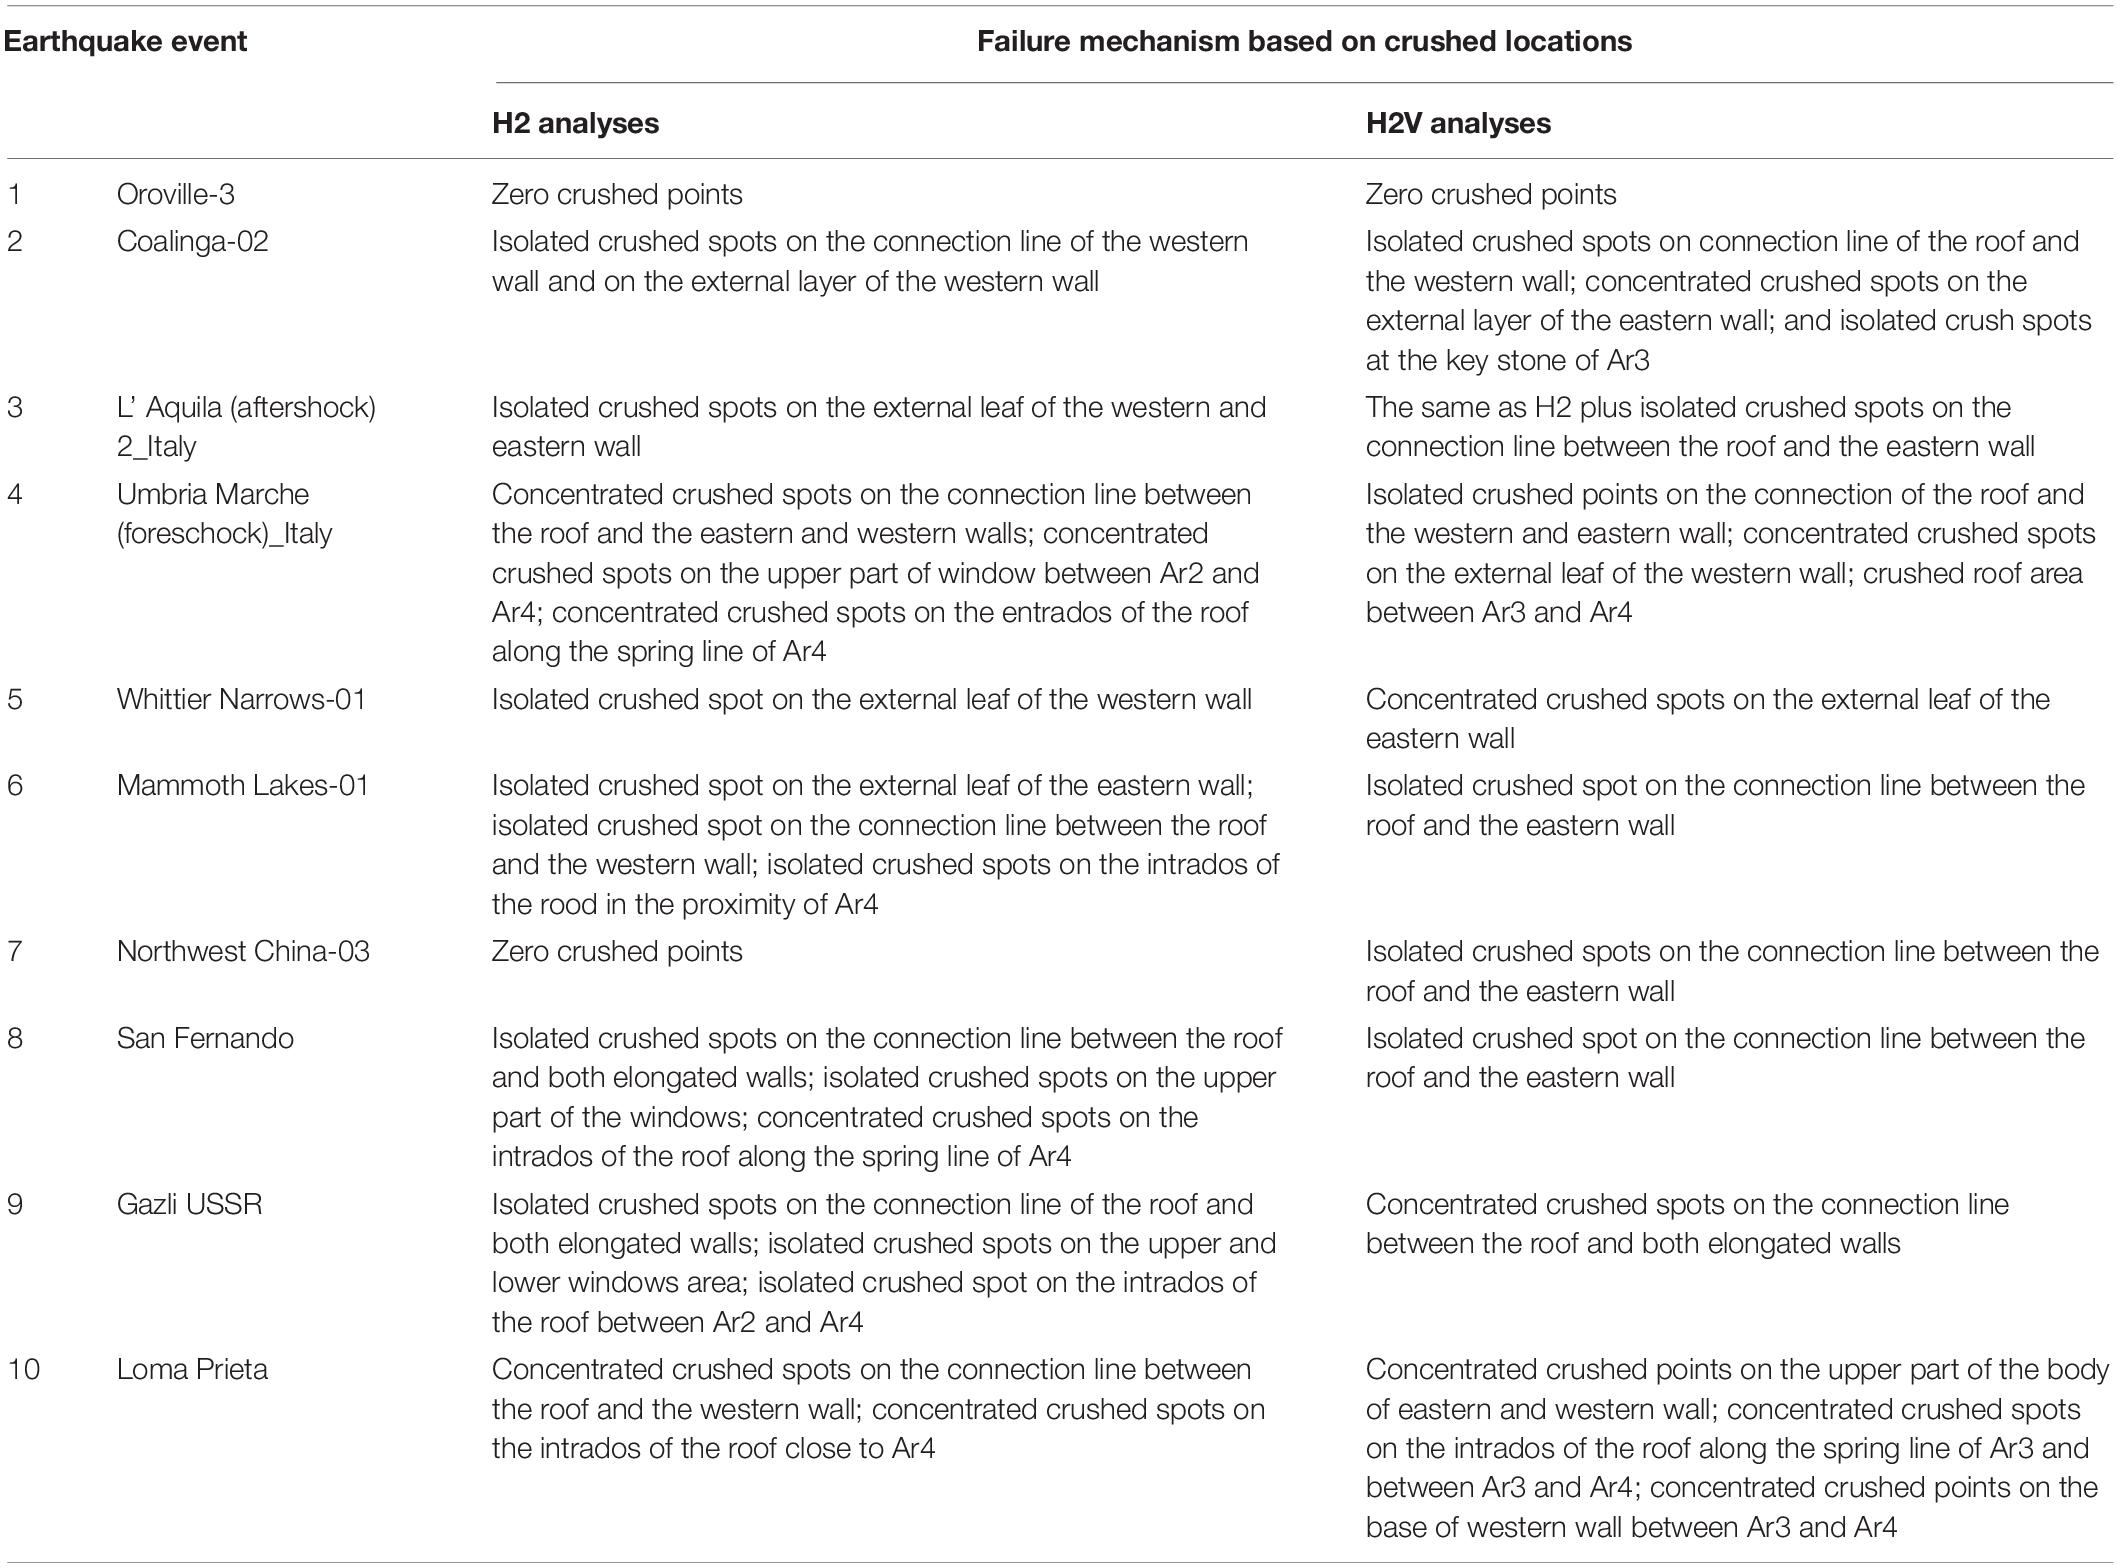
Table 2. Failure mechanism based on crushed locations.
The fourth analysis outcome refers to the energy flux inserted into the system by the three ground motion components. The energy flux represents the build-up of the Specific Energy Density (SED), which is defined by the following equation.
where,ttot is the total duration of motion andvi(t) is the velocity of each ground component (Seismosoft, 2013). Taking into account that some analyses are terminated during the phenomenon due to crushing of concrete material, the energy flux is defined up to the aforementioned time point. Figure 10A depicts the ratio of total energy flux between the action of the three components and the two horizontal components. The energy inserted into the structural system is always greater in the case of the additional action of the vertical seismic component than the action of the two horizontal ones. Figure 10B depicts the ratio between the energy flux consumption of the two types of analyses. In particular, the energy flux for the H2V analyses is always smaller than for the H2 analyses due to the fact that the masonry failure under the simultaneous action of the three ground motion components takes place earlier than the failure caused by the action of the two horizontal components. At the first seismic event, Oroville-3 1997 (1), the structure receives the total ground motion energy flux during both types of analyses. However, this is not the case for the rest of the earthquake events. For the seismic events of Coalinga-02 1983 (2), L’ Aquila 2009 (3), and Whittier Narrows-01 1997 (5), the energy flux is smaller than the total inserted into the system and the structure is able to receive a substantial amount of energy flux during both types of analyses. However, great differences between H2 and H2V analyses are noticed for the seismic events of Umbria Marche 1997 (4) and Northwest China-03 1997 (7). Furthermore, for the seismic events of Mammoth Lakes-01 1980 (6), San Fernando 1971 (8), Gazli USSR 1976 (9) and Loma Prieta 1989 (10), the percentage of energy flux is less than 3.6% for the horizontal components and less than 2.9% for the additional action of the vertical component. Therefore, the masonry failure due to the additional action of the vertical seismic is more abrupt and critical than the action of the two horizontal components.
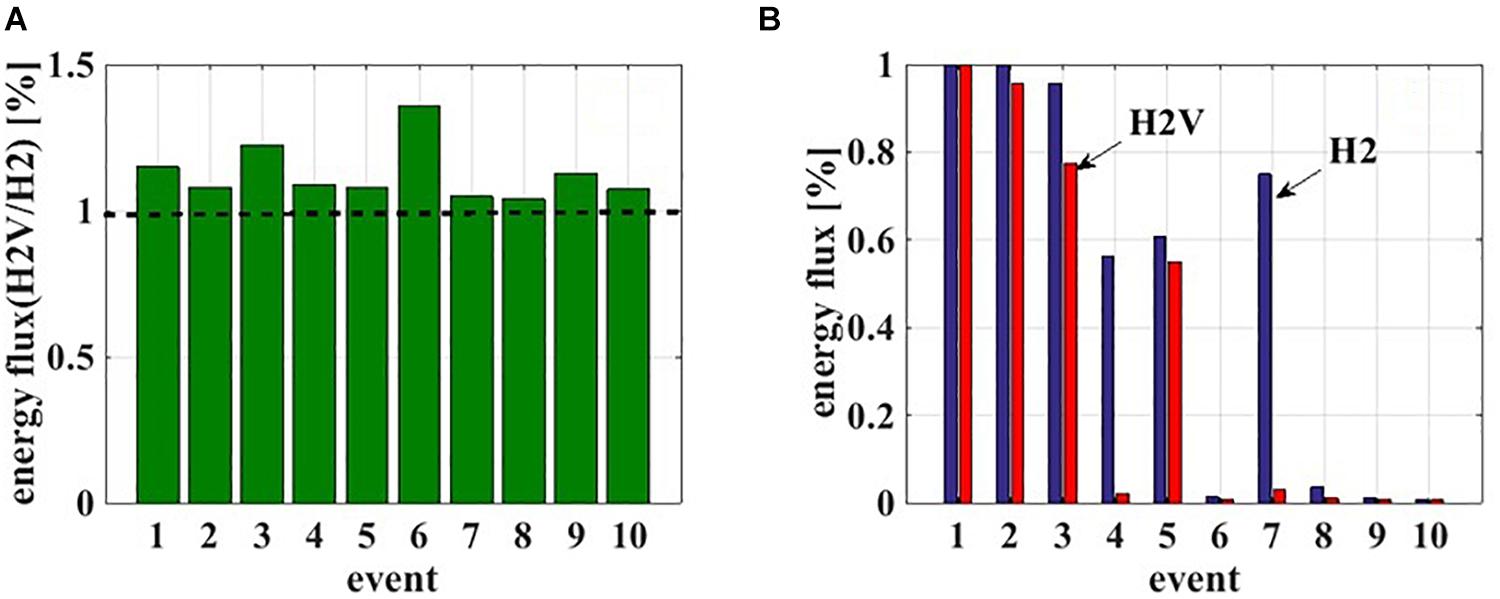
Figure 10. (A) Energy flux H2V/H2. (B) Energy flux at failure point.
The fifth analysis outcome refers to the difference between the maximum values of accelerations at the superstructure, and in particular at the roof, due to the contribution of the vertical ground motion component. Figure 11 depicts the ratio of the maximum acceleration derived from H2V analysis to the corresponding one derived from H2 analysis, along Y, X, and Z axes. The contribution of the vertical ground motion components enhances the horizontal accelerations in the strong axis for four seismic events; in the weak axis for three seismic events; while in the vertical axis for eight seismic events.
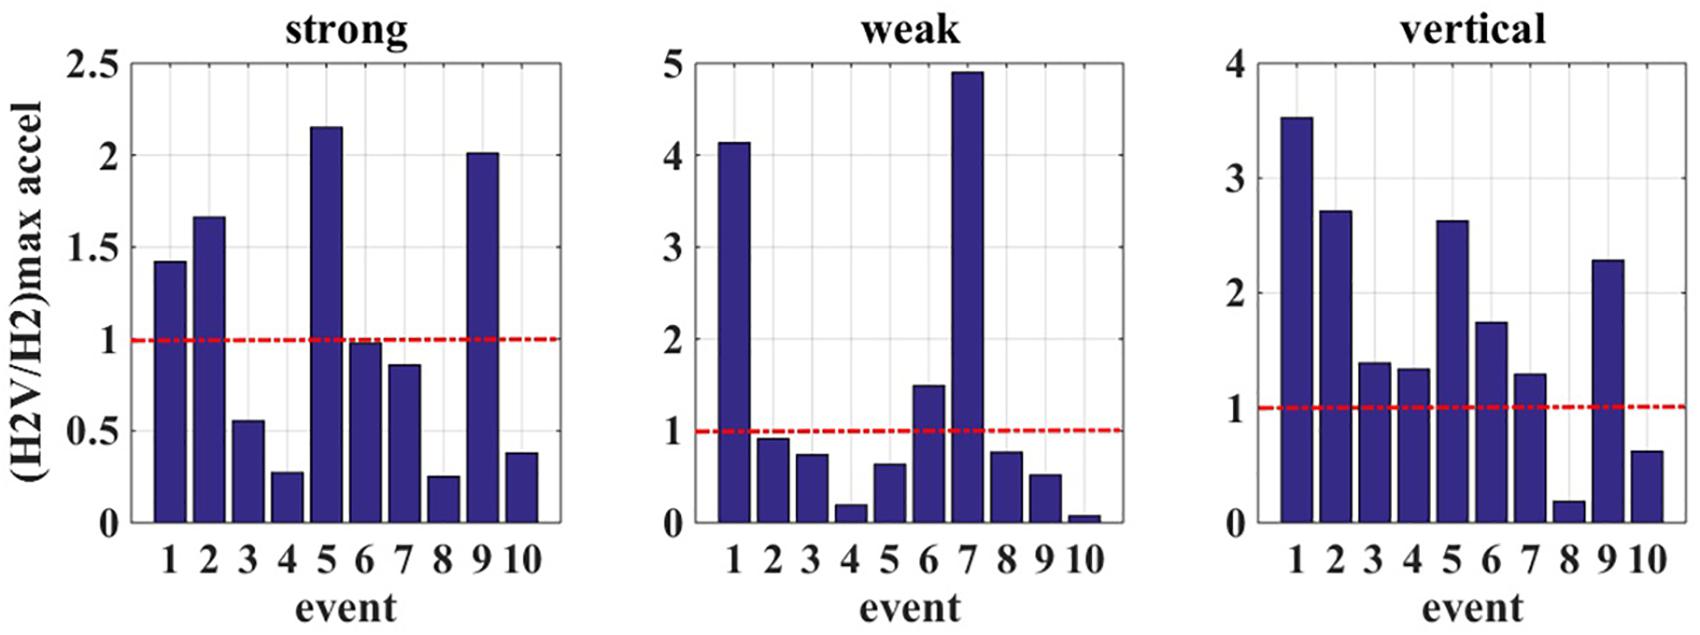
Figure 11. Ratio of maximum roof acceleration between H2V and H2 analysis.
The sixth analysis outcome refers to the eigenfrequencies after the dynamic non-linear analysis has been completed. Table 3 provides the first ten eigenfrequencies for the cases of: static non-linear analysis (before the earthquake); H2 non-linear analysis; and H2V non-linear analysis for each earthquake event.
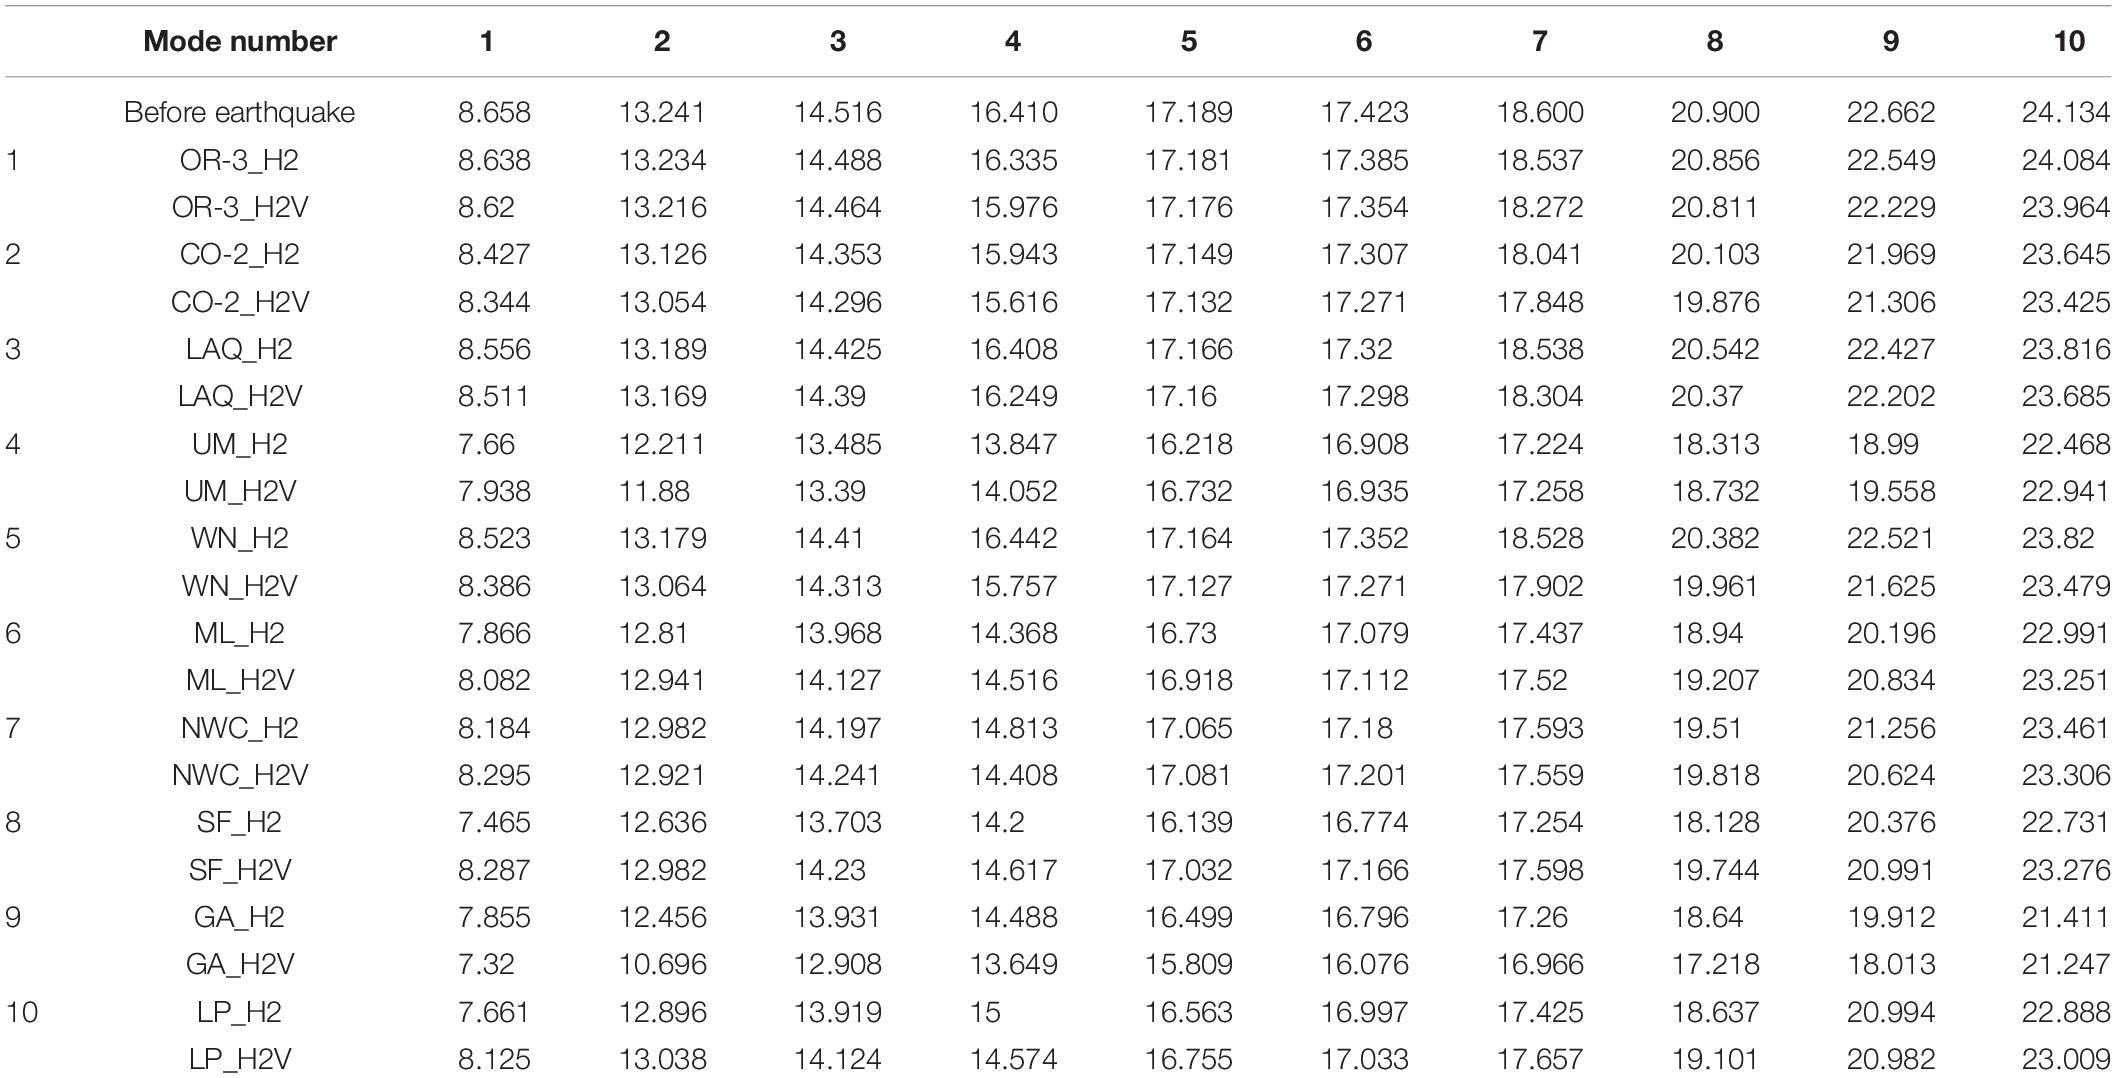
Table 3. Eigenfrequencies after earthquake [Hz].
Figure 12 depicts the variation of eigenfrequency according to the case of static non-linear analysis, which is defined as:Δf=(fae – fbe)/fbe, wherefae is the eigenfrequency after the earthquake event andfbe is the eigenfrequency before the event. For all the cases studied, except for the 4th eigenmode of H2 analysis, which corresponds to the earthquake event of Whittier Narrows-01 1997, the eigenfrequencies receive smaller values than the before earthquake condition. The aforementioned, is attributed to the fact that the non-linear behavior of the masonry material reduces the stiffness of the system, and therefore it behaves in a more flexible way than the system before the earthquake event. Furthermore, the variation of eigenfrequencies is not the same for all modes. In particular, the fifth and the sixth eigenmode are less affected by the non-linear behavior than the other modes of natural vibration. For the earthquake events of Oroville-3 1975, Coalinga-02 1983, L’ Aquila 2009, Whittier Narrows 1987, and Gazli USSR 1976, the action of the vertical ground component leads to a more flexible system, with eigenfrequency values smaller than the action of the two horizontal components for all the modes. On the contrary, for the earthquake events of Umbria March 1997, Mammoth Lakes 1980, Northwest China-03 1997, San Fernando 1971, and Loma Prieta 1989, the action of the vertical ground components leads to a stiffer system, with eigenfrequency values greater than the action of the two horizontal components for all the modes.
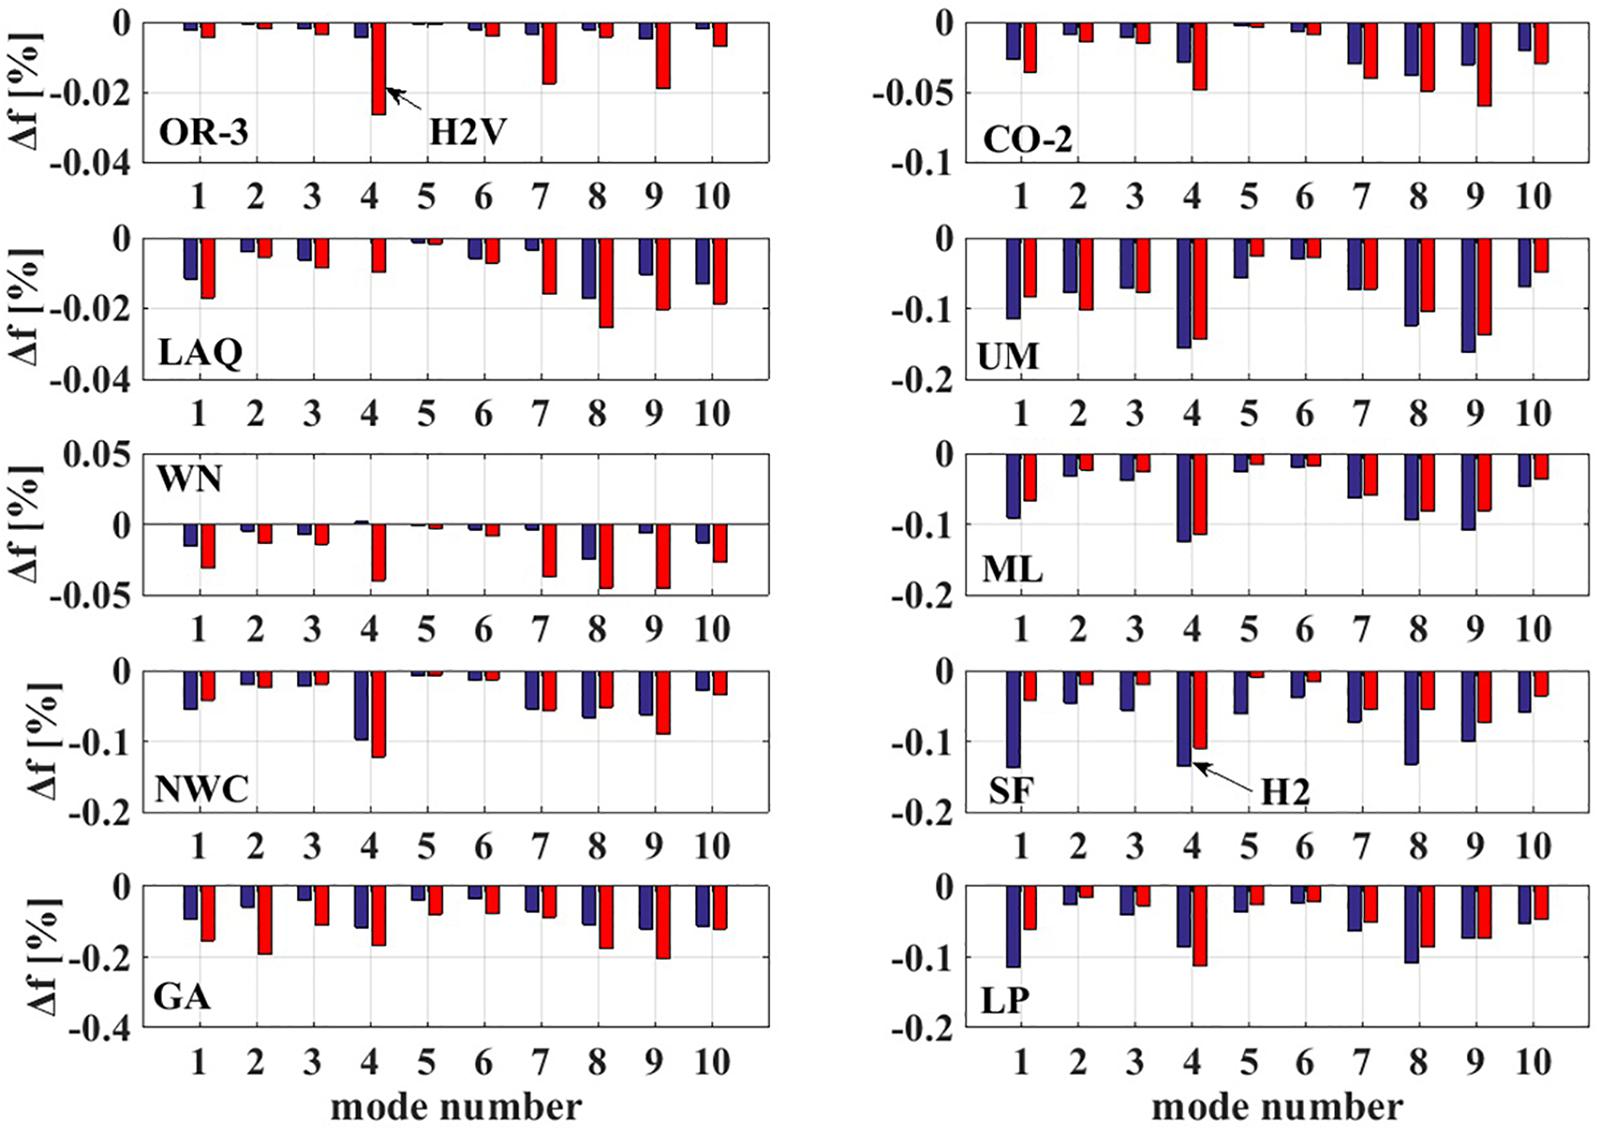
Figure 12. Variation of eigenfrequencies according to before earthquake condition.
Conclusions
The present study refers to the investigation of the vertical seismic component effects on the pathology of a historical structure. A 3D non-linear finite element model of the structure is developed. Ten near field earthquake records are implemented and two groups of non-linear dynamic analyses are performed for each ground motion. The first group of analysis refers to the action of the two horizontal seismic components while the second one refers to the action of the three seismic components. The main conclusions on the effects of the vertical seismic component on the behavior of the case study structure are the following:
• In the majority of the implemented earthquake events, the total number of effective cracks (open+crushed) receives greater values under the additional action of the vertical seismic component than the simultaneous action of the two horizontal components. Therefore, the contribution of the vertical seismic component on the total number of effective cracks is significant.
• The total energy flux inserted into the system is always greater under the action of three seismic components than the action of two horizontal orthogonal ones. However, the maximum energy flux inserted during the analyses receives smaller values under the additional action of the vertical seismic component than the action of the two horizontal components. The aforementioned is attributed to the fact that the failure of the structure under the action of the three seismic components takes place at an earlier time step than under the action of the two horizontal components. Therefore, the system consumes less energy for the case of the additional action of the vertical component.
• The difference of the maximum horizontal and vertical accelerations between the additional action of the vertical seismic component and the two horizontal components does not produce a clear picture of the severity of the vertical seismic component or not.
• The same also issues for the variation of the eigenfrequencies of the structure after the earthquake event has taken place and before.
• The failure mechanism is the most appropriate criterion for the effects of the vertical seismic component. Few concentrated crushed points in vulnerable areas, such as the roof or the key stone of an arch, are responsible for an abrupt failure under the action of the three seismic components.
• The interpretation of the results of the non-linear dynamic analysis must always take into account the basic assumptions made during the development of the finite element model. Local failure mechanisms relating to stress concentration must be investigated in accordance with the behavior of the structural elements involved in reality.
Data Availability Statement
The original contributions presented in the study are included in the article/supplementary material, further inquiries can be directed to the corresponding author.
Author Contributions
VT and AA contributed to conception of the work, acquisition, analysis, and interpretation of generated data. Both authors contributed to the article and approved the submitted version.
Conflict of Interest
The authors declare that the research was conducted in the absence of any commercial or financial relationships that could be construed as a potential conflict of interest.
References
Abrahamson, N. A., and Litehiser, J. J. (1989). Attenuation of vertical peak acceleration. Bull Seismol Soc Am 79, 549–580.
Acito, M., Bocciarelli, M., Chesi, C., and Milani, G. (2014). Collapse of the clock tower in Finale Emilia after the May 2012 Emilia Romagna earthquake sequence: numerical insight. Eng Struct 74, 70–91. doi: 10.1016/j.engstruct.2014.04.026
Angelides, M. (2011). The February 2010 earthquake in Chile, actual versus designed response of 2 concrete chimneys. CICIND REPORT 27, 65–70.
Bartoli, G., Betti, M., Marra, A. M., and Monchetti, S. (2020). On the role played by the openings on the first frequency of historic masonry towers. Bull Earthq Eng 18, 427–451. doi: 10.1007/s10518-019-00662-9
Bayraktar, A., Hökelekli, E., Halifeoǧlu, F. M., Mosallam, A., and Karadeniz, H. (2018). Vertical strong ground motion effects on seismic damage propagations of historical masonry rectangular minarets. Eng Fail Anal 91, 115–128. doi: 10.1016/j.engfailanal.2018.04.029
Betti, M., and Vingoli, A. (2011). Numerical assessment of the static and seismic behavior of the basilica of Santa Maria all Impruneta (Italy). Constr Build Mater 25, 4308–4324. doi: 10.1016/j.conbuildmat.2010.12.028
Breccolotti, M., and Materazzi, A. L. (2016). The role of the vertical acceleration component in the seismic response of masonry chimneys. Mat Struct 49, 29–44. doi: 10.1617/s11527-014-0472-7
Cardoso, R., Lopes, M., and Bento, R. (2005). Seismic evaluation of old masonry buildings. Part I: method description and application to a case-study. Eng Struct 27, 2024–2035. doi: 10.1016/j.engstruct.2005.06.012
Casolo, S. (1998). A three-dimensional model for vulnerability analysis of slender medieval masonry towers. J Earthq Eng 2, 487–512. doi: 10.1080/13632469809350332
Casolo, S. (2001). Significant ground motion parameters for evaluation of the seismic performance of slender masonry structures. J Earthq Eng 5, 187–204. doi: 10.1080/13632460109350391
Casolo, S., Vito, D., and Uva, G. (2017). Influence of soil deformability on the seismic response of a masonry tower. Bull Earth Eng 15, 1991–2014. doi: 10.1007/s10518-016-0061-y
Chioccarelli, E., and Iervolino, I. (2009). Direttività e azione sismica: discussione per l’evento de L’Aquila, Anidis 2009 Bologna (in Italian).
Di Michele, F., Cantagallo, C., and Spacone, E. (2019). Effects of the vertical seismic component on seismic performance of an unreinforced masonry structures. Bull Earthq Eng 18, 1635–1656. doi: 10.1007/s10518-019-00765-3
Di Sarno, L., Elnashai, A. S., and Manfredi, G. (2011). Assessment of RC columns subjected to horizontal and vertical ground motions recorded during the 2009 L’ Aquila (Italy) earthquake. Eng Struct 33, 1514–1535. doi: 10.1016/j.engstruct.2011.01.023
Dimosthenous, M., Mousteraki, K., Koutroulas, G., and Makra, K. (2006). “Effects of the 27th of June 2004 (M=5.4) earthquake event in Evros Prefecture,” in Proceedings of the 15th Concrete Conference, Technical Chamber of Greece, Scientific and Technical Chamber of Cyprus, (Alexandroupoli, Greece).
Diotallevi, P. P., and Landi, L. (2000). “Effect of the axial force and of the vertical ground motion component on the seismic response of R/C frames,” in 12th World conference on earthquake engineering, (Auckland).
European Committee for Standardization En 1996-1 (2005). Eurocode 6: Design of Masonry Structures—Part 1-1: General Rules for Reinforced and Unreinforced Masonry Structures. Brussels, Belgium: European Committee for Standardization.
European Committee for Standardization En 1998-1 (2004). Eurocode 8: Design of Structures for Earthquake Resistance—Part 1: General Rules, Seismic Actions and Rules for Buildings. Brussels, Belgium: European Committee for Standardization.
Gazetas, G. (1991). Formulas and charts for impedances of surface and embedded foundations. J Geotech Eng 117, 1363–1381. doi: 10.1061/(ASCE)0733-94101991117:91363
Genna, F., Di Pasqua, M., and Veroli, M. (1998). Numerical analysis of old masonry buildings: a comparison among constitutive models. Eng Struct 20, 37–53. doi: 10.1016/S0141-0296(97)00042-4
Giordano, E., Clementi, F., Nespeca, A., and Lenci, S. (2019). Damage assessment by numerical modeling of Sant’ Agostino’s sanctuary in offida during the central Italy 2016-2017 seismic sequence. Front. Built Environ. 4, doi: 10.3389/fbuil.2018.00087
Kalafatzis, I. (2008). The thermal baths complex and Xana in Traianoupolis, Evros. Diploma Thesis. Architectural Department, Polytechnic School, Aristotle University of Thessaloniki.
Karmis, P., Vargemezis, G., Papadopoulos, I., and Tsourlos, P. (2004). The application of the transient EM method into the geothermal field exploration. Bull Geol Soc Greece 36, 1224–1233. doi: 10.12681/bgsg.16465
Kiel, M. (1990). Studies in the Ottoman architecture of the Balkans. Varorium: Gower Publishing Company.
Kita, A., Cavalagli, N., Masciotta, M. G., Lourenço, P. B., and Ubertini, F. (2020). Rapid post-earthquake damage localization and quantification in masonry structures through multi dimensional non-linear seismic IDA. Eng Struct 219. doi: 10.1016/j.engstruct.2020.110841
Liberatore, D., Doglioni, C., AlShawa, O., Atzori, S., and Sorrentino, L. (2019). Effects of coseismic ground vertical motion on masonry constructions damage during the 2016 Amatrice-Norcia (Central Italy) earthquakes. Soil Dyn Earth Eng 120, 423–435. doi: 10.1016/j.soildyn.2019.02.015
Mallardo, V., Malvezzi, R., Milani, E., and Milani, G. (2008). Seismic vulnerability of historical masonry buildings: a case study in Ferrara. Eng Struct 30, 2223–2241. doi: 10.1016/j.engstruct.2007.11.006
Minopoulos, M. D. (2001). Loutros. In the steps of time and space. Traianoupolis: Cultural and Educational Association of Loutra.
Moosavi, M., Ziyaeifar, M., Nekooei, M., and Mokari, J. (2016). Effects of vertical motions on seismic response of Goltzschtal masonry arch bridge. J Seism Earth Eng 18, 33–46.
Mosoarca, M., Onescu, I., Onescu, E., and Anastasiadis, A. (2020). Seismic vulnerability assessment methodology for historic masonry buildings in the near-field areas. Eng Fail Anal 115, 104662. doi: 10.1016/j.engfailanal.2020.104662
Ombres, L., and Verre, S. (2019). Numerical modeling approaches of FRCMs/SRG Confined masonry columns. Front Built Environ 5:143. doi: 10.3389/fbuil.2019.00143
Papazoglou, A. J., and Elnashai, A. S. (1996). Analytical and field evidence of the damaging effect of vertical earthquake ground motion. Earth Eng Struct Dyn 25, 1109–1137. doi: 10.1002/(SICI)1096-9845(199610)25:10<1109::AID-EQE604<3.0.CO;2-0
PEER Ground Motion Database (2015). Pacifc Earthquake Engineering Research Center. California, USA: University of California. http://peer.berkeley.edu/smcat/
Ramirez, J. C., Lozano, J., Ferrer, H. O., Rojas, J., Vazques, R., and Mijares, H. (2012). “Dynamic behavior of puebla city cathedral,” in 15th World Conference of Earthquake Engineering, (Lisboa, Portugal).
Rinaldin, G., Fasan, M., Noe, S., and Amadio, C. (2019). The influence of earthquake vertical component on the seismic response of masonry structures. Eng Struct 185, 184–193. doi: 10.1016/j.engstruct.2019.01.138
Salonikios, T., Theodoulidis, N., and Zacharopoulou, G. (2020). Seismic response evaluation of monuments based on ambient vibrations: the case studies of a Byzantine basilica and an Ottoman bath in Thessaloniki (Greece). J. Seismol. 24, 777–802. doi: 10.1007/s10950-020-09906-7
Sanchez-Aparicio, L. J., Riveiro, B., Gonzalez-Aguilera, D., and Ramos, L. F. (2014). The combination of geomatic approaches and operational modal analysis to improve calibration of finite element models: a case study in Saint Torcato Church (Guimaraes. Portugal). Constr Build Mater 70, 118–129. doi: 10.1016/j.conbuildmat.2014.07.106
Seismosoft. (2013). Seismosignal v5.1.0. https://seismosoft.com/product/seismosignal/.
Silva, W. J. (1997). “Characteristics of vertical ground motions for application to engineering design,” in Proc., FHWA/NCEER Workshop on the National Representation of Seismic Ground Motion for New and Existing Highway Facilities, Tech. Rep. No. NCEER 97 0010, (N.Y.: National Center for earthquake engineering research, state Univ. of New York at Buffalo), 205–252.
Taliercio, A., and Binda, L. (2007). The Basilica of San Vitale in Ravenna: investigation on the current structural faults and their mid-term evolution. J Cult Herit 8, 99–118. doi: 10.1016/j.culher.2006.09.005
Terzi, G. V., and Ignatakis, E. C. (2018). Nonlinear finite element analyses for the restoration study of Xana. Greece. Engineering Structures 167, 96–107. doi: 10.1016/j.engstruct.2018.04.034
Terzi, V. (2010). Restoration study of Xana, Traianoupolis municipality, Evros prefecture. Estimation of bearing capacity. Evaluation of restoration measures. MSc Thesis. Civil Engineering Department, Polytechnic School, Polytechnic School, Aristotle University of Thessaloniki.
Terzi, V. (2020). “Investigation of the pathology causes of Xana, Greece by the use of nonlinear finite element analyses,” in 4th International Conference on Protection of Historical Constructions, PROHITECH 2020, 5-7 July 2021, (Athens, Greece).
Tomazevic, M. (2009). Shear resistance of masonry walls and Eurocode 6: shear versus tensile strength of masonry. Mater Struct 42, 889–907. doi: 10.1617/s11527-008-9430-6
Valente, M., and Milani, G. (2018). Damage assessment and partial failure mechanism activation of historical masonry churches under seismic actions: Three case studies in Mantua. Eng. Fail. Anal. 92, 495–519. doi: 10.1016/j.engfailanal.2018.06.017
Keywords: historical masonry, nonlinear material behavior, seismic analysis for three-earthquake components, pathology estimation, soil-structure interaction
Citation: Terzi V and Athanatopoulou A (2021) Seismic Vertical Component Effects on the Pathology of a Historical Structure, Xana, Located in Greece. Front. Built Environ. 7:666840. doi: 10.3389/fbuil.2021.666840
Received: 11 February 2021; Accepted: 06 April 2021;
Published: 13 May 2021.
Edited by:
Michele D’Amato, University of Basilicata, ItalyCopyright © 2021 Terzi and Athanatopoulou. This is an open-access article distributed under the terms of the Creative Commons Attribution License (CC BY). The use, distribution or reproduction in other forums is permitted, provided the original author(s) and the copyright owner(s) are credited and that the original publication in this journal is cited, in accordance with accepted academic practice. No use, distribution or reproduction is permitted which does not comply with these terms.
*Correspondence: Asimina Athanatopoulou, bWluYWtAY2l2aWwuYXV0aC5ncg==