 Yoshitaka Ichihara
 Naohiro Nakamura
 Hiroshi Moritani
 Byunghyun Choi
 Akemi Nishida
- 1Regulatory Standard and Research Department, Secretariat of Nuclear Regulation Authority, Tokyo, Japan
- 2Graduate School of Advanced Science and Engineering, Hiroshima University, Hiroshima, Japan
- 3Nuclear Safety Research Center, Japan Atomic Energy Agency, Ibaraki, Japan
In the 2007 Niigataken Chuetsu-oki earthquake, soil settlement, considered to be a result of the relative displacement between the soil and the structure, occurred alongside buildings at Kashiwazaki–Kariwa nuclear power plant. The objective of this study is to evaluate accurately the influence of the nonlinear behavior of the soil-structure interface on the response of the reactor building using a three-dimensional finite element model. To achieve this, we modeled the separation and sliding from sidewalls during a severe earthquake using joint elements, and evaluated the effect on the horizontal response of the structure. Through the soil-structure interaction analyses based on the recorded seismic data on the foundation for unit 7 reactor building using the three-dimensional finite element model, it was confirmed that the simulated horizontal responses of the building corresponded to the recorded seismic data. In addition, the comparison of the cases with and without separation and sliding revealed that the separation and sliding of soil from sidewalls reduces the embedment effects of the structure and that the reduction causes an occurrence of the foundation uplift. Moreover, in this study, it was clarified that the increase of the foundation uplift affected both the soil pressure characteristics beneath the foundation and along the sidewalls, and the maximum acceleration response of structures. In this study, the separation and sliding of soil from sidewalls had only a limited influence on the structural responses; however, under severe seismic excitation, it is expected that the embedment effects will be significantly reduced due to the separation and sliding of soil. Therefore, a precise response evaluation of the building including the nonlinear behavior due to separation and sliding should be considered in the seismic response analyses under severe seismic excitation.
Introduction
During the Niigataken Chuetsu-oki earthquake (MJMA = 6.8 according to the Japanese Meteorological Agency, MW = 6.6) that occurred at 10:13 local time on July 16th, 2007, seismic motion with a maximum acceleration close to 1 g was observed in the ground at ground level (G.L.) −255 m of the Kashiwazaki–Kariwa nuclear power plant (NPP) (Hijikata et al., 2010). As a result of this earthquake, the Kashiwazaki–Kariwa NPP shut down automatically the operating reactor. A number of strong acceleration records exceeding the design values obtained using the design ground motion were observed at the reactor buildings (RBs), which are the most important building for seismic safety of the NPP (International Atomic Energy Agency (IAEA), 2007a; International Atomic Energy Agency (IAEA), 2007b). Although it was confirmed by field investigations conducted after the earthquake that important buildings, such as the RBs, were undamaged or only slightly damaged, the surface soil settlement shown in Figure 1 occurred alongside the buildings (Tokyo Electric Power Company Holdings Inc., 2007; Yee and Tokimatsu, 2011; IAEA, 2013). The soil settlement occurring alongside to the buildings is a nonlinear behavior at the soil-structure interface, which is accompanied by the separation of the soil moving away from the sidewalls and sliding of the soil that sinks from the sidewalls due to the relative displacement of the soil and structure. Therefore, it is considered that the separation and sliding of soil from the sidewalls have a significant influence on buildings with embedment. In ASCE/SEI4-16 (ASCE, 2017), it is also indicated that the response may increase at some frequencies because of additional rocking motions. For this reason, a detailed evaluation of the influence of soil-structure interaction (SSI) considering soil separation and sliding on structural responses is required for embedded buildings.
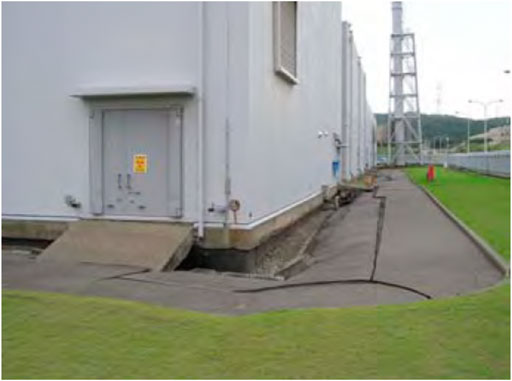
FIGURE 1. Example of cracks occurring alongside NPP building due to soil settlement below the building (Tokyo Electric Power Company Holdings, Inc., 2007).
It has been previously confirmed that the maximum shear strain did not exceed 0.25 × 10⁻³, which is a guideline value for shear cracking of reinforced concrete (RC) shear walls for cases such as the Kashiwazaki–Kariwa NPP Unit 7 RB during the 2007 Niigataken Chuetsu-oki earthquake. These assessments were based on simplified SSI analyses using the typical design sway-rocking model including the embedment effect (Watanabe et al., 2008). A more accurate three-dimensional (3D) soil separation, sliding, and embedment effect model considering soil nonlinearity and a lumped-mass stick model (LMSM) for Unit 7 RB was used in a SSI analysis by Hijikata et al. (2011). Also, Hijikata et al. (2011) showed that the SSI results considering the nonlinearity behavior due to the separation and sliding of soil from sidewalls using joint elements could sufficiently explain the recorded seismic data. Kikuchi et al. (2012) focused on the vertical motion induced by the rocking motion due to the horizontal motion at the observation points, and clarified that the vertical motion of Unit 6 RB becomes larger than that of the other RBs from the results of simulation analysis from Units 5 to Unit 7 RBs. However, such studies typically included an additional simplification of representing the structure by a LMSM, which does not fully consider the effects of SSI for simultaneous three directional inputs in two horizontal and one vertical directions on the local responses of the maximum acceleration responses in the structure. Additionally, these studies did not evaluate the effect of nonlinearity of the soil-structure interface on the soil pressure characteristics beneath the foundation and along sidewalls caused by separation and sliding of soil from sidewalls.
Some studies have improved on this. IAEA's Kashiwazaki–Kariwa Research Initiative for Seismic Margin Assessment (KARISMA) benchmark exercise (IAEA, 2013) and studies based on the KARISMA benchmark exercise (Turpin et al., 2012; Moore et al., 2013; Alves Fernandes et al., 2017; Gatti et al. (2018a); Ichihara et al., 2021) attempted to evaluate more accurately the SSI response characteristics by using 3D finite element method (FEM) models of the RB. The 3D FEM models used in the KARISMA benchmark exercise are shown in Figure 2. Almost 20 teams from over 10 countries and areas joined the KARISMA benchmark exercise conducted between 2009 and 2012. A total of three phases were conducted as follows (Wang and Rambach, 2013):
• Phase I: Modeling, static and modal analyses, soil column analyses
• Phase II: Response analyses of the structure and equipment during the Niigataken Chuetsu-oki earthquake (including the “Reference analyses” and “Best estimate analysis”)
• Phase III: Assessment of the seismic margin by multiplying the seismic level
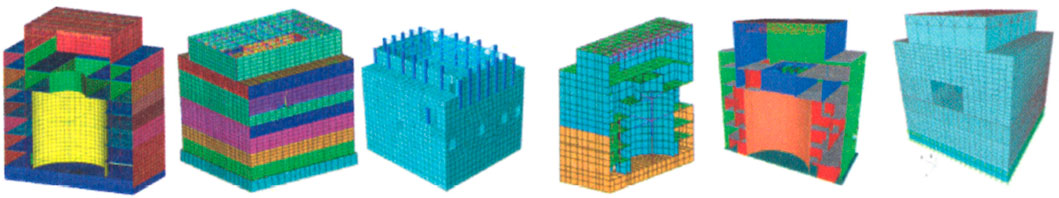
FIGURE 2. 3D FEM models used in KARISMA benchmark exercise (IAEA, 2013).
However, the results varied widely among the participating teams. It was also found that the benchmark exercise results shown in the “Best estimate analysis” of the Phase II for the maximum acceleration responses and acceleration response spectra at the locations with installed seismometers typically overestimated the recorded seismic data. Therefore, it was not clear how accurately the simulation models could reflect the actual response characteristics. Moreover, the KARISMA benchmark exercise report (IAEA, 2013) did not explain clearly whether the soil separation and sliding were appropriately considered in the 3D FEM models shown in Figure 2. If the soil and structure are fully and rigidly connected using node sharing, the design stresses acting on beneath the foundation and sidewalls may well be underestimated (Saxena and Paul, 2012).
Studies considering the effects of the separation and sliding of soil from sidewalls by a 3D FEM that models the soil and structure three-dimensionally are extremely important for appropriately evaluating the seismic safety of the embedded structure. From these seismic response analyses, it is necessary to further elucidate the actual nonlinear behavior including the separation and sliding from the information on the actual soil and the actual structure. Therefore, the objective of this study is to evaluate accurately the influence of the nonlinear behavior of the separation and sliding of soil from sidewalls using detailed SSI analyses based on the actual soil, actual structure, and recorded seismic data. From these analyses, the validity of the seismic response analysis models and method used in this study is clarified. Additionally, this study demonstrates how separation and sliding of soil from sidewalls can influence the maximum acceleration response of the structure and soil pressure characteristics beneath the foundation and along the sidewalls. This is achieved by utilizing the following two analytical models:
• Model A: 3D FEM model with an equivalent linear soil and a linear structural model, in which the soil and the structure are fully and rigidly connected.
• Model B: 3D FEM model with an equivalent linear soil and a linear structural model, with a nonlinear soil-structure interface.
In this paper, “Structural Modeling and Seismic Response Analysis Method Considering Soil–Structure Interaction” Section describes the structural modeling and seismic response analysis method considering SSI. The building is the advanced boiling water reactor type of Kashiwazaki–Kariwa NPP Unit 7 RB, and the soil is the actual soil based on the IAEA (2013). Two types of the soil-structure boundary are assumed: Model A, in which the soil and structure are fully and rigidly connected, and Model B, with a nonlinear soil-structure interface by joint elements. The seismic motion developed based on the waveform recorded at the building site during the main shock of the 2007 Niigataken Chuetsu-oki earthquake is inputted to these models. “Soil–Structure Interaction Analysis by 3D FEM Model and Local Response Characteristics of Structure and Soil Pressure” Section clarifies the analysis accuracy of the seismic response analysis method and models used in this study. Moreover, the effects of soil separation and sliding on the maximum response acceleration and the local response of soil pressure beneath the foundation and along the sidewalls are clarified.
Structural Modeling and Seismic Response Analysis Method Considering Soil–Structure Interaction
Structural Modeling
Figure 3A shows the key plan and key cross section of the analyzed building. The building is the advanced boiling water reactor type of Kashiwazaki–Kariwa NPP Unit 7 RB, which was the subject of the KARISMA benchmark exercise. The building was considered as a stand-alone structure, with no consideration for interaction with the adjacent buildings. The main structure of the RB is made of RC, which also includes some secondary steel framed RC structures and some secondary steel structures. The building has four floors above the G.L. and three basement levels. The roof is flat and consists of a steel structure supported by roof trusses. The overall building plan dimensions are 56.6 m (north-south (NS) direction) by 59.6 m (east–west (EW) direction), while the height from the bottom of the foundation to the top of the roof slab is 63.4 m. The height above G.L. is 37.7 m. The reinforced concrete containment vessel (RCCV) is located in the central part of the building, and is supported on a 5.5 m thick RC foundation. In the figure, 7-R1 and 7-R2 indicate the locations of seismometers in the building used for recording the earthquake signals. 7-R1 indicates the location of the seismograph installed on the 3rd floor (3F), and 7-R2 indicates the position of the seismograph installed on the 3rd basement floor (B3F). The T.M.S.L values shown in the figure are relative to the Tokyo Mean Sea Level.
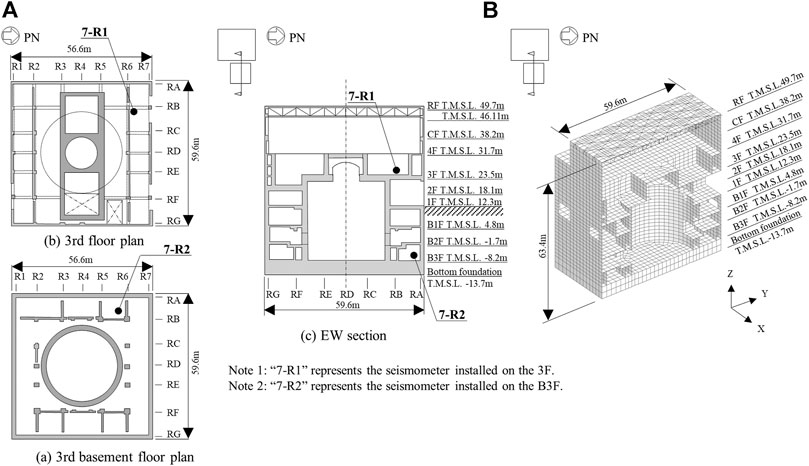
FIGURE 3. Depiction of structural model. (A) Key plans and key cross section of the building. (B) Detailed structural model.
Table 1(A) list the properties of structural materials, which were adopted from the IAEA report (2013). The properties of RC and steel are assumed to be linear for consistency with the previous studies (Watanabe et al., 2008; IAEA, 2012).
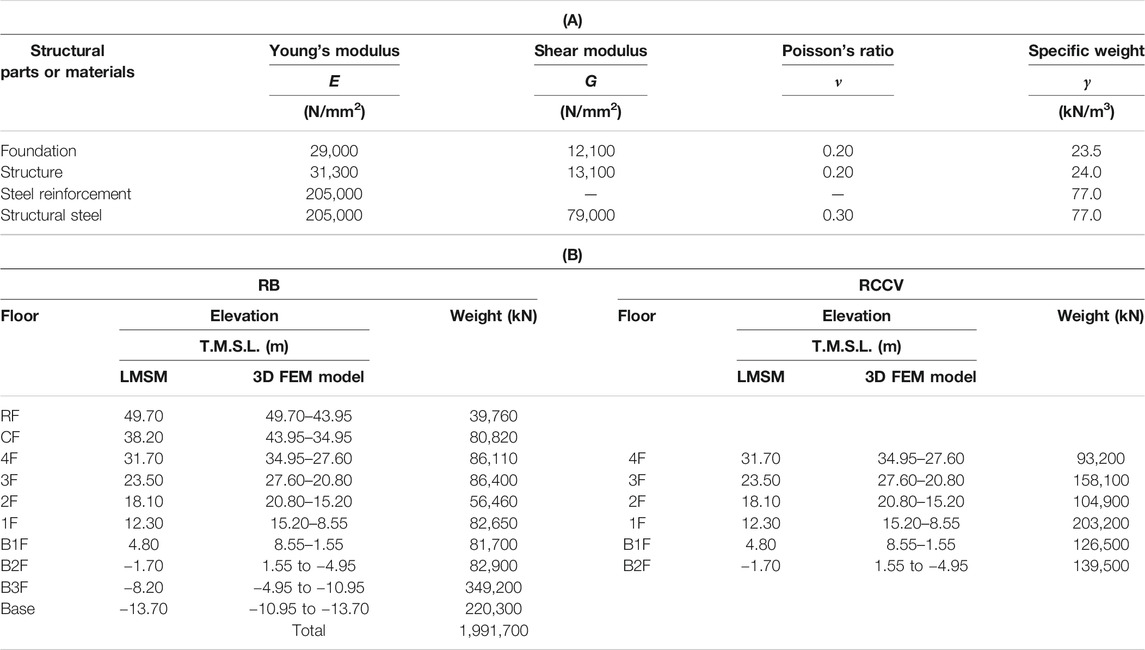
TABLE 1. Specifications of structural model. (A) Structural material properties. (B) Floor level and weight distribution of LMSM and 3D FEM model.
Table 1(B) shows the weight and floor level of the building. The weight of the building in the 3D FEM model was adjusted by changing the mass at each floor level to match the weight distribution of the LMSM used in the IAEA report (2013).
Figure 3B shows the model of the building. The foundation was modeled using solid elements, floor slabs and walls as shell elements, columns and beams as beam elements and diagonal members, and struts and horizontal braces (representing roof slabs) as rod elements that carry axial loads only. For the wall-to-foundation connection, the shell elements of the wall were embedded into the bottom foundation to ensure the continuity of rotational deformation between the shell elements and solid elements. The mesh size was set to 2.0 m as a guide so that the space between the grid lines on the plan and the space between the vertical floors would be divided into four or five sections. The wall and floor openings were only included in the structural model when their size was 2.0 m2 or more. The large pieces of equipment inside the RCCV were not explicitly modeled, but their weight was accounted for as a uniform load applied onto the particular floor slab where the equipment was located. FINAS/STAR software (ITOCHU Techno-Solutions Corporation, 2017) was used for building and analyzing the structural model.
As part of the model validation, the foundation of the model was fixed and an eigenvalue analysis based on the initial stiffness was carried out (Figure 4). Figure 4A also presents the average values of the fixed-base fundamental frequencies and modal participating mass ratios from the IAEA study (2013) as a reference. The fundamental frequencies and modal participating ratios obtained in our analysis show some differences compared to the average values of the IAEA study (2013), but the shapes of the fundamental modes are almost the same in both NS and EW directions. In UD direction, there is a more significant difference between fundamental frequencies. However, it is considered that this is because in the current structural model the response in the out-of-plane direction in which the floor slabs on the roof floor (RF) and crane floor (CF) are coupled is the first-order vertical mode, whereas the average of the IAEA study (2013) is the response of the roof slab on the RF alone as the fundamental vertical mode. As shown in Figure 2, the modeling of the RF varied among the participants of the IAEA study (2013). Therefore, only the fundamental frequency in UD direction is compared for the reference.
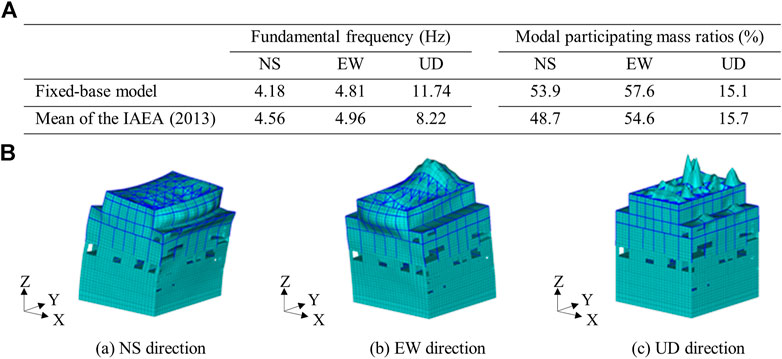
FIGURE 4. Result of eigenvalue analyses for fixed-base model. (A) Fundamental frequency and modal participating mass ratios. (B) Fundamental vibration mode shapes.
The damping of the building was modeled using the Rayleigh damping. The damping was employed in which 5% for concrete and 2% for steel were established for the average of the fundamental modes in the NS (4.18 Hz) and EW (4.81 Hz) direction, and the fundamental mode in the UD (11.74 Hz) directions.
Soil Modeling
The soil was assumed as equivalent to that adopted in the IAEA study (2013) and its properties are shown in Figure 5A. Figure 5B shows the soil model used for consideration of SSI. The soil was modeled as horizontal layers with plan dimensions of approximately five times the foundation width using solid elements. The mesh size was assumed up to T.M.S.L. −90.0 m (H = 102.3 m) as ranging from 1.0 to 7.125 m depending on the shear wave velocity, Vs, in the vertical direction so that the maximum frequency of the surface layer was approximately 15 Hz, referring to Bolisetti et al. (2018). Here the free-field ground surface of the actual soil is at T.M.S.L. −155 m, however, in order to reduce the computational load of the 3D FEM soil and structural model, it was modeled only up to T.M.S.L. −90.0 m, which is consistent with the previous study by Hijikata et al. (2011). In contrast, Gatti et al. (2018b) pointed out the influence of the possible uncertainty of the soil layering below T.M.S.L. −100 m based on the interferometric analysis of the main shock and aftershocks of the 2007 Niigataken Chuetsu-oki earthquake recorded in the borehole array at the service hall of Kashiwazaki–Kariwa NPP and the borehole array at the Unit 5 RB. Therefore, before adopting the T.M.S.L. −90.0 m soil model, we performed a parametric study using an SSI model which modeled the soil layer up to the free-field ground surface (T.M.S.L. −155 m) and confirmed that the influence of the soil layering on the acceleration time histories and acceleration response spectra at the observation points of the building was small in the seismic input using 2007 Niigataken Chuetsu-oki earthquake records to be described in “Seismic Input Using 2007 Niigataken Chuetsu-oki Earthquake Records” Section.
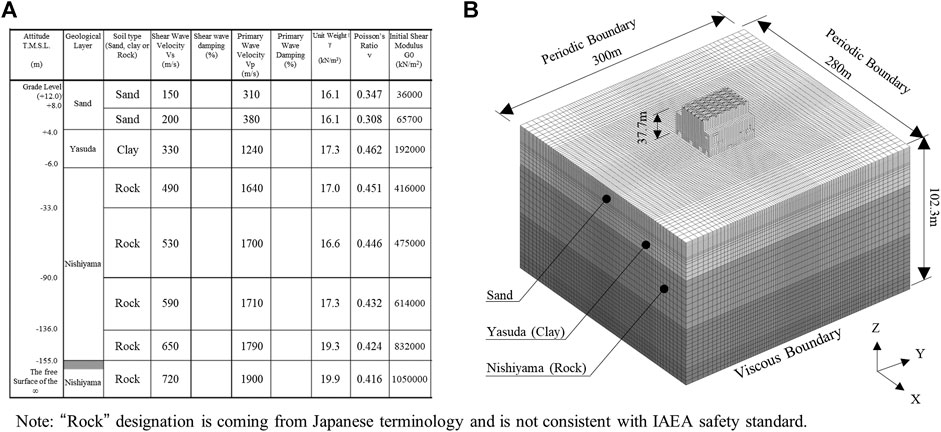
FIGURE 5. Depiction of soil model. (A) Soil properties (IAEA, 2013). (B) Soil model considering SSI.
The side boundaries of the soil model were assumed as periodic (cyclic) boundaries by assuming that the translational displacements of the nodes on the opposite sides were the same, and the bottom boundary was assumed to be viscous. Moreover, the viscous boundary of the bottom of the soil model is connected to the half-space at the lower end of the model through dashpots having a viscous coefficient determined from the soil properties (IAEA, 2013) shown in Figure 5A. An acceleration time history waveform obtained from the method described in “Seismic Input Using 2007 Niigataken Chuetsu-oki Earthquake Records” Section is input from the bottom of the soil model by outcrop motion. At this time, the equations of motion of the entire system are solved by combining the equations of motion expressing the vibration of the soil above the half-space and the basic equations of viscous boundary.
The SSI analyses in this study used the equivalent linear analysis results of the soil obtained in the IAEA study (2013). The equivalent linearization method used here was a one-dimensional wave propagation analyses available in SHAKE, which ignores the nonlinear characteristics of the soil depending on the time change. Although this is a simplistic assumption, it is one of the most commonly adopted analysis methods for seismic analysis of NPP facilities and it can significantly reduce the computational effort required to analyze 3D FEM soil and structural models. Therefore, this method was adopted in this study. It should be noted that it was confirmed by a nonlinear analysis considering the soil nonlinearity for the Niigataken Chuetsu-oki earthquake that the maximum shear strain in the support rock of the Nishiyama layer was approximately 0.1% and the maximum shear strain in a part of sand of the surface soil layer was approximately 1.0% (Hijikata et al., 2011). Therefore, in this paper, the soil is considered to be applicable the equivalent linear analysis, and is modeled using the equivalent stiffness and equivalent damping. Figure 6 shows the distribution diagram of the equivalent shear wave velocity and equivalent damping ratio. An eigenvalue analysis of the 3D FEM model, including SSI effects, was then carried out.
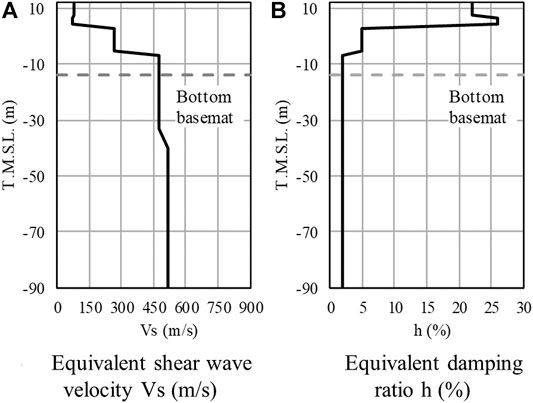
FIGURE 6. Distribution of equivalent shear wave velocity and damping ratio.
The soil damping was also modeled using the Rayleigh damping model, and was set so that the average of the fundamental frequencies in the NS (1.21 Hz) and EW (1.21 Hz) directions of the coupled soil-structure system, and the fundamental frequency in the UD (11.74 Hz) direction of fixed-base model had the equivalent damping ratio of each soil layer.
Soil–Structure Interface Modeling
In order to reduce the computationally load for the 3D FEM soil and structure model, the soil-structure interface of Model A was simply modeled by assuming the common nodes belonged to both the soil and the structure. However, in Model B, the nonlinearity of the interface had to be considered by the joint elements between the soil and the structural nodes. Figure 7A shows the depiction of the soil-structure interface modeling of joint elements. Model B connects the nodes between the soil and structure with joint elements in three directions, and this modeling evaluates the nonlinear SSI arising from the separation and sliding of soil from sidewalls. Figure 7B shows the response characteristics of nonlinear SSI of the separation and sliding of soil from sidewalls by using joint elements.
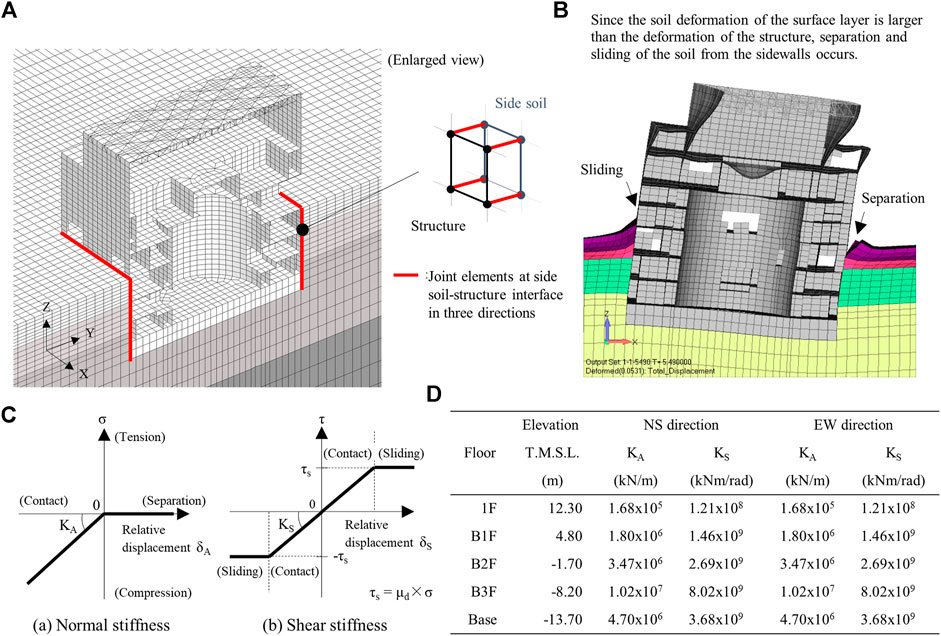
FIGURE 7. Depiction of SSI model. (A) Joint elements at soil-structure interface. (B) Response characteristics of nonlinear SSI of the separation and sliding of soil from sidewalls by joint elements. (C) Nonlinear properties of joint elements. (D) Spring constants of side soil from B3F to 1F level obtained from the method by Novak et al. (1978).
In order to simulate the separation and sliding behavior of the soil-structure interface in the 3D FEM model, the joint elements used in this study had a high compression stiffness in the normal direction but zero tension stiffness. Figure 7C shows the nonlinear properties of the joint elements.
It is desirable that the joint element in the normal direction is sufficiently rigid, but if it is unconditionally set to a significant value, spike-like noises may occur in the numerical analysis results. Therefore, in this study, sensitivity analyses were performed in advance with the stiffness in the normal direction as a parameter with reference to the modeling method of joint elements proposed by Nakamura et al. (2007). Hence, the initial stiffness was set to be 1,000 times the spring constant of the side soil obtained from the method by Novak et al. (1978), as a value with small numerical noise. Figure 7D shows the spring constants of the side soil from B3F level to 1st floor (1F) level obtained from the method by Novak et al. (1978). The initial stiffness of the joint element is determined by multiplying the spring constant shown in Figure 7D by 1,000 and then distributing the values according to the node-dominated area of the joint element. The initial stress of the joint element was set based on the initial stress due to the static soil pressure of the side soil calculated from the self-weight analysis. The dynamic friction coefficient, μd, in the shearing direction was set to 0.35 in consideration of the waterproof layer on the sidewalls with reference to Yabuuchi et al. (2019).
Seismic Input Using 2007 Niigataken Chuetsu-Oki Earthquake Records
The seismic input was concurrently applied in the two horizontal and the vertical direction at the bottom of the soil model from the waveforms recorded at the building site during the main shock of the 2007 Niigataken Chuetsu-oki earthquake. Since the actual seismic data was not recorded in the soil surrounding the building, following the study by Hijikata et al. (2011), the input waveforms in the three directions were calculated at the bottom of the soil model such that the seismic data recorded on the foundation of the B3F matched the response waveform of 3D FEM model. This was done by first assuming the input waveforms in the three directions at the bottom of the soil model shown in Figure 5B. These input waveforms at the bottom of the soil model were then changed iteratively using the transfer functions in three directions until their foundation acceleration time histories and acceleration response spectra matched the actual recorded seismic data and spectra.
Seismic Analysis Method
All 3D FEM simulations used the Newmark-β method (β = 1/4, γ = 1/2) to obtain the response time histories. A linear analysis was carried out for Model A and a nonlinear analysis for Model B, respectively. The tangential stiffness matrix was used in the nonlinear analysis and convergence was sought for up to three iterative steps. If the convergence was not obtained after three steps, the residual forces were carried over to the next analysis step. The time step of the analysis was 0.01 s for the linear analysis of Model A and 0.001 s for the nonlinear analysis of Model B, respectively. The duration of the analysis was 14 s, from 30 to 44 s of the seismic input wave, representing the main seismic motion.
Soil–Structure Interaction Analysis by 3D FEM Model and Local Response Characteristics of Structure and Soil Pressure
Comparison of Simulated and Recorded Seismic Data
In this section, the seismic analysis model shown in Figure 5B was used to carry out the SSI analysis of the recorded seismic data, and the analysis accuracy of the seismic response analysis method and models used in this study was examined. We compared the results of Model A, which does not consider soil separation and sliding, with those of Model B, which does, and clarify the effects of separation and sliding of soil from the sidewalls on the horizontal responses of the structure near the observation point on the 3F.
In this study, the output of the nodes near the seismometer positions shown in Figure 3A was used for comparison with the recorded seismic data. Figures 8, 9 show a comparison of acceleration time histories and acceleration response spectra. In the figures, the solid red lines show the recorded seismic data, the dash black lines show the results of Model A, and the dash-dotted blue lines show the results of Model B. In this study, since the input waveform at the bottom of the soil model was adjusted to match the recorded seismic data on the foundation at B3F, the recorded seismic data on the foundation and the response waveform of each model were almost the same.
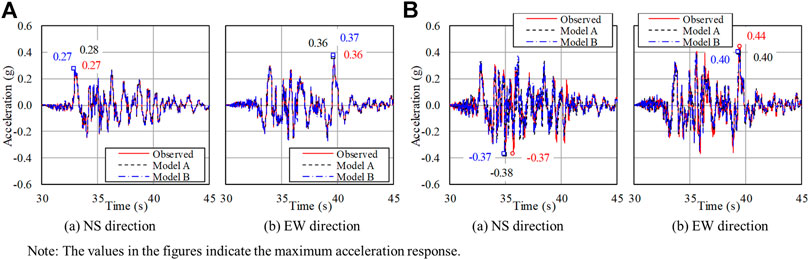
FIGURE 8. Comparison of acceleration time histories at (A) 7-R2 on B3F and (B) 7-R1 on 3F.
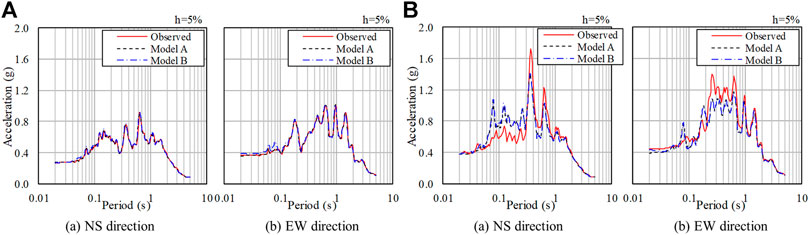
FIGURE 9. Comparison of acceleration response spectra at (A) 7-R2 on B3F and (B) 7-R1 on 3F.
First, the response characteristics of the acceleration time histories are discussed. Figures 8A,B are comparisons of the B3F and 3F of acceleration time histories, respectively. The numbers in the figures indicate the maximum acceleration of each of recorded seismic data, Model A and Model B. For both models, the simulated waveforms, maximum acceleration and the recorded seismic data of the 3F tend to agree well and it can be seen that the effects of the soil separation and sliding on the acceleration responses are small.
Next, the response characteristics of the acceleration response spectra are discussed. Figures 9A,B are comparisons of the B3F and 3F of acceleration response spectra. For both models, the simulated response of 3F around the dominant period (NS: around 0.4 s, EW: around 0.3 s) is slightly lower than that of the recorded seismic data, but it tends to agree well with the recorded seismic data, again indicating that the effects of soil separation and sliding are small. The response characteristics of the horizontal acceleration response spectra at the 3F observation points agreed very well with the results of the previous SSI analyses of Phase II “Best estimate analysis” in the KARISMA benchmark exercise for the Kashiwazaki–Kariwa NPP Unit 7 RB under the 2007 Niigataken Chuetsu-oki earthquake scenario (IAEA, 2013).
From the above results, the horizontal acceleration waveforms and acceleration response spectra tend to agree well with the 3F recorded seismic data in both Model A and Model B, and there were no significant differences due to consideration of separation and sliding. From this, it is considered that the inclusion of separation and sliding of soil from sidewalls had only a limited effect on the horizontal responses near the 3F observation points under the 2007 Niigataken Chuetsu-oki earthquake, which was the subject of this study.
Effect of Separation and Sliding of Soil From Sidewalls on Local Response Characteristics of Structure and Soil Pressure
Here, we clarified the effects of separation and sliding of soil from sidewalls during the 2007 Niigataken Chuetsu-oki earthquake on the maximum local accelerations and the soil pressure characteristics both beneath the foundation and along sidewalls.
Figures 10A,B show the maximum acceleration response contours in the NS and EW directions for Models A and B, respectively, that were concurrently input in three directions. The contours in the figure show the maximum acceleration of each node of the external walls on the north side and the west side, where the response was most significant. From Figure 10, the maximum acceleration tends to increase in the structure above the G.L. with the embedment part as the boundary, and even within the same wall, there is difference in the maximum value for each node. It can also be seen that the response in the out-of-plane direction increases near the center and openings of each floor.
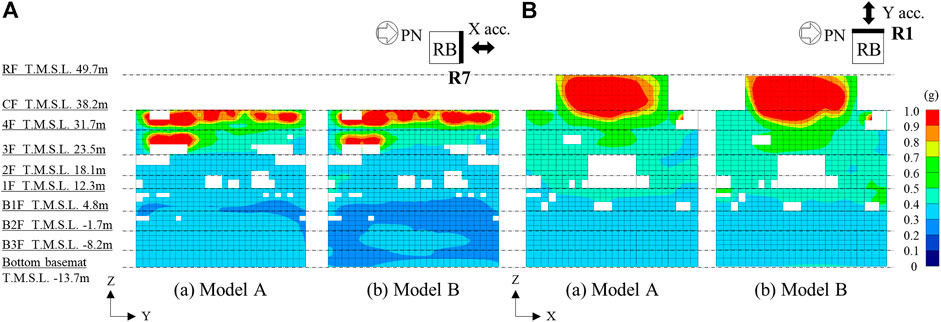
FIGURE 10. Maximum acceleration contours in (A) NS direction for line R7 external walls (north) and (B) EW direction for line RA external walls (west).
Comparing the results of Model A with those of Model B, it can be seen that the difference in the maximum acceleration response due to the soil separation and sliding is typically small. However, in the basement of the north external wall and near the 1F of the west external wall, a limited difference in the local maximum acceleration is observed because of soil separation and sliding. These differences indicate a decrease in response at the basement of the north external walls, but an increase in response locally at the edge of the external walls on the west side of 1F. This increase in response at the 1F is considered to be affected by the separation and sliding of the surface soil and may influence the local response of the structure. This will be further discussed using the maximum acceleration response contours on the 1F.
Figure 11 shows the maximum EW direction acceleration response contour on the 1F. It can be seen that the difference in the maximum acceleration is locally large around the external walls, especially at the edge (line R1 side and line R7 side) in the west direction. This difference can be seen not only the west side but also on the east side soil-structure interface. The reason why the degree of influence of separation and sliding on the maximum acceleration on the west side and the east side is considered to be the effects of the foundation uplift that occurs on the east side of the foundation edge, which will be discussed later. In other words, it is considered that the separation and sliding of soil from sidewalls in Model B reduces the embedment effect of the structure, and this causes the entire structure to rise in the UD direction and increase of the foundation uplift behavior on the east side of the foundation edge. For this reason, it is considered that a contact force due to the soil separation and reattachment acts between the west side of the 1F and surrounding soil of Model B, and this results in a local increase of the maximum acceleration.
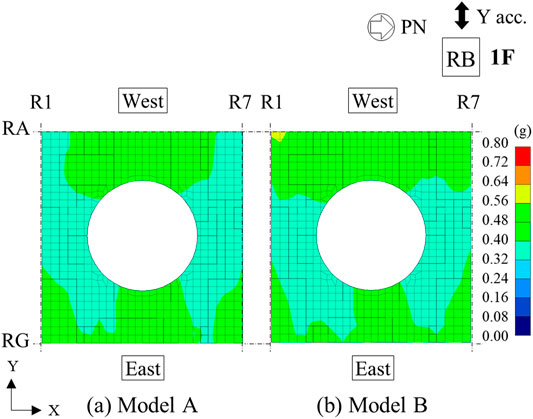
FIGURE 11. Maximum acceleration contours in EW direction for 1F.
Figures 12, 13 show the soil pressure characteristics when the maximum tension occurs on the side of the structure and the ratio (sliding resistance ratio) of the soil pressure to frictional resistance pressure in the shear direction (vertical direction), respectively. The dash line in the figure represents the results of Model A and the solid line represents those of Model B. The average of the lateral soil pressure of each finite element in the horizontal direction is connected by a straight line in the height direction. The lateral soil pressure in Figure 12 was calculated by adding the tensile dynamic soil pressure (positive) to the static compressive soil pressure (negative) acting on the surface of the sidewalls. Therefore, the side soil pressures in this figure are positive in Model A where the soil-structure boundary is fully connected, tension may occur, and phenomena such as separation and sliding of soil from sidewalls may occur. On the other hand, Model B, in which the joint elements are used to model the soil-structure interface, shows zero values indicating soil separation and sliding during tension. The sliding resistance ratio shown in Figure 13 is the sliding resistance ratio of the lateral soil pressure in the shear direction (vertical direction) to the frictional resistance pressure (which is obtained by multiplying the lateral soil pressure acting normal to the sidewalls with the dynamic friction coefficient μd). Therefore, the sliding resistance ratio shown in the figure is ≥1.0 for Model A, and sliding may occur from the sidewalls in the vertical direction. For Model B, the sliding resistance ratio is 1.0, indicating sliding from the sidewalls in the vertical direction. It should be noted that the sliding resistance ratio uses the lateral soil pressure acting normal to the sidewalls, which fluctuates depending on the dynamic soil pressure, as the denominator. Therefore, in Model A, the sliding resistance ratio becomes infinite at the time when the lateral soil pressure becomes zero, and the evaluation becomes impossible. To avoid this, in this study, the time when the lateral soil pressure became zero was excluded from the evaluation. However, at times when the lateral soil pressure is close to zero, the denominator still shows a negligible value; therefore, the sliding resistance ratio with respect to these times tends to be significant.
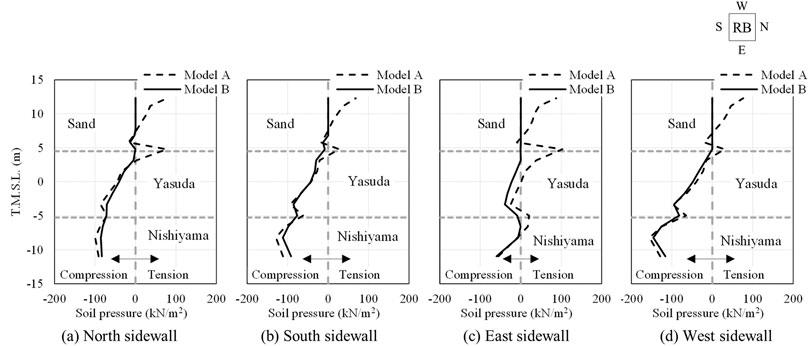
FIGURE 12. Soil pressure characteristics at time of maximum tension acting on sidewalls.
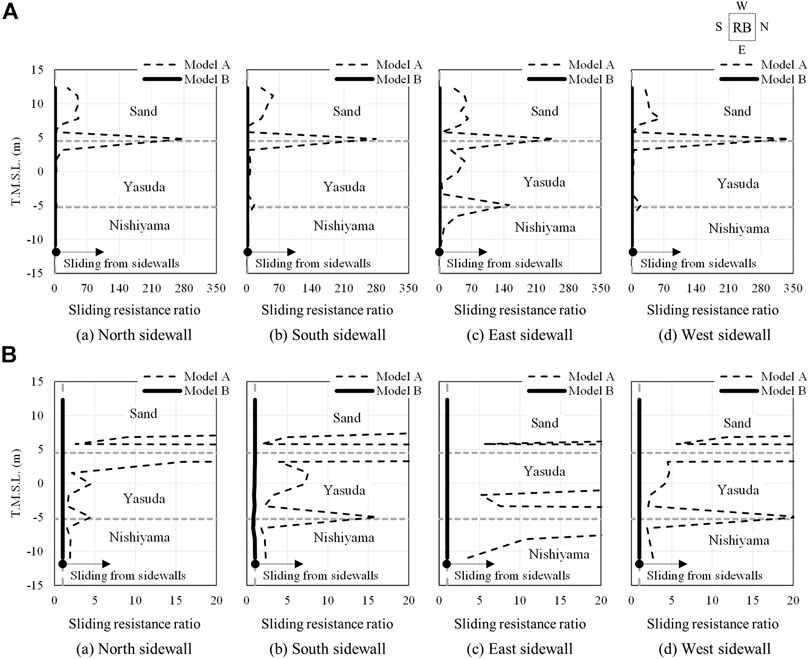
FIGURE 13. Soil pressure characteristics of sliding resistance ratio acting on sidewalls (A) Ratio from 0 to 350. (B) Ratio from 0 to 20.
From Figure 12, it can be seen that there is a separation occurred in the sand layer on the surface soil from the lateral soil pressure at the time of maximum tension. Moreover, the lateral soil pressure of the east sidewall is zero or less even in the Nishiyama layer that is deeper than the sand layer, and it can be considered that separation occurs locally in the soil rather than sand layer. Comparing Model A with Model B, a difference in the distribution characteristics of the lateral soil pressure is observed because of soil separation and sliding. In particular, a large difference can be seen from Yasuda layer on the east side to the upper part of the Nishiyama layer, and the effects of separation and sliding can be confirmed.
From Figure 13, it can be seen that vertical sliding occurred from the sand layer to the Nishiyama layer along all sidewalls in all models. Comparison of the sliding resistances of the north, south, east, and west sidewalls of Model A showed that the degree of sliding is greater on the east and west sides than on the north and south sides. This observation is consistent with the increase in the maximum acceleration response on the 1F on the east and west sides of the structure due to the occurrence of the foundation uplift (as shown in Figure 11). Comparing the results of Model A with those of Model B, the sliding resistance of Model B indicates 1.0, which represents sliding of soil from sidewalls, caused by separation and sliding. From this, it can be considered that the behavior of the structure sliding in the vertical direction is induced by considering the soil separation and sliding, and the behavior of entire uplift in the UD direction is increased. Moreover, it can be considered that such a difference in soil pressure characteristics is due to the reduction of the embedment effect of the structure caused by the separation and sliding of soil from sidewalls, and occurrence of the foundation uplift on the east side of the foundation edge. This will be discussed hereinafter in more detail.
Figure 14 shows the soil pressure characteristics when the maximum tension occurred beneath the foundation. In the figure, the dash line represents the results of Model A and the solid line represents those of Model B. The soil pressure beneath the foundation acted on the result of main grid lines in the NS and EW directions is connected by straight lines with different symbols. The maximum value of soil pressure was calculated by adding the maximum value of tensile dynamic soil pressure (positive) to the self-weight compressive pressure (negative) acting on the foundation. Therefore, when the soil pressure shown in the figure becomes positive, tension is generated, which causes foundation uplift.
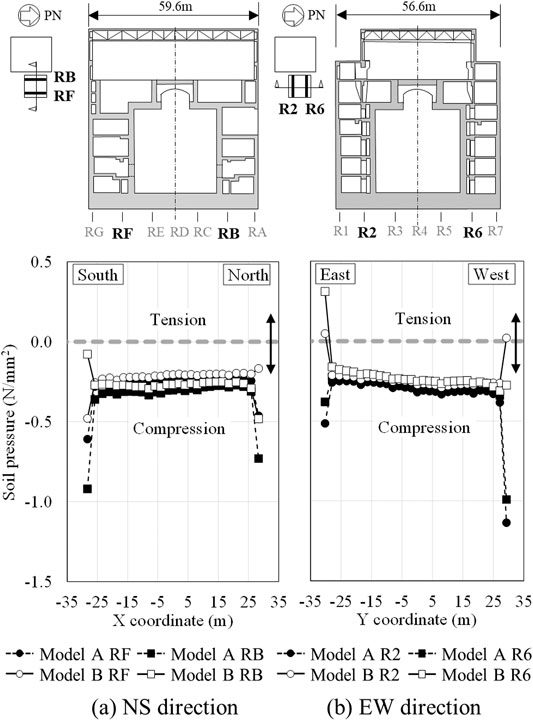
FIGURE 14. Soil pressure characteristics at time of maximum tension acting beneath foundation.
From Figure 14, it can be seen that in Model A the soil pressure beneath the foundation is compressive over the entire main grid lines and the possibility of foundation uplift is small. In addition, it can be seen that the distribution of the soil pressure of Model A corresponds to the elastic contact pressure distribution under rigid foundation, in which the soil pressure in the central part of the foundation is relatively small and increases as it approaches the edges. On the other hand, the soil pressure of Model B is mainly compressive on the main grid line, but compared to Model A, it is distributed on the tension side and rises in the UD direction. Moreover, at the end of the EW cross section there is a numerical tension value indicating foundation uplift. Since this difference in soil pressure characteristics is particularly noticeable at the edge of the east side of the foundation, it is considered that in Model B foundation uplift occurs at the eastern edge. However, since there is limited difference in the soil pressure characteristics in the central part of the foundation in Model A, it is considered that the effect of the foundation uplift on the soil pressure is local.
The above comparison of the analytical results with and without soil separation and sliding based on the recorded seismic data clarified that the separation and sliding of soil from sidewalls causes the reduction of the embedment effect of structure, and this reduction results the increase of entire structure to rise in the UD direction and occurrence of the foundation uplift at the eastern edge. In addition, it was also clarified that the reduction appeared as a local difference in the maximum acceleration response, and the soil pressure characteristics on both the sidewalls and beneath the foundation.
Conclusions
This study had the objective of accurately evaluating the influence of the nonlinear behavior of the separation and sliding of soil from sidewalls and conducted detailed SSI analyses based on the actual soil, actual structure, and the recorded seismic data of the Kashiwazaki–Kariwa NPP Unit 7 RB under the 2007 Niigataken Chuetsu-oki earthquake. The conclusions of this study are summarized as follows:
1) Comparison of simulated and recorded seismic data
• Input waveform at the bottom of soil model was iteratively corrected to match the recorded seismic data on the foundation of the B3F. Therefore, the horizontal acceleration time histories and acceleration response spectra at the positions of the seismometer installed at the 3F agreed well with the actual recorded seismic data. From this, it is considered that the seismic analysis method and models used in this study have sufficient analysis accuracy that can simulate the phenomenon generally well for the main shock of the 2007 Niigataken Chuetsu-oki earthquake.
• Compared to Model A, which did not consider separation and sliding, in Model B there was a slight difference in the low period around 0.1 s in the NS direction. However, the difference was limited and no significant effect on the acceleration response spectrum was observed from the inclusion of soil separation and sliding. Therefore, it is considered that the effect of separation and sliding of soil from sidewalls under the 2007 Niigataken Chuetsu-oki earthquake input on the horizontal responses of equipment and components near the observation points on 3F is limited.
• The characteristics of the acceleration response spectra at the observation points on 3F agreed very well with the results of the previous SSI analyses of Phase II “Best estimate analysis” in the KARISMA benchmark exercise for the Kashiwazaki–Kariwa NPP Unit 7 RB under the 2007 Niigataken Chuetsu-oki earthquake (IAEA, 2013).
2) Effect of separation and sliding of soil from sidewalls on local response of the structure and soil pressure
• There was almost no effect on the maximum acceleration response due to the cases with and without soil separation and sliding, except in the basement of the north external wall and near the 1F of the west external wall. Although the maximum acceleration in the basement of the north external wall tended to decrease, a local increase in the maximum acceleration was observed on the 1F. It is considered that this is because the embedment effect of the structure was reduced because of the separation and sliding, and the reduction caused the entire structure to rise in the UD direction and the occurrence of the foundation uplift at the eastern edge of the foundation. Therefore, it is probable that this appeared as an increase in the maximum acceleration on the 1F.
• When soil separation and sliding were considered, it can be seen that they did not affect the distribution of the lateral soil pressure on the north, south, east, and west sides evenly, but their impact was found to concentrate rather on the east side. This is considered to be caused by the occurrence of the foundation uplift at the eastern edge; therefore, the effect on the structure did not occur evenly on each side, but rather caused a general increase of lateral soil pressure along the east sidewall. Furthermore, the sliding resistance ratio in the shear direction (vertical direction) was affected by soil separation and sliding on all sides, and soil sliding was seen on all sidewalls. From this, it is considered that the behavior of the structure sliding in the vertical direction is induced by the soil separation and sliding, and the behavior of entire uplift in the UD direction is increased.
• The difference in the distribution of the soil pressure beneath the foundation tended to rise slightly in the UD direction as a whole because of the soil separation and sliding. Although the effect was limited at the center of the foundation, it appeared as a clear difference at the edge of the foundation, and the soil pressure indicating foundation uplift in EW direction was confirmed. This difference was particularly significant at the edge of the east side of the foundation. Therefore, it is considered that soil separation and sliding have a great influence on the distribution characteristics of the soil pressure along sidewalls and maximum acceleration response.
Future Challenges
In this study, the effects of separation and sliding of soil from sidewalls on the maximum acceleration response and the soil pressure characteristics both along the sidewalls and beneath foundation were relatively small. However, if a severe seismic excitation is assumed, it can be expected that the embedment effects will be further reduced because of soil separation and sliding. This reduction of the embedment effects will cause the increase of entire structure to rise in the UD direction and increase of the foundation uplift. Therefore, it is considered necessary to evaluate the response of the soil-structure interface in consideration of not only the soil nonlinearity but also the effects of soil separation and sliding in the SSI analyses using 3D FEM model under severe seismic excitations. As of this moment, the severe seismic excitation that exceed the 2007 Niigataken Chuetsu-oki earthquake and the information on the actual soil and actual structure of NPP that experienced it are not published as open data. However, when this information will be published in the future, it is expected that the effects of soil separation and sliding on the SSI analyses of 3D FEM models will be quantitatively evaluated from the seismic response analyses for these severe earthquakes. Furthermore, in this study the soil nonlinearity was only approximately considered using the equivalent stiffness and damping from the equivalent linear analysis of the soil. In future, it is expected to carry out a more detailed nonlinear analysis that will consider the interplay between of soil nonlinearity and separation and sliding.
Data Availability Statement
The datasets presented in this article are not readily available because due to the nature of this research, participants of this study did not agree for their data to be shared publicly, so supporting data is not available. Requests to access the datasets should be directed to Naohiro Nakamura, naohiro3@hiroshima-u.ac.jp.
Author Contributions
IY carried out the conceptualization of draft, data curation, theoretical analysis, validation, visualization, and writing of the original draft. NN supported the conceptualization of draft, supervision, and review and editing of the draft. MH supported the conceptualization of draft, research planning, project management, and review and editing of the draft. CB carried out the investigation, numerical analysis, data curation, and supported the theoretical analysis and review and editing of the draft. NA supported the conceptualization of draft, research planning, project management, and review and editing of the draft.
Conflict of Interest
The authors declare that the research was conducted in the absence of any commercial or financial relationships that could be construed as a potential conflict of interest.
Acknowledgments
In preparing this paper, the results from the report “IAEA, Review of Seismic Evaluation Methodologies for Nuclear Power Plants Based on a Benchmark Exercise, IAEA TECDOC No. 1722, 2013” published by the IAEA were used. The cooperation of Dr. Tadahiko Shiomi of Japan Atomic Energy Agency in the analyses is gratefully acknowledged.
References
Alves Fernandes, V., Banci, F., Devesa, G., Greffet, N., Jacquet, M., Kham, M., Nieto-Ferro, A., Voldoire, F., and Zentner, I. (2017). “Dynamic Soil-Structure Interaction Modeling Strategies Applied to Kashiwazaki-Kariwa Nuclear Power Plant Case-Study,” in Eccomas Proceedia COMPDYN, 2330–2342. doi:10.7712/120117.5571.17197
ASCE (2017). Seismic Analysis of Safety-Related Nuclear Structures/American Society of Civil Engineers. Verginia: ASCE/SEI, 4–16. doi:10.1061/9780784413937
Bolisetti, C., Whittaker, A. S., and Coleman, J. L. (2018). Linear and Nonlinear Soil-Structure Interaction Analysis of Buildings and Safety-Related Nuclear Structures. Soil Dyn. Earthquake Eng. 107, 218–233. doi:10.1016/j.soildyn.2018.01.026
Gatti, F., Lopez-Caballero, F., Paolucci, R., and Clouteau, D. (2018b). Near-source Effects and Non-linear Site Response at Kashiwazaki-Kariwa Nuclear Power Plant, in the 2007 Chuetsu-Oki Earthquake: Evidence from Surface and Downhole Records and 1D Numerical Simulations. Bull. Earthquake Eng. 16 (3), 1105–1135. doi:10.1007/s10518-017-0255-y
Gatti, F., Touhami, S., Lopez-Caballero, F., Paolucci, R., Clouteau, D., Alves Fernandes, V., et al. (2018a). Broad-Band 3-D Earthquake Simulation at Nuclear Site by an All-Embracing Source-To-Structure Approach. Soil Dyn. Earthquake Eng. 115, 263–280. doi:10.1016/j.soildyn.2018.08.028
Hijikata, K., Kikuchi, R., Nukui, Y., Imamura, A., Yagishita, F., Mase, T., et al. (2010). Three Dimensional Response Behavior of Unit No.5 Reactor Building Subjected to the Niigataken Chuetsu-Oki Earthquake in 2007. Nihon Kenchiku Gakkai Kozokei Ronbunshu 75 (658), 2179–2187. doi:10.3130/aijs.75.2179
Hijikata, K., Kikuchi, R., Nukui, Y., Imamura, A., Yagishita, F., Mase, T., et al. (2011). Dynamic Response of Unit No.7 Reactor Building during the Niigataken Chuetsu-Oki Earthquake in 2007. Nihon Kenchiku Gakkai Kozokei Ronbunshu 76 (660), 319–327. doi:10.3130/aijs.76.319
Ichihara, Y., Moritani, H., Kobayashi, K., Yamazaki, H., and Ohashi, M. (2021). Analysis of Influential Factors that Contribute to Precise Estimation of Three-Dimensional Seismic Building Behavior of Nuclear Facilities and Examinations of Applicability of its Setting Methods. NRA Technical Report Series No. NTEC-2021–4002. NRA, Tokyo [ [in Japanese].
International Atomic Energy Agency (IAEA) (2012). Guidance Document PART 1: K-K Unit 7 R/B Structure - Phase I, II and III. Vienna: IAEA.
International Atomic Energy Agency (IAEA) (2007a). IAEA Mission Report Volume I Preliminary Findings and Lessons Learned from the 16 July 2007 Earthquake at Kashiwazaki-Kariwa NPP–The Niigataken Chuetsu-Oki Earthquake–, IAEA, Vienna. Available at: https://inis.iaea.org/collection/NCLCollectionStore/_Public/40/010/40010606.pdf?r=1 (Accessed September 24, 2020).
International Atomic Energy Agency (IAEA) (2007b). IAEA Mission Report Volume II Preliminary Findings and Lessons Learned from the 16 July 2007 Earthquake at Kashiwazaki-Kariwa NPP–The Niigataken Chuetsu-Oki Earthquake–, IAEA, Vienna. Available at: https://inis.iaea.org/collection/NCLCollectionStore/_Public/40/010/40010607.pdf?r=1 (Accessed September 24, 2020).
International Atomic Energy Agency (IAEA) (2013). Review of Seismic Evaluation Methodologies for Nuclear Power Plants Based on a Benchmark Exercise, IAEA TECDOC No. 1722, IAEA, Vienna. Available at: https://www-pub.iaea.org/MTCD/Publications/PDF/TE-1722_web.pdf (Accessed April 7, 2021).
ITOCHU Techno-Solutions Corporation (2017). FINAS/STAR Version2015r170210, User Manual. Tokyo, Japan: ITOCHU Techno-Solutions Corporation.
Kikuchi, R., au, fnm., Hijikata, K., Koyanagi, T., Mashimo, M., Tanaka, S., et al. (2012). Study on Vertical Motions by Rocking Responses of Reactor Buildings. J. Disaster Res. 7 (5), 609–618. doi:10.20965/jdr.2012.p0609
Moore, J., Schneeberger, C., Zinn, R., and Zwicky, P. (2013). Earthquake Response Analysis in the Context of the KARISMA Benchmark Project, in Proc. 22nd SMiRT conference, San Francisco, Calfornica.
Nakamura, N., Ino, S., Kurimoto, O., and Miake, M. (2007). An Estimation Method for Basemat Uplift Behavior of Nuclear Power Plant Buildings. Nucl. Eng. Des. 237, 1275–1287. doi:10.1016/j.nucengdes.2006.10.010
Novak, M., Aboul-Ella, F., and Nogami, T. (1978). Dynamic Soil Reactions for Plane Strain Case. J. Eng. Mech. Div. 104 (4), 953–959. doi:10.1061/JMCEA3.0002392
Saxena, N., and Paul, D. K. (2012). Effects of Embedment Including Slip and Separation on Seismic SSI Response of a Nuclear Reactor Building. Nucl. Eng. Des. 247, 23–33. doi:10.1016/j.nucengdes.2012.02.010
Tokyo Electric Power Company Holdings, Inc. (2007). Joint Working Group 3–1 Examination of Seismic Safety of Kashiwazaki-Kariwa Nuclear Power Plant under Niigataken-Chuetsu-Oki Earthquake (In Japanese). Available at: https://warp.da.ndl.go.jp/info:ndljp/pid/286890/www.meti.go.jp/committee/materials/downloadfiles/g71225e05j.pdf (Accessed September 24, 2020).
Turpin, F., Bonfils, N., Suin, N., Humbert, N., and Petre-Lazar, I. (2012). Seismic Analysis with Soil-Structure Interaction KARISMA Benchmark, in Proceedings of 15th WCEE, Lisbon.
Wang, F., and Rambach, J. (2013). Contribution to the IAEA Soil-Structure Interaction KARISMA Benchmark, in Proceedings 22nd SMiRT Conference, San Francisco, CA.
Watanabe, K., Kikuchi, R., Yoneda, G., Motohashi, K., and Suzuki, A. (2008). The Simulation Analysis of the Reactor Buildings on Chuetsu-Oki Earthquake at Kashiwazaki-Kariwa Nuclear Power Plant Part3 Results of Analysis of the R/B Unit 7. Summaries of Technical Papers of Annual Meeting Architectural Institute of Japan, Chugoku, 1023–1024. [in Japanese].
Keywords: reactor building, 2007 Niigataken Chuetsu-oki earthquake, three-dimensional finite element model, soil-structure interaction, separation and sliding of soil from sidewalls, foundation uplift, seismic response analysis, joint element
Citation: Ichihara Y, Nakamura N, Moritani H, Choi B and Nishida A (2021) 3D FEM Soil-Structure Interaction Analysis for Kashiwazaki–Kariwa Nuclear Power Plant Considering Soil Separation and Sliding. Front. Built Environ. 7:676408. doi: 10.3389/fbuil.2021.676408
Received: 05 March 2021; Accepted: 02 June 2021;
Published: 14 June 2021.
Edited by:
Luigi Di Sarno, University of Liverpool, United KingdomCopyright © 2021 Ichihara, Nakamura, Moritani, Choi and Nishida. This is an open-access article distributed under the terms of the Creative Commons Attribution License (CC BY). The use, distribution or reproduction in other forums is permitted, provided the original author(s) and the copyright owner(s) are credited and that the original publication in this journal is cited, in accordance with accepted academic practice. No use, distribution or reproduction is permitted which does not comply with these terms.
*Correspondence: Naohiro Nakamura, bmFvaGlybzNAaGlyb3NoaW1hLXUuYWMuanA=