 Rucheng Liu
 Sakdirat Kaewunruen
- Department of Civil Engineering, School of Engineering, The University of Birmingham, Birmingham, United Kingdom
The casual effect and synergy of high-speed rail development on the modal transport changes in supply chain and logistics have not been considered well during the initial phase of any rail project design and development. This has impaired the systems integration and connectivity among the modes of transport in a region. In the United Kingdom, High Speed 2, a large-scale railway project with a planned completion date in 2033, affects many transport stakeholders. The project influences the existing transport systems, but the transport systems integration design has not been well depicted, resulting in a pressing concern on systems connectivity and social value. This is evident by many public protests along the planned route of the project. Therefore, it is important to evaluate different aspects for any possible changes in supply chains caused by the development of high-speed rail networks. This paper is the world's first to provide the sensitivity analysis of supply chains via air-rail-road freight transportation and logistics stemming from the High Speed 2 case by the rigorous assessments into the capacity, performance and environmental changes that may follow the project’s implementation. The research proposes a new method for estimation of consequences from a new transport project construction. The research findings demonstrate slight beneficial changes in freight transportation and logistics with a high potential for development; and reveal the project’s weaknesses and opportunities for better systems integration and business synergy.
Introduction
With infrastructural development in the railway field and scientific and technological progress, there has been a dramatic evolution of railway systems. The evolution is not only for railway speed acceleration but also for transport capacity improvement. Hector et al. (2012) find that United Kingdom does not have any plans to build its High-Speed Rail (HSR) until 2004. Consequently, United Kingdom finally enters the era of HSR after the completion of the first high-speed line (HS1) from the Channel Tunnel to London. In addition, High Speed 2 (HS2), which connects London, Birmingham, Manchester, the East Midlands and Leeds, is the largest European transport project so far with an estimated cost of 55.7 billion pounds sterling (GBP). According to a report published by Transport Statistics Great Britain (2019), 808 billion passengers’ kilometres travelled in the United Kingdom in which 83% of the passengers travelled with cars, taxis and vans. On the other hand, about 8.3 billion journeys in 2018/2019 over public transport vehicles. In contrast to this, the remaining journeys were similar to what they were in the previous year. This depicts that transport is essential for people in Britain, which makes it necessary for the government to emphasise infrastructure development. Although the construction project might significantly affect the existing transport system of the United Kingdom (Department for Transport, 2017), it could bring huge transport, economic and environmental benefits. However, the project might affect many stakeholders in the long-term run due to its large expense (High Speed 2, 2019).
Since the main purpose of constructing HS2 is to shift freight haulage from road to rail, it is essential to analyse the probable impact on air-rail-road freight transportation systems to understand the causal effect and synergy of high-speed rail development. In line with Gunasekaran et al. (2001) and Chan (2003), the research method for supply chain analysis will be focused on performance measurement to study the number of metrics related to different parties’ interactions. As Beamon (1999) states, it is necessary to consider several metrics to derive a detailed understanding of supply chain characteristics and identify their importance.
Evaluating the high-speed train project is that the entire project involves a huge cost, increasing the risk of this project. In this manner, the lack of evaluation can result in project failure and loss of investment. Therefore, the evaluation of the high-speed rail project has been carried out in this study. In the study of Yeo and Ren (2009), it has also been argued that it is vital to assess the risks involved in huge projects as the chances of failure are more associated with high-cost projects. Concerning the public hearing, people support the entire project, making their communication much more efficient. It is because high-speed rail will reduce the travelling time between towns, which will provide quick service to passengers and save them a lot of time. However, it was also revealed from public hearing that some of the residents are against the entire high-speed railway project in the United Kingdom as the infrastructure invade their space (BBC.com, 2020). Concerning the project of HS2, the major source of delay for the entire project is that the project has been split into two sections. The construction for London to Birmingham route began in 2017 and is expected to be completed by 2026. However, Birmingham to Manchester or Leeds route started in the mid-2020s and is expected to be completed by 2032.
This research intends to evaluate the possible impact of the HS2 project on supply chains by analysing air-rail-road freight transportation and logistics and numerically considering different aspects of changes. In this case, the HS2 project’s advantages and disadvantages would be fully demonstrated and discussed. In this paper, four different stages of rail freight will be discussed: Business, as usual, Carbon Reduction, Carbon Survival and Manufacturing that indicate different aspects in environment and capacity improvements. According to High Speed 2. (2021), H2S is considered the new high-speed railway linking up Scotland, the North, Midlands and London while serving more than 25 stations. In addition to this, it also includes its operations in the eight largest cities of Britain while ensuring the connection of 30 million people. This construction of a new railway has been divided into three phases. The first phase link West Midlands and London, and the second phase are also divided into sub-phases in which phase 2a link the North and West Midlands through Crewe. In contrast to this, phase 2b completes the railway to Leeds and Manchester. With the construction of a new railway line, the project takes the fast trains off the present railway and place them over their dedicated tracks. It helps o better connect the major cities and towns in the country. In addition to this, it also allows local and slower trains to bunch up over the existing lines while providing ample space across the country for various freight trains and commuter services (Kaewunruen et al., 2016; Office of Rail and Road, 2019).
Sensitivity analysis is the method used to predict the outcome of a decision in case of a different situation compared to key predictions. It has also been argued in the study of Shariat et al. (2018) that sensitivity analysis helps predict the outcome of decisions in case of different situations compared to key prediction. In this manner, the riskiness of the strategy is determined with the help of sensitivity analysis. Moreover, it also determines how the dependent has been the output over a particular input value. This study has been carried out to conduct a sensitivity analysis of a high-speed rail development on supply chain and logistics via air-rail-road freight transportation. In this manner, the results of this study are beneficial for the risk assessment of the H2S railway project. Furthermore, the study over the sensitivity analysis of high-speed rail development on supply chain and logistics via air-rail-road freight transportation has not been carried out before, making the results of this study unique while providing a significant contribution towards existing literature.
The layout of this paper is as follows: it begins with the review of previous literature in Literature Review section, including definitions and roles of parties, an overview of papers related to supply chain analysis, industry trends and a summary of forecasts and reports. Methodology Section outlines the data selected principles and data analysis methods, including performance measurement and environmental effect analysis. Further, Results and Discussion section discusses the findings that are derived and evaluated for each relevant result. The conclusions of the research are presented in Conclusion section.
Literature Review
Roles and Definitions
The figure above shows the detailed map of the company’s supply chain process in a detailed manner. The above figure shows that the direct supply chain involves three stages in which the flow of goods and services initiates from suppliers and ends at customers. However, the ultimate supply chain initiates with the ultimate supplier and ends at the ultimate customer. On the other hand, the extended supply chain initiates with the supplier’s supplier and ends at the customer’s customer.
There are various definitions for logistics and supply chains. Mentzer et al., 2001 finds that ‘supply chain management (SCM) is rarely used in its full term. Instead, followed by Christopher (2005), the short term ‘supply chain’ is often used to describe ‘the management of upstream and downstream relationships with suppliers and customers to deliver superior customer value at less cost to the supply chain as a whole. Although SCM and logistics overlap, Mentzer et al., 2001 claims that SCM deals with manufacturing and marketing to improve corporate competitive advantages, whereas logistics deals with transportation and warehousing. Supply chain management is considered the management of the flow of services and goods, including all the processes that transform the raw materials into finished goods. In addition to this, it includes the active streamlining of different supply-side activities of the business to maximise customer value while gaining a competitive advantage in the industry. A supply chain comprises three units represented by upstream distribution, downstream distribution, and the final customer. Different types of supply chain complexity are illustrated in Figure 1. Moreover, there is significant connectivity between supply chain management and logistics management practices, as it is based on the implementation and control of the effectiveness and efficiency of the flow and storage of goods, services and information between the points of origin and point of consumption to meet the requirements of the consumers (Yang and Zhang, 2018). Therefore, logistics management is all about fulfilling the requirements of the consumers and higher their satisfaction level.
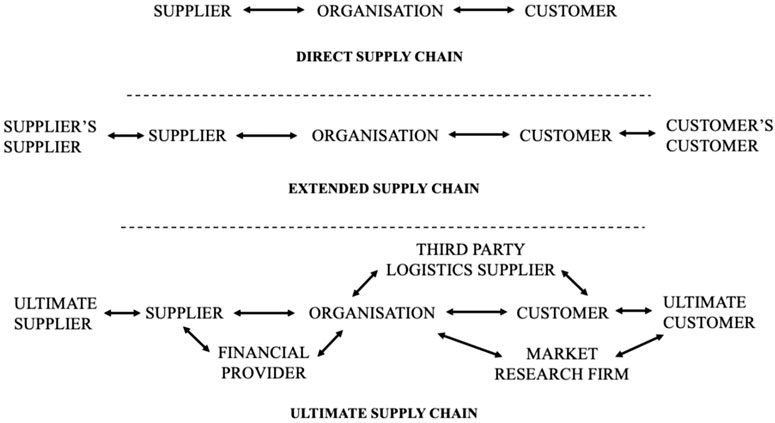
FIGURE 1. Types of supply chain complexity [9].
Several research studies have considered the role of transportation in logistics systems. It has been shown that they are related in many fields. Tseng et al. (2005) note the following: 1) profound interdependencies between transportation and logistics systems. On the one hand, transportation is an integral process of logistics. On the other hand, a logistics system could positively affect traffic and reduce environmental impact; 2) transportation has the highest contribution to logistics system costs; therefore, how to increase its monetary and nonmonetary performance should be considered. The dependence of successful logistics strategies on transportation proposes the consideration of related business models. The function of transportation provides essential service in linking the companies to its customers and suppliers with the help of moving goods from locations in which they are sources to the locations in which they are demanded. In this manner, transportation is considered an essential activity in the logistics function while supporting the economic utilities of time and place. As per the study conducted by Mantoro (2021), transportation mode refers to several ways people or goods are transported from one place to another through sea, land or air. In addition to this, the transportation modes are also through space, cable and pipelines. Concerning the transportation of people, there are several modes which include by air, sea, land. Specifically, land includes different transportation means in which cars, trains, motorcycles, and other motor vehicles are included.
Supply Chain Analysis
Although performance measurement has been considered for supply chain analysis (Mishra et al., 2017: Hosseini, Ivanov and Dolgui, 2019), limited attention has been given to measuring supply chain for designing or evaluating the whole system. Adapted from Beamon (1998), the performance measures will be the basis for this research. In addition, the importance of different aspects of performance measurements needs to be considered, categorised and enabled to set the targets for further detailed studies. As the first framework for evaluating supply chain performance, Supply Chain Operations Reference Model (SCOR) model is proposed by Stewart (1995) to demonstrate supply chain development. By examining the revenues and costs of the supply chain system, high performers among supply chains could be identified. Similarly, Wilting and van Oorschot (2017) indicated that the allocation of functional areas led to the emergence of the concepts of supply logistics (procurement logistics), production logistics, distribution logistics and books with corresponding titles in the domestic literature. In foreign logistics management, the term “input logistics” refers to logistics functions in procurement. The term “output logistics”, focused on integrating logistics functions and operations in distribution, is often encountered. But it should be emphasised that there is no single approach to identifying the functional areas of logistics among scientists and specialists. Some domestic researchers narrow these areas to individual functions, and therefore, on the shelves of bookstores, one can often find books with the titles: "Customs Logistics”, “Insurance Logistics”, “Transport Logistics”, “Warehouse Logistics”, “Information Logistics” etc., (Raoufi et al., 2017) The point, of course, is not the title, but they sometimes lack a constructive idea, and the very word “logistics” is added to the title of books, often for opportunistic reasons. Consider the key logistics function - “transportation”.
Regarding the importance of quantitative and qualitative evaluation, three elements of the performance measurement system are identified for this paper: resource, output, and flexibility. In addition, as presented by Neely et al. (1995), cost, time, quality, and flexibility might also contribute to supply chain evaluations. Previous research has also tended to apply performance measurement to gauge the degree to which organisations successfully collaborate with their business partners in a supply chain (Lambert and Pohlen, 2001). The importance of discovering the elements of the performance measurement system is to match the priorities highlighted by different parties and achieve different levels of operational performance.
The supply chain relationship is critical with completing the entire project and the risks involved in the project. Supply chain management is directly associated with the capacity, performance, and environmental changes that might follow the implementation of this project. Therefore, this paper provides the sensitivity analysis of supply chains via air-rail-road freight transportation and logistics stemming from the High Speed 2 case by the rigorous assessments into the capacity, performance and environmental changes that may follow the project’s implementation. It has also been discussed in the study of Larsson and Larsson (2020) that supply chain management significantly contributed towards the completion of the entire project.
Gunasekaran et al. (2001) implemented empirical analysis to assess strategic planning, order planning, supplier, production, and delivery. On top of that, performance metrics will be defined according to the level of their importance. Specifically, Gunasekaran et al. (2001) obtains quantitative data from received questionnaires in 21 companies out of the 150. Moreover, transport enterprises operate in a market economy: a market for transport services has been formed, competition between enterprises and various modes of transport has intensified, and the requirements for tariffs and quality of transport services on consumers have become stricter (Dolgui et al., 2018). The modern transportation mission in the logistics service system can be briefly formulated as: “to deliver the right product of the required quality and quantity at a given time with optimal costs.” In the structure of logistics costs, transportation costs account for a significant share of 20–40% or more (Suryanto et al., 2018). Therefore, optimisation of solutions in transportation will allow logistics management to obtain significant cost savings but will also require special attention. Transport plays a special role in the formation and development of logistics. Domestic transport and forwarding companies involved in the international transportation of goods were the first to see the need to introduce modern logistics technologies for transportation and cargo handling (Tarne et al., 2018). Large United States state and private transport and forwarding companies actively created their terminal networks, freight distribution and logistics centres, information and computer support systems for logistics services.
As various performance metrics exist, and all of them have different importance, a systematic approach has been implemented for supply chain evaluation. Gunasekaran et al. (2001) developed the performance measurement framework, representing the financial and non-financial metrics allocated in strategic, tactical and operational levels, which encourages appropriate decision-making in supply chain analysis. Although Gunasekaran et al. (2001) study provides the foundations for supply chain analysis for the HS2 case, not all the metrics are related to freight transportation that requires further research.
Freight Transportation Industry Trends
HS2 is a long-term project that will be constructed over more than a decade. Therefore, it is essential to consider trends in freight transportation and global development. As transport systems are used for passenger and freight movements, it is important to understand their interdependencies. Speranza (2018) has identified and considered systematic, collaborative, and dynamic directions from the following main trends in supply chain management:
• Systemic focus: optimisation of the entire supply chain network, customer value co-creation.
• Information synthesis: information is holistically shared.
• Collaborative relationships: joint accountability and rewards, total system value creation.
• Demand shaping: proactively influencing demand, total system value creation.
• Transformational agility: constantly changing conditions.
• Flexible network integration: dynamic selection of partners upstream and downstream.
• Global optimisation.
It is identified that costs and environmental conditions are driven by sustainable, political, and emerging business opportunities that could cause rapid alterations in logistics and transportation.
Freight transport moving through cities is continuously growing and should be controlled. Crainic et al. (2004) design goals for logistics, which could improve the quality of life in cities, including reductions in pollution, noise, congestion, and growth of mobility without hurting business. The research discusses the significance of intermodal freight transportation, logistics’ facilities allocation and distinguishes the possible efficiency of satellite platforms. In addition, Tseng et al. (2005) discusses the provisional future of logistics with logistics centres’ development and assume the growth of single trip loads and collaboration in delivery between small and medium-sized companies.
In each country, shipping goods is considered a significant part of the economy. As per the report presented by Statista, the contribution of truck transportation has contributed about $150 billion to the GDP of the United State in the year 2016 (Stfalcon.com, 2021). Exclusively, FedEx, which is the leading freight transportation company, has generated over $60 million of the revenue in 2016. On the other hand, the intelligent transport system emphasises achieving traffic efficiency by reducing traffic problems. In addition to this, it also emphasises reducing commuters’ time while enhancing their comfort and safety. This relates to the HS2 project as the project focuses on providing high-speed transportation service to the public while reducing the time and traffic load. Furthermore, modern ideas about the transportation of goods began to change significantly with the development of market relations, from transport as an industry, equated to industrial sectors, to the service sector—transport service. Therefore, consumers of transport services choose such types of transport and transportation methods that provide the best quality of logistics services (Ahmed et al., 2018). Sadatsafavi et al. (2017) stated that transport service in modern conditions includes the transportation of goods from the supplier to the consumer and many forwarding, information operations, cargo handling services, insurance, security, etc., Therefore, transportation can be defined as a key logistics function associated with the movement of products by a vehicle (or means) using certain technology in the supply chain and consisting of logistics operations and functions, including forwarding, cargo handling, packaging, transfer of ownership of goods, insurance of risks, customs procedures, etc.
Based on various studies, information technology (IT) has been discussed as a significant influencer of logistics and freight transportation. Effective information exchange is important for performance metrics related to customer service and scheduling (Bhagwat and Sharma, 2007). IT solutions are widely used in city logistics and help transport costs and emission reduction (Tseng et al., 2005). The growth of demands and related problems have promoted the development of intelligent transportation systems (ITS). Specifically, the term ITS is ‘generally used in many industries, infrastructure, and services, as well as the planning, operation, and control methods to transport persons and freight’ (Grainic et al., 2009). In the research of Crainic et al. (2004), possible freight ITS’ accomplishments are discussed, and three directions for development related to vehicles and infrastructure, hardware and software, models and algorithms are examined. Moreover, Torre-Bastida et al. (2018) indicated that the incorporation of Information technology in freight logistics is also improving the flow of information and help in developing a smooth communication channel between the suppliers and companies. Therefore, it has become easier for companies to improve their overall infrastructure with strong communication channels, leading to better economic development. Most developed where there is a dense network of airlines. The most significant fleet of ships is in the United States, Canada, France, Germany, Australia. The cargo turnover scheme unites over 1,000 airports around the world. Singh et al. (2021) research also indicated that the share of air transportation accounts for a very small part of the cargo worldwide, no more than 1–2%. This is due to the high cost of shipping and a large number of restrictions. Air transport is used mainly for the transportation of perishable and unique goods. After all, its indisputable advantage is speed. Aircraft is the only way to move cargo quickly over long distances.
Sustainability has become one of the most important issues for citizens and governments. Several research studies consider drivers for sustainable supply chain management and outline how the situation could change in the future. Cucchiella et al. (2012) define key enablers for the United Kingdom’s private sector as: ‘customer requirements, reputational risk, organisational factors including strategic, people and functional issues, and stakeholder involvement; whereas possible obstacles cost reduction, other corporate preferences, lack of long-term planning and customers’ impact. In addition, Diabat and Govindan (2011) discover drivers for green supply management and establish a hierarchy running from 1 (the top) to 5 (the bottom), as shown in Table 1.
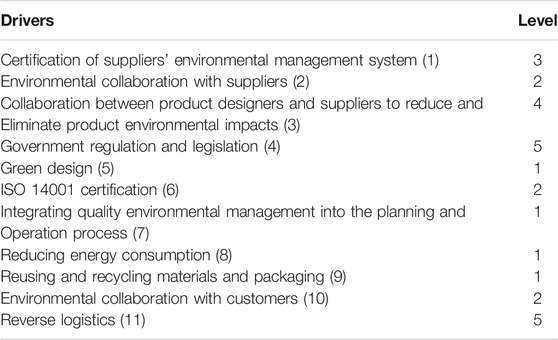
TABLE 1. Hierarchy of the drivers affecting the implementation of green SCM (Diabat and Govindan, 2011).
The data obtained by Cucchiella is related to several large companies, therefore, small and medium-sized organisations were not analysed. Diabat and Govindan’s study was based on an investigation of Indian manufacturing companies, thus, allocation levels could differ for other countries or industries. These research studies have helped understand the importance of sustainable supply chain management in current and future environments.
Methodology
Research Design
Supply chain analysis, which comprises capacity evaluation, performance measurement and estimation of carbon emissions, is implemented to evaluate the possible impact of HS2 construction on existing air-rail-road freight transportation and logistics. Data for previous years is obtained from the government’s statistical reports, whereas projected data is derived from forecasts published on departmental government websites. Evaluation of the freight transportation system is conducted to identify the existing capacity of the previously mentioned modes of transport. Then the balance between passenger and freight usage of railways is identified, and the potential traffic for the case when the railway is used only for freight transportation is calculated. The data from the forecasts are used to predict demand and shares of domestic cargo transport by mode in 2033, when HS2 will be completed.
The criteria for selecting data have been the websites and reports that present transport data of the United Kingdom since the project has been initiated in the United Kingdom and will be operational in the cities. Therefore, the data considered in this study would be relevant for the analysis of risks assessment of H2S projects in the United Kingdom A business as usual is considered as the scenario for future patterns of activity which undertakes that there will not be a significant change in the priorities and attitudes of people or no massive change in the policies, economics and technology, and for this purpose, the normal circumstances can be anticipated to remain unchanged. On the other hand, the carbon reduction strategy describes particular steps that businesses can take to implement practical, sound and climate-related corporate policies. With the help of these strategies, the companies can ensure the carbon survival and manufacturing of goods based on sustainable practices.
A framework for measuring the performance of a supply chain, providing financial and non-financial performance metrics, is applied to the project (Gunasekaran et al., 2001). Performance metrics are analysed by basis and level of importance (Beamon, 1998). As this approach could be utilised for the whole supply chain, including delivery and storage aspects and production and planning, some metrics are not relevant to the project. The environmental effect of possible alterations in freight transport mode usage is evaluated by comparing carbon emissions before and after HS2 will be delivered. The environmental effect of possible alterations in freight transport mode usage is evaluated by comparing carbon emissions before and after HS2 will be delivered. The method used in this research could be applied to evaluate the impact of a new transport project construction.
Forecasts and Reports
As the final phase of HS2 is expected to be constructed in 2033, available reports estimating possible air-rail-road freight transport sector development have been considered. ‘Foresight’ is the program driven by the Government Office for Science, which provides strong data for policymakers to support and define strategies for the future (Government Office For science, 2013). Two reports developed under this program have been used for this research: ‘Understanding the United Kingdom Freight Transport System’ developed by MDS Transmodal and ‘The Future of Mobility (Government Office For science, 2019a). One more MDS Transmodal report about future freight demand has been used in the study (National Infrastructure Commission, 2019). ‘Implications for the Air Freight Sector of Different Airport Capacity Options’, a report created for the Freight Transport Association and Transport for London, was also examined (York Aviation, 2015). The previously mentioned forecasts and reports for the Department for Transport (DfT) have been utilised; however, it has been considered that the data obtained may comprise some level of inaccuracy.
Capacity Evaluation
The latest data for rail market shares available for 2017 presented by the Office of Rail and Road allowed information to be obtained about how much freight was lifted and moved by rail and road in heavy goods vehicles (HGV) (Office of Rail and Road, 2018). In this study, airfreight transportation statistics are derived from several report tables. The ‘goods lifted’ (million tonnes) figure is taken as the total amount, including domestic and international movements (Department for Transport, 2018a). ‘Cargo tonne-kilometres flew’ (freight and mail) for domestic movements is used for carbon emissions’ calculations because this figure is more related to the case than the total number for domestic and international flights (Department for Transport, 2018b).
The possible capacity for railway freight transportation usage is obtained by multiplying the data of freight lifted and moved and the coefficient of growth. Here the potential capacity of the existing railway is derived as a sum of passengers (130 million) and freight (34 million) rail vehicle kilometres statistics’ data available for each purpose (Department of Transport, 2018c) Then the coefficient of growth is identified by a division the sum, that was obtained previously by the current rail freight capacity. There are various limitations related to potential capacity evaluation due to the complexity of logistical systems, market tendencies and unclear interdependencies between modes of freight transportation; hence, this approach is not exhaustive, and other statistical data could be utilised for the analysis.
Several strategies for forecasting rail and road freight demand are ‘Business as Usual, ‘Carbon Reduction’, ‘Carbon Survival’ and ‘Manufacturing Renaissance’ for 2050. The two strategies with the highest demand in the road and rail freight transport are Business as Usual and Manufacturing Renaissance. Carbon Reduction and Carbon Survival scenarios focus on emissions’ mitigation, but the main difference is that the second one excludes HGV electrification. Forecasted data also are calculated for the HS2 case, where part of road freight movement capacity has shifted to the railway to reach its maximum load, as determined previously. The estimated freight lifted by air transport in 2033 is 3.4 million tonnes, calculated from current (2.64 million tonnes) data and forecasted (4.2 million tonnes) data for 2050. Freight moved by air transport (billion net tonne-kilometres) is determined by proportion to the growth of the freight lifted.
Performance Measurement
Performance measurement is implemented based on several works presented below. The framework developed by Gunasekaran proposed a list of financial and non-financial performance metrics divided into three levels: strategic, tactical and operational. On each metric, the basis of the evaluation is allocated: cost, flexibility, customer responsiveness, cost and customer responsiveness, cost and activity time (Beamon, 1998). In addition, the levels of importance are defined for the performance metrics according to the ratings presented by Gunasekaran. Not all of the metrics provided by Gunasekaran fully matched the performance measures in supply chain modelling provided by them in the later study; therefore, the importance of those metrics is allocated by a degree of propriety (Gunasekaran et al., 2004). The probable consequences of HS2’s construction are estimated in terms of key stakeholders and their expectations, presented in Table 2. Risks for each group of stakeholders are determined in the case of possible failure of their expectations.
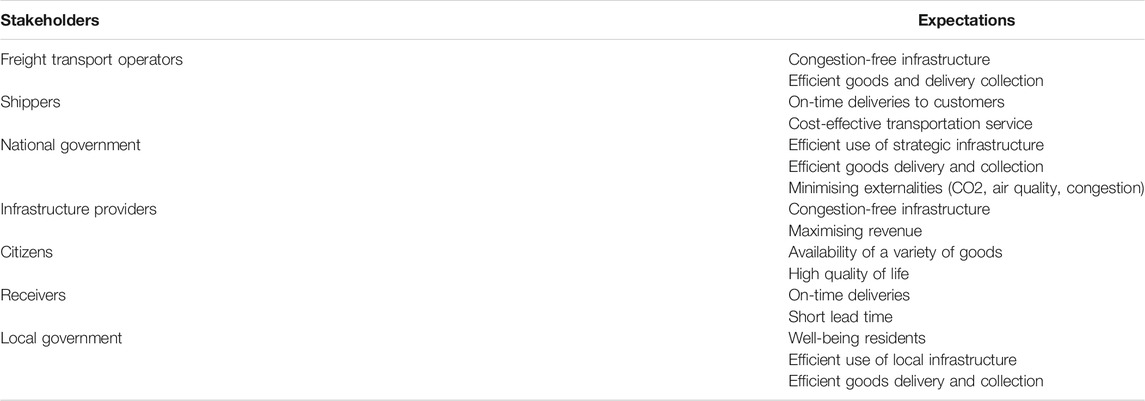
TABLE 2. Freight transport stakeholders and expectations (Government Office for Science, 2019b).
Cost-based performance metrics are evaluated by comparing the current and forecasted data for 2033, calculated for different strategies proportionally from the 2050 forecast (National Infrastructure Commission, 2019). There is no statistically proven and projected data for domestic air cargo costs in the United Kingdom. In addition, a comparison of the value of goods moved by transport mode is implemented.
As there is no scheduling for road freight delivery and air cargo movements can be scheduled, and non-scheduled, estimation of time-based metrics are implemented by analysing available statistic data for the reliability of deliveries for road and rail transport modes. Flexibility and customer experience assessments are implemented by estimating possible changes in technologies, information exchange, and the development of new transport hubs, which accompany the HS2 construction (Department for Transport, 2017).
Environmental Effect
The report’ Carbon dioxide emissions by transport mode’ presented by the DFT provides figures ‘by source’, ‘by end user’ and ‘by industry’. The most suitable data associated with freight haulages are in the ‘by source’ section, representing direct emissions from transport. In addition, rail freight transport is mostly moved by diesel engines and the share moved by electric insignificant. Therefore emissions are taken ‘by source’. The data from road freight transport is calculated as a sum of the emissions from HGVs and light goods vehicles (LGV). Values for 2016 are used because changes in transport emissions for 2016–2017 were about 0%, and there are no available statistical reports for 2017 (BEIS Annual Report and Accounts 2016 to 2017, 2017). To calculate emissions values for strategies considered in the capacity evaluation paragraph, current figures for each mode (million tonnes of carbon dioxide) are divided by current freight figures moved (billion net tonne-kilometres) and multiplied by forecasted values for freight moved. The values for the emissions per 1,000 net tonne-kilometres are calculated by the division of the emissions of a million tonnes of carbon dioxide by the freight moved (billion net tonne-kilometres), and then the result is multiplied by 1,000.
Results and Discussion
Capacity Evaluation
The comparison of freight and passenger rail usage in rail vehicle kilometres shows that the existing system could be used for 4.85 times greater levels of freight haulage than it currently is. Analysis of capacity shows that after the HS2 construction, from 14 to 16% of freight could be moved by rail, whereas it may remain at 5% of the overall amount without this project. This has also been supported in the study of Gharehbaghi et al. (2020) that the construction of high-speed rails allows efficient freight forwarding. The biggest part of freight is moved by road transport, while airfreight is accountable for the smallest market share, less than 1%. Table 3 shows freight lifted and moved by transport mode for current and forecasted situations. Shares of the market for rail and road modes of freight transport for different strategies are displayed in Figure 2 and for different strategies for the HS2 case in Figure 3.
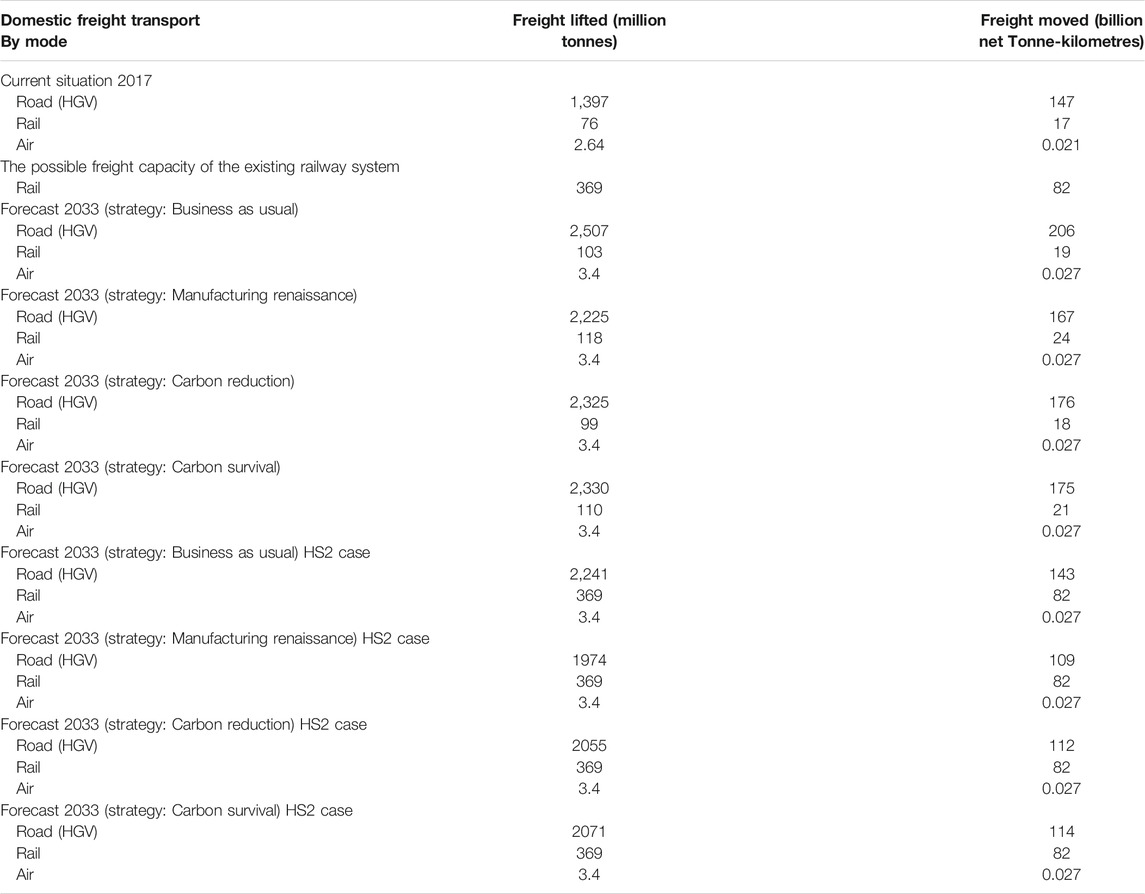
TABLE 3. Freight lifted and moved by transport mode.
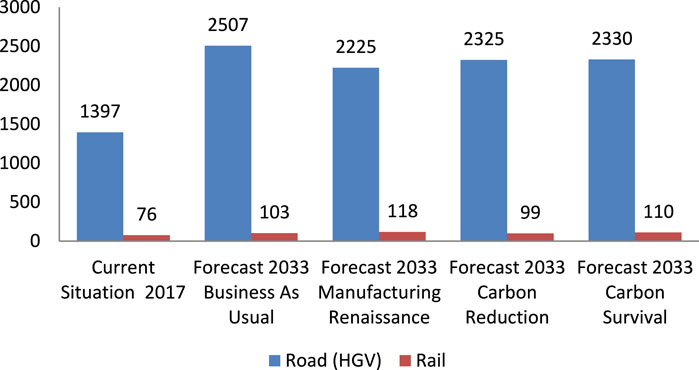
FIGURE 2. Freight lifted by transport mode.
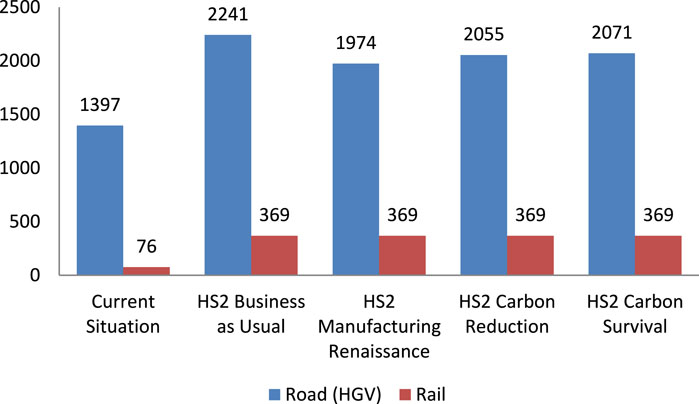
FIGURE 3. Freight lifted by transport mode HS2 case.
Capacity evaluation enabled the identification of the ‘Business as Usual’ strategy as having the biggest load for freight transportation with the smallest share of rail freight; while ‘Manufacturing Renaissance’ conversely holds the lowest level of load with the biggest share of rail haulage capacity, which could be caused by a focus on global trade and advanced technological production output. The total difference between these strategies is around 10%, while for the two other carbon strategies, it is about 7% compared to ‘Business as Usual.
The HS2 case is considered based on the calculated value for the existing rail system’s possible utilisation. Statistics for freight lifted and moved in the case of the maximum railway load reveals the situation with the current demand for 2017. There are some features, such as a percentage of freight carload and empty running, which could change over time; therefore, the level of maximum rail freight capacity would be higher if trains were loaded fully. This has also been supported in the study of Li and Zhang (2020) that the capacity of rail freight could be maximised if the trains are fully loaded.
Statistics and forecasts available for freight transportation mostly show rail and road transport are the most competitive; while airfreight is usually analysed separately, and seems insignificant, and was considered as supportive to the others, which may be caused by different features, strengths and weaknesses of air and land logistics. In the study of Tamannaei et al. (2021), it has also been argued that rail and road transportation are both considered most competitive for freight transportation. Capacity evaluation could be implemented by other reports or forecast analysis. Various statistics’ data comparisons could derive the balance between passenger and freight rail usage for the existing system. LGV as a part of road transport could be analysed and freight transportation executed by different means, such as waterborne or pipelines.
Performance Measurement
Shifting freight from road to rail may positively affect the haulage industry and reduce congestion on the roads. This argument is also supported in the study of Pittman et al. (2020) that freight through rails can reduce the congestions on the roads. The share of railway freight is noticeably smaller than that of road transport; therefore, there is a probability that changes could be insignificant. The performance of rail freight transportation has a large potential to solve related to overall effectiveness, empty running and loads of railway carriages which could be improved by applying IT, new technologies and modern management techniques. Also, the study of Blagojević et al. (2020) argued that rail freight transportation could enhance the overall effectiveness of the transport industry. A framework for measuring the performance of a supply chain is presented in Supplementary Appendix S1.
Cost analysis for rail and road freight transportation, as displayed in Figure 4, shows that the maximum price for road transport is for the ‘Business as Usual’ and ‘Carbon Survival’ strategies, which the overall consumption of goods could cause, there is no ban on diesel and tax increases. The minimum cost for rail freight haulage is under the ‘Carbon Survival’ strategy, probably because of a shift to electric engines, technological development and tendencies in the market (Ehrenberger et al., 2021). The minimum cost for rail freight haulage is under the ‘Carbon Survival’ strategy, probably because of a shift to electric engines, technological development and tendencies in the market. There is no price information for air freight for the same strategies, but usually, this mode of transport costs are larger by four to five times (The World Bank, 2009). Airfreight logistics have speed, flexibility, convenience, regularity as advantages and high costs as a disadvantage (Tseng et al., 2005), while land logistics are much cheaper and have significantly different features.
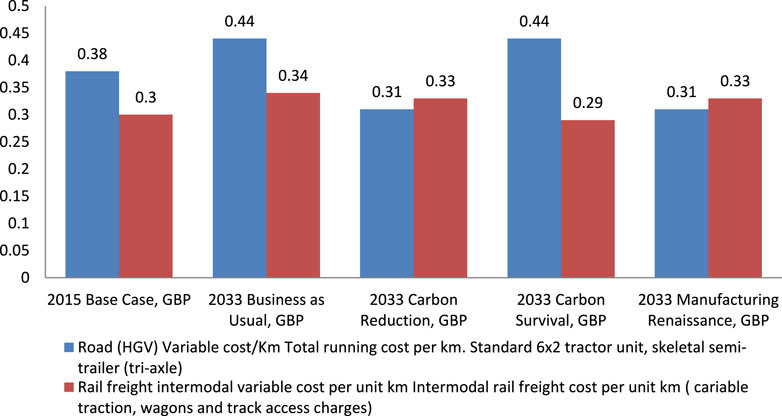
FIGURE 4. Cost assumptions to the GB Freight Model.
Approximately 94% of freight trains arrived on time, whereas around 13–14% of road deliveries failed, revealing that rail freight transport is more reliable and has no dependence on road congestion. Therefore, all the time-related metrics evaluated for the HS2 case are favourable.
The HS2 construction will accompany transport hubs and stimulate new logistics centres that could directly affect companies’ planning (Department for Transport, 2017). Reliable transport and warehouse accessibility allow increasing inventory turnover revealed by Tseng, which contributes to profitability, and hence flexibility, so responsiveness metrics are seen to be enhanced (Kamalahmadi et al., 2021).
It is possible that changes associated with customers would not be significant and may depend on information exchange about their deliveries. Modern technologies enable this to be carried out relatively high but could be improved with overall industry development. The risk identification presented in Table 4 is based on stakeholders’ expectations of failure. The proposed level of demand and load shows that the share of rail freight would be noticeably smaller; consequently, freight haulage as an industry could receive less significant benefits than passenger transportation.
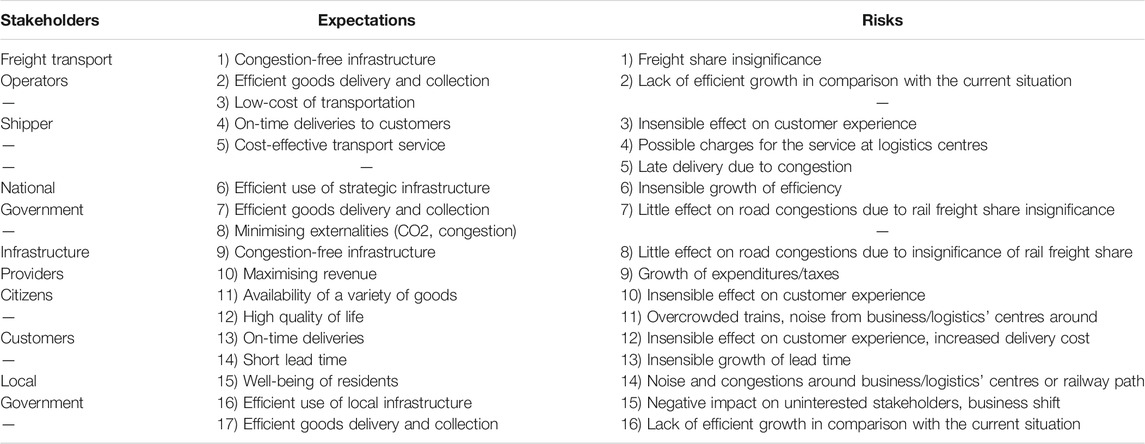
TABLE 4. Risk identification.
Performance framework analysis provides an evaluation of HS2 construction in terms of metrics and basis. However, this approach could be improved by a deeper investigation of each element, and the possible impact could be expressed numerically (Elshaikh et al., 2018). In addition, the performance measurement of large United Kingdom companies working in the air/rail/road freight transportation industry, which is based on this technique, could be implemented to identify the possible impact of HS2.
Environmental Effect
Environmental effect analysis implemented in terms of carbon emissions shows that values for the HS2 case would be smaller than if there was no shift of freight from road to rail in all the strategies considered (as shown in Table 5). However, once actual results are received in the future, the impacts could be even less, as calculations in the research are executed based on current vehicle emissions, and the technological effects of new engines working on alternative energy sources were not considered. Total carbon emissions for air-rail-road freight transport are shown in Figure 5.

TABLE 5. Different emissions for stages.
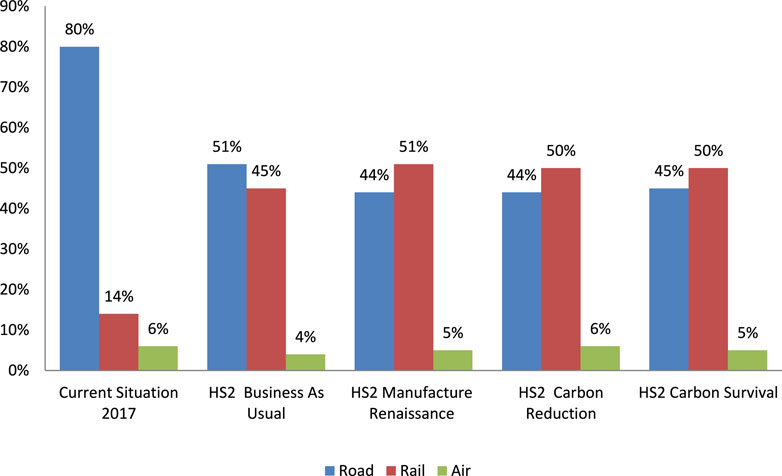
FIGURE 5. Possible total reduction of carbon dioxide emissions.
Total carbon emissions for the ‘Business as Usual’ strategy are the largest, whereas the lowest is for ‘Manufacturing Renaissance’, which has insignificant distinctions with two carbon strategies. Forecasted data for the different strategies are shown in Figure 6, and for the HS2 case are shown in Figure 7. This distribution of shares may be due to economic and social trends, which are included in the characteristics of the strategies under consideration. Calculations of emissions show that road freight transportation produces 265 tonnes of carbon dioxide per 1,000 net tonne-kilometres, which is 2.3 times greater than rail transport. In addition, it is known that each tonne of freight moved by rail reduces carbon emissions by 76% in comparison with road transport, and a freight train may shift 43–76 HGVs from the roads (Department for Transport, 2016). Calculated emissions for airfreight transport are 71,429 tonnes per 1,000 net tonne-kilometres. Such a distinction could be caused by the small size of the freight and the high emissions from aircraft engines. This data once again confirms that air transport is significantly different from land transport, and with large ‘emissions per unit of goods moved’, it contributes the largest share of carbon emissions.
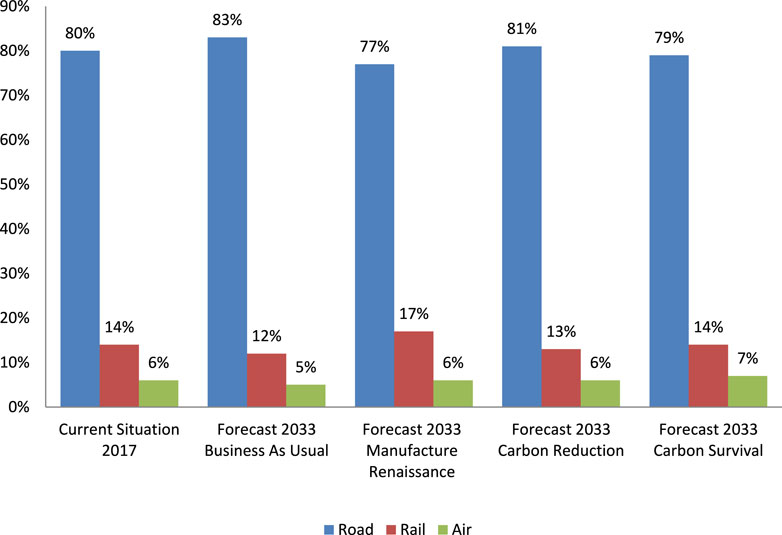
FIGURE 6. Emissions of carbon dioxide.
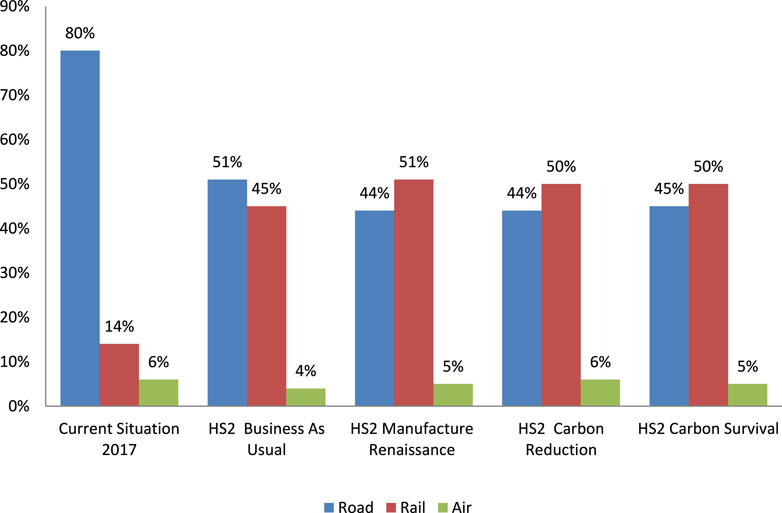
FIGURE 7. Emissions of carbon dioxide HS2 for different situations.
It is carbon dioxide and other types of emissions discharged by transport; therefore, future research could be improved by other available data analysis. Also, the potential effect of alternative energy sources, electric engines, and new technologies could be considered and the environmental impact for those cases analysed.
The data used in Supplementary Appendix S1 can be helpful in terms of determining the performance metrics concerning the level, i.e. strategic, tactical and operational. The financial and non-financial metrics provided against the performance metrics will help the project determine the importance and type. In this manner, the determination of risk mitigation strategies would be more effective as the company would already know the intensity of each performance metric.
Conclusion
This study is the world's first to investigate air-rail-road freight transportation and logistics to determine the possible effect of the HS2 project supply chains. The overall results indicate favourable but slight changes with a high potential for improvement. In particular, the capacity evaluation points out the growth of rail freight transportation from 5% to 14–16%, which could contribute to a decrease in road congestion, whereas the environmental effect, evaluated in carbon emissions, reveals a 17–19% reduction. Apart from the capacity evaluation and the environmental effect, economic factors should not be ignored. Airfreight represents the most expensive loop for freight transportation. Information is derived by comparison of the data from government reports and industry forecasts. To identify methods for supply chain analysis, relevant studies are considered, and a framework for performance measurement is chosen as the appropriate investigation approach. Alterations in performance do not seem directly linked to the HS2 railway construction and are associated with infrastructure and technological development. The research demonstrates that air cargo transportation does not appear to be noticeably affected by land freight haulages. HS2 has been presented to society as a project that could bring many benefits, but the research outcomes indicate that some of the advantages are questionable and may not justify those high expenditures. In terms of environmental impacts analysis, it has been analysed that HS2 shows smaller in case of no shift of freight from road to rail in all strategies. Moreover, there are also various types of emissions discharged by transportation. Therefore, there is a significant gap in identifying other variables that impact this emission. The impacts of alternative energy sources, such as electric engines, implementation of new technologies, and changes in the requirements should also be considered in conducting an in-depth analysis. There is a limitation to the research presented herein that only three modes of freight transport are considered. Therefore, it is suggested for future researchers to consider other transportation sources that would help them provide more significant findings concerning freight transportation.
Despite all the results presented, a possible effect of the HS2 construction could be evaluated by the utilisation of various approaches and additional data analysis. There are various modes of transport, such as LGV and waterborne, which occupy a share of freight haulage and could be considered. A survey of players from key industries in the United Kingdom could be executed to identify their vision of issues and uncertainties related to HS2. It is important to consider the possible effects of new technologies and the development of alternative energy sources. The method used in this research could be applied to evaluate the impact of a new transport project construction. Results and data from this study could also be utilised in future research on HS2. In addition to this, the construction of HS2 will also accompany the development of a transport hub and stimulate new logistics centres that can directly or indirectly impact the planning phase of the companies. However, the development of a reliable and effective transportation system and warehouse units can allow the increase in inventory turnover, which can positively contribute to the profitability and flexibility of the organisation. However, in terms of performance measurement, the research has examined that freight shifting from road to rail may positively impact the haulage industry and reduce congestion on the roads. There is a significant gap that has been investigated between the share of railway freight and road transportation. Therefore, the performance of rail freight transportation has a significant potential to solve overall effectiveness, empty running and load on railway carriages, however, to resolve such complexities and challenges, there is a need for significant information technology development and implement modern management techniques.
In terms of analysing the reasons for the construction of HS2 is to shift freight haulage from road transportation to rail transportation. In this way, the research study of Gunasekaran et al. (2001) has provided in-depth information related to supply chain analysis and relate it with performance management. In a similar manner, the research study of Chan (2003) also indicated that the analysis of supply chain has a significant connection with performance management and it improves the interaction of various parties because of significant supply chain analysis. While on the other hand, Yeo and Ren (2009) indicated that in terms of supply chain analysis, it is necessary to investigate the risks. However, in terms of performance measurement, Gunasekaran provided a list of non-financial and financial metrics. While Beamon (1998) also demonstrated that the metric for performance measurement evaluates the performance based on cost, flexibility, customers’ responsiveness and cost and activity time. Furthermore, Elshaikh, Jiao & Yang (2018) indicated that performance framework analysis provides an evaluation of HS2 construction in terms of metrics and basis. However, this approach could be improved by a deeper investigation of each element, and the possible impact could be expressed numerically. It also has been analysed that the sensitivity analysis provides useful insight in terms of predicting outcomes of the decision. However, in terms of talking about sustainability, it has become a critical issue for companies and even for the government. The research study of Cucchiella et al. (2012) highlighted key drivers for private sectors in the United Kingdom, such as customers’ requirements, reputational risks, organisational factors, functional issues and involvement of the stakeholders. In similar manners, Diabat and Govindan (2011) also indicated the significance of green supply chain management in terms of ensuring the implementation of effective strategies for sustainability. However, both the research studies have focused on different contexts. Therefore, these research studies have lack empirical evidence to investigate the actual importance of sustainability management. However, it also has been analysed that environmental carbon emission assessment demonstrates that values for the case HS2 would be less than if all the solutions studied do not include transfers of freight from road to train. But if real results are obtained in future, the impact might be even lower because study calculations are carried out based on current emissions from vehicles and no account was taken of the technological impact of new engines that function on alternative energy sources. The Capacity Evaluation enabled the “business as usual” strategy to be identified as carrying the biggest freight transport load with the smallest rail freight share; while the ‘renaissance manufacturing’ holds the lower freight level, with the largest rail freight capacity, due to the focus on international trading and advanced production technology.
Data Availability Statement
The raw data supporting the conclusion of this article will be made available by the authors, upon a reasonable request.
Author Contributions
RL, AS, and SK developed the concept; RL, AS conducts data collection, curation and data analysis; All authors contributed to the manuscript; SK reviewed the paper. All authors wrote the paper. All authors have read and agree to the published version of the manuscript.
Funding
The authors are grateful to the European Commission for the financial sponsorship of the H2020-RISE Project No. 691135 “RISEN: Rail Infrastructure Systems Engineering Network,” which enables a global research network that tackles the grand challenge in railway infrastructure resilience and advanced sensing in extreme environments (www.risen2rail.eu).
Conflict of Interest
The authors declare that the research was conducted in the absence of any commercial or financial relationships that could be construed as a potential conflict of interest.
Publisher’s Note
All claims expressed in this article are solely those of the authors and do not necessarily represent those of their affiliated organizations, or those of the publisher, the editors and the reviewers. Any product that may be evaluated in this article, or claim that may be made by its manufacturer, is not guaranteed or endorsed by the publisher.
References
Ahmed, S. M., Hayat, S., El Hillali, Y., and Rivenq, A. (2018). “Toward green Road Freight Transportation Trends: Truck Platoon Application,” in Proc. Int. Conf. Green Energy Technology (ICGET), Amsterdam, Netherlands, July 10–12, 2018, 129–136.
BBC.com (2020). HS2: When Will the Line Open and How Much Will it Cost?. Available at: https://www.bbc.com/news/uk-16473296 (Accessed June 9, 2021).
Beamon, B. M. (1999). Measuring Supply Chain Performance. Int. Jrnl Op Prod. Mnagemnt 19 (3), 275–292. doi:10.1108/01443579910249714
Beamon, B. M. (1998). Supply Chain Design and Analysis:. Int. J. Prod. Econ. 55 (3), 281–294. doi:10.1016/s0925-5273(98)00079-6
BEIS annual report and accounts 2016 to 2017 (2017). BEIS Annual Report and Accounts 2016 to 2017. Available at: https://www.gov.uk/government/publications/beis-annual-report-and-accounts-2016-to-2017 (Accessed Nov 13, 2020).
Bhagwat, R., and Sharma, M. K. (2007). Performance Measurement of Supply Chain Management: A Balanced Scorecard Approach. Comput. Ind. Eng. 53 (1), 43–62. doi:10.1016/j.cie.2007.04.001Available at: https://www.sciencedirect.com/science/article/pii/S0360835207000617 (Accessed November 12, 2020).
Blagojević, A., Vesković, S., Kasalica, S., Gojić, A., and Allamani, A. (2020). The Application of the Fuzzy AHP and DEA for Measuring the Efficiency of Freight Transport Railway Undertakings. Oper. Res. Eng. Sci. Theor. Appl. 3 (2), 1–23. doi:10.31181/oresta2003001b
Chan, F. T. S. (2003). Performance Measurement in a Supply Chain. Int. J. Adv. manufacturing Technol. 21 (7), 534–548. doi:10.1007/s001700300063
Christopher, M. (2005). Logistics and Supply Chain Management: Creating Value-Adding Networks. Harlow: Financial Times Prentice Hall. Available at: https://www.bookdepository.com/Logistics-Supply-Chain-Management-Martin-Christopher/9780273681762 (Accessed November 20, 2020).
Crainic, T. G., Gendreau, M., and Potvin, J.-Y. (2009). Intelligent Freight-Transportation Systems: Assessment and the Contribution of Operations Research. Transportation Res. C: Emerging Tech. 17 (6), 541–557. doi:10.1016/j.trc.2008.07.002
Crainic, T. G., Ricciardi, N., and Storchi, G. (2004). Advanced Freight Transportation Systems for Congested Urban Areas. Transportation Res. Part C: Emerging Tech. 12 (2), 119–137. doi:10.1016/j.trc.2004.07.002
Cucchiella, F., Koh, L., Walker, H., and Jones, N. (2012). Sustainable Supply Chain Management across the UK Private Sector. Supply Chain Manag. Int. J., 15–28. Available at: https://www.emerald.com/insight/content/doi/10.1108/13598541211212177/full/html (Accessed November 11, 2020).
Department for Transport (2018a). AVI0101: Air Traffic at UK Airports. Available at: https://www.gov.uk/government/statistical-data-sets/aviation-statistics-data-tables-avi (Accessed Nov 11, 2020).
Department for Transport (2018b). AVI0201: Main Outputs for UK Airlines by Type of Service: Time Series. Available at: https://www.gov.uk/government/statistical-data-sets/aviation-statistics-data-tables-avi (Accessed Nov 08, 2020).
Department for Transport (2018c). ENV0202: Carbon Dioxide Emissions by Transport Mode: United Kingdom. Available at: https://www.gov.uk/government/statistical-data-sets/energy-and-environment-data-tables-env (Accessed Oct 21, 2020).
Department for Transport (2017). High Speed Two from Concept to Reality. Available at: https://assets.publishing.service.gov.uk/government/uploads/system/uploads/attachment_data/file/629380/high-speed-two-from-concept-to-reality.pdf (Accessed October 25, 2020).
Department for Transport (2016). Rail Freight Strategy. Moving Britain Ahead. Available at: https://assets.publishing.service.gov.uk/government/uploads/system/uploads/attachment_data/file/552492/rail-freight-strategy.pdf (Accessed Nov 12, 2020).
Diabat, A., and Govindan, K. (2011). An Analysis of the Drivers Affecting the Implementation of green Supply Chain Management. Resour. Conservation Recycling 55 (6), 659–667. doi:10.1016/j.resconrec.2010.12.002
Dolgui, A., Ivanov, D., and Sokolov, B. (2018). Ripple Effect in the Supply Chain: Analysis and Recent Literature. Int. J. Prod. Res. 56 (1-2), 414–430. doi:10.1080/00207543.2017.1387680
Ehrenberger, S., Seum, S., Pregger, T., Simon, S., Knitschky, G., and Kugler, U. (2021). Land Transport Development in Three Integrated Scenarios for Germany - Technology Options, Energy Demand and Emissions. Transportation Res. D: Transport Environ. 90, 102669. doi:10.1016/j.trd.2020.102669
Elshaikh, A. E., Jiao, X., and Yang, S.-H. (2018). Performance Evaluation of Irrigation Projects: Theories, Methods, and Techniques. Agric. Water Manag. 203, 87–96. doi:10.1016/j.agwat.2018.02.034
Gharehbaghi, K., McManus, K., Robson, K., Paterno, D., and Myers, M. (2020). High-speed Rail Transportation: Key Factors for the Australian Eastern States. World Rev. Intermodal Transp. Res. 9 (2), 174–197. doi:10.1504/writr.2020.106926
Government Office for Science (2013). About Foresight. Available at: https://foresightprojects.blog.gov.uk/about-foresight-projects/(Accessed Nov 10, 2020).
Government Office for Science (2019a). The Future of Mobility. Available at: https://assets.publishing.service.gov.uk/government/uploads/system/uploads/attachment_data/file/780868/fu ture_of_mobility_final.pdf (Accessed October 31, 2020).
Government Office for Science (2019b). Understanding the UK Freight Transport System. Available at: https://assets.publishing.service.gov.uk/government/uploads/system/uploads/attachment_data/file/777781/fom_understanding_freight_transport_system.pdf (Accessed Nov 12, 2020).
Grazia Speranza, M. (2018). Trends in Transportation and Logistics. Eur. J. Oper. Res. 264 (3), 830–836. doi:10.1016/j.ejor.2016.08.032
Gunasekaran, A., Patel, C., and McGaughey, R. E. (2004). A Framework for Supply Chain Performance Measurement. Int. J. Prod. Econ. 87 (3), 333–347. doi:10.1016/j.ijpe.2003.08.003
Gunasekaran, A., Patel, C., and Tirtiroglu, E. (2001). Performance Measures and Metrics in a Supply Chain Environment. Int. Jrnl Op Prod. Mnagemnt 21 (1/2), 71–87. doi:10.1108/01443570110358468
Héctor, S., Martínez, S. M., and Moshe, G. (2012). The Accessibility Impact of a New High-Speed Rail Line in the UK – a Preliminary Analysis of Winners and Losers. J. Transport Geogr. 25, 105–114. doi:10.1016/j.jtrangeo.2011.09.004
High Speed 2 (2021). What Is HS2. Available at: https://www.hs2.org.uk/what-is-hs2/(Accessed June 1 2021)
High Speed 2 (2019). Why HS2?. Available at: https://www.hs2.org.uk/why/(Accessed November 14, 2020).
Kaewunruen, S., Sussman, J. M., and Matsumoto, A. (2016). Grand Challenges in Transportation and Transit Systems. Front. Built Environ. 2, 4. doi:10.3389/fbuil.2016.00004
Kamalahmadi, M., Shekarian, M., and Mellat Parast, M. (2021). The Impact of Flexibility and Redundancy on Improving Supply Chain Resilience to Disruptions. Int. J. Prod. Res., 1–29. doi:10.1080/00207543.2021.1883759
Lambert, D. M., and Pohlen, T. L. (2001). Supply Chain Metrics. Int. J. Logistics Manage. 12 (1), 1–19. doi:10.1108/09574090110806190
Larsson, J., and Larsson, L. (2020). Integration, Application and Importance of Collaboration in Sustainable Project Management. Sustainability 12 (2), 585. doi:10.3390/su12020585
Li, L., and Zhang, X. (2020). Integrated Optimization of Railway Freight Operation Planning and Pricing Based on Carbon Emission Reduction Policies. J. Clean. Prod. 263, 121316. doi:10.1016/j.jclepro.2020.121316
Mantoro, B. (2021). The Importance of Transportation in Knitting Indonesia's Diverse Communities Together. KnE Soc. Sci., 340–352. doi:10.18502/kss.v5i1.8297
Mentzer, J. T., DeWitt, W., Keebler, J. S., Min, S., Nix, N. W., Smith, C. D., et al. (2001). Defining Supply Chain Management. J. Business Logistics 22 (2), 1–25. doi:10.1002/j.2158-1592.2001.tb00001.x
National Infrastructure Commission (2019). National Infrastructure Commission: Future of Freight Demand. Available at: https://www.nic.org.uk/wp-content/uploads/Future-of-Freight_Future-of-Freight-Demand_MDS-Transmodal.pdf (Accessed November 15, 2020).
Neely, A., Gregory, M., and Platts, K. (1995). Performance Measurement System Design. Int. Jrnl Op Prod. Mnagemnt 15 (4), 80–116. doi:10.1108/01443579510083622
Office of Rail and Road (2019). Passenger and Freight Rail Performance 2018-19 Q4 Statistical Release. Available at: https://orr.gov.uk/data/assets/pdf_file/0004/41098/passenger-freight-performance-2018-19-q4.pdf (Accessed October 22, 2020).
Office of Rail and Road (2018). Rail Market Share. Available at: https://dataportal.orr.gov.uk/statistics/usage/freight-rail-usage/rail-market-share-table-1312/(Accessed Oct 25, 2020).
Pittman, R., Jandová, M., Król, M., Nekrasenko, L., and Paleta, T. (2020). The Effectiveness of EC Policies to Move Freight from Road to Rail: Evidence from CEE Grain Markets. Res. Transportation Business Manage. 37, 100482. doi:10.1016/j.rtbm.2020.100482
Raoufi, K., Haapala, K. R., Jackson, K. L., Kim, K.-Y., Kremer, G. E. O., and Psenka, C. E. (2017). Enabling Non-expert Sustainable Manufacturing Process and Supply Chain Analysis during the Early Product Design Phase. Proced. Manufacturing 10, 1097–1108. doi:10.1016/j.promfg.2017.07.100
Sadatsafavi, H., Kim, A., Anderson, S. D., and Bishop, P. (2017). “Using Scenario Planning for Identifying Major Future Trends and Their Implications for State Transportation Agencies,” in International Conference on Sustainable Infrastructure 2017, New York, October 26–28, 2017, 237–249. doi:10.1061/9780784481202.022
Shariat, M., Shariati, M., Madadi, A., and Wakil, K. (2018). Computational Lagrangian Multiplier Method by Using for Optimisation and Sensitivity Analysis of Rectangular Reinforced concrete Beams. Steel Compos. Struct. 29 (2), 243–256. doi:10.12989/scs.2018.29.2.243
Singh, P., Dulebenets, M. A., Pasha, J., Gonzalez, E. D. S., Lau, Y. Y., and Kampmann, R. (2021). Deployment of Autonomous Trains in Rail Transportation: Current Trends and Existing Challenges. IEEE Access, vol. 9, 91427–91461.
Stewart, G. (1995). Supply Chain Operations Reference Model (SCOR): the First Cross-Industry Framework for the Integrated Supply Chain Management. Logistics Inf. Manage. 10 (2), 62–67.
Stfalcon.com (2021). Top 8 Transportation Industry Trends in 2021. Available at: https://stfalcon.com/en/blog/post/transportation-industry-trends (Accessed June 1, 2021).
Suryanto, T., Haseeb, M., and Hartani, N. H. (2018). The Correlates of Developing green Supply Chain Management Practices: Firms Level Analysis in Malaysia. Int. J. Supply Chain Manage. 7 (5), 316.
Tamannaei, M., Zarei, H., and Aminzadegan, S. (2021). A Game-Theoretic Approach to the Freight Transportation Pricing Problem in the Presence of Intermodal Service Providers in a Competitive Market. Netw. Spat. Econ. 21 (1), 123–173. doi:10.1007/s11067-020-09511-8
Tarne, P., Lehmann, A., and Finkbeiner, M. (2018). A Comparison of Multi-Regional Input-Output Databases Regarding Transaction Structure and Supply Chain Analysis. J. Clean. Prod. 196, 1486–1500. doi:10.1016/j.jclepro.2018.06.082
The World Bank (2009). Air Freight: A Market Study with Implications for Landlocked Countries. Available at: https://www.worldbank.org/en/topic/transport/publication/air-freight-study (Accessed Oct 30, 2020).
Torre-Bastida, A. I., Del Ser, J., Laña, I., Ilardia, M., Bilbao, M. N., and Campos-Cordobés, S. (2018). Big Data for Transportation and Mobility: Recent Advances, Trends and Challenges. IET Intell. Transport Syst. 12 (8), 742–755. doi:10.1049/iet-its.2018.5188
Transport Statistics Great Britain: 2019 (2021). Transport Statistics Great Britain: 2019. Available at: https://www.gov.uk/government/statistics/transport-statistics-great-britain-2019 (Accessed June 1, 2021).
Tseng, Y. Y., Yue, W. L., and Taylor, M. A. (2005). The Role of Transportation in the Logistics Chain, Eastern Asia Society for Transportation Studies. Available at: http://www.dphu.org/uploads/attachements/books/books_2520_0.pdf (Accessed December 01, 2020).
Wilting, H. C., and van Oorschot, M. M. P. (2017). Quantifying Biodiversity Footprints of Dutch Economic Sectors: A Global Supply-Chain Analysis. J. Clean. Prod. 156, 194–202. doi:10.1016/j.jclepro.2017.04.066
Yang, L., and Zhang, L. Q. (2018). “November). Logistics Tracking Management System Based on Wireless Sensor Network,” in 2018 14th International Conference on Computational Intelligence and Security (CIS), Hangzhou, China, November 16–19, 2018 (IEEE), 473–475.
Yeo, K. T., and Ren, Y. (2009). Risk Management Capability Maturity Model for Complex Product Systems (CoPS) Projects. Syst. Engin. 12 (4), 275–294. doi:10.1002/sys.20123
York Aviation (2015). Implications for the Air Freight Sector of Different Airport Capacity Options Prepared for the Freight Transport Association and Transport for London Final Report. Available at: http://content.tfl.gov.uk/air-freight-implications-from-new-capacity.pdf (Accessed Nov 14, 2020).
Keywords: supply chain analysis, sensitivity, freight transportation, high speed rail, business resilience, logistics
Citation: Liu R, Stefanovich A and Kaewunruen S (2021) Sensitivity of a High-Speed Rail Development on Supply Chain and Logistics via Air-Rail-Road Freight Transportation. Front. Built Environ. 7:685884. doi: 10.3389/fbuil.2021.685884
Received: 26 March 2021; Accepted: 16 July 2021;
Published: 28 July 2021.
Edited by:
Ampol Karoonsoontawong, King Mongkut’s University of Technology Thonburi, ThailandReviewed by:
Sajjakaj Jomnonkwao, Suranaree University of Technology, ThailandDuangdao Watthanaklang, Nakhon Ratchasima Rajabhat University, Thailand
Copyright © 2021 Liu, Stefanovich and Kaewunruen. This is an open-access article distributed under the terms of the Creative Commons Attribution License (CC BY). The use, distribution or reproduction in other forums is permitted, provided the original author(s) and the copyright owner(s) are credited and that the original publication in this journal is cited, in accordance with accepted academic practice. No use, distribution or reproduction is permitted which does not comply with these terms.
*Correspondence: Sakdirat Kaewunruen, cy5rYWV3dW5ydWVuQGJoYW0uYWMudWs=