 Laura C. Brill
 Lily M. Wang
- 1Durham School of Architectural Engineering and Construction, University of Nebraska–Lincoln, Omaha, NE, United States
- 2Threshold Acoustics, Chicago, IL, United States
Sound levels from occupied classrooms have been gathered from 220 classrooms across four grade levels (3, 5, 8 and 11) over six school days each and processed with k-means clustering into speech and non-speech clusters. Three metrics describing the classroom acoustics, including the average daily A-weighted equivalent level for non-speech, the average daily difference between the A-weighted equivalent levels for speech and non-speech (a signal to noise ratio), and the mid-frequency averaged reverberation time, were analyzed against classroom-aggregated standardized reading and math achievement test scores, while controlling for classroom demographics including socioeconomic status. Interactions between the metrics and demographics were also tested. A statistically significant relationship was found between the average daily non-speech levels in classrooms and math test scores; higher daily non-speech levels were correlated with lower math test scores (p < 0.05). No statistically significant main effects of acoustic metrics were found on reading achievement. There were some significant differences and an interaction found between grades, but these may be due to uneven sample distributions as there were fewer grade 8 and 11 classrooms measured. Children learn in occupied classrooms, and the findings from this investigation based on data from occupied conditions suggest that designing for lower unoccupied sound levels can lead to occupied environments that are conducive to better student learning outcomes.
1 Introduction
Acoustic conditions in K-12 classrooms affect the clarity and ease of verbal communication and consequently are expected to impact learning, language development, and development of cognitive skills in children (Leibold, 2017). As reviewed in this section, previous work has demonstrated how conditions with higher noise levels and/or excessive reverberation are related to worse performance by primary and secondary school students on speech intelligibility, reading or listening comprehension, short-term memory, and assorted reasoning tasks. Poor acoustic conditions have also been shown to lead to increased response times and greater listening effort. Fewer studies, though, have correlated in situ classroom acoustic conditions with student achievement on a large scale. This paper presents the results of such an investigation where acoustic metrics compiled over multiple school days from 220 K-12 classrooms are correlated with classroom-aggregated student achievement scores in math and reading taken at the end of the school year, controlling for student demographics such as socioeconomic status.
Earlier studies on classroom acoustics focused on determining preferable conditions and criteria for optimizing speech communication, often by measuring speech intelligibility in terms of the percent of words, phrases, or sentences recognized correctly (Picard and Bradley, 2001; Yang and Bradley, 2009; Wróblewski et al., 2012). Research conducted by Bistafa and Bradley (2000) suggested that ideal maximum classroom background noise levels are 25 dB below the voice level from 1 m away from the talker whereas acceptable classroom background noise levels are 20 dB below the voice level under the same conditions. From combining ideal maximum background noise levels and recommended reverberation times, they suggested a minimum signal-to-noise (SNR) of 15 dB for classrooms. Later Bradley and Sato (2008) revisited these conclusions and suggested that a 15 dB SNR might not be sufficient for younger students who need a higher level of speech intelligibility. Neuman et al. (2010) confirmed that younger children require higher SNR to perform at the same levels as those who are older.
Based on the accumulated body of knowledge particularly around the desired minimum SNR, the ANSI S12.60 standard gives guidance that the greatest 1-h average A-weighted background noise level measured in an unoccupied classroom with mechanical systems on should not exceed 35 dBA for a single mode mechanical system or 37 dBA for multiple mode mechanical systems with “multiple stages of cooling or heating, multiple or variable fan speeds, or ventilation only modes”. Additionally, the reverberation times at the mid-frequency octave bands of 500, 1,000, and 2,000 Hz should not exceed 0.6 s for classrooms smaller than 283 m3 (10,000 ft3). Previous research has demonstrated that the reverberation time recommendations are more easily met in classrooms than the unoccupied background noise level guidelines (Knecht et al., 2002; Shield and Dockrell, 2004; Nelson et al., 2007; Astolfi and Pellerey, 2008; Ronsse and Wang, 2010, 2013; Shield et al., 2015).
An underlying assumption has been that improving speech intelligibility leads to improved student learning and achievement; however, few studies prior to the ANSI standard’s introduction in 2002 showed a direct link between classroom acoustics and student learning outcomes. Bronzaft and McCarthy (1975) and Bronzaft (1981) are two early studies that showed statistically significant lower results of annual reading achievement tests in classrooms more heavily exposed to noise from passing trains. Investigations since the publication of ANSI S12.60 have provided more evidence that poor classroom acoustic conditions correlate to worse performance on tasks that require more comprehension than the recognition of words, phrases, or sentences. Studies have investigated children’s reading or listening comprehension performance, in which pupils demonstrate their understanding of meaning from cues (Klatte et al., 2010b; Valente et al., 2012; Klatte et al., 2013; Lewis et al., 2014; Klatte et al., 2017; Rudner et al., 2018; Connolly et al., 2019; Prodi et al., 2019). Some of these gathered and compared results from both speech recognition and speech comprehension tasks. For example, Klatte et al. (2010b) found that the performance of first and third graders on listening comprehension tasks was worse than on speech perception tests when exposed to background speech. Valente et al. (2012) also found that increasing background noise or reverberation resulted in worse performance on comprehension tasks but had minimal effect on sentence recognition tasks.
As found in adults (Kryter, 1985; Jones and Broadbent, 1998; Tiller et al., 2010; Lee et al., 2017), higher noise levels and/or excessive reverberation have been related to decreased performance also by children on various other tasks including short-term memory (Klatte et al., 2010a), basic math (Ljung et al., 2009; Caviola et al., 2021), and categorization or validation tasks (Meinhardt-Injac et al., 2015). In some of these studies, the students’ response times were captured and shown to be longer under worse acoustic conditions (Meinhardt-Injac et al., 2015; Puglisi et al., 2018; Connolly et al., 2019; Prodi et al., 2019). Furthermore, the relation between louder and/or more reverberant conditions and task performance is usually more strongly negative for younger students compared to older students or adults (ANSI, 2010; Klatte et al., 2010b; Neuman et al., 2010; Valente et al., 2012; Wróblewski et al., 2012; Klatte et al., 2013; Meinhardt-Injac et al., 2015; Prodi et al., 2019; Caviola et al., 2021), although a few studies have reported stronger effects on older students in their samples (Shield and Dockrell, 2008; Connolly et al., 2019). Negative effects are expected to be more pronounced for pupils with hearing impairments (McCreery et al., 2019) or for persons communicating in a non-native-language (Nelson et al., 2005; Cooke and Lecumberri, 2012). Peng and Wang found that adult speech comprehension performance was significantly worse (Peng and Wang, 2016) and listening effort significantly greater (Peng and Wang, 2019) for non-native English listeners compared to native English listeners when the background noise levels were above 48 dBA or the reverberation times were greater than 0.6 s.
The vast majority of studies reviewed above were conducted under controlled conditions during which subjects were asked to complete tasks over a short period of time (typically less than 1 h) while listening to auralizations presented via headphones in labs or in rooms with noise added via loudspeakers. Only a few studies have investigated student learning outcomes by considering standardized student achievement test scores. In the multi-national RANCH project, Stansfeld et al. (2005) found that exposure of schools to higher aircraft noise levels correlated with lower reading comprehension scores for students aged 9–10 years. The study controlled for student socioeconomic status (SES) in the statistical models. Math test scores were not analyzed in the investigation, though.
Rather than at school-level, classroom-level analyses of standardized test results for literacy, math, and science at grades 2 and 6 were reported by Shield and Dockrell (2008), due to external and internal noise sources found commonly at primary schools. Besides corroborating effects of external road traffic noise, they found statistically significant relationships between grade 2 math scores and grade 6 English scores with background noise levels in occupied and unoccupied classrooms; higher noise levels correlated with lower test scores. Many of the relationships lost statistical significance when SES factors were included, though. This may be due to the fact that the number of classrooms for which internal sound levels were available was not large (n = 16 for occupied, n = 14 for unoccupied).
Ronsse and Wang (2010) investigated 58 classrooms across 14 elementary schools within a school district located in Council Bluffs, Iowa, United States, and found that higher unoccupied background noise levels correlated with lower classroom-aggregated student achievement scores in reading, while controlling for SES. They analyzed a second set of measurements from another school district near Omaha, Nebraska, United States, surveying grade 3 (n = 34) and grade 5 classrooms (n = 33) at 14 schools. The findings were similar in that higher unoccupied background noise levels correlated with lower student achievement scores in reading and language subject areas, but the relationship lost significance when controlling for SES (Ronsse and Wang, 2013). In both of those studies, no statistically significant results were found with math scores, nor were any sound levels measured in occupied classrooms.
This paper presents analyses of standardized achievement test results in the math and reading areas across a larger number of classrooms (n = 220) from five different school districts in Iowa and Nebraska. Both primary and secondary school classrooms have been surveyed, specifically at grades 3, 5, 8 and 11. Sound levels were logged in the occupied classrooms over six complete school days, three times seasonally (fall, winter, spring) throughout an academic year. The logged levels have been processed into metrics that describe the classroom acoustic conditions, such as when speech was occurring, when it was not, and the experienced SNR. Reverberation times have also been calculated from impulse response measurements made in the unoccupied classrooms. Details on the assorted calculated metrics may be found in Wang and Brill (2021). Herein, results from statistically analyzing relationships between the classroom-aggregated acoustic metrics and student achievement data, while controlling for SES and other student demographics, are presented to understand better how classroom acoustic conditions relate to student achievement.
2 Materials and Methods
In-situ indoor environmental measurements capturing information about acoustics, lighting, thermal comfort, and indoor air quality were conducted in 220 K-12 classrooms, 110 of which were measured during the 2015–2016 academic year and another 110 during 2016–2017. The sample was composed of 3rd, 5th, 8th, and 11th grade classrooms in 40 schools from five school districts in Iowa and Nebraska (Table 1). These classrooms represent third and fifth grade homeroom classrooms where both math and language arts are taught and subject specific eighth and eleventh grade classrooms to align with the achievement data collected. This paper isolates the acoustic measurements and achievement data; more details on the complete set of indoor environmental measurements may be found in Kuhlenengel et al. (2017) and Kabirikopaei et al. (2019).
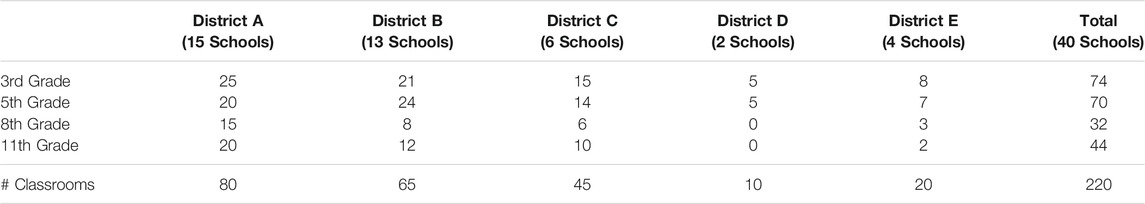
TABLE 1. Number of sampled classrooms, sorted by grade level and school district.
The measured classrooms ranged in volume from 101 to 331 m3, with a mean volume of 201 m3 and standard deviation of 32.4 m3. Classrooms were measured with 22 student occupants on average, ranging from 11 to 32 with a standard deviation of 2.7 pupils. Seven of the classrooms were in portable buildings; none were open plan designs. Classrooms were furnished, and their surface materials were typically gypsum board or concrete-masonry unit walls, thin carpet on floors, acoustical tiles on ceilings, and at least one exterior window.
Equivalent sound levels were measured with two BSWA 309 Type 2/Class 2 sound levels meters. The levels were recorded every 10 seconds with an integration period of 10 seconds. The two sound level meters were placed in locations representative of the teaching position (i.e., in the front of the classroom) and the farthest listening position. The meter at the teaching position was at work plane height (80 cm) enclosed in an open-air wire container along with other equipment. The second meter was attached to the ceiling above the farthest listening position to minimize its distraction to students in class. All meters were placed away from noise-making equipment like projector fans or ventilation outlets/inlets and operated on external battery packs. Meters were deployed in the classroom before school started and then collected the next day after school dismissal, capturing approximately 36 h of measurements. The logging measurements were repeated three times during one academic year in an attempt to capture seasonal differences resulting in measurements of sound levels over six school days. Meters were placed in the same locations for all three sets of measurements to ensure comparability.
Impulse responses were measured in each classroom under unoccupied conditions using the software EASERA, a Larson Davis 831 sound level meter, and an omnidirectional Larson Davis dodecahedron loudspeaker. The loudspeaker was positioned in the front of the classroom where an instructor would typically lead class, at least 1 m away from reflective surfaces. Two receiver positions were used: one at a seated student’s ear height in the middle of the classroom, and another at a seated student’s ear height at the farthest listening position. The swept sine method in EASERA was used to acquire the impulse response, with sweeps that were at least 1.2 s long and eight repetitions; EASERA then calculated assorted room acoustic metrics, such as the reverberation time (T20) in each octave band, following ISO 3382-2 (ISO, 2008).
For each measured classroom, the school districts provided the following demographic information aggregated at the classroom level: the percent of students in each classroom who 1) received free or reduced-price lunches (referred to as %FRL), 2) were designated as gifted learners (referred to as %Gifted), and 3) were designated as special education learners (referred to as %SPED). The first of these is commonly used as an indicator of socioeconomic status, which has been shown to have significant relation to student achievement, while a higher percentage of the latter two student categories in a classroom is likely to also impact test scores. Consequently these three demographic variables are controlled for in the statistical analyses. School districts in the United States are required to report the number of gifted pupils and the number of special education learners, but the specific definitions of these categories are often left up to the districts to decide. In the school districts that participated in this study, gifted students were typically defined as performing in the top 5% of their grade, while special education students were defined as those whose learning abilities are discrepant from their peers, often falling in identified categories outlined in the United States Individuals with Disabilities Education Act (US Department of Education, 2015). Figures 1–3 present box-plots of the classroom demographic values across the analyzed sample, where the median, 25th, and 75th percentiles are marked by the box, and the whiskers extend to the minimum and maximum data points.
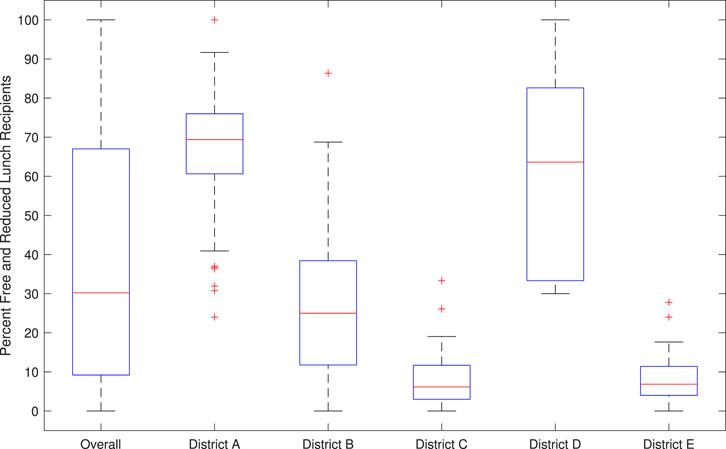
FIGURE 1. Box plot of the percent of students in the measured classrooms (n = 216) receiving free or reduced-price lunches, shown by district.

FIGURE 2. Box plot of the percent of students in the measured classrooms (n = 216) designated as gifted learners, shown by district.
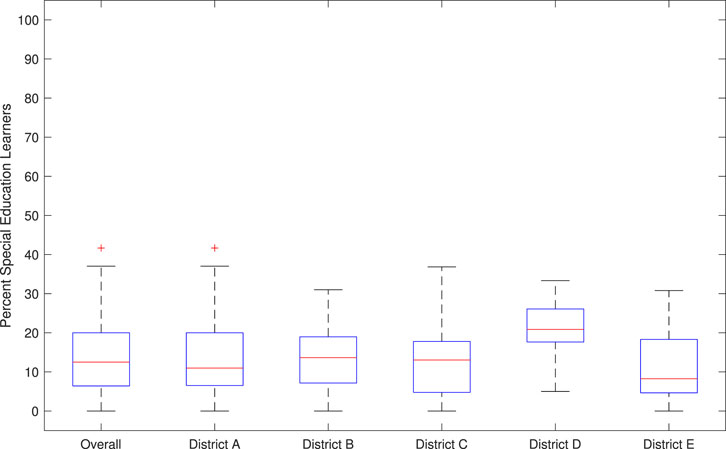
FIGURE 3. Box plot of the percent of students in the measured classrooms (n = 216) designated as special education learners, shown by district.
Students in each classroom completed state-wide achievement tests typically in April each year. For this study, achievement was quantified by the results from this state-wide standardized testing [either the Nebraska State Accountability (NeSA) assessment or the Iowa Test of Basic Skills (ITBS)] and not by assessments designed and administered by the researchers. These assessments measure proficiency in fundamental subject areas including math and reading, as compared to state and national standards, and are typically administered towards the end of the academic year in the classrooms in which students receive instruction. The school districts provided results on math achievement and reading achievement in terms of a classroom-level aggregate national percentile rank for each classroom. Districts scored the tests, converted the raw scores to standard scores based on state standards, and then converted the standard scores to a national percentile rank. Figures 4, 5 show box-plots of math achievement scores and reading achievement scores, respectively, by grade. The total sample size for the statistical analyses on math achievement was n = 178 and the total sample size for the statistical analyses on reading achievement was n = 180. The samples include all third and fifth grade classrooms as both subjects were taught in the same room, as well as the specific eighth and eleventh grade classrooms where math or English classes were held.
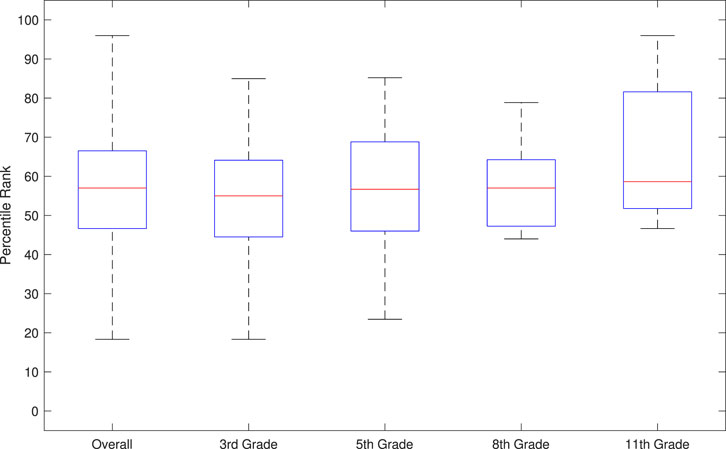
FIGURE 4. Box plot of the math achievement scores in terms of percentile ranks, averaged for each classroom (n = 178), shown by grade.

FIGURE 5. Box plot of the reading achievement scores in terms of percentile ranks, averaged for each classroom (n = 180), shown by grade.
This project was reviewed by the University of Nebraska—Lincoln’s Institutional Review Board, which determined that individual informed consent was not required as data were provided and analyzed at a classroom-aggregated level with no personally identifiable information.
2.1 Data Analysis
Four classrooms out of the 220 measured were not included in the analyzed sample set. Two of the high school classrooms that had been identified by our school district partners as math classrooms before the start of the school year were not included because they were reassigned to science classrooms which did not correspond to the assessment subjects. Analysis of Mahalanobis distances was used to identify other outliers in the data set, resulting in the exclusion of two other classrooms that were dedicated to special education learners.
Each sound level meter reported A, B, C, and Z-weighted equivalent levels at an interval of every 10 s, in addition to equivalent octave band levels with center frequencies ranging from 32 Hz to 8 kHz. Because the focus of this investigation is on sound levels experienced during the school day, only sound level data recorded during published academic hours for each school were used in the following analyses. An energy-average of the data from the two sound level meters within each classroom was taken at every time interval across the school day, and the energy-averaged data were then used to calculate assorted acoustic metrics for each school day. As with any data set and project of this size, there were occasional missing data, equipment malfunctions, and operator mistakes. Importing routines were programmed to create a log of missing files and missing data, as well as to flag possibly spurious data to be removed from subsequent averaging. Of the 216 classrooms, 83% had data logged over six complete school days on both sound level meters in the classroom, while 15% had missing data on one meter impacting one to 2 days, 0.5% had missing data on one meter impacting three to 4 days, and none had missing data on one meter impacting five to 6 days. In all cases, there were at least data logged on one meter over the six school days.
K-means clustering is an unsupervised statistical learning technique that partitions data into K number of clusters by minimizing the distance between observations within a cluster while maximizing the distance between the clusters (Alpaydin, 2020). For this study, k-means clustering was performed on the nine-dimensional octave band equivalent levels for each observation to provide more information for the partitioning. K = 2 was chosen to separate the recorded sound levels into two categories; Figure 6 graphs box plots of the two clusters, from which it is clear that one represents observations containing high levels across speech frequencies while the other does not. Wang and Brill (2021) provides more detail on the k-means clustering application to the logged data and how the clustered groups more accurately estimate speech levels and non-speech levels in the occupied classrooms than other metrics previously presented in the literature, such as from applying Gaussian mixture modeling or from daily equivalent and statistical levels. These clustered groups were then utilized to calculate the various metrics utilized in the statistical analysis.
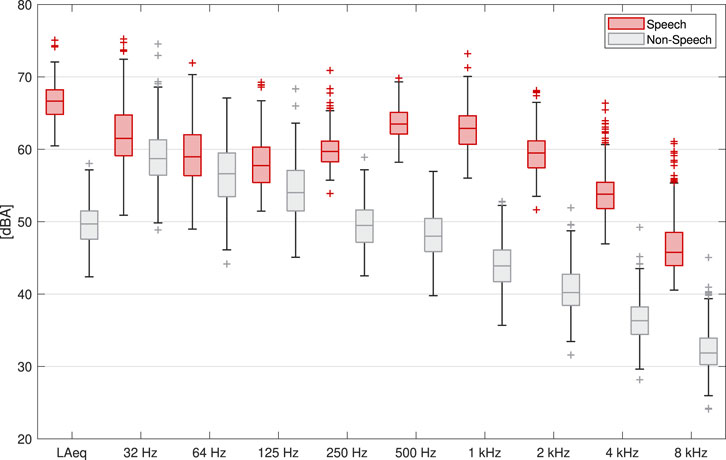
FIGURE 6. Box plots of the spectra across the two data clusters obtained from k-means clustering, demonstrating that one cluster includes those data with higher levels in speech frequencies while the other does not.
Assorted acoustic metrics were calculated to assess the acoustic conditions of the classrooms in this investigation, including equivalent and percentile levels across a full occupied day, equivalent and percentile levels for the speech cluster and the non-speech cluster over the school day, the percent of time that speech or non-speech levels exceeded certain values in a day, assorted metrics over octave bands or frequency ranges, and more (Wang and Brill, 2021). Many of the metrics are strongly correlated with correlation coefficients above 0.8 and should consequently not be included together in a statistical model. Preliminary studies led the research team to use three main acoustic metrics in the statistical model: 1) a quantifier of the daily non-speech levels which serves as an estimate of the occupied ambient noise levels, taken to be the A-weighted equivalent sound level of the daily non-speech data (LAeqN), averaged over the six measured school days for each classroom; 2) a quantifier of the daily SNR between the speech and non-speech levels in the classroom, taken to be the daily difference between the A-weighted equivalent sound level of the daily speech data (LAeqS) and of the daily non-speech data (LAeqN) which will be labeled as “SNR” for the remainder of this paper, averaged over the six measured school days; and 3) a quantifier for room reverberance, taken to be the unoccupied mid-frequency reverberation time (T20m) averaged across the 500 Hz, 1 kHz, and 2 kHz octave bands. These three metrics align somewhat with the ANSI S12.60 classroom acoustics standard (ANSI, 2010), as the standard sets guidelines for unoccupied background noise levels and the reverberation times in mid-frequency octave bands, in the hopes of achieving an acceptable SNR of at least 15 dB in occupied conditions, as reported in this paper. Notably, the daily averages of a classroom’s speech levels, non-speech levels, and SNR were not found to vary greatly across the six measured school days measured, with average standard deviations of less than 2 dBA, and 3 dBA respectively (Wang and Brill, 2021).
2.2 Statistical Analysis
Descriptive statistics for the demographic variables, acoustic metrics, and student test outcomes are shown in Table 2. All of the variables follow a normal distribution except for the demographic ones. Histograms and other analyses of the measured LAeqS, LAeqN, and SNR are provided in Wang and Brill (2021). Pearson’s correlation coefficients between the acoustic metrics to be used as predictors in the regression model are provided in Table 3. In all statistical analyses presented in this paper, a statistically significant finding is one in which the p-value was less than 0.05. As expected, the average daily SNR significantly correlates to the average daily LAeqS and LAeqN levels, with correlation coefficients R = 0.46 and R = −0.66 respectively; this is understandable as the daily calculation of SNR is taken as the difference between the other two’s daily values. Note that between SNR and LAeqN, the correlation coefficient is negative and larger in magnitude than with LAeqS; as the average daily non-speech levels in classrooms increase, the average daily SNR that students experience decreases. The reverberation time T20m is only significantly correlated to LAeqN with a relatively low R = 0.14; note that the range of T20m in the sample was 0.29–0.84 s (Table 2), though, with the majority of rooms meeting ANSI S12.60 guidelines (Wang and Brill, 2021).
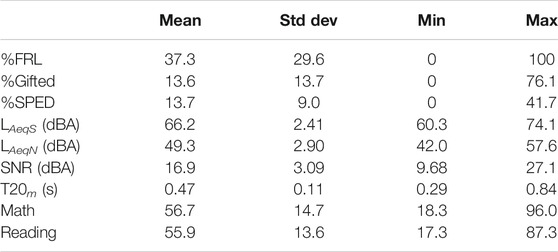
TABLE 2. Descriptive statistics of the variables in this investigation. These include classroom demographics: the percent of students receiving free or reduced-price lunch (%FRL), the percent of gifted students (%Gifted), the percent of special education students (%SPED); acoustic metrics: the A-weighted equivalent levels of the speech (LAeqS) and non-speech clusters (LAeqN), the SNR taken as their daily difference, and the mid-frequency averaged reverberation time (T20m); and the test score outcomes in math and reading, given in terms of percentile ranks.
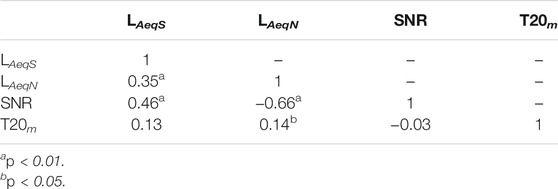
TABLE 3. Correlations between the input acoustic variables in this investigation: LAeqS, LAeqN, SNR, T20m.
The software R 4.0.2 with the Lavaan package version 0.6-7 (Rosseel, 2012) was used to conduct the multivariate regression analyses of acoustic metrics on math and reading scores, while controlling for classroom demographics. Outcome residuals for math and reading scores were allowed to covary, necessitating a multivariate model. The three demographic descriptors (%FRL, %Gifted, and %SPED) as well as grade level were used as covariates. Non-independence of classrooms within schools was accounted for by applying robust cluster standard errors. First, interactions were explored by considering each demographic variable one at a time in separate sub-models. In the sub-models, demographic variables were permitted to moderate association of an acoustic metric and its effect on math or reading scores. Statistically significant interactions from the sub-models were then retained in the full model.
3 Results
When exploring which interactions with demographic variables should be retained in the full model, four group differences were found to be statistically significant from using the Wald test: 1) LAeqN and grade level on math scores, 2) SNR and grade level on math scores, 3) SNR and grade level on reading scores, and 4) SNR and the percent of students receiving free or reduced-price lunch on math scores. These interactions were then probed in the full multivariate regression model. The SNR and %FRL interaction was not retained in the full model as it did not reach statistical significance. Final regression results on the math and reading scores are shown respectively in Tables 4, 5.
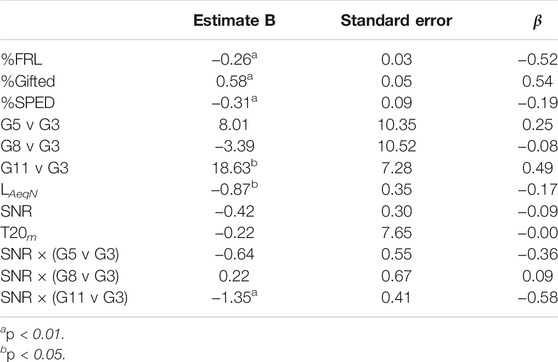
TABLE 4. Results from the multivariate regression model (N = 178) with acoustic metrics as predictors, classroom demographic variables as covariates, and math test scores as outcomes. Grade results shown are against grade 3.
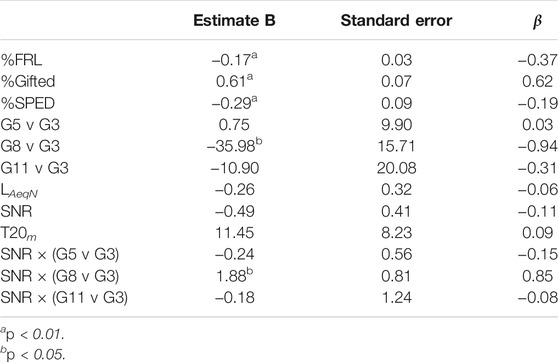
TABLE 5. Results from the multivariate regression model (N = 180) with acoustic metrics as predictors, classroom demographic variables as covariates, and reading test scores as outcomes. Grade results shown are against grade 3.
As expected, the classroom demographic variables had statistically significant relationships with the math and reading test outcomes. Higher %FRL and higher %SPED values correlated with lower test scores, while higher %Gifted correlated with higher test scores. Controlling for these, the results indicate only one statistically significant main effect between LAeqN and math test scores; higher daily non-speech levels in a classroom correlated with lower math test scores. No other main effects between acoustic predictors and math or reading test outcomes reached statistical significance.
The entries in Tables 4, 5 pertaining to grade compare a higher grade’s results against those from grade 3. For math scores, only grade 11 indicates a significant difference from grade 3; Figure 4 illustrates that the distribution of grade 11 math scores extended higher and not as low in range as grade 3 math scores. This difference in distribution likely plays a role in the statistically significant interaction between SNR and grade 11 on math scores. As grade 11 did not have many low test scores, possibly due to the sample including less grade 11 classrooms, the authors suggest that this significant interaction between SNR and grade 11 is likely not indicative of a true relationship. Similarly for reading scores, grade 8 shows a statistically different result from grade 3, as well as an interaction with SNR. This result is again likely due to the distribution of grade 8 reading scores being quite different from that of grade 3 (Figure 5), which could be due to the lower number of grade 8 classrooms in the sample.
The R2 values associated with the regression results presented above are 0.644 for the math scores and 0.536 for the reading scores. When running the model without acoustic predictors but with all other demographic variables, the R2 values are 0.618 for the math results and 0.506 for the reading results. A comparison between these two models (without and with acoustic variables) indicates that the overall models are different at a statistically significant level (p < 0.01), as well as specifically for the math achievement prediction (χ2 = 20.47, df = 6, p < 0.01) and the reading achievement prediction (χ2 = 13.04, df = 6, p < 0.05). Adding in the acoustic variables did result in a model that accounted for more variance in the results at a statistically significant level.
4 Discussion
A statistically significant relationship between the average daily non-speech levels in occupied classrooms and math test scores has been found from multivariate regression analysis based on data from 178 classrooms across four grade levels (3, 5, 8 and 11), with controls for classroom demographics. Higher daily non-speech levels are correlated with lower math test scores. This is the first time to the authors’ knowledge that a significant relationship between noise levels in classrooms and math achievement scores has been reported. Previous investigations involving standardized test scores have instead found significant relationship between higher noise levels and lower reading achievement scores. One of those studies did not report on any math scores (Stansfeld et al., 2005). The others (Shield and Dockrell, 2008; Ronsse and Wang, 2010, 2013) included only primary school students, had much smaller sample sizes (less than 70 classrooms) than the current paper, and found that some relationships lost significance when SES factors were included.
There has been other evidence in the literature, reporting effects of noise on children’s performance of math tasks. Ljung et al. (2009) ran tests that included basic math and math reasoning tasks on 187 12 or 13 year old pupils under different noise conditions within a classroom, and found that the road traffic noise condition did impair performance on the math task compared to the other noise conditions. Meinhardt-Injac et al. (2015) asked 21 second-graders and 25 sixth-graders to complete tasks including validations of math problem, while listening to different noise conditions over headphones; younger pupils did worse on the math validation task when exposed to irrelevant speech but not to classroom noise without speech. More recently, Caviola et al. (2021) reviewed the different skills and cognitive components related to math performance, when reporting on their study wherein 162 11–13 year olds were asked to complete a variety of math tasks under different noise conditions. Their results show that the younger pupils did perform worse when exposed to classroom noise than under quiet or traffic noise conditions, although as the task difficulty increased, the effect faded. While these previous studies have presented performance on short-term math tasks, rather than on standardized math tests that may be more indicative of math learning outcomes, they do support the finding in this paper of a relationship between non-speech levels in occupied classrooms and math achievement.
In the presented regression analyses, LAeqN is the metric that accounts for the most variance in the math test scores; LAeqN and SNR are significantly correlated (Table 3) with R = −0.66, so in these models LAeqN is accounting for most of the variance to which SNR may also have contributed. An interpretation of this is as follows: lower non-speech levels in occupied classrooms correlate with higher standardized math test scores. Those lower non-speech levels also significantly correlate with higher SNR conditions, which has been an overall goal of classroom acoustic design standards like ANSI S12.60 (ANSI, 2010). Consequently, designing classrooms for lower unoccupied noise levels that lead to lower non-speech levels in occupied classrooms and higher SNR in classrooms is recommended.
As Table 3 shows, there is a statistically significant correlation between the speech and non-speech levels whereby higher speech levels are correlated with higher non-speech levels (r = 0.35, p < 0.01). Linear regression analysis finds the relationship to show 0.29 dBA increase in speech levels for every 1 dBA increase in non-speech levels, but there is a lot of variance in speech levels that are not accounted for by the non-speech levels, due possibly for example to talker variability or vocal strength (Wang and Brill, 2021). Other recent studies have reported Lombard effects measured at the talker ranging from a +0.51 to +0.72 dBA increase in speech levels for every +1 dBA increase in noise levels (Sato and Bradley, 2008; Bottalico and Astolfi, 2012; Sarantopoulos et al., 2014). In applying any of these Lombard effect slopes, increasing noise levels results in lower SNR because speech levels increase in less than a one to one ratio.
The results in the presented analyses are interpreted to represent the chronic or accumulated effects of noise. Noise levels were not measured in the test rooms at the time students were taking these assessments, so it is not possible for this study to base any interpretations on the acute effect of noise. That does not mean that acute effects do not exist. The large number of classrooms was intentionally chosen to distill the chronic effects rather than the acute effects.
Grade has been used as a proxy for student age in this paper, and other studies have shown more strongly negative relationships between acoustic conditions and task performance for younger students compared to older students (Klatte et al., 2010b; Neuman et al., 2010; Valente et al., 2012; Wróblewski et al., 2012; Meinhardt-Injac et al., 2015; Prodi et al., 2019; Caviola et al., 2021). That conclusion cannot be made based on the regression models presented here. More investigations that span the grades covered in this investigation and both math and reading achievement test scores are needed.
5 Conclusion and Future Work
Regression models have been run relating acoustic data gathered from 216 classrooms across four grade levels (3, 5, 8 and 11) with classroom-aggregated standardized math and reading test scores, while controlling for classroom demographics including socioeconomic status. A statistically significant relationship was found between the average daily non-speech levels in classrooms and math test scores; higher daily non-speech levels were correlated with lower math test scores (p < 0.05). No statistically significant main effects of acoustic metrics were found on reading achievement. There were some significant differences and an interaction found between grades, but the authors believe that they are due to uneven sample distributions across grade as there were fewer grade 8 and 11 classrooms measured.
One limitation to the current investigation is that other classroom demographics were not available for inclusion, such as the percent of students in each classroom with hearing impairments or those learning in a non-native language, so it is unclear how other demographics may relate to the results. Further investigations that include such demographics is recommended. Also, this investigation has primarily been a correlational study; thus, one should interpret the results of the presented multivariate regression models with caution. Causation cannot be assumed without further investigations in which acoustic conditions are deliberately changed and the effect on student achievement scores assessed while controlling for other factors that can impact test scores. Future studies should work with school districts to test changes or manipulations aimed at lowering non-speech levels in classrooms to see if improved student test scores are achieved; refer for example to Bronzaft (1981) and Massonnié et al. (2020). Another idea for future study is to consider studying achievement at the level of individual students, rather than aggregated at the classroom level. The 220 classrooms measured in this study represent rooms in which more than 7,000 students learned. Investigating how an individual’s exposure to sound levels throughout their school day and in other indoor spaces they occupy (home, recreational facilities, etc.) is related to their learning outcomes, while controlling for that person’s demographics, may be difficult but worthwhile.
This is the first investigation to the authors’ knowledge that has shown a significant relationship between non-speech levels in occupied classrooms and math achievement scores. Unlike previous studies, no significance was found with reading scores, but the current study differs from earlier ones in that both primary and secondary classrooms were included and three classroom demographics (percent of students receiving free or reduced-price lunches, percent gifted, and percent special education) were used as covariates. Furthermore, the results are based on detailed sound level data logged across six school days per classroom over an academic year, thereby more effectively capturing occupied acoustic conditions experienced by students in the classrooms. The logged data were separated using k-means clustering in nine dimensions into one group representing when speech occurs and another when speech does not. The daily averages of a classroom’s speech levels, non-speech levels, and SNR did not vary greatly across the 6 days measured across three seasons in a school year, with standard deviations of less than 3 dBA typically. So while K-12 classrooms are complex environments in which different teaching modalities are used, ranging from single instructor to individual work to small group activities (Shield and Dockrell, 2004), the daily values of acoustic metrics were not found to vary greatly in this study for a specific classroom occupied by a consistent instructor. Having found a statistically significant correlation between the average daily occupied non-speech levels with math achievement is a step forward towards better evidence-based classroom acoustics design.
Indeed, better evidence-based design of classrooms as a whole requires that acoustic conditions be considered in balance with other indoor environmental conditions, such as indoor air quality, thermal, and lighting. How do the relationships presented here with acoustics vary when other measured environmental metrics are included? Researchers are looking into this, and additional work along those lines is recommended so that the school design community can prioritize evidence-based design aimed at benefiting human well-being and performance.
Data Availability Statement
The raw data supporting the conclusions of this article will be made available by the authors, without undue reservation.
Ethics Statement
The studies involving human participants were reviewed and approved by University of Nebraska—Lincoln Institutional Review Board. Written informed consent from the participants’ legal guardian/next of kin was not required to participate in this study in accordance with the national legislation and the institutional requirements.
Author Contributions
LW conceived and designed the overall project, secured funding, and oversaw data collection and analyses. LB managed the data collection, led work on data analyses, and proposed the application of k-means clustering to the logged sound level data. Both authors were involved with drafting and revising the manuscript.
Funding
This research was supported by the United States Environmental Protection Agency Grant Number R835633. Open access publication fees were covered by the University of Nebraska—Lincoln Durham School of Architectural Engineering and Construction.
Conflict of Interest
The authors declare that the research was conducted in the absence of any commercial or financial relationships that could be construed as a potential conflict of interest.
Publisher’s Note
All claims expressed in this article are solely those of the authors and do not necessarily represent those of their affiliated organizations, or those of the publisher, the editors and the reviewers. Any product that may be evaluated in this article, or claim that may be made by its manufacturer, is not guaranteed or endorsed by the publisher.
Acknowledgments
The authors gratefully acknowledge all members of the research team who worked on the project, listed at the University of Nebraska—Lincoln Healthy Schools website (https://engineering.unl.edu/healthy-schools), with special thanks to Michael Kuhlenengel, Kieren Smith McCord, Jayden Nord, and Dr. James Bovaird. The authors would also like to thank the school districts who partnered with us on this project, and Dr. Ralph Muehleisen who served as a technical advisor in the area of acoustics on the Project Advisory Committee.
References
ANSI (2010). American National Standard Acoustical Performance Criteria, Design Requirements, and Guidelines for Schools, Part 1: Permanent Schools. S12.60. New York: American National Standards Institute.
Astolfi, A., and Pellerey, F. (2008). Subjective and Objective Assessment of Acoustical and Overall Environmental Quality in Secondary School Classrooms. J. Acoust. Soc. Am. 123, 163–173. doi:10.1121/1.2816563
Bistafa, S. R., and Bradley, J. S. (2000). Reverberation Time and Maximum Background-Noise Level for Classrooms from a Comparative Study of Speech Intelligibility Metrics. J. Acoust. Soc. Am. 107, 861–875. doi:10.1121/1.428268
Bottalico, P., and Astolfi, A. (2012). Investigations into Vocal Doses and Parameters Pertaining to Primary School Teachers in Classrooms. J. Acoust. Soc. Am. 131, 2817–2827. doi:10.1121/1.3689549
Bradley, J. S., and Sato, H. (2008). The Intelligibility of Speech in Elementary School Classrooms. J. Acoust. Soc. Am. 123, 2078–2086. doi:10.1121/1.2839285
Bronzaft, A. L., and McCarthy, D. P. (1975). The Effect of Elevated Train Noise on reading Ability. Environ. Behav. 7, 517–528. doi:10.1177/001391657500700406
Bronzaft, A. L. (1981). The Effect of a Noise Abatement Program on reading Ability. J. Environ. Psychol. 1, 215–222. doi:10.1016/S0272-4944(81)80040-0
Caviola, S., Visentin, C., Borella, E., Mammarella, I., and Prodi, N. (2021). Out of the Noise: Effects of Sound Environment on Maths Performance in Middle-School Students. J. Environ. Psychol. 73, 101552. doi:10.1016/j.jenvp.2021.101552
Connolly, D., Dockrell, J., Shield, B., Conetta, R., Mydlarz, C., and Cox, T. (2019). The Effects of Classroom Noise on the reading Comprehension of Adolescents. J. Acoust. Soc. Am. 145, 372–381. doi:10.1121/1.5087126
Cooke, M., and Lecumberri, M. L. G. (2012). The Intelligibility of Lombard Speech for Non-native Listeners. J. Acoust. Soc. Am. 132, 1120–1129. doi:10.1121/1.4732062
ISO (2008). Acoustics – Measurement of Room Acoustic Parameters – Part 2: Reverberation Time in Ordinary Rooms, 3382-2. Geneva: International Standards Organization.
Jones, D. M., and Broadbent, D. E. (1998). “Chapter 24: Human Performance and Noise,” in Handbook of Acoustical Measurements and Noise Control. Editor C. Harris (Melville, NY: Acoustical Society of America), 24.
Kabirikopaei, A., Kuhlenengel, M., Arthur, A., Bovaird, J., Lau, J., Waters, C., et al. (2019). “The Effects of Indoor Environmental Factors on Students' Academic Achievement,” in Proceedings of the 2019 Architectural Engineering Institute Conference, Tysons, VA, April 3–6, 2019 (State College, PA: American Society of Civil Engineers), 257–264. doi:10.1061/9780784482261.030
Klatte, M., Bergström, K., and Lachmann, T. (2013). Does Noise Affect Learning? A Short Review on Noise Effects on Cognitive Performance in Children. Front. Psychol. 4, 578. doi:10.3389/fpsyg.2013.00578
Klatte, M., Hellbrück, J., Seidel, J., and Leistner, P. (2010a). Effects of Classroom Acoustics on Performance and Well-Being in Elementary School Children: a Field Study. Environ. Behav. 42, 659–692. doi:10.1177/0013916509336813
Klatte, M., Lachmann, T., and Meis, M. (2010b). Effects of Noise and Reverberation on Speech Perception and Listening Comprehension of Children and Adults in a Classroom-like Setting. Noise Health 12, 270–282. doi:10.4103/1463-1741.70506
Klatte, M., Spilski, J., Mayerl, J., Möhler, U., Lachmann, T., and Bergström, K. (2017). Effects of Aircraft Noise on reading and Quality of Life in Primary School Children in Germany: Results from the NORAH Study. Environ. Behav. 49, 390–424. doi:10.1177/0013916516642580
Knecht, H. A., Nelson, P. B., Whitelaw, G. M., and Feth, L. L. (2002). Background Noise Levels and Reverberation Times in Unoccupied Classrooms. Am. J. Audiol. 11, 65–71. doi:10.1044/1059-0889(2002/009)
Kryter, K. D. (1985). “Chapter 9: Mental and Psychomotor Task Performance in Noise,” in The Effects of Noise on Man (New York: Academic Press), 545–585.
Kuhlenengel, M. B., Brill, L. C., Deng, S., Lester, H. F., Bovaird, J., Lau, J., et al. (2017). “An Investigation of School Environmental Effects on Student Achievement,” in Proceedings of the 2017 Architectural Engineering Institute Conference, Oklahoma, April 11–13, 2017 (Oklahoma City, OK: American Society of Civil Engineers), 927–939. doi:10.1061/9780784480502.078
Lee, J., Francis, J. M., and Wang, L. M. (2017). How Tonality and Loudness of Noise Relate to Annoyance and Task Performance. Noise Cont. Engng. J. 65, 71–82. doi:10.3397/1/376427
Leibold, L. J. (2017). Speech Perception in Complex Acoustic Environments: Developmental Effects. J. Speech Lang. Hear. Res. 60, 3001–3008. doi:10.1044/2017_jslhr-h-17-0070
Lewis, D. E., Manninen, C. M., Valente, D. L., and Smith, N. A. (2014). Children's Understanding of Instructions Presented in Noise and Reverberation. Am. J. Audiol. 23, 326–336. doi:10.1044/2014_aja-14-0020
Ljung, R., Sorqvist, P., and Hygge, S. (2009). Effects of Road Traffic Noise and Irrelevant Speech on Children′s reading and Mathematical Performance. Noise Health 11, 194–198. doi:10.4103/1463-1741.56212
Massonnié, J., Frasseto, P., Mareschal, D., and Kirkham, N. Z. (2020). Scientific Collaboration with Educators: Practical Insights from an in‐Class Noise‐Reduction Intervention. Mind Brain Educ. 14, 303–316. doi:10.1111/mbe.12240
McCreery, R. W., Walker, E. A., Spratford, M., Lewis, D., and Brennan, M. (2019). Auditory, Cognitive, and Linguistic Factors Predict Speech Recognition in Adverse Listening Conditions for Children with Hearing Loss. Front. Neurosci. 13, 1093. doi:10.3389/fnins.2019.01093
Meinhardt-Injac, B., Schlittmeier, S., Klatte, M., Otto, A., Persike, M., and Imhof, M. (2015). Auditory Distraction by Meaningless Irrelevant Speech: a Developmental Study. Appl. Cognit. Psychol. 29, 217–225. doi:10.1002/acp.3098
Nelson, E. L., Smaldino, J., Erler, S., and Garstecki, D. (2007). Background Noise Levels and Reverberation Times in Old and New Elementary School Classrooms. J. Ed. Aud. 14, 16–22.
Nelson, P., Kohnert, K., Sabur, S., and Shaw, D. (2005). Classroom Noise and Children Learning through a Second Language. Lang. Speech Hear. Serv. Sch. 36, 219–229. doi:10.1044/0161-1461(2005/022)
Neuman, A. C., Wroblewski, M., Hajicek, J., and Rubinstein, A. (2010). Combined Effects of Noise and Reverberation on Speech Recognition Performance of normal-hearing Children and Adults. Ear. Hear. 31, 336–344. doi:10.1097/aud.0b013e3181d3d514
Peng, Z. E., and Wang, L. M. (2016). Effects of Noise, Reverberation and Foreign Accent on Native and Non-native Listeners' Performance of English Speech Comprehension. J. Acoust. Soc. Am. 139, 2772–2783. doi:10.1121/1.4948564
Peng, Z. E., and Wang, L. M. (2019). Listening Effort by Native and Nonnative Listeners Due to Noise, Reverberation, and Talker Foreign Accent during English Speech Perception. J. Speech Lang. Hear. Res. 62, 1068–1081. doi:10.1044/2018_jslhr-h-17-0423
Picard, M., and Bradley, J. S. (2001). Revisiting Speech Interference in Classrooms:Revisando la interferencia en el habla dentro del salón de clases. Int. J. Audiol. 40, 221–244. doi:10.3109/00206090109073117
Prodi, N., Visentin, C., Borella, E., Mammarella, I. C., and Di Domenico, A. (2019). Noise, Age, and Gender Effects on Speech Intelligibility and Sentence Comprehension for 11- to 13-Year-Old Children in Real Classrooms. Front. Psychol. 10, 2166. doi:10.3389/fpsyg.2019.02166
Puglisi, G. E., Prato, A., Sacco, T., and Astolfi, A. (2018). Influence of Classroom Acoustics on the reading Speed: A Case Study on Italian Second-Graders. J. Acoust. Soc. Am. 144, EL144–EL149. doi:10.1121/1.5051050
Ronsse, L. M., and Wang, L. M. (2010). Effects of Noise from Building Mechanical Systems on Elementary School Student Achievement. ASHRAE Trans. 116, 347–354.
Ronsse, L. M., and Wang, L. M. (2013). Relationships between Unoccupied Classroom Acoustical Conditions and Elementary Student Achievement Measured in Eastern Nebraska. J. Acoust. Soc. Am. 133, 1480–1495. doi:10.1121/1.4789356
Rosseel, Y. (2012). Lavaan: AnRPackage for Structural Equation Modeling. J. Stat. Soft. 48, 1–36. doi:10.18637/jss.v048.i02
Rudner, M., Lyberg-Åhlander, V., Brännström, J., Nirme, J., Pichora-Fuller, M. K., and Sahlén, B. (2018). Listening Comprehension and Listening Effort in the Primary School Classroom. Front. Psychol. 9, 1193. doi:10.3389/fpsyg.2018.01193
Sarantopoulos, G., Lykoudis, S., and Kassomenos, P. (2014). Noise Levels in Primary Schools of Medium Sized City in Greece. Sci. Total Environ. 482-483, 493–500. doi:10.1016/j.scitotenv.2013.09.010
Sato, H., and Bradley, J. S. (2008). Evaluation of Acoustical Conditions for Speech Communication in Working Elementary School Classrooms. J. Acoust. Soc. Am. 123, 2064–2077. doi:10.1121/1.2839283
Shield, B., Conetta, R., Dockrell, J., Connolly, D., Cox, T., and Mydlarz, C. (2015). A Survey of Acoustic Conditions and Noise Levels in Secondary School Classrooms in England. J. Acoust. Soc. Am. 137, 177–188. doi:10.1121/1.4904528
Shield, B., and Dockrell, J. E. (2004). External and Internal Noise Surveys of London Primary Schools. J. Acoust. Soc. Am. 115, 730–738. doi:10.1121/1.1635837
Shield, B. M., and Dockrell, J. E. (2008). The Effects of Environmental and Classroom Noise on the Academic Attainments of Primary School Children. J. Acoust. Soc. Am. 123, 133–144. doi:10.1121/1.2812596
Stansfeld, S., Berglund, B., Clark, C., Lopez-Barrio, I., Fischer, P., Öhrström, E., et al. (2005). Aircraft and Road Traffic Noise and Children's Cognition and Health: a Cross-National Study. Lancet 365, 1942–1949. doi:10.1016/s0140-6736(05)66660-3
Tiller, D. K., Musser, A., Wang, L. M., and Radik, M. J. (2010). Combined Effects of Noise and Temperature on Human comfort and Performance. ASHRAE Trans. 116, 522–540.
US Department of Education (2015). Individuals with Disabilities Education Act. Available at: https://sites.ed.gov/idea/ (Accessed March 29, 2021).
Valente, D. L., Plevinsky, H. M., Franco, J. M., Heinrichs-Graham, E. C., and Lewis, D. E. (2012). Experimental Investigation of the Effects of the Acoustical Conditions in a Simulated Classroom on Speech Recognition and Learning in Children. J. Acoust. Soc. Am. 131, 232–246. doi:10.1121/1.3662059
Wang, L. M., and Brill, L. C. (2021). Speech and Noise Levels Measured in Occupied K-12 Classrooms. J. Acoust. Soc. Am. 150, 864–877. doi:10.1121/10.0005815
Wróblewski, M., Lewis, D. E., Valente, D. L., and Stelmachowicz, P. G. (2012). Effects of Reverberation on Speech Recognition in Stationary and Modulated Noise by School-Aged Children and Young Adults. Ear Hear 33, 731–744. doi:10.1097/aud.0b013e31825aecad
Keywords: classroom acoustics, sound levels, noise, reverberation time, math achievement, signal to noise ratio, classrooms, children
Citation: Brill LC and Wang LM (2021) Higher Sound Levels in K-12 Classrooms Correlate to Lower Math Achievement Scores. Front. Built Environ. 7:688395. doi: 10.3389/fbuil.2021.688395
Received: 30 March 2021; Accepted: 15 October 2021;
Published: 03 November 2021.
Edited by:
Chiara Visentin, University of Ferrara, ItalyReviewed by:
Jessica Massonnie, University College London, United KingdomNicola Prodi, University of Ferrara, Italy
Copyright © 2021 Brill and Wang. This is an open-access article distributed under the terms of the Creative Commons Attribution License (CC BY). The use, distribution or reproduction in other forums is permitted, provided the original author(s) and the copyright owner(s) are credited and that the original publication in this journal is cited, in accordance with accepted academic practice. No use, distribution or reproduction is permitted which does not comply with these terms.
*Correspondence: Lily M. Wang, bGlseXdhbmdAdW5sLmVkdQ==