 A. J. Bronkhorst
 D. Moretti
 C. P. W. Geurts
- Structural Dynamics, TNO, Delft, Netherlands
Vibration assessment criteria for cosmetic building damage are specified in terms of peak velocity thresholds. For masonry buildings, these thresholds are relatively low compared to vibration levels generated by various sources in the built environment. Therefore they will be exceeded numerous times over the lifetime of most buildings. These exceedances are important when one tries to establish or disprove a causal relation between building damage and a vibration source. Despite the relevance of this information, little is known about the number of times velocity thresholds for cosmetic building damage are exceeded in the built environment. The vibration data collected over a period of more than 5 years in 326 buildings, mostly constructed in masonry and randomly distributed over the Province of Groningen, allowed for a unique opportunity to gain insight. First of all, to determine the number of times these thresholds were exceeded, and secondly to make a comparison between shallow earthquakes and other sources. The number of exceedances and the return period were determined for a set of thresholds (i.e. 0.3, 1, 3, 5, 10, and 20 mm/s), which align with peak velocity thresholds typically encountered in vibration assessment guidelines and standards. The results obtained over a 1 year period with very low seismic activity (only earthquakes with M < 2.0) show that the velocity thresholds for cosmetic damage to masonry buildings (i.e. 1, 3, and 5 mm/s) were exceeded on average less than once a month for 80% of the building sensors. For buildings with a large number of exceedances of these thresholds, the most important sources appear to be traffic, construction work, and hits near the sensor. A subset of 59 building sensors was selected, for which the full operational period of about 5 years was analysed to determine the contribution of earthquakes to the threshold exceedances. Less than 1% of the 1 mm/s exceedances measured by the 59 sensors over their full operational period were caused by earthquakes. Only for building with few exceedances (less than 8), the relative influence of induced earthquakes on the number of exceedances is significant (between 30 and 50%).
Introduction
Between April 2014 and December 2019 a monitoring network was in place in approximately 350 mostly masonry buildings in the Province of Groningen (Borsje and Langius, 2015). The purpose of this network was to monitor building vibrations caused by shallow earthquakes, which result from natural gas extraction in this region. Over the operational period of the Groningen network, a large number of vibrations were measured, not only from shallow earthquakes but also from other sources inside and outside the buildings. A certain part of these vibrations exceeded velocity thresholds for cosmetic building damage as specified in vibration assessment guidelines. This paper makes a study of the number and level of threshold exceedances measured in the Groningen network for different threshold values and compares these with the number and level of threshold exceedances associated with shallow earthquakes in the region.
Information on the threshold exceedances is relevant when assessing a possible relation between observed and/or claimed damage to buildings and vibration sources that might have led to this damage. For example, if an earthquake leads to an exceedance of a predefined threshold, but in the same period similar exceedances due to other sources are observed, this sheds doubt on a possible causal relation between building damage and the earthquake event. On the other hand, for buildings with mainly low vibration levels, more reliable relations between threshold exceedances and cosmetic damage may be defined. These examples show that to reliably assess whether a certain vibration source is likely to be responsible for observed and/or claimed cosmetic building damage better information is needed on: 1) the number and level of threshold exceedances by different sources and 2) their relation with cosmetic building damage.
This study is a first step towards a more reliable assessment of cosmetic building damage due to vibration sources in the built environment. In this paper, the data from the Groningen network is analysed to determine the number of exceedances of several velocity thresholds for cosmetic damage. These are compared to the number of exceedances due to shallow earthquakes, a vibration source for which the exceedances could relatively easily and reliably be extracted from the data. This paper does not further analyse the exceedances by other non-seismic sources. This is the subject of ongoing research, which combines the findings described by (Geurts et al., 2020) and the results presented in this paper. The relation with cosmetic building damage will be investigated in the ensuing work, in which the information obtained from damage inspections performed on buildings in the monitoring network will be related to the findings on the number and level of threshold exceedances.
Background provides findings of other seismic monitoring networks on non-seismic vibration sources and discusses vibration thresholds applied in practice for cosmetic building damage. Description of the buildings in the network describes the setup of the building vibration monitoring network, and Data analysis explains the performed analysis on the heartbeat data. The results are presented and discussed in Results and discussion. Conclusions and recommendations are given in Conclusion.
Background
Seismic Monitoring Networks
Seismic monitoring networks are generally installed to characterize the subsurface structure and improve seismic risk management in populated areas. Measurements of these networks on man-made vibrations (i.e., from non-seismic sources), also referred to as anthropogenic or seismic noise, are recently being studied more thoroughly. Boese et al. (2015) found elevated noise levels in records measured during the 2011 Rugby World Cup games by borehole seismometers installed beneath Eden Park Stadium in Auckland. Diaz et al. (2017) could relate peaks in records from a broad-band seismic station, located near the centre of Barcelona, to an increase in traffic due to FC Barcelona football games. Riahi and Gerstoft (2015) performed a study on seismic noise measured by a monitoring network of 5,200 geophones in Long Beach California. They managed to extract metro activity, departing and landing aircraft, and highway traffic movement. Green et al. (2016) studied the recordings of five broadband seismometers deployed in central London. A comparison of power spectra with observatory stations in sparsely populated areas showed most of the spectrum is dominated by man-made vibrations. These studies provide useful insights into the significant influence of man-made vibrations in urban areas. However, they have mainly studied specific sources or events or assessed the contribution of seismic noise in the spectral domain. No studies were found that assessed the overall number of exceedances of vibration thresholds for cosmetic building damage.
Vibration Criteria for Cosmetic Building Damage
Vibrations above a certain threshold can cause cosmetic damage. Cosmetic damage is sometimes also referred to as light or aesthetic damage. Masonry buildings are particularly susceptible to vibration-induced damage, resulting in relatively low thresholds. Cosmetic damage in masonry buildings is generally observed as hairline cracks along masonry joints, or in some cases as cracks initiated in the bricks. To reduce the risk of vibration-induced damage to buildings, guidelines have been developed that provide criteria for the assessment of measured vibrations. These vibration assessment criteria are specified in terms of the peak vibration velocity. Table 1 gives an overview of vibration threshold levels for cosmetic damage to buildings obtained from four international guidelines and standards. For the Netherlands, the SBR-A guideline (SBRCURNET, 2017) is applied to assess vibration levels with respect to building damage. The vibration thresholds in this guideline are compared with three other international guidelines: the German DIN 4150–3 (2016), the American Transit Noise and Vibration Impact Assessment Manual (FTA, 2018), and the Californian Transportation and Construction Vibration Guidance Manual (Caltrans, 2020). The values in Table 1 for the SBR-A and DIN 4150–3 are intended for vibrations measured at foundation level, the FTA and Caltrans manuals do not explicitly specify the measurement location. In all guidelines, a differentiation is made in vibration type (single vibration or continuous), building category (e.g., concrete versus masonry), and dominant frequency. The lowest threshold levels are found for dominant frequencies below 10 Hz; these values are given in Table 1.
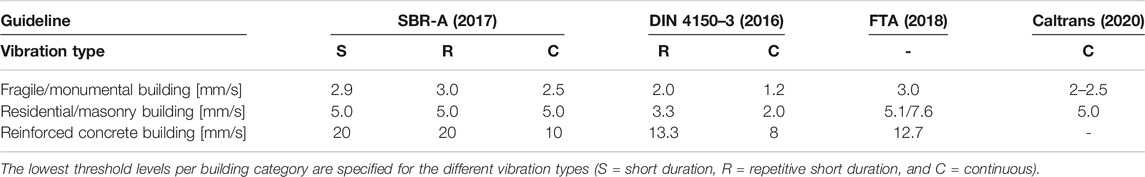
TABLE 1. Overview of vibration thresholds in terms of peak vibration velocity (in mm/s) from international guidelines and standards for the assessment of vibration-induced cosmetic damage to buildings.
The lowest thresholds with respect to building category are specified for buildings that are susceptible to vibrations and/or buildings with monumental status. The vibration thresholds given for this building category range between 1.2 mm/s (continuous vibration in SBR-A) and 3 mm/s (short duration vibration in most guidelines studied). The second building category is defined either as a residential building (DIN, 2016), a masonry building (SBRCURNET, 2017), or a normal dwelling (Caltrans, 2020). The thresholds in this category vary between 2 and 7.6 mm/s. The FTA manual differentiates between non-engineered (5.1 mm/s) and engineered (7.6 mm/s) buildings. All guidelines specify a vibration threshold of 5 mm/s, suggesting it is a generally accepted limit for this second building category. For the reinforced concrete building category the thresholds are between 8 and 20 mm/s.
Even though these criteria have been used for quite some time, little information is available about the number of times they are exceeded in the built environment. With increasing vibration-inducing activity in the built environment, such as road and (underground) railway traffic, building activities, and underground activities such as geothermal energy, and CO2 storage, there is a growing interest in assessing vibration levels in relation to risks of damage. Information on the number of threshold exceedances is valuable information when assessing those risks. This paper aims at providing typical ranges of the number of exceedances of peak velocity thresholds as being applied in guidelines.
For this study, four threshold levels are used to study the number of exceedances: a velocity threshold of 0.3 mm/s, which is a lower bound value for the perception of vibrations, and thresholds of 1, 3, and 5 mm/s, which cover the range of values found in guidelines for cosmetic damage to masonry buildings as shown in Table 1. To assess the contribution of shallow earthquake events at larger vibration levels thresholds of 10 and 20 mm/s are applied.
Building Vibration Monitoring Network
The building vibration monitoring network in the province of Groningen was designed and built to study the effects of shallow earthquakes on buildings. The earthquakes are the result of gas extraction in this region. The emphasis of the Groningen network was on obtaining data that would increase knowledge on the structural behaviour with respect to the occurrence of damage and safety assessments. This section describes the setup of the network; more information can be found in (Borsje and Langius, 2015).
Description of the Buildings in the Network
The buildings in the monitoring network were selected such that good coverage of the seismic region in the province of Groningen and variability in building characteristics (e.g., building type, construction material, and foundation type) was achieved. Figure 1A shows 326 building locations that were used in the current study to measure vibrations. These locations cover the seismic hazard region and are located in various built environments (i.e., city, town, and rural area).
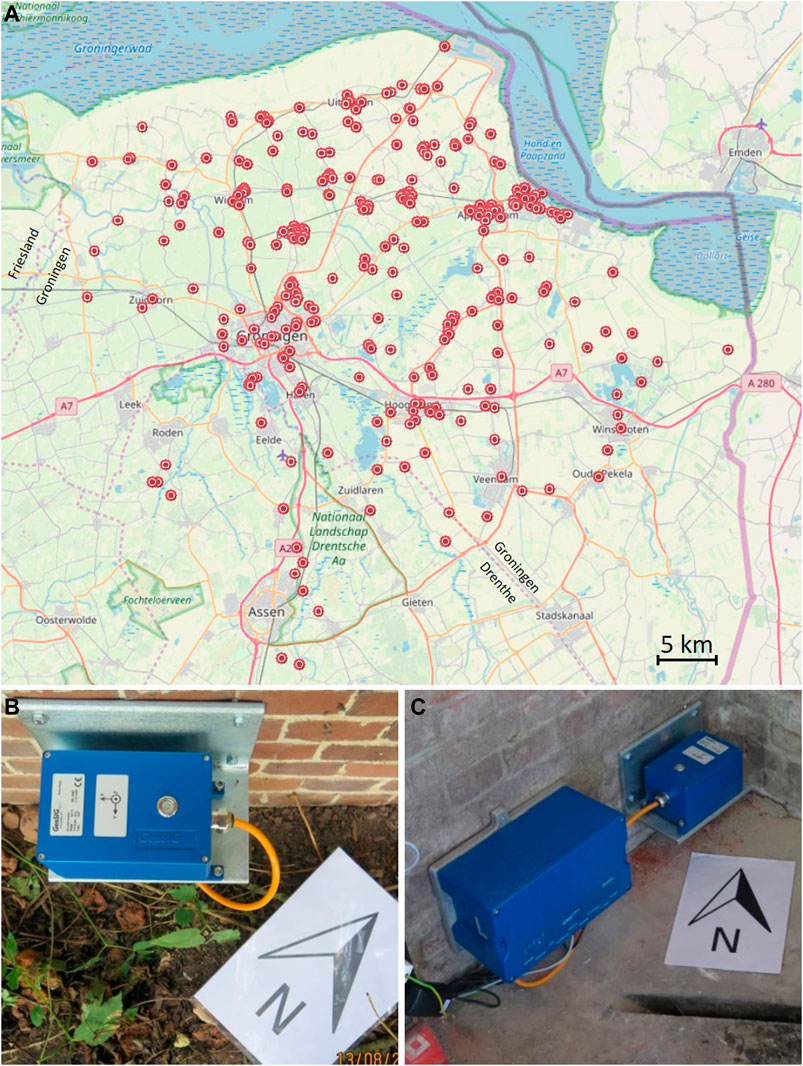
FIGURE 1. (A) Building locations in the vibration monitoring network in the province of Groningen. Geosig sensors near a stiff corner on (B) the outside and (C) the inside of a building. The large blue box is the recorder, the small blue box is the (A) Building locations in the vibration monitoring network in the province of Groningen. Geosig sensors near a stiff corner on (B) the outside and (C) the inside of a building. The large blue box is the recorder, the small blue box is the sensor.
Figure 2 gives an overview of various characteristics of the buildings in the monitoring network, demonstrating the representability of masonry buildings in the province of Groningen. The construction year of the buildings ranges quite evenly over the last century, having at least 10 buildings from almost every decade; 27% of the buildings were constructed before 1900. About 85% of the buildings were dwellings, which were either free-standing, semi-detached, terraced, or houses of farms. The other 15% were public buildings (e.g. schools, city halls, or sports centra) and some industrial buildings. Most buildings (87%) were constructed from unreinforced masonry (URM). Half of these URM buildings have cavity walls, which is quite common for buildings in the Netherlands constructed after 1920. The buildings mainly have two or three storeys, a small portion has one storey. About half of the buildings (52%) are known to have a shallow foundation, about a quarter has a pile foundation and for another quarter the foundation type is unknown.
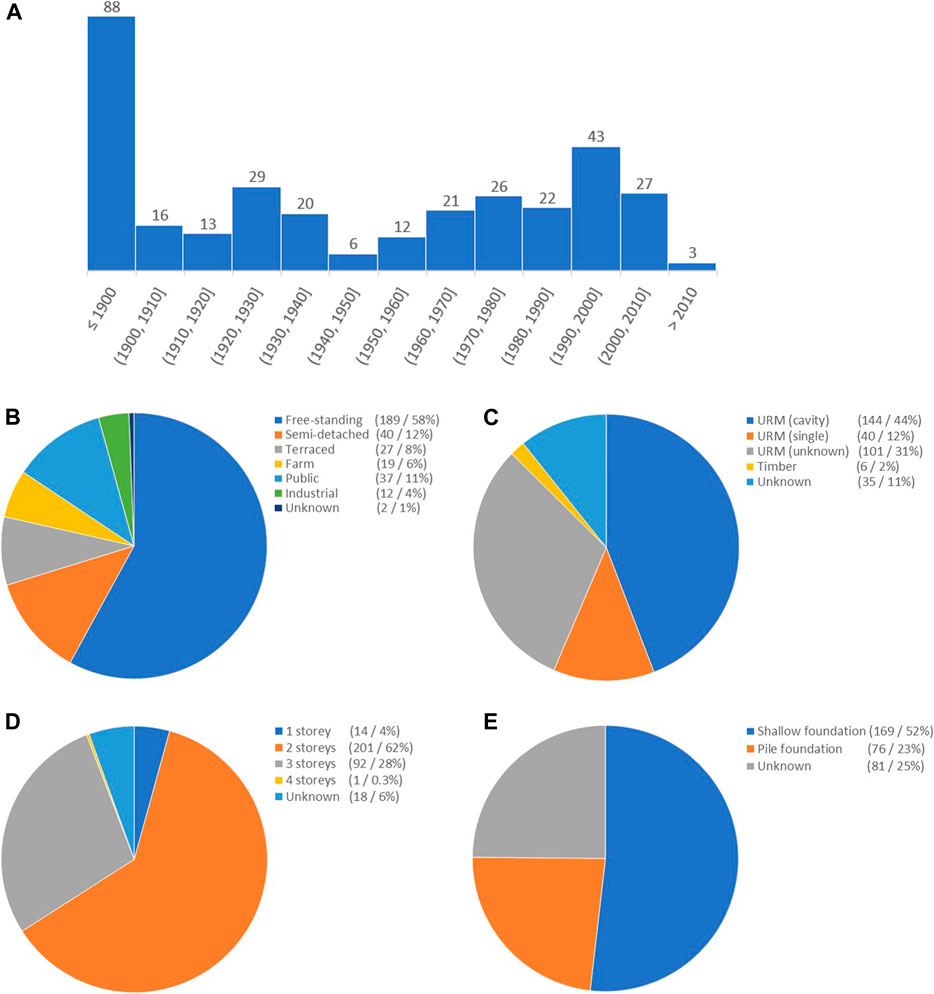
FIGURE 2. Characteristics of the buildings in the Groningen monitoring network: (A) construction year, (B) building type, (C) construction material, (D) number of stories, (E) foundation type.
Building Sensors
Sensors were installed at the building locations shown in Figure 1A. At each location, a single vibration measurement system was installed at foundation level, near a stiff corner on the inside or outside wall of the building, as shown in Figures 1B,C. This aligns closely with the Dutch vibration guideline SBR-A (SBRCURNET, 2017), which specifies for a single sensor measurement setup to place the sensor near a stiff corner at foundation level closest to the vibration source of interest. The SBR-A refers to this setup with one sensor per building as an ‘indicative measurement’. Peak velocity levels measured at this location are used as assessment values using the criteria in this guideline. The X- and Y-direction of each sensor were oriented parallel and perpendicular to the wall, the Z-direction was pointing upwards.
The measurement systems were supplied by GeoSig and consist of a recorder (GMSplus measuring system) and a tri-axial sensor (AC-73 force balance accelerometer). The AC-73 sensor has a dynamic sensing range of 165 dB and a bandwidth from DC to 200 Hz. The full scale range of each sensor was set at ±2 g. The sensitivity of the sensors at this range is 5.0 V/g. The resolution of the AD-converter of the GMSplus system is 24 bits. The recorded acceleration signals are continuously sampled at 250 Hz, with an analog anti-aliasing filter. To remove trends in the data, the measured signals were filtered with a 0.8 Hz high-pass digital filter (fourth order Butterworth). After trend removal, the measured acceleration signals were locally integrated to velocity signals. Each measurement system was calibrated by GeoSig before installation.
Heartbeats and Trigger Events
Two vibration data sets were stored in the monitoring network: 1) time traces of events exceeding a threshold of 1 mm/s, referred to as trigger events, and 2) the peak vibration levels measured for each minute, referred to as heartbeats.
A trigger event is defined as the moment that the vibration velocity in X, Y, or Z-direction exceeds a threshold level of 1 mm/s. Event time traces (acceleration and velocity) were stored for a period between 10 s before the event and 20 s after the last threshold exceedance. So, for a single exceedance, the time series has a length of 30 s. If multiple exceedances occurred shortly after each other, longer time traces were measured. In Moretti et al. (2020) and Geurts et al. (2020), the trigger event traces were used to define a set of signal characteristics for various vibration sources. The trigger event traces are not used in this paper.
The second dataset consists of heartbeat data, which were recorded to check that the sensors were functioning correctly. Every minute the sensors sent a “heartbeat” message, which contained information on the unit’s health (power status, clock sync status, error messages) and the maximum accelerations and velocities in X, Y, and Z-direction measured over the last minute. Besides a check on the health of the sensor, the vibrations levels obtained with these heartbeat measurements also give information on the vibration levels experienced by the buildings, caused by activities in and around the buildings. In this study, the heartbeat data are used to determine the number of exceedances of several vibration thresholds for cosmetic building damage.
Post-Trigger Evaluation Database
Besides the vibration measurements that were performed on buildings in the monitoring network, a website was maintained where building owners could provide reasons for threshold exceedances. The main aim of this website was to involve building owners and to raise acceptance for the outcomes of the measurements in the monitoring network. When a trigger event was registered in a building, which was not caused by an earthquake, the building owner was sent an email with the request to specify a reason for the trigger event in a web form. The owner could then select a reason from the following list:
- Earthquake
- Construction work on house
- Construction work nearby
- Traffic in the street
- Hit nearby sensor
- Hit against sensor
- Weather (e.g. thunder or heavy wind)
- Other
- Unknown
In case the option “Other” was selected, the owner could give a more specific reason for the trigger event. Examples of some reasons that were mentioned are:
- “Felling a tree nearby the house”
- “Carbide shooting on New Year’s Eve” (carbide shooting is a New Year’s Eve ritual in some rural parts of the Netherlands)
- “Drilled holes in the wall around 15.00–15.15”
- “Due to high temperatures doors and windows are open and sometimes slam closed”.
The reasons provided by the building owners were originally not intended as research material. Moretti et al. (2020) made a study to assess the potential of this database for the identification of vibration sources. This study found that the provided reasons give some idea of the likely sources responsible for the trigger events. In numerous cases it is however unlikely that the specified reason was the actual source responsible for the event, given the characteristics of the measured signal. It was concluded that the database by itself is too unreliable for the identification of vibration sources responsible for threshold exceedances. Moretti et al. (2020) recommended that the properties of the time traces of the trigger events might be used to arrive at a more reliable method for source identification; this is the subject of currently ongoing research. In the study presented here, the database was used to provide the reasons specified by building owners at buildings where large numbers of threshold exceedances were measured.
Data Analysis
This section explains the processing performed on the heartbeat data. More information can be found in Moretti et al. (2019).
Selection of Heartbeat Datasets
Two heartbeat datasets from the building vibration monitoring network were selected for analysis: 1) the data of all sensors for a 1 year period with low seismic activity and 2) the data of the full operational period from a selection of sensors.
The first heartbeat dataset was selected based on the seismic activity during the operational period of the monitoring network from July 29, 2014 to November 18, 2019. During this time a total of 27 earthquakes were recorded with an intensity M > 2.0. The seismic activity between May 1, 2018 and May 1, 2019 was particularly low. The largest earthquake observed in this period had a magnitude of M = 1.9. The largest peak velocity measured in the Groningen network during this earthquake was 1.6 mm/s; the 1 mm/s threshold was exceeded only 12 times. Because of the low seismic activity, this period was selected to study the threshold exceedances caused by vibration sources other than earthquakes.
A second heartbeat dataset was selected containing the full operational period (∼5 years) of a subset of the building sensors. This dataset was used to investigate the influence of induced earthquakes on the threshold exceedances. Paragraph 5.2 describes the selection procedure and the resulting heartbeat dataset.
Large Peaks and Missing Data
Figure 3 shows the heartbeat peak velocities in X-direction of two sensors in the network, measured from May 1, 2018 to April 30, 2019.
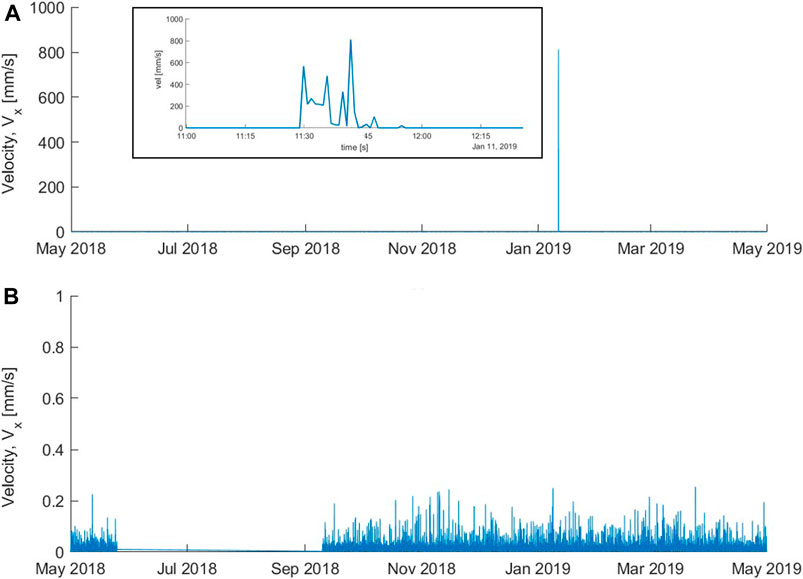
FIGURE 3. Heartbeat peak velocity traces (X-direction) obtained from two sensors in the network for the period May 2018 to May 2019: (A) sensor with a large peak in the dataset, and (B) sensor with a period Heartbeat peak velocity traces (X-direction) obtained from two sensors in the network for the period May 2018 to May 2019: (A) sensor with a large peak in the dataset, and (B) sensor with a period of missing data.
The data in Figure 3A shows a large spike on the 11th of January, which upon closer inspection consists of a period of about 15 min in which very large vibration levels (200–800 mm/s) were measured by the sensor. These vibrations are due to handling and maintenance of the sensor, and not caused by external vibration sources. All periods with peaks that could be attributed to handling of the sensors were removed from the heartbeat datasets.
Figure 3B shows another record of heartbeat peak velocities. Between May 25, 2018 and September 10, 2018, no heartbeat data was recorded by this sensor. This is about 30% (∼15 weeks) of heartbeat data that are missing. To limit the influence of the missing data on the analysis, sensors that are missing more than 2% of heartbeat data (corresponding with a cumulative period of 1 week in a year) have been discarded for this study. This yields 254 sensors with 98% or more of the one-year heartbeat data complete, and 73 heartbeat datasets with less than 98% complete which were discarded.
Selection of Earthquake Heartbeats
To determine the heartbeats that correspond with verified earthquakes, a procedure was developed that compares the expected vibration level from the earthquake event at every sensor in the network with the measured vibration level. A general explanation of the procedure is provided here; the reader is referred to Moretti et al. (2019) for a detailed explanation.
A list of earthquake events, comprising time-stamp, location (latitude and longitude), magnitude, type of earthquake (tectonic or induced) and other information is publicly available on the KNMI website (KNMI, 2021). For each induced earthquake in this list of earthquake events, the expected maximum peak ground velocity is estimated using the empirical model by Bommer et al. (2019). This model gives the expected maximum velocity in horizontal direction, as well as the confidence bounds, induced by an event of magnitude
With this procedure, two datasets are obtained for the selection of building sensors for which the full operational period is analysed: 1) a dataset with all heartbeat data, and 2) a dataset without heartbeat data that are likely to have been caused by an earthquake.
Probability of Exceedance and Return Period
The measured heartbeat data of each sensor consist of 1-min peak velocity traces in X, Y, and Z-direction. The 1-min peak velocity trace over these three directions is obtained with:
This study assesses how often the peak vibration level
With the probability
Where
This return period (in minutes) is an estimated average time between the exceedances of a certain vibration threshold level
Results and Discussion
This section presents and discusses the results of the heartbeat analysis. In the first paragraph, the analysis is given on how often the thresholds for cosmetic building damage are exceeded by non-seismic vibration sources. This is based on the data from a 1 year period with low seismic activity. The second paragraph describes the selection of the building sensors for which the full operational period (∼5 years) is analysed. The heartbeat data of the full operational period of the selection of building sensors have been used to evaluate the contribution of shallow earthquakes on the threshold exceedances. The third paragraph compares the results of this 5-year period with the results of the 1 year period and discusses the influence of shallow earthquakes on the results.
Analysis of 1 year With Low Seismic Activity
This paragraph presents the results of 254 buildings for the 1 year period May 1, 2018–May 1, 2019, which was a year with low seismic activity. Figure 4 shows the complementary cumulative distribution functions (CCDF) determined from the 1-year heartbeat datasets of the 254 building sensors. The left vertical axis specifies the probability of exceedance
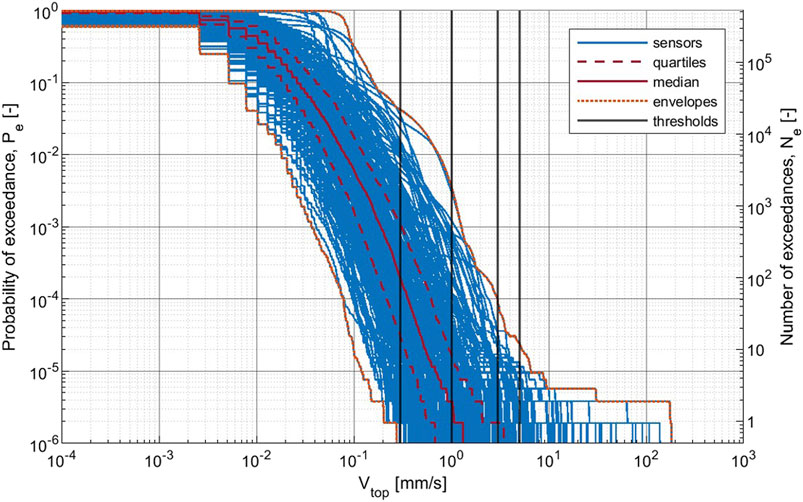
FIGURE 4. Complementary cumulative distribution functions of the 254 one-year heartbeat datasets (blue). The graph shows the quartiles and envelopes (red) of the CCDF’s and indicates the velocity thresholds (black).
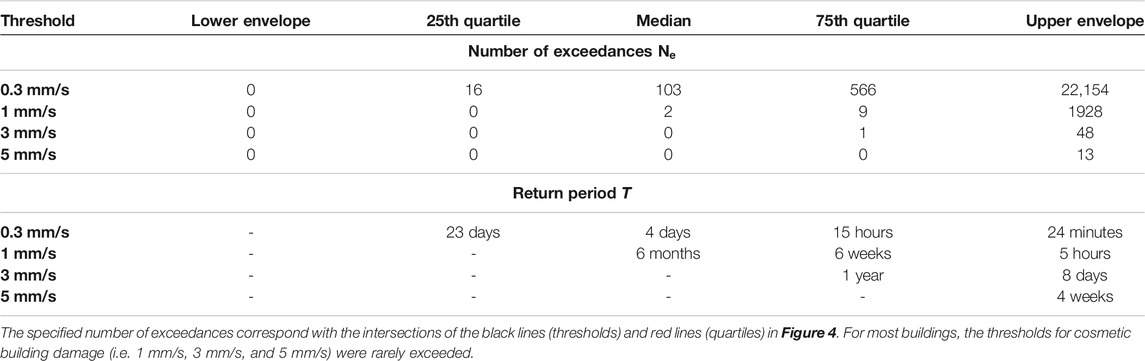
TABLE 2. The number of exceedances and return periods at different velocity thresholds for the one-year period.
Figure 4 and Table 2 show that the perception threshold of 0.3 mm/s was regularly exceeded (more than once per week) for more than half of the buildings. There is however also significant variability between buildings. The buildings in the lower quartile experienced an exceedance of 0.3 mm/s less than once every 23 days. Whereas for buildings in the upper quartile the same peak velocity was exceeded approximately once every 15 h up to once every 24 min.
The velocity thresholds for cosmetic building damage (i.e., 1, 3, and 5 mm/s) were rarely exceeded for most buildings in this 1 year period. Half of the buildings experienced only two or fewer exceedances of the 1 mm/s threshold. About 75% of the buildings did not observe an exceedance of the 3 mm/s threshold, and the 5 mm/s threshold was not exceeded for about 80% of the buildings.
Figure 4 furthermore shows that at some building sensors relatively large vibration levels (> 50 mm/s) were measured. From a building damage perspective, it is important that the sources responsible for these large exceedances are identified. The building owners did not specify any reasons for these large levels. It is likely however that these vibrations were caused by activities like hammering very near the sensor or an (accidental) hit against the sensor. In Geurts et al. (2020) these large vibration levels were only observed for these types of sources, which are unlikely to result in building damage. In ongoing work, the trigger event traces are used to determine the most probable sources responsible for the threshold exceedances.
Table 3 gives the number of buildings within a certain return period range at the different velocity thresholds. The perception threshold of 0.3 mm/s is exceeded more than once a week for about 60% of the buildings; the return period for 20% of the buildings is between a week and a month. The last 20% of the buildings experienced an exceedance less than once a month, indicating a quiet low-level vibration environment. This is not necessarily related to a rural area. Figure 5A shows that the return periods for the 0.3 mm/s threshold determined for various buildings in the city of Groningen are a week or more, while return periods less than a week are seen at several buildings in rural areas.
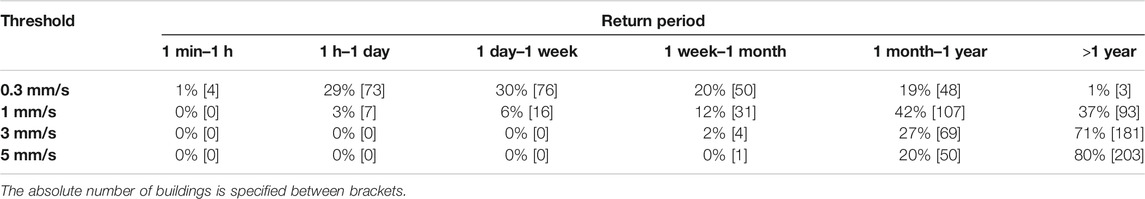
TABLE 3. The percentage of buildings within a certain return period range at the different velocity levels
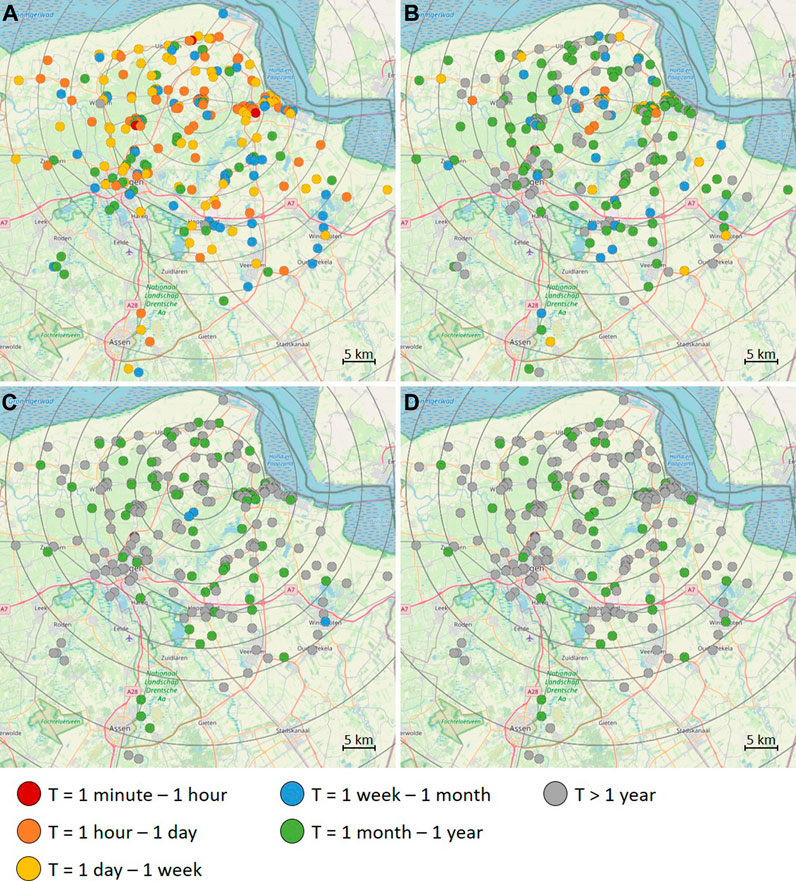
FIGURE 5. Return periods determined from the 1-year heartbeat data for velocity thresholds: (A) v = 0.3 mm/s, (B) v = 1 mm/s, (C) v = 3 mm/s and (D) v = 5 mm/s.
The velocity thresholds for cosmetic building damage (i.e. 1, 3, and 5 mm/s) were rarely exceeded for most building sensors over this 1 year period. For example, the threshold of 1 mm/s was exceeded less than once a month for 80% of the buildings. There are some buildings however where these velocity thresholds were exceeded more regularly. For seven buildings the value of 1 mm/s was on average exceeded more than once a day. Figure 5B shows that six of these buildings are located in small rural towns; in 5 cases the buildings are located near a main road through the town. These observations combined with the reasons specified in the webform by four building owners indicate heavy traffic like busses or tractors are an important reason for the relatively large number of exceedances. Hits near the sensor, for example due to a door near the sensor that regularly slammed shut, are another reason regularly mentioned for threshold exceedances at some building locations. For three buildings this reason was responsible for 60–80% of the recorded 1 mm/s exceedances. Figures 5C,D show the few buildings where the 3 and 5 mm/s velocity thresholds were regularly exceeded (i.e., between once a week and once a month). For these buildings, traffic was also provided as the main reason for the relatively large number of exceedances.
The geographical map in Figure 5 shows there is no clear relation between the geographical location of the buildings and the return period of the four presented thresholds. This indicates that the number of exceedances for these velocity thresholds are mainly determined by local circumstances. An example of such local circumstances is shown in Figure 6, which gives heartbeat velocity data in X-direction measured by a network sensor for the periods July 2, 2018–July 23, 2018 and October 15, 2018–November 5, 2018. The sensor was placed in a building situated next to a bus route, with a nearby bus stop. Figure 6A shows a relatively low level of vibration on nights and on Sundays (the eighth, 15th, and 22nd of July) and higher levels of vibration during the day and weekdays (e.g. Second to sixth of July). In the 3-week period from the 15th of October to the fifth of November shown in Figure 6B, an increase in the number of peaks above 1 mm/s is observed between the 16th and 29th of October. In this period the trains were temporarily replaced by a bus service leading to more bus traffic in this period, hence resulting in more vibrations.
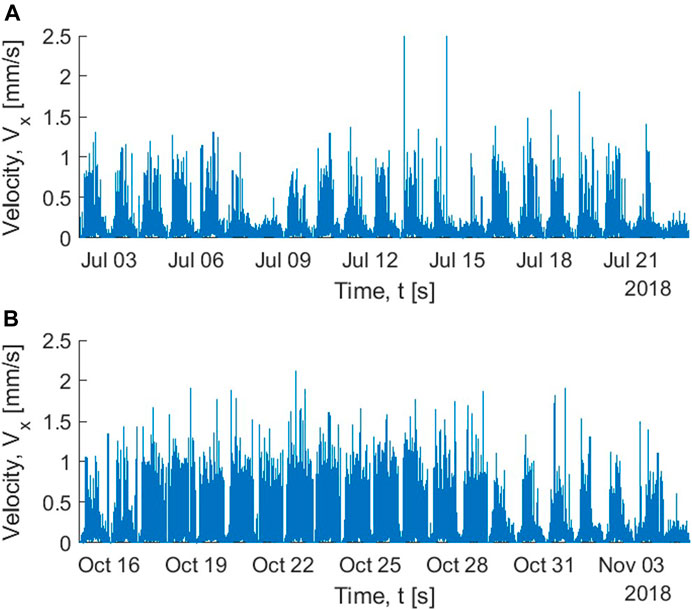
FIGURE 6. One-minute peak vibration levels measured in X-direction at a building near a bus stop for the periods (A) 2/7/2018 ‒ 23/7/2018, and (B) 15/10/2018 ‒ 5/11/2018.
Sensor Selection Full Operational Period
Based on the results of the 1-year dataset, a subset of sensors is selected for which the full operational period is analysed. The results of this dataset are compared with the results obtained for the 1-year dataset and are used to investigate the influence of induced earthquakes on the number of exceedances. The sensors in the full period dataset are selected based on the following criteria:
- The sensors were installed before January 1, 2015;
- The heartbeat data of these sensors contain at least 90% of the operational period;
- The selected sensors provide a good representation of the vibration levels observed for the sensors in the period May 1, 2018–May 1, 2019.
- The selected sensors provide good geographical coverage of the Province of Groningen.
These selection criteria yielded a total of 59 sensors. Figure 7A shows the well-distributed coverage of these sensors over the North of the Netherlands. A concentration of six sensors is found near Loppersum (the centre circle), a small township in close proximity of most earthquake epicentres with a magnitude M > 2.0. Figure 7B shows the complementary cumulative distribution functions (CCDF) of the one-year dataset, with the CCDF curves of the 59 sensors highlighted in red. The 59 datasets are evenly spread out over the range of CCDF curves.
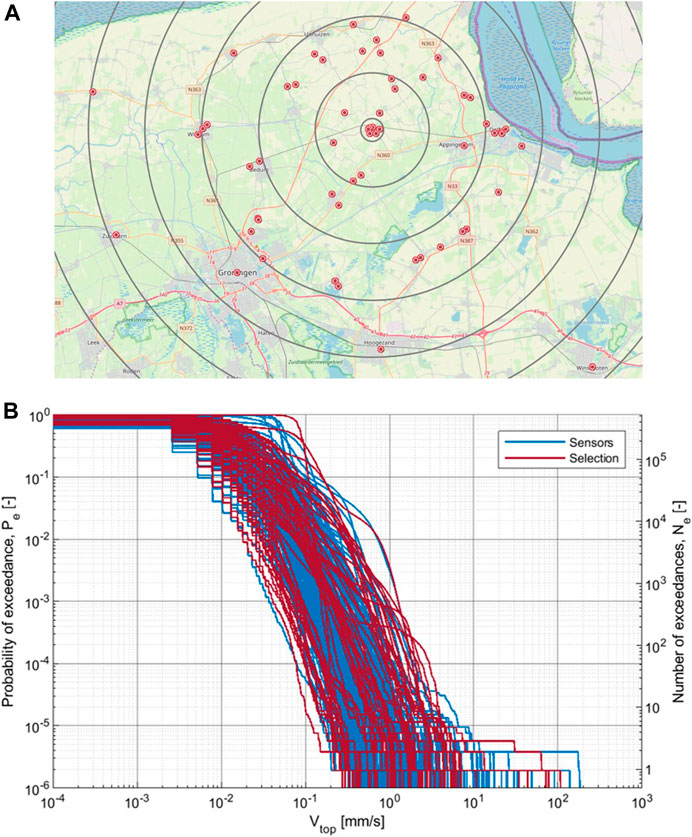
FIGURE 7. (A) Position of the selected sensors for analysis of the full operational period. The red dots indicate the selected sensors while the grey circles indicate the distance from Loppersum (1, 5, 10, 15, 20, 25, and 30 km). (B) CCDF curves of the 1-year dataset (blue) and of the selected sensors (red).
Influence of Shallow Earthquakes Over the Full Operational Period
This paragraph compares the results of the full operational period of the network (∼5 years) with the results of the 1 year period and assesses the contribution of shallow earthquakes. Figure 8 shows the CCDF’s of the 59 building sensors for which the heartbeat data of the full operational period were analysed. Table 4 gives the number of exceedances
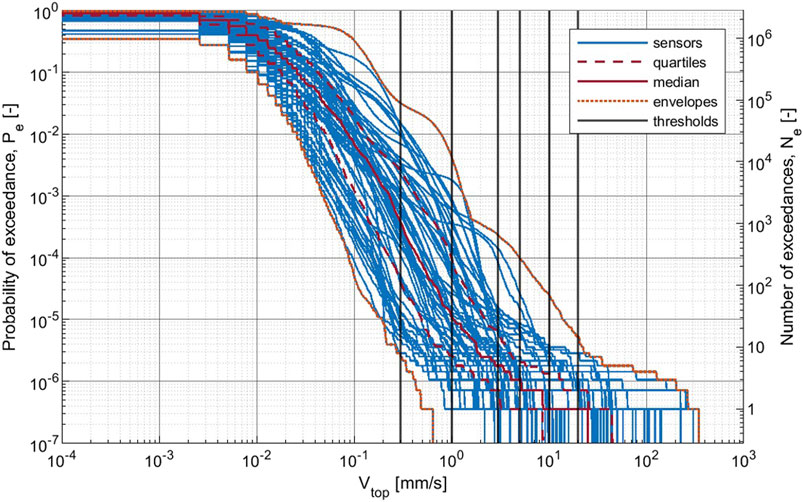
FIGURE 8. Complementary cumulative distribution functions of the 254 one-year heartbeat datasets.
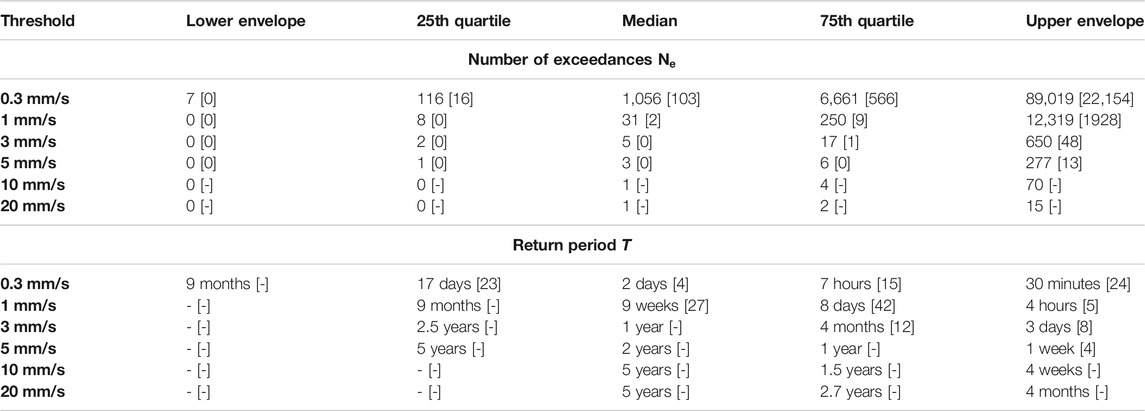
TABLE 4. The number of exceedances and return periods at different velocity levels for the full operational period. For comparison, the values in Table 2 are provided here between brackets.
A comparison of the return periods in Table 4 with those in Table 2 (specified between brackets in Table 4) shows that the return periods obtained for the full period dataset are in most cases shorter than those obtained for the 1-year dataset. This indicates that the period May 1, 2018–May 1, 2019, discussed in paragraph 5.1, was a year with relatively low vibration levels. Large differences are especially observed for the threshold levels of 1, 3, and 5 mm/s. This is caused by the relatively small number of exceedances for these thresholds in the 1-year period. The comparison with the 5-year data shows that for most buildings quite long monitoring periods (at least more than 1 year) are needed for a reliable assessment of the return period of the thresholds for cosmetic building damage. The threshold levels of 10 and 20 mm/s are rarely exceeded for most buildings. About half of the buildings did not observe any exceedances of these thresholds over their operational time. Figure 8 shows that only one building observed more than 10 exceedances of these two thresholds. No reasons were provided by the building owner for these exceedances.
Figure 9 shows the geographical position of the building sensors and indicates by colour the different return periods determined for velocity levels of 0.3, 1, 3, and 5 mm/s. Similar to Figure 5, no relation with the geographical location of the sensor is observed. A comparison with Figure 5 shows that the buildings with short return periods for the 3 and 5 mm/s thresholds are in this case observed at other buildings than for the 1 year period. Unfortunately, the owners of these buildings provided relatively few reasons for the threshold exceedances. The reasons these owners did specify suggest that traffic, construction work to the road, and hits near the sensor were primarily responsible for the relatively small return periods. The fact that the short return periods in Figure 5 for the 3 and 5 mm/s thresholds are observed at other buildings, suggests that the exceedances of these thresholds are caused by incidentally or temporarily occurring vibration sources instead of sources that are permanently present.
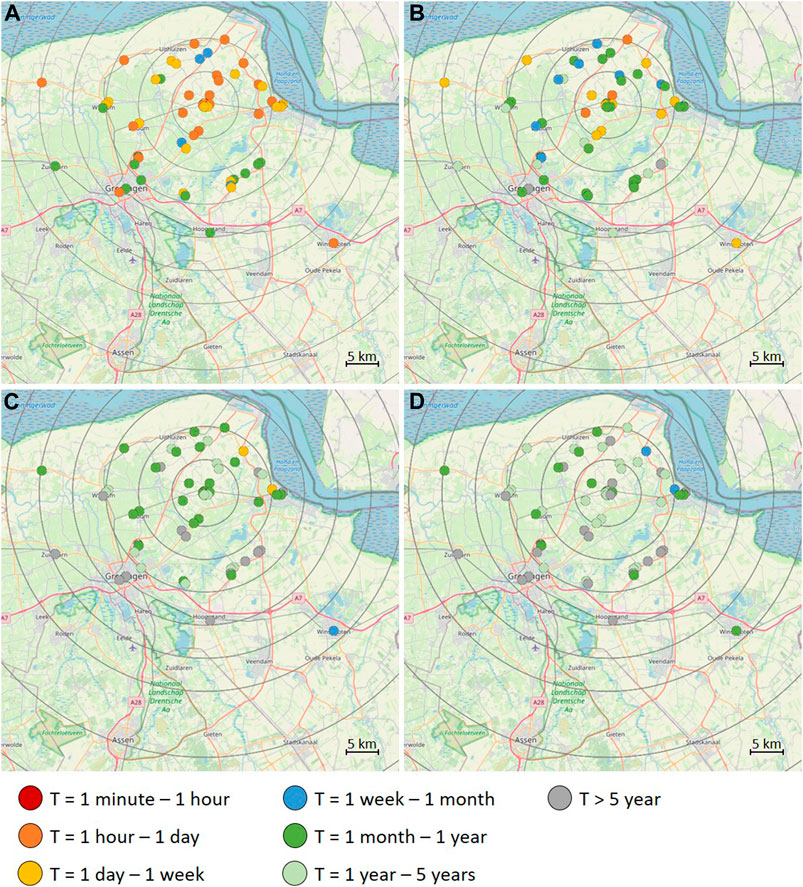
FIGURE 9. Return periods determined from the heartbeat data of the full operational period for velocity thresholds: (A) v = 0.3 mm/s, (B) v = 1 mm/s, (C) v = 3 mm/s and (D) v = 5 mm/s.
Table 5 gives the number of exceedances with and without earthquakes for the median, the lower and upper quartile, and the lower and upper envelope. This table shows that only for buildings with few exceedances (less than 8), the relative influence of shallow earthquakes on the number of exceedances is significant (between 30 and 50%). Because of the relatively large contribution of earthquakes and the limited number of exceedances by other sources, these buildings are particularly suitable for research into a possible relationship between shallow earthquakes and the development of cosmetic damage.
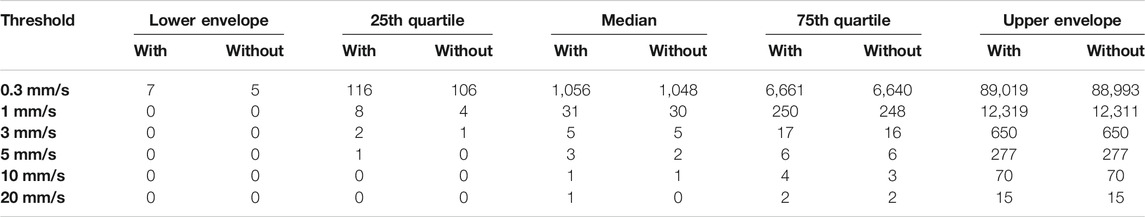
TABLE 5. The number of exceedances determined for the full operational period with and without earthquake events at different velocity thresholds.
The relatively small contribution of shallow earthquakes is also observed in Table 6, which shows the total number of exceedances for the full operational period with and without earthquake events. Less than 1% of the trigger events (i.e.,
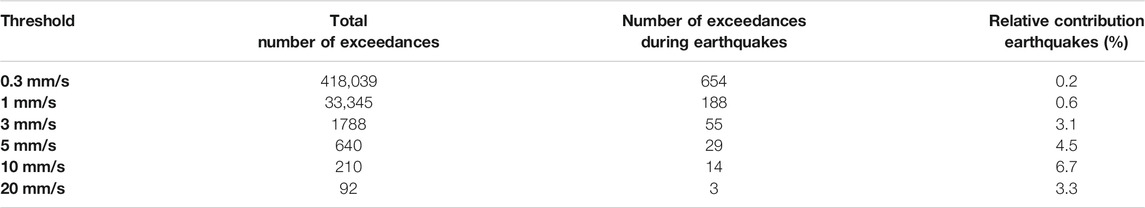
TABLE 6. The total number of exceedances in the monitoring network of the selected velocity threshold levels for the full operational period with and without earthquake events.
Table 5 and Table 6 show that for most buildings, vibration sources other than earthquakes contribute more to the number of exceedances of the various thresholds for building damage. Besides the shallow earthquake events, these sources can also be the cause of observed and/or claimed building damage. Reliable information about the type of sources responsible for the other exceedances and the relationship with the development of cosmetic damage over time is essential to assess the extent to which there is a causal relationship between the different sources and the observed damage.
Conclusion
The Groningen building vibration monitoring network was in operation between April 2014 and December 2019 to study the effects of shallow earthquakes on buildings due to gas extraction in the Province of Groningen. Over the operational period of the network, a large number of vibrations were measured, resulting from both natural and man-made sources. This paper presented a study of the 1-min peak vibration levels (heartbeats) measured at foundation level by 326 building sensors in this network. The number of exceedances
- The perception threshold of 0.3 mm/s was regularly exceeded (more than once per week) at most buildings. At about 20% of the buildings, this threshold is exceeded less than once a month over the period May 1, 2018–May 1, 2019.
- The threshold levels for cosmetic damage to masonry buildings (1, 3, and 5 mm/s) are exceeded only a small number of times for most buildings. For the period May 1, 2018–May 1, 2019, 80% of the building sensors recorded an exceedance of 1 mm/s less than once a month.
- The reasons provided by building owners indicate that traffic, construction work, and hits near the sensor are important sources at buildings with a large number of exceedances of the 1, 3, and 5 mm/s threshold levels.
- Less than 1% of the trigger events (i.e., velocity larger 1 mm/s) measured by the 59 sensors over the full operational period of the building vibration monitoring network were caused by earthquakes.
- Only for buildings with few exceedances (less than 8), the relative influence of induced earthquakes on the number of exceedances is significant (between 30 and 50%).
This study has given insight into how often vibration threshold levels for cosmetic building damage are exceeded in the built environment. The contribution of shallow earthquakes to the number of exceedances was found to be relatively small compared to other sources, ranging between 1% at a threshold of 1 mm/s and almost 7% at a threshold of 10 mm/s. Unfortunately, the database with reasons provided by the building owners did not provide sufficiently reliable information to allow for differentiation of the threshold exceedances between other sources than earthquakes. In ongoing work, the heartbeat findings presented here are combined with the source characterization findings by Geurts et al. (2020) to allow for such a differentiation. The relation with cosmetic building damage will be investigated in future work, in which the information obtained from damage inspections performed on buildings in the Groningen network will be related to the findings on the number and level of threshold exceedances.
This study highlights the necessity of knowing the properties and vibration levels of all sources of the vibrations present during monitoring. In the case of the Groningen network, the emphasis was on the effect of shallow earthquakes. However, to assess these in relation to observed damage, the contribution of other vibration sources cannot be ignored and should be incorporated in any study on causes of damage.
This paper only considers vibrations as a possible source of damage. However, the assessment of damage causes should not be limited to vibrations only. Causes related to the buildings themselves and the environment, e.g., local settlements may also (solely or in combination with vibrations) contribute to observed damage in the area.
Data Availability Statement
The data supporting the conclusions of this article will be made available by the authors, without undue reservation, but considering DPA legislation.
Author Contributions
AJ: Conceptualization, Methodology, Data analysis, Visualization, Writing - original draft, Writing - review and editing. DM: Conceptualization, Methodology, Data analysis, Visualization, Investigation. CG: Conceptualization, Methodology, Writing - review, Supervision.
Funding
The authors declare that this study received funding from NAM (Nederlandse Aardolie Maatschappij). NAM was not involved in the study design, collection of the vibration data, data analysis, interpretation of data, the writing of this article or the decision to submit it for publication. NAM financed the building vibration monitoring network and hosted the web platform for the post-trigger evaluation database.
Conflict of Interest
The authors declare that the research was conducted in the absence of any commercial or financial relationships that could be construed as a potential conflict of interest.
Publisher’s Note
All claims expressed in this article are solely those of the authors and do not necessarily represent those of their affiliated organizations, or those of the publisher, the editors and the reviewers. Any product that may be evaluated in this article, or claim that may be made by its manufacturer, is not guaranteed or endorsed by the publisher.
References
Boese, C. M., Wotherspoon, L., Alvarez, M., and Malin, P. (2015). Analysis of Anthropogenic and Natural Noise from Multilevel Borehole Seismometers in an Urban Environment, Auckland, New Zealand, Bull. Seismological Soc. America, 105. 285–299. doi:10.1785/0120130288
Bommer, J. J., Stafford, P. J., and Ntinalexis, M. (2019). Updated Empirical GMPEs for PGV from Groningen Earthquakes. Assen: NAM. https://www.nam.nl/feiten-en-cijfers/onderzoeksrapporten.html#iframe=L3JlcG9ydHMvb3ZlcnZpZXcvZ3JvbmluZ2VuLyMv
Borsje, H., and Langius, E. (2015). Monitoring Network Building Vibrations, TNO 2015 R10501. Delft. available upon request. Celtic Spells and Counterspells.
Caltrans (2020). California Department of Transportation. Transportation and Construction Vibration Guidance Manual. Report No CT-HWANP-RT-20-365.01.01.
Díaz, J., Ruiz, M., Sánchez-Pastor, P. S., and Romero, P. (2017). Urban Seismology: on the Origin of Earth Vibrations within a City. Sci. Rep. 7, 15296. Available at: www.nature.com/scientificreports. doi:10.1038/s41598-017-15499-y
DIN (2016). Deutsches Institute für Normung Berlin: Beuth Verlag GmbH. DIN 4150-3:2016 Structural Vibration – Part 3: Effects of Vibration on Structures.
Ebeling, C. (2010). An Introduction to Reliability and Maintainability Engineering. Second ed. Long Grove, IL: Waveland Press. 978-1577666257.
FTA (2018). U.S. Department of Transportation, Federal Transit Administration, Transit Noise and Vibration Impact Assessment Manual, FTA Report No. 0123.
Geurts, C. P. W., Bronkhorst, A. J., Moretti, D., Pruiksma, J., and Snijders, R. (2020). Characterization of Vibrations Measured in the Groningen Building Monitoring Network, Eurodyn XI International Conference on Structural Dynamics Proceedings, 23-26 November 2020, Athens, Greece. Athens, Greece. doi:10.47964/1120.9093.19232
Green, D. N., Bastow, I. D., Dashwood, B., and Nippress, S. E. J. (2016). Characterizing Broadband Seismic Noise in Central London. Seismological Res. Lett. 88 (1), 113–124. doi:10.1785/0220160128
KNMI (2021). Earthquakes – Complete Catalogue for the Netherlands and Near Surrounding. [Dataset], available at https://dataplatform.knmi.nl/catalog/datasets/index.html?x-dataset=aardbevingen_catalogus&x-dataset-version=1.
Moretti, D., Bronkhorst, A. J., and Geurts, C. P. W. (2020). Characterization of Vibrations for the Groningen Building Monitoring Network, Report TNO 2019 R11991. Delft, (available upon request).
Moretti, D., Bronkhorst, A. J., and Geurts, C. P. W. (2019). Study of the Heartbeat (1 Minimum Maximum Velocity) Data from the Building Monitoring Network. Report TNO 2019 R11992. Delft. available upon request.
Porter, K. (2021). A Beginner's Guide to Fragility, Vulnerability, and Risk. Encyclopedia of Earthquake Engineering. Springer-Verlag Berlin Heidelberg, 1–29. doi:10.1007/978-3-642-36197-5_256-1
Keywords: vibration monitoring network, man-made vibrations, cosmetic building damage, masonry buildings, vibration thresholds, number of exceedances, return period
Citation: Bronkhorst AJ, Moretti D and Geurts CPW (2021) Vibration Threshold Exceedances in the Groningen Building Vibration Monitoring Network. Front. Built Environ. 7:703247. doi: 10.3389/fbuil.2021.703247
Received: 30 April 2021; Accepted: 12 July 2021;
Published: 30 July 2021.
Edited by:
Hae Young Noh, Stanford University, United StatesReviewed by:
Shijia Pan, University of California, Merced, United StatesJonathon Fagert, Baldwin Wallace University, United States
Copyright © 2021 Bronkhorst, Moretti and Geurts. This is an open-access article distributed under the terms of the Creative Commons Attribution License (CC BY). The use, distribution or reproduction in other forums is permitted, provided the original author(s) and the copyright owner(s) are credited and that the original publication in this journal is cited, in accordance with accepted academic practice. No use, distribution or reproduction is permitted which does not comply with these terms.
*Correspondence: A. J. Bronkhorst, b2trZS5icm9ua2hvcnN0QHRuby5ubA==